
Submitted:
20 January 2026
Posted:
21 January 2026
You are already at the latest version
Abstract
Introduction: Despite improved health service accessibility, neonatal mortality in Ethiopia remains high at 33 per 1,000 live births. Thus, improving health facilities’ readiness across infrastructure, basic amenities, equipment, medications, laboratory services, Kangaroo Mother Care, infection prevention and control, staffing, and guidelines availability is critical for improving the quality of neonatal care and improving survival. Objective: To evaluate the readiness of Ethiopian hospitals to provide services to small and sick newborns. Methods: A cross-sectional study including 208 hospitals across four regions in Ethiopia in 2021–2024, prior to the phased implementation of the Saving Little Lives program. Data were collected using an adapted World Health Organization’s Service Availability and Readiness Assessment tool and are presented using composite scores. Results: The mean composite readiness score for the 208 hospitals for providing services to small and sick newborns in labour and delivery wards was 59%, with domain-specific scores of 47% for basic amenities, 56% for essential neonatal care, and 74% for newborn resuscitation. Significant variation was seen across hospital levels, and basic amenities were available in 68%, 49%, and 43%, essential neonatal care in 68%, 81%, and 71%, and newborn resuscitation in 68%, 66%, and 50% of referral, general, and primary hospitals, respectively. The mean composite readiness score to provide newborn care in the neonatal care units was 57%. Scores varied by hospital levels, with scores of 73%, 64%, and 50% for referral, general, and primary hospitals, respectively. Domain-specific scores were 63% for basic amenities, 65% for equipment, 67% for medications, 63% for laboratory services, 25% for Kangaroo Mother Care, 68% for infection prevention and control, 55% for staffing, and 51% for guidelines. Functional bCPAP machines were available in 14% of labour and delivery wards and in 35% of neonatal care units. Conclusion: There is a substantial gap in readiness to provide care for small and sick newborns, and significant variations across hospital levels. Immediate actions must be taken to address the observed gaps to reach the sustainable development goal of reducing neonatal mortality to at least 12 per 1,000 live births by 2030.
Keywords:
saving little lives program
; readiness
; newborn care services
1. Introduction
Neonatal mortality remains a critical global health challenge. In 2022, an estimated 4.9 million children under five years of age died, and 47% of these deaths occurred in the first 28 days of life. Sub-Saharan Africa accounts for 57% of under-five deaths and 46% of neonatal deaths. While overall under-five mortality has declined since 1990, the proportion of neonatal deaths increased from 41% in 2000 to 47% in 2022 [1]. According to the World Health Organization (WHO), an estimated 20 million infants are born with low birth weight (LBW) each year, and approximately 15 million are born preterm [2]. In 2020, an estimated 80% of neonatal deaths occurred among LBW infants, and nearly two-thirds of deaths were among those born prematurely [3].
Ethiopia has a high neonatal mortality rate of 33 per 1,000 live births, with approximately 107,000 neonatal deaths annually, accounting for 56% of under-five deaths [1,4]. Complications from prematurity are the leading cause, including respiratory distress syndrome (RDS) (45%), infections (30%), and birth asphyxia (14%) [5,6,7].
Although cause-specific neonatal mortality varies by geographical area, it is largely attributed to poor quality of care at birth and during the early neonatal period, estimated to contribute to 61% of neonatal deaths [7,8]. With high-quality health systems, it is estimated that one million newborn deaths can be prevented each year [6,7].
Therefore, improving both access to and quality of care is critical and requires actions to ensure neonatal survival [9,10]. The readiness of hospitals is an essential prerequisite for ensuring service quality, including infrastructure, basic amenities, equipment, medications, laboratory services, trained healthcare providers (HCPs), and guideline availability [11].
To address the stagnant neonatal mortality rate, Ethiopia has implemented key interventions such as establishing dedicated newborn wards, training HCPs, and establishing and equipping neonatal care units (NCUs) across different hospital levels. Referral hospitals are expected to offer specialized level 3 care, general hospitals to deliver level 2 care, and primary hospitals to provide basic level 1 care. All hospitals are required to have a Kangaroo Mother Care (KMC) ward for eligible preterm and LBW infants [12].
Despite improved service accessibility, persistent challenges such as uneven resource distribution, poor quality of care, low KMC coverage, low community care-seeking behaviour, and shortages of essential commodities and equipment at service delivery points remain key challenges contributing to the high neonatal mortality rate in Ethiopia.
Addressing these problems requires an understanding of national newborn care priorities, and comprehensive facility assessments need to be made to determine how to improve facility readiness, healthcare provider competencies, provider-patient interactions, and working environments [11,13].
From January 2021 to June 2024, the Ethiopian government with the support from the World Bank’s Global Financing Facility (GFF) implemented the Saving Little Lives (SLL) program, aiming to reduce neonatal deaths by 35% through achieving 80% coverage of evidence-based interventions targeting hospitalized preterm and LBW infants. The program’s success depended on the readiness and availability of functional health infrastructures, medical equipment, and medications as well as on the availability of adequate and trained healthcare providers in the hospitals to deliver quality neonatal care.
This study was conducted to assess the readiness of hospitals included in the program to provide care to small and sick newborns prior to the implementation of the SLL program and generate actionable information about the readiness and availability of neonatal care services in Ethiopia.
2. Materials and Methods
2.1. Study Design, Setting, and Inclusion Critieria
This facility-based cross-sectional study was part of the SLL program that aimed at reducing the neonatal mortality rate by 35% through achieving 80% coverage of evidence-based interventions.
The SLL program targeted 290 hospitals (206 primary, 69 general, and 15 referral hospitals) representing 82% of all hospitals in the country at the time of the study across four regions (Oromia, Amhara, Tigray, and Southern Nations, Nationalities, and People (SNNP)), covering a total population of estimated 76.2 million and 1.2 million births (34% of national births). These hospitals in the four regions were selected for SLL program implementation based on their high delivery volume, neonatal mortality rates, and alignment with government priorities.
Among the 290 hospitals, data were not collected from 82 hospitals due to security challenges at the time of the assessment, their remote locations, or resource constraints. Therefore, data from 208 hospitals of all levels across the four regions were included in the final analysis, including 22 referral, 56 general, and 130 primary hospitals.
The SLL program was designed to be implemented in three phases, each lasting a year. Data on the readiness of hospitals to provide care for small and sick newborns were collected prior to SLL implementation from March to May 2021, July to August 2022, and December 2023 to January 2024, including 72, 115, and 21 hospitals, respectively.
2.2. SLL Program Interventions
The SLL program was designed to implement evidence-based minimum care packages interventions to small and sick newborns, targeting the primary drivers of neonatal mortality: prematurity, asphyxia, and sepsis. Across the continuum of neonatal care, the SLL minimum care packages focused on care at birth in labour and delivery (L&D) wards, in the NCUs, and in the KMC ward.
The minimum care package at birth included birth preparation and essential newborn care, including resuscitation for asphyxiated infants, respiratory support for preterm infants, infection prevention and control (IPC), thermal care, early breastfeeding initiation, and timely safe referral. The NCU care package included IPC and sepsis management, the use of a bubble CPAP (bCPAP) for RDS, thermal care, feeding support, and management of perinatal asphyxia. The KMC package consisted of exclusive breastfeeding and skin-to-skin contact.
The SLL minimum care packages were cascaded through training and clinical mentorship to enhance HCPs` knowledge and skills. Additionally, hospitals received essential medical equipment and supplies as well as support for renovations or redesigns in L&D wards and NCUs in selected hospitals and implementation follow-up and supervision.
2.3. Variables
The readiness to provide services to small and sick newborns was assessed based on the availability of infrastructure with service delivery rooms in the L&D wards and NCUs, electric power, functional water hygiene and sanitation (WASH) infrastructure, basic amenities, equipment, medications, staffing, and guideline availability.
The variables assessed were the L&D wards and NCUs’ availability of items required for each domain of neonatal care. These included a total of 33 variables across three main domains related to neonatal care in the L&D wards, including 8 variables for basic amenities, 14 for neonatal resuscitation, and 11 for essential newborn care. In the NCUs, 108 variables for 8 domains were assessed, including 16 for basic amenities, 26 for basic equipment, 16 for essential medications, 14 for laboratory investigations, 11 for KMC, 11 for IPC, 6 for staffing – including trained nurses and general practitioners, paediatricians, and support staff (porters, cleaners, and security guards) – and 8 for guideline availability.
2.4. Data Collection
Prior to the implementation of SLL program interventions, data on hospitals’ readiness to provide care for small and sick newborns were collected by six to eight trained program research assistants in each region. The data collection process was supervised by SLL program evaluation coordinators and regional program managers.
Data collectors and supervisors received a two-day training on the data collection tool and methods. Data were gathered using an adapted WHO’s Service Availability and Readiness Assessment (SARA) tool through interviews with HCPs and unit heads, register reviews, and direct observations of infrastructure in the L&D wards and the NCUs, medical equipment, medications, handwashing facilities, and and guideline availability. The data were collected electronically via the Open Data Kit application, transferred to Excel, and thoroughly checked for completeness and accuracy, with corrections being made as needed.
2.5. Data Analysis
Data analysis was performed using STATA statistical software, version 17. All categorical variables were summarized using proportions and are presented in tables and graphs. For each item, an item score of 0 or 1 was assigned according to whether the item was available or not at a facility. Next, the percentage of facilities where the item was available was calculated. Readiness scores for each domain were computed as the mean percentage of the items within that domain. A composite readiness score was then calculated by aggregating the domain scores.
The overall readiness was calculated as the mean of the scores for each domain, thus giving equal weight to each of the three domains for the L&D wards and the eight domains for the NCUs. A comparison of item scores within domains across different levels of explanatory variables was conducted. Chi-square tests were used to test for the associations between categorical variables. A p-value of <0.05 was considered to indicate a statistically significant association.
3. Results
In total 208 public hospitals across all levels were included, 22 (11%) referral hospitals, 56 (27%) general hospitals, and 130 (63%) primary hospitals.
Readiness to provide small and sick newborn care in the L&D wards
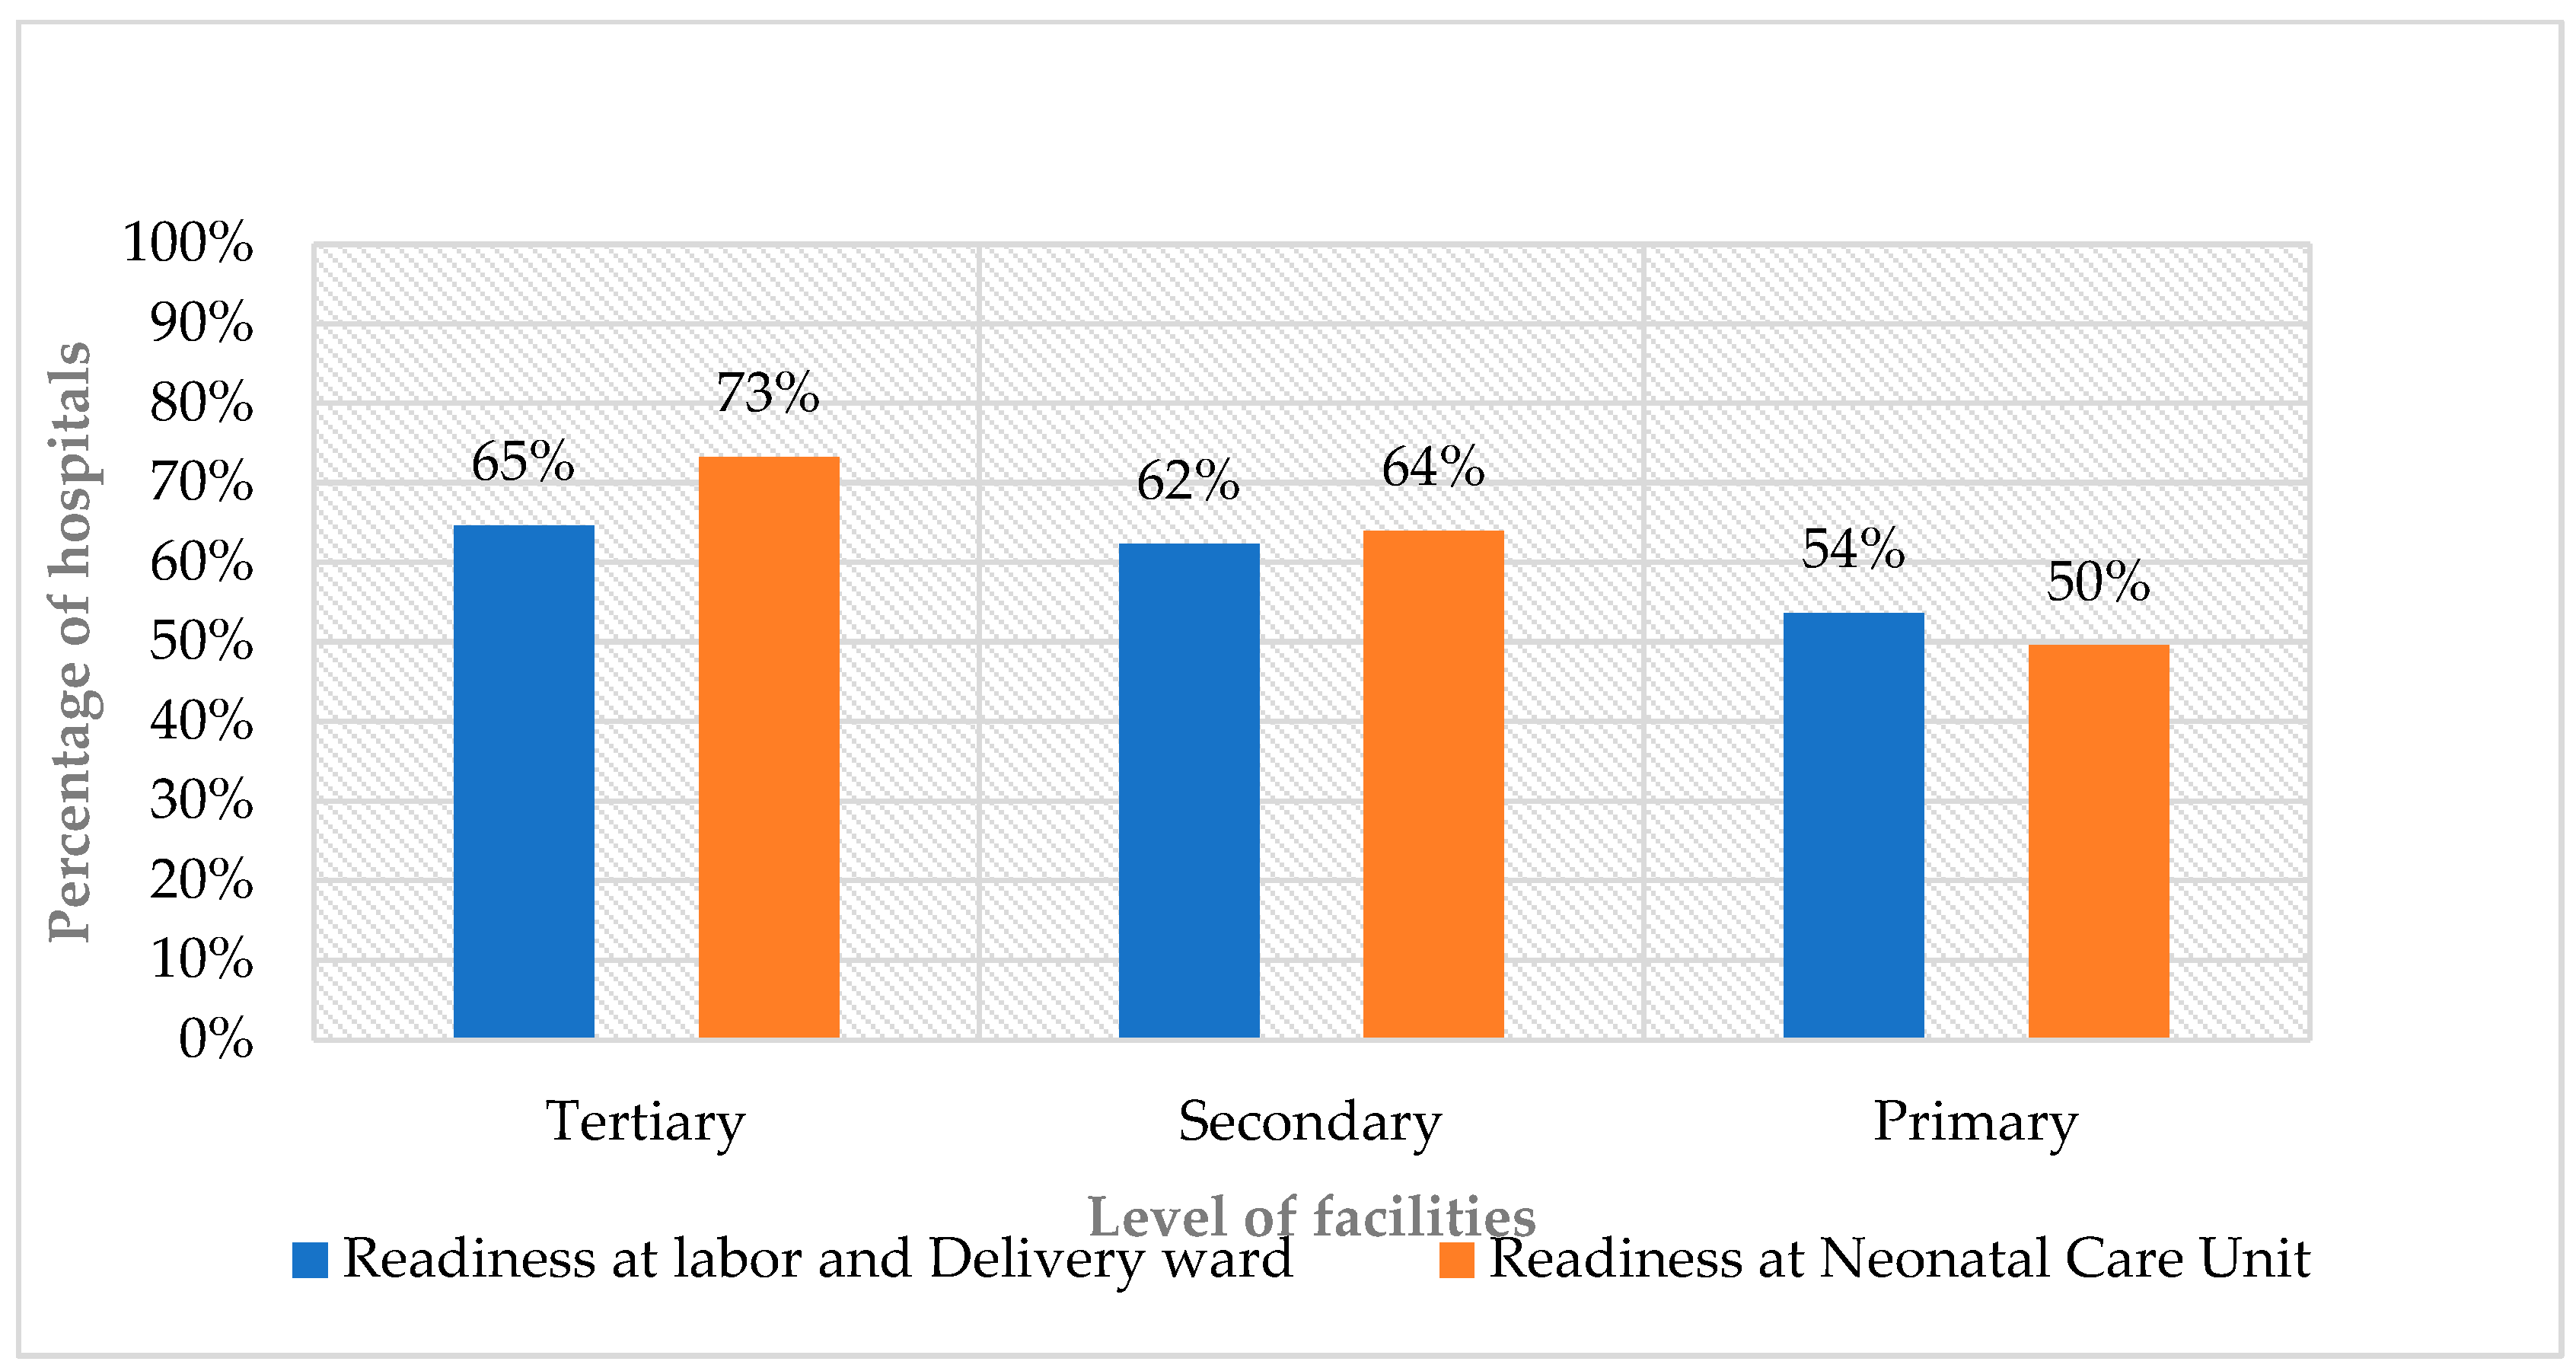
Readiness to provide small and sick neonatal care in L&D wards was 47% for basic amenities, 74% for essential newborn care, and 56% for neonatal resuscitation, with an overall mean readiness score of 59% (Figure 1). The overall mean readiness score varied by hospital levels, and referral hospitals scored 65%, general hospitals 62%, and primary hospitals 54% (Figure 2).
The readiness of L&D wards for basic amenities varied by hospital level, with scores of 68% in referral hospitals, 49% in general hospitals, and 43% in primary hospitals. For essential newborn care, the readiness scores were 68% in referral hospitals, 81% in general hospitals, and 71% in primary hospitals. Approximately 70% of referral and general hospitals were equipped for neonatal resuscitation, while only 50% of primary hospitals (Table 1, Table 4 and Table 5).
Readiness to provide small and sick newborn care in NCUs
The readiness for small and sick neonatal care in NCUs was measured across eight domains, including amenities (63%), basic equipment (65%), essential medications (67%), laboratory investigations (63%), KMC (25%), IPC (68%), staffing (55%), and guideline availability (51%). The overall readiness score was 57% (Figure 1) and varied by hospital level: referral hospitals scored 73%, general hospitals 64%, and primary hospitals 50% (Figure 2).
Figure 1.
Mean readiness scores by key domains in L&D wards and NCUs.
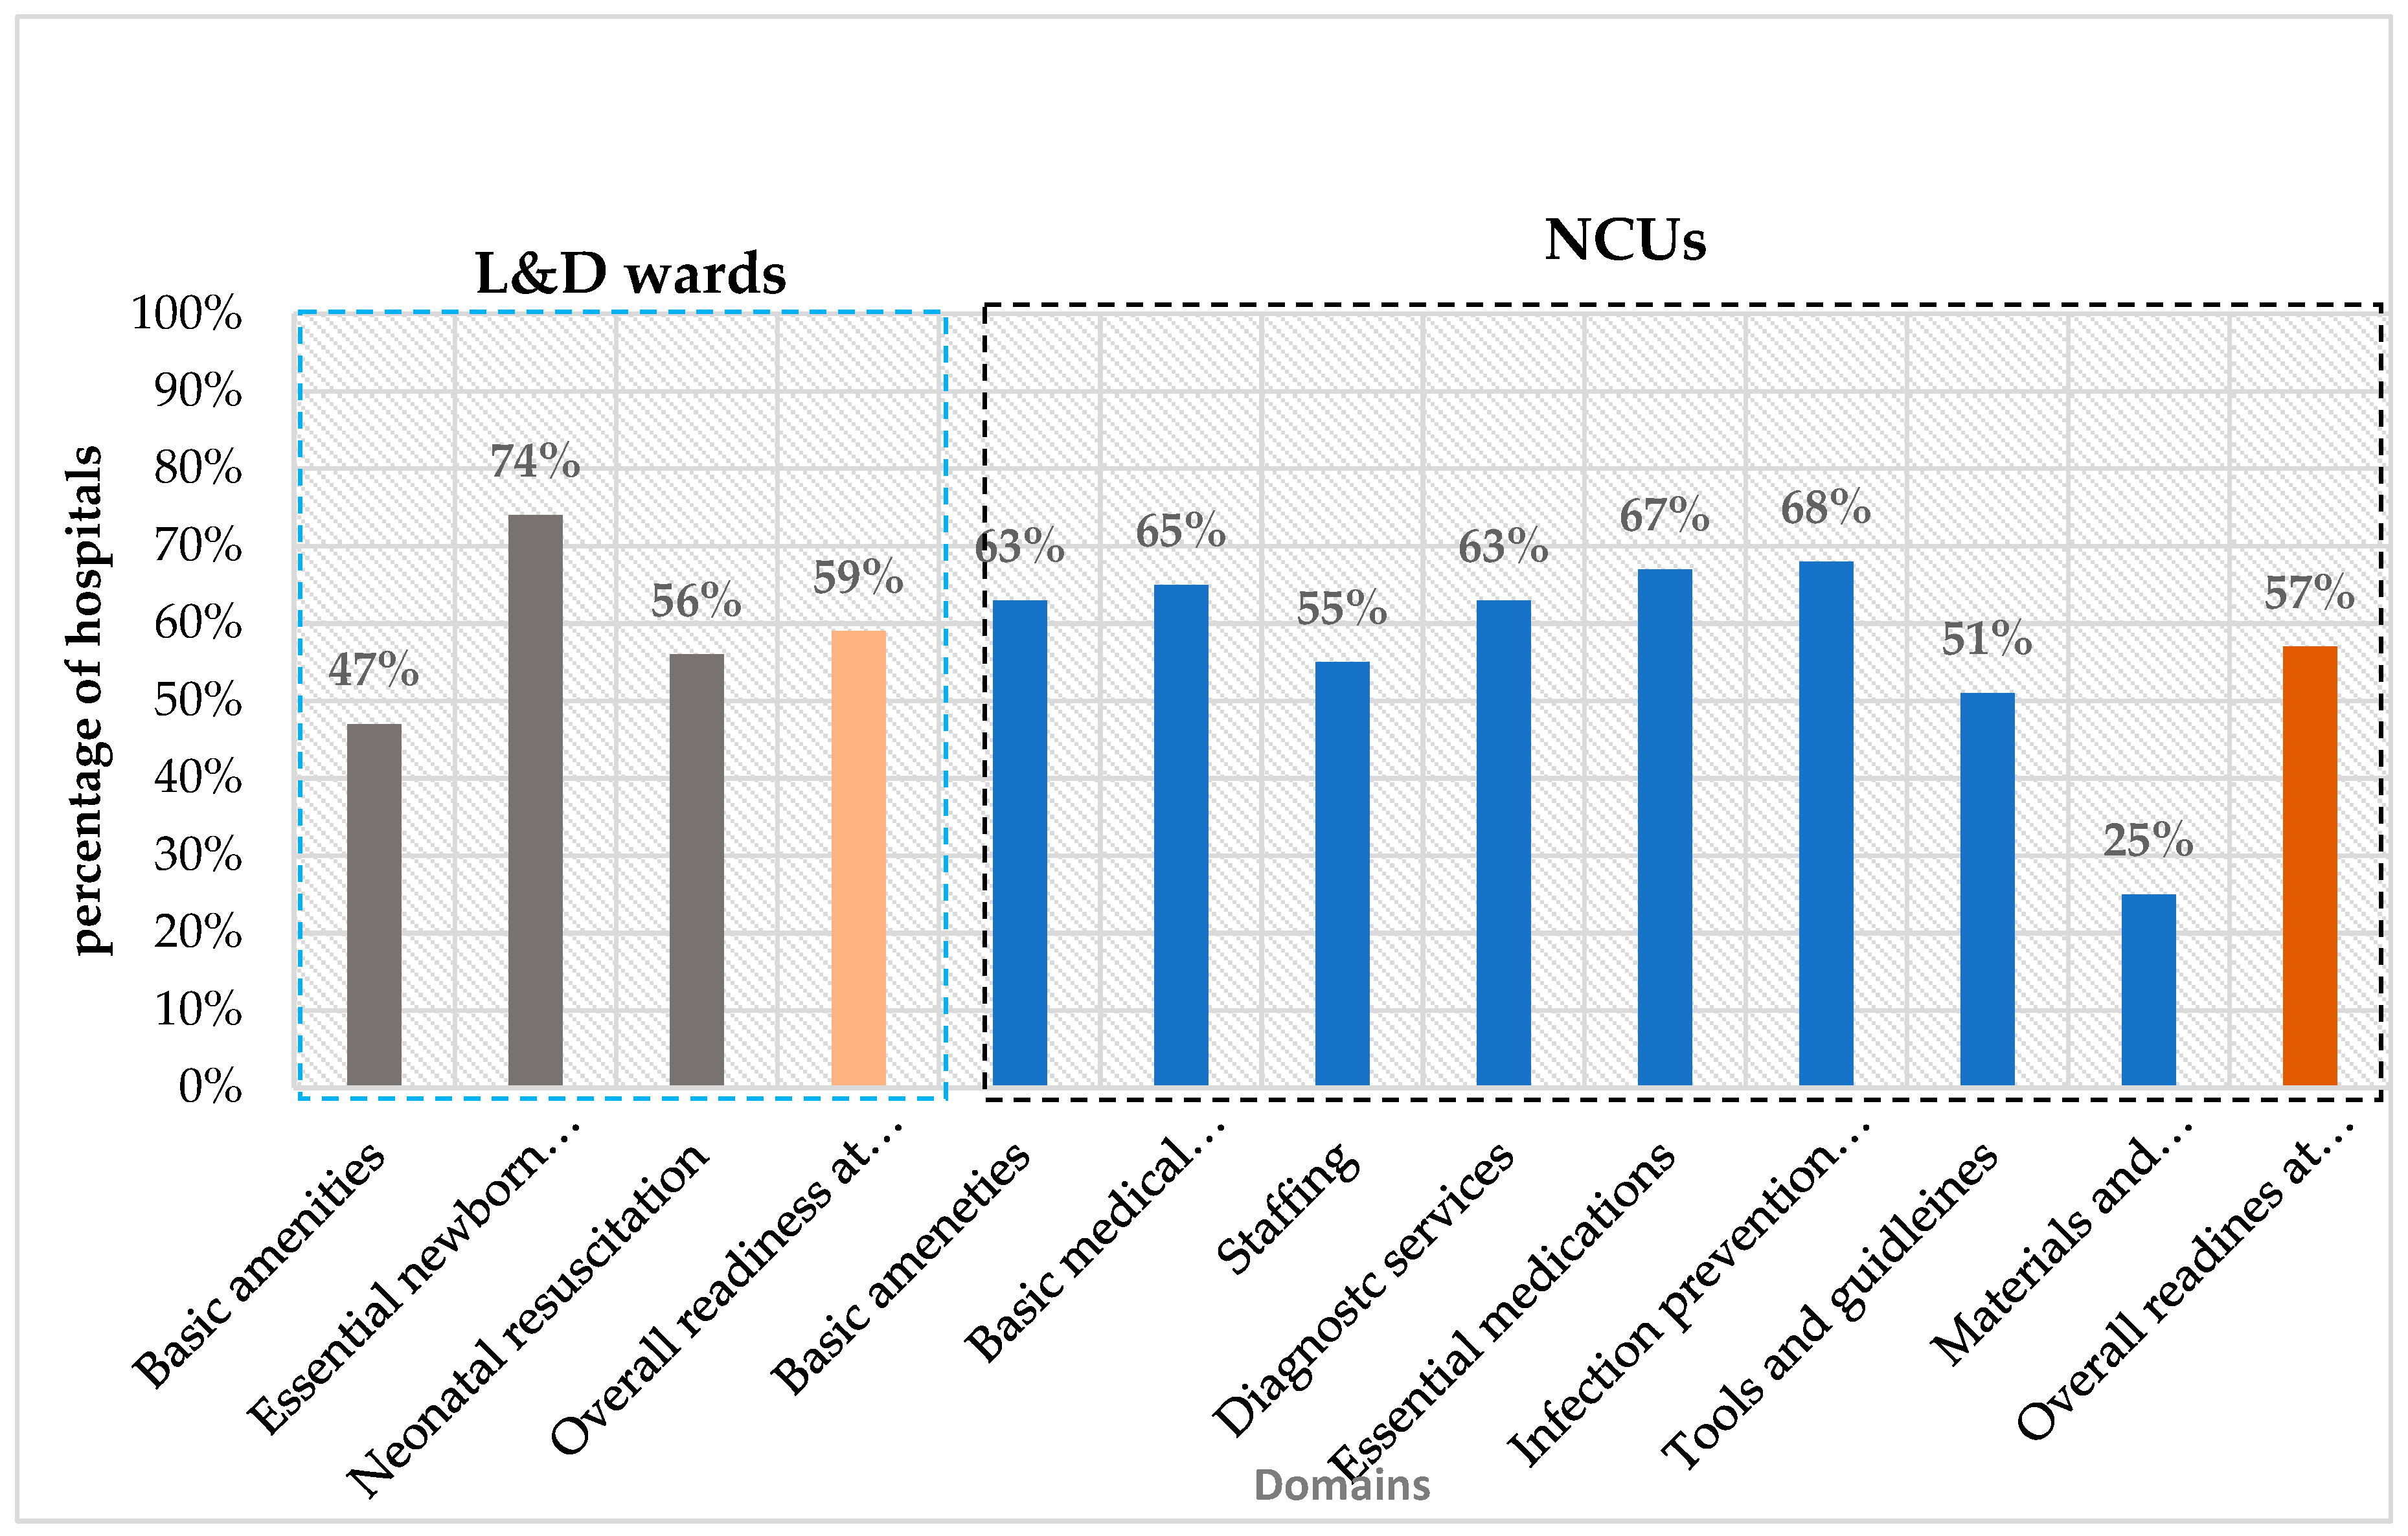
Figure 2.
Readiness scores in L&D wards and NCUs by hospital level.
Availability of basic amenities in the L&D wards and NCUs
Functional handwashing facilities were available in 64 (32%) of the prenatal rooms, 105 (50%) of the delivery rooms, 46 (23%) of the postnatal rooms, and 113 (55%) of the NCUs of the assessed hospitals (p<0.05). Functional toilets with showers near the units were available in 106 (51%) of the L&D wards and in 83 (40%) of the NCUs.
Uninterrupted power supply was available in 124 (59%) of L&D wards and 100 (48%) of the NCUs. In the event of a power outage from the national grid, a backup power source was present in 127 (61%) of the hospitals (p<0.05). Uninterrupted water supply was available in only 74 (36%) of the hospitals.
There was a variation in the mean readiness scores for basic amenities across hospital levels in L&D wards and NCUs. In L&D wards, referral hospitals had a mean basic amenities readiness score of 67%, general hospitals 48%, and primary hospitals 46%. In NCUs, referral hospitals had a readiness score of 77%, general hospitals 65%, and primary hospitals 57% (Table 2 and Table 3).

Table 2.
Availability of basic amenities in NCUs by hospital level.
| Tertiary | General | Primary | Overall | p-value | |||||
|---|---|---|---|---|---|---|---|---|---|
| Variables | n | n (%) | n | n (%) | n | n (%) | n | n (%) | |
| Separate space for NCU | 22 | 22 (100) | 56 | 56 (100) | 130 | 127 (98) | 208 | 205 (99) | 0.40 |
| NCU is located adjacent to delivery room | 21 | 11 (52) | 51 | 29 (57) | 123 | 110 (89) | 195 | 150 (77) | 0.00 |
| Direct access to transport receiving area | 17 | 13 (76) | 34 | 19 (56) | 17 | 14 (82) | 68 | 46 (68) | 0.11 |
| Rooms for critical, sub-critical, and stable cases | 21 | 18 (86) | 45 | 27 (60) | 51 | 24 (47) | 117 | 69 (59) | 0.01 |
| Triaging room | 21 | 18 (86) | 51 | 22 (43) | 42 | 5 (12) | 114 | 45 (39) | 0.00 |
| Procedure room | 13 | 10 (76) | 43 | 22 (51) | 16 | 5 (31) | 72 | 37 (51) | 0.05 |
| IV drugs and fluid preparation area | 22 | 18 (82) | 56 | 42 (75) | 130 | 92 (71) | 208 | 152 (73) | 0.52 |
| Gowning area at the entrance | 21 | 15 (71) | 48 | 32 (67) | 94 | 60 (64) | 163 | 107 (66) | 0.79 |
| Nurses station/staff work area | 22 | 15 (68) | 54 | 39 (72) | 122 | 94 (77) | 198 | 148 (75) | 0.59 |
| Workspace for doctor/nurse on duty | 22 | 18 (82) | 56 | 37 (66) | 65 | 36 (55) | 143 | 91 (64) | 0.07 |
| One or two rooms with 4–6 maternal beds | 21 | 16 (76) | 51 | 33 (65) | 79 | 23 (29) | 151 | 72 (48) | 0.00 |
| Uninterrupted water supply in each room | 22 | 13 (59) | 56 | 31 (55) | 130 | 30 (23) | 208 | 74 (36) | 0.00 |
| Functional hand washing facilities | 22 | 17 (77) | 54 | 40 (74) | 130 | 56 (43) | 206 | 113 (55) | 0.00 |
| Toilet and shower area | 22 | 15 (68) | 55 | 18 (33) | 130 | 50 (38) | 207 | 83 (40) | 0.01 |
| Uninterrupted 24 h stabilized power supply | 22 | 17 (77) | 56 | 41 (73) | 66 (51) | 208 | 124 (60) | 0.00 | |
| 24 h service availability | 22 | 22 (100) | 54 | 50 (93) | 130 | 127 (98) | 206 | 199 (97) | 0.14 |
| Mean readiness score | 77 | 65 | 57 | 63 | |||||
Table 4.
Availability of basic supplies and equipment for essential newborn care at the L&D ward by hospital level.
Table 4.
Availability of basic supplies and equipment for essential newborn care at the L&D ward by hospital level.
| Tertiary | General | Primary | Overall | p-value | ||||||
|---|---|---|---|---|---|---|---|---|---|---|
| Variables | n | n (%) | n | n (%) | n | n (%) | n | n (%) | ||
| Vitamin K | 22 | 19 (86) | 56 | 51 (91) | 130 | 108 (83) | 208 | 178 (86) | 0.36 | |
| TTC eye ointment | 22 | 19 (86) | 56 | 51 (91) | 130 | 116 (89) | 208 | 186 (89) | 0.82 | |
| Chlorhexidine 4% gel | 21 | 14 (67) | 51 | 34 (67) | 126 | 85 (67) | 198 | 133 (67) | 0.99 | |
| Baby weighing scale | 17 | 16 (94) | 51 | 49 (96) | 123 | 119 (97) | 191 | 184 (96) | 0.85 | |
| Sterile scissors and/or blades | 17 | 16 (94) | 27 | 27(100) | 81 | 81 (100) | 125 | 124 (99) | 0.04 | |
| Umbilical cord clamp | 17 | 15 (88) | 27 | 26 (96) | 81 | 77 (95) | 125 | 118 (94) | 0.48 | |
| Clean blankets, towels, and linens | 17 | 3 (18) | 27 | 15 (56) | 81 | 38 (47) | 125 | 56 (45) | 0.03 | |
| Wall clock | 22 | 9 (41) | 55 | 37 (67) | 127 | 46 (36) | 204 | 92 (45) | 0.00 | |
| Measuring tape | 18 | 10 (56) | 52 | 39 (75) | 119 | 60 (50) | 189 | 109 (58) | 0.01 | |
| Stethoscope | 20 | 17 (85) | 50 | 42 (84) | 100 | 63 (63) | 170 | 122 (72) | 0.01 | |
| Baby crib | 7 | 2 (29) | 39 | 28 (72) | 91 | 49 (54) | 137 | 79 (58) | 0.04 | |
| Mean readiness score | 68 | 81 | 71 | 74 | ||||||
Availability of supplies and equipment for essential newborn care
The readiness scores for essential newborn care also varied by hospital level, with referral hospitals scoring 68%, general hospitals 81%, and primary hospitals 71%. The overall mean readiness score of all the hospital levels was 74% (Table 4).
Availability of equipment and supplies for newborn resuscitation
Approximately 90% of hospitals had designated places for neonatal resuscitation. However, only about 56% of hospitals fulfilled basic neonatal resuscitation equipment and supplies. Specifically, only 86 (47%) of the hospitals had neonatal-sized bags and masks, 43 (35%) had self-inflating bags and masks, 68 (54%) had mucus extractors, 66 (47%) had functional oxygen tubing, and 66 (47%) had functional pulse oximeters (p<0.05).
Additionally, standard and/or home-grown bCPAP was available in only 16 (14%) of the hospitals within their L&D wards (p<0.01). The mean readiness score for neonatal resuscitation differed by hospital level and was 68% in referral hospitals, 66% in general hospitals, and 50% in primary hospitals (Table 5).
Table 5.
Neonatal resuscitation space, equipment, and supply availability overall and by hospital level in L&D wards.
Table 5.
Neonatal resuscitation space, equipment, and supply availability overall and by hospital level in L&D wards.
| Variables | Referral | General | Primary | Overall | p-value | ||||
|---|---|---|---|---|---|---|---|---|---|
| n | n (%) | n | n (%) | n | n (%) | n | n (%) | ||
| Space/corner | 22 | 20 (91) | 56 | 51 (91) | 130 | 115 (88) | 208 | 186 (89) | 0.84 |
| Warmer | 18 | 15 (83) | 38 | 29 (76) | 83 | 72 (87) | 139 | 116 (83) | 0.36 |
| Suction pump (electrical) | 21 | 10 (48) | 42 | 26 (62) | 93 | 38 (41) | 156 | 74 (47) | 0.08 |
| Suction pump (manual) | 22 | 20 (91) | 55 | 44 (80) | 129 | 96 (74) | 206 | 160 (78) | 0.20 |
| Functional oxygen cylinder | 16 | 16 (100) | 27 | 20 (74) | 81 | 51(63) | 124 | 87 (70) | 0.01 |
| Functional oxygen concentrator | 16 | 9 (56) | 52 | 45 (87) | 118 | 83 (70) | 186 | 137 (74) | 0.02 |
| bCPAP machine and/or indigenous | 16 | 5 (31) | 27 | 10 (37) | 75 | 1 (1) | 118 | 16 (14) | 0.00 |
| Neonatal size bag, self-inflating | 22 | 13 (59) | 56 | 38 (68) | 104 | 35 (34) | 182 | 86 (47) | 0.00 |
| Neonatal size face masks (size 0-1) | 16 | 14 (88) | 28 | 25 (89) | 56 | 43 (77) | 100 | 82 (82) | 0.31 |
| Nasal prongs, 1 mm and 2 mm | 17 | 10 (59) | 27 | 16 (59) | 87 | 37 (43) | 131 | 63 (48) | 0.20 |
| Laryngoscope, neonatal size | 12 | 4 (33) | 11 | 2 (18) | 59 | 7 (12) | 82 | 13 (16) | 0.17 |
| Mucus extractor | 16 | 11 (69) | 27 | 16 (59) | 79 | 16 (20) | 122 | 43 (35) | 0.00 |
| Oxygen tubing | 17 | 11 (65) | 28 | 20 (71) | 81 | 37 (46) | 126 | 68 (54) | 0.04 |
| Functional pulse oximeter | 17 | 13 (76) | 28 | 14 (50) | 96 | 39 (41) | 141 | 66 (47) | 0.02 |
| Mean readiness score | 68 | 66 | 50 | 56 | |||||
Readiness for newborn care in NCUs
Infrastructure: Nearly all 205 (99%) of the hospitals had designated spaces for NCUs in the hospitals. However, only 69 (59%) of the hospitals had separate rooms dedicated for critically ill, sub-critically ill, and stable infants. The availability of separate rooms in the NCUs varied by hospital level, and 86% of referral hospitals had dedicated spaces for critically ill, sub-critically ill, and stable infants compared to 60% of general hospitals and 47% of primary hospitals (p<0.05).
In addition, most hospitals lacked dedicated rooms within the NCU for triage procedures and did not have an adequate number of beds for mothers (p<0.05) (Table 2).
Availability of medical equipment and supplies in NCUs
The overall availability of basic equipment in NCUs was 65%, with wide variation across facility levels: 81% in referral hospitals, 74% in general hospitals, and 59% in primary hospitals. Only 72 (35%) of NCUs had functional bCPAP devices, with availability being the highest in referral hospitals 17 (77%), followed by general hospitals 27 (49%), and primary hospitals 28 (22%) (p<0.05). Less than half of the hospitals 89 (43%) had room thermometers, with approximately 60% of referral and general hospitals compared to only 44 (34%) of primary hospitals.
Additionally, the availability of other essential equipment varied, and room warmers were present in 144 (73%) of hospitals’ NCUs, phototherapy machines in 148 (72%), digital weighing scales in 139 (67%), electrical suction pumps in 107 (53%), pulse oximeters in 156 (75%), and bag-mask self-inflating resuscitators in 122 (60%), p < 0.05 (Table 6).
Staffing at NCUs
The majority 188 (90%) of NCUs had nurses trained in neonatal intensive care. Paediatricians were available in 54 (40%) of hospitals, while trained general practitioners were present in 107 (54%) of hospitals. The availability of paediatricians varied significantly by facility level, 95% of referral hospitals, 55% of general hospitals, and only 6% of primary hospitals. The mean readiness score for the availability of key NCU staffing varied by facility level and was 79% in referral hospitals, 56% in general hospitals, and 47% in primary hospitals, with an overall mean of 55% (Table 7).
Availability of essential medications
A total of 16 essential medications across seven categories were assessed, including antimicrobials, neurologic, inotropes, bronchodilators, corticosteroids, vitamin K, and intravenous infusions for treating small and sick newborns. No health facility reported a complete stock of all 16 medications. The overall readiness score for essential medications was 67%.
More than 90% of hospitals had essential antibiotics such as ampicillin, gentamycin, and ceftriaxone and intravenous fluids and antiseptics, but fewer than half stocked ceftazidime, ciprofloxacin, intravenous azithromycin, or vancomycin.
First-line antimicrobials like ampicillin, gentamicin, and cloxacillin were available in 80% of referral hospitals, 82% of general hospitals, and 81% of primary hospitals. In contrast, second-line drugs were available in only 47% of referral hospitals, 54% of general hospitals, and 33% of primary hospitals. The readiness for essential medications varied across hospital levels at 74% for referral hospitals, 74% for general hospitals, and 61% for primary hospitals (Table 8).
Availability of basic diagnostic services
More than two-thirds of the hospitals surveyed could perform essential laboratory tests, including random blood sugar, blood grouping and Rhesus factor, urine analysis, stool examination, and ultrasound. In contrast, fewer than a quarter could perform culture and sensitivity testing, and only 35% offered bilirubin testing or blood morphology assessments.
The mean readiness for laboratory investigations was lower in primary hospitals compared to general and referral hospitals. The overall mean readiness score for laboratory investigations across all studied hospitals was 63% (Table 9).
Infection Prevention and Control supplies
The overall mean readiness score for IPC in the NCUs was 68%. The availability of IPC supplies in NCUs varied across hospitals, and IPC readiness was lower in primary hospitals than in general and referral hospitals. Although alcohol-based hand sanitizers were available in 117 (94%) of the hospitals, the availability of functional handwashing stations differed significantly by facility level at 77% in referral hospitals, 74% in general hospitals, and only 43% in primary hospitals. This disparity highlights the inequitable distribution of basic IPC infrastructure, particularly in lower-level hospitals, which may compromise newborn care and increase the risk of healthcare-associated infections.
Additionally, 91 (74%) of the hospitals had adequate antiseptic solutions, including 7% chlorhexidine, ethanol, povidone-iodine, and disinfectants. Sterile gloves and puncture-proof sharps containers were available in more than three-quarters of the hospitals studied (See Table 10).
Availability of guidelines in the NCU
The presence of guidelines varied by guideline type and facility level. Neonatal logbooks were mostly available in 187 (94%) hospitals followed by NCU training guidelines. The IPC national manual, KMC registers, the KMC flow chart/patient chart, feeding and weight charts, preterm care registration books, and preterm care counselling chart booklets were available in fewer than half of the hospitals. The mean readiness for guidelines and tools was 51% at the NCUs of the studied hospitals (Table 11).
Availability of materials and supplies for KMC provision
In this study, nearly three-fourths (72%) of the hospitals had designated rooms for KMC. However, among hospitals with KMC rooms, only 31 (16%) had KMC wraps and only 17 (9%) had gowns for mothers (p<0.05). Comfortable chairs were available in 29 (14%) of the hospitals, and reclining beds with privacy curtains were available in 106 (51%) of the hospitals. Additionally, only 16 (8%) of hospitals had televisions to educate mothers on KMC.
The overall readiness for KMC was found to be very low across all facility levels, with a mean readiness score of 25%, with referral hospitals scoring 43%, general hospitals 26%, and primary hospitals 15% (Table 11).
Table 11.
Availability of materials and supplies for KMC service by hospital level.
| Referral | General | Primary | Overall | ||||||
|---|---|---|---|---|---|---|---|---|---|
| Items | n | n (%) | n | n (%) | n | n (%) | n | n (%) | p-value |
| Dedicated space for KMC | 21 | 20 (95) | 51 | 35 (67) | 126 | 88(70) | 198 | 143(72) | 0.04 |
| KMC wraps | 21 | 5 (24) | 51 | 9 (18) | 126 | 17(13) | 198 | 31 (16) | 0.44 |
| Gowns for mothers | 21 | 5 (24) | 51 | 2 (4) | 126 | 10(8) | 198 | 17 (9) | 0.02 |
| TV for health education | 21 | 7 (33) | 51 | 2 (2) | 126 | 7(6) | 198 | 16 (8) | 0.00 |
| Reclining beds with curtains | 22 | 16 (73) | 56 | 28 (50) | 130 | 62(48) | 208 | 106 (51) | 0.09 |
| Comfortable chairs | 22 | 7 (31) | 56 | 6 (11) | 129 | 16 (12) | 207 | 29 (14) | 0.04 |
| Cabinets for mothers/bed side | 22 | 9 (40) | 56 | 15 (27) | 130 | 19 (15) | 208 | 43 (21) | 0.01 |
| Refrigerator | 21 | 9 (43) | 51 | 7 (14) | 126 | 8 (6) | 198 | 24 (12) | 0.00 |
| Room warmer | 21 | 8 (38) | 51 | 23 (45) | 111 | 32 (29) | 198 | 63 (34) | 0.12 |
| Food for mothers | 21 | 16 (76) | 45 | 21 (47) | 111 | 25 (23) | 177 | 62 (35) | 0.00 |
| Mean score | 43 | 26 | 15 | 25 | |||||
4. Discussion
In Ethiopia, neonatal mortality remains high, indicating the urgent need for access to good quality care for all and specialized care for small and sick newborns [15,16]. Therefore, this study was conducted to assess the readiness of 208 public hospitals to provide care across the continuum from L&D wards to NCUs. There were significant deficits in readiness both in the L&D wards and NCUs, with an overall composite readiness score of 59% in L&D wards and 57% in NCUs. Significant variations in neonatal care readiness were observed across hospital levels, with the lowest readiness in primary hospitals.
Basic amenities in L&D wards and NCUs
Forty seven percent of the hospitals had key basic amenities for newborn care in the L&D wards, and this varied by hospital level, ranging from 68% in referral hospitals to 43% in primary hospitals. This contrasts with findings from Asia and Sub-Saharan Africa, where infrastructure was reported to be more consistently available [17]. WASH is essential for proper IPC practices in preventing neonatal infections; however, many hospitals lacked functional WASH facilities, which negatively affected the implementation of IPC measures [18,19]. Lack of an available water supply hampered hand hygiene, instrument cleaning, service delivery, and overall clinical safety [20]. This study showed that most hospitals, across all levels of care, lacked continuous water supplies in L&D wards and NCUs, thus contributing for poor hand hygiene practice and overall IPC measures. This finding is consistent with the Ethiopian service provision assessment, which reported that only about two-thirds of facilities had a continuous water supply, and these findings are supported by other studies [19,20,21,22,23,24].
In the current study, only half of the hospitals had uninterrupted electricity, with frequent and prolonged outages, particularly in primary hospitals. Such power disruptions can be can negatively affect sick and small newborns health care service, leading to severe neonatal health complications or death. Comparable findings have been reported in other studies in Ethiopia and in several other Sub-Saharan African countries, where power interruptions remain a persistent barrier to safe neonatal care [24,25,26,27,47]. In contrast, studies from South Asia, including Pakistan and India, showed more consistent electric power supply in higher-level hospitals, although rural and peripheral facilities continued to face challenges [28,29,30].
Readiness for essential newborn care and respiratory support
Regarding hospitals’ readiness for essential newborn care, the mean domain-specific readiness scores indicated that about three-quarters of hospitals were well prepared. This was higher than what was seen in a multi-country study in Sub-Saharan Africa, where only about two-thirds of the hospitals were prepared for neonatal resuscitation, and was higher compared to a study showing that fewer than half of public health facilities in Afghanistan had essential supplies [14,17].
Hospitals are expected to have a dedicated space for neonatal resuscitation and to be fully equipped with essential devices and supplies [31]. In this study, although nearly 90% of the hospitals had designated functional resuscitation corners, none were fully equipped with the complete set of recommended devices and materials. This finding aligns with other studies from low- and middle-income countries and in a study done on the quality of neonatal resuscitation in Ethiopia showed that only half of health facilities were adequately prepared for neonatal resuscitation in terms of essential equipment [34,35]. Similarly, a facility audit in southern Nigeria reported significant gaps in basic resuscitation devices [36]. These gaps emphasize the need to equip health facilities with the basic devices needed to support newborns with respiratory problems and to improve neonatal outcomes.
Almost 10% of newborns and a large proportion of preterm infants cannot breathe spontaneously at birth and require bag-mask ventilation [37]. However, we found that basic equipment for bag-mask ventilation was lacking in half of the hospitals studied. This finding contrasts with studies from Kenya and Tanzania, which reported that more than 70% of hospitals had neonatal bags and masks [38,39].
The WHO recommends the use of bCPAP for preterm newborns with signs of RDS and for all infants born before 32 weeks of gestation [31]. Nearly 11% of newborns in Ethiopia are born preterm, and many require respiratory support with bCPAP to improve survival [40]. However, we found that only 14% of L&D wards and 35% of NCUs had either standard or improvised bCPAP machines. In contrast, the findings of Kenyan facilities reported that all surveyed hospitals had bCPAP devices, indicating a substantial disparity in the availability of this essential technology across clinical settings [42].
Readiness regarding amenities, equipment, and drugs in NCUs
Effective neonatal care in NCUs requires adequate equipment and supplies as well as skilled HCPs [17,45]. Our findings showed significant readiness gaps across all domains, with an overall readiness score of about 60%. Although two-thirds of hospitals had basic amenities, medicines, equipment, lab tests, and IPC supplies, only half had the required staffing and guidelines. Similar gaps in neonatal readiness have been reported in other studies conducted in Ethiopia, Nigeria, Tanzania, Uganda, and India, especially in lower-level hospitals [36,38,39,51].
Regarding the availability of equipment in NCUs, no facility had all the required basic equipment in NCUs, and overall, nearly two thirds of hospitals were well equipped with NCU beds, radiant warmers, room warmers, oxygen cylinders, portable electrical suction pumps, oxygen concentrators, digital thermometers, and pulse oximeters. These findings contrast with studies from Pakistan and Sub-Saharan Africa reporting higher levels of readiness [41]. Compared to another study from Ethiopia, where nearly one quarter of the hospitals met the standards, there has been some progress at higher levels, though overall preparedness remains suboptimal. In the current study, nearly two-thirds of hospitals had phototherapy machines and 92% had functional radiant warmers. In contrast, a study from Pakistan showed a higher phototherapy availability (91%) but lower warmer availability (70%) [32,40].
The availability of essential drugs is critical for managing infections and for saving sick newborns. However, our study identified significant gaps across hospitals, with none reporting the availability of all 16 assessed drugs, including antimicrobials, neurologic agents, inotropes, bronchodilators, corticosteroids, vitamin K, and IV infusions at the time of the study. These findings are consistent with studies from Pakistan and Ethiopia [41,50]. Approximately four-fifths of hospitals had first-line antimicrobials, including ampicillin, gentamicin, and cloxacillin. However, second-line drugs such as ceftriaxone, ceftazidime, ciprofloxacin, IV azithromycin, and vancomycin were available in only 33–54% of hospitals. Similar shortages have been reported in the findings from studies in Kenya and India, indicating widespread challenges in ensuring access to essential medications for newborns [42,43].
Regarding the readiness of hospitals to perform laboratory investigations, our findings showed that two third of the hospitals had basic laboratory services. Readiness levels varied by facility type, ranging from 74% in referral hospitals to 58% in primary hospitals. The readiness of primary hospitals in our study was comparable to findings from similar study done on the readiness of primary hospitals in providing neonatal intensive care services in Ethiopia, which reported 65% readiness for different laboratory services. Similar trends were also observed in studies conducted across Asia and Sub-Saharan Africa [31,41].
KMC
Despite the WHO’s strong recommendation of KMC for preterm and LBW infants and the need for adequate infrastructure and resources [33,44,45], most hospitals in our study showed low readiness. Only three-quarters had dedicated KMC rooms, and just a quarter of hospitals were equipped with essential materials and supplies for KMC. Similar gaps have been reported in other Ethiopian studies [41,47,48,51].
Human resources
Trained nurses were available in nearly all studied hospitals, indicating relatively greater readiness compared to another Ethiopian study, where only 65% of hospitals had trained neonatal HCPs [16]. Despite overall staffing shortages, this suggests the increased availability of trained nurses in NCUs.
Paediatricians play a key role in neonatal care and help train and guide other staff. However, in our study fewer than half of the hospitals had paediatricians on their staffing, with most being based in referral hospitals, which contrasts with findings from Pakistan, where all hospitals reported having paediatricians, [17] and aligns with another Ethiopian study on health system readiness for preterm, LBW, and sick newborn care [44].
Infection prevention and control
Evidence indicates that effective IPC measures can reduce healthcare-associated infections by up to 55%, and newborn survival rates can potentially increase by 44% when hand washing and clean birthing kits are in place [20]. The WHO recommends that all health facilities should follow minimum IPC standards at the point of care, including continuous water supply, hand hygiene supplies, disinfectants, proper waste management, and adequate space for IPC practices [51]. However, only about 70% of the hospitals in this study had the necessary IPC supplies. Furthermore, only about half of the hospitals had functional handwashing facilities and only around 75% had essential antiseptics and disinfectants. These findings align with a WHO multi-country assessment showing that, despite the availability of basic IPC supplies, infrastructural limitations limited their use in neonatal care settings [24,51].
5. Conclusions
Despite improvements in recent years, we found many gaps in critical readiness domains in L&D wards and NCUs. The government and partners along with other stakeholders must collaborate to ensure the consistent availability of sufficient amenities, equipment, essential diagnostic and treatment commodities, staffing, and guidelines for high-quality newborn care at all hospital levels.
Moreover, we highly recommend regular readiness assessments of hospitals for neonatal care to ensure early gap identification and evidence-based solutions to enhance the quality of newborn care and thus improve survival outcome for preterm and LBW infants.
Author Contributions
L.A.E. is the corresponding author of this study. L.A.E., S.I.R., H.L.E., D.H.M., J.N.C., A.S.E. A.A.M., M.S.A and A.G.A were involved in the conceptualization and methodology, L.A.E., S.I.R. analysis and writing, A.D.A and Z.H.K contributed to reviewing the study, S.I.R., H.L.E., D.H.M., and J.N.C. supervised each step of the manuscript. All authors critically reviewed the first draft and approved the final draft.
Funding
The study was funded by the Laerdal Foundation through the Embedded Doctoral Training Program and utilized data generated through the SLL program in Ethiopia (SPH/126/15) which was funded by the Global Financing Facility (GFF). The funding agency has no role in conceptualization, design, and decisions to prepare or publish this study.
Institutional Review Board Statement
Ethical clearance was obtained from Addis Ababa University College of Health Science Institutional Review Board (IRB) with reference number IRB 051/21SPH.
Informed Consent Statement
Each hospital leader and the responsible heads of the relevant hospital units—including the NCUs, L&D wards, pharmacy, and laboratory units—were provided with a support letter from the respective Regional Health Bureaus, along with a copy of the ethical clearance letter from the AAU Institutional Review Board (IRB). Informed consent was requested and obtained from all participants prior to conducting the interviews. Interviews were carried out in settings that ensured both auditory and visual privacy. All data were kept confidential and were accessible only to members of the study team.
Data availability statement
Data are available on reasonable request.
Acknowledgements
The authors thank the Laerdal Foundation for financial support, the SLL program implementation team for facilitating and leading data collection and who has contributed to the conception and design of this readiness assessment, and the health workers who provided essential facility data.
Conflicts of interest
The authors declare no conflicts of interest. The funders had no role or influence in the design of the study, data collection, analysis, interpretation of the results, manuscript writing, or decision to publish the results.
Abbreviations
| bCPAP | Bubble continuous positive airway pressure |
| HCPs | Health care providers |
| IPC | Infection prevention and control |
| KMC | Kangaroo Mother Care |
| LBW | Low birth weight |
| L&D | Labour and delivery |
| NCUs | Neonatal care units |
| SARA | Service Availability Readiness Assessment |
| SLL | Saving Little Lives |
| WASH | Water, sanitation, and hygiene |
References
- United Nations Inter-agency Group for Child Mortality Estimation (UN IGME), Levels & Trends in Child Mortality: Report 2023, Estimates developed by the United Nations Inter-agency Group for Child Mortality Estimation, United Nations Children’s Fund, New York, 2024.
- WHO, https://www.who.int/teams/maternal-newborn-child-adolescent-health-and-ageing/newborn-health/preterm-and-low-birth-weight.
- Standards for improving quality of care for small and sick newborns in health facilities. Geneva: World Health Organization; 2020. Licence: CC BY-NC-SA 3.0 IGO.
- MEDHS E. Mini Demographic and health survey 2019: key indicators report. The DHS Program ICF; 2019: 363.
- Chawanpaiboon S, Vogel JP, Moller AB, Lumbiganon P, Petzold M, Hogan D et al. Global, regional, and national estimates of levels of preterm birth in 2014: a systematic review and modelling analysis. Lancet Glob Health. 2019;7(1):e37–46. doi:10.1016/S2214-109X(18)30451-0. [CrossRef]
- Kruk ME, Gage AD, Arsenault C, et al. High-quality health systems in the Sustainable Development Goals era: time for a revolution. Lancet Global Health. 2018; 6: e1196–252—In this Commission, the family name of author Ezequiel García-Elorrio was mis-spelled. This has been corrected as of May 19, 2021. [CrossRef]
- Muhe LM, McClure EM, Nigussie AK, Mekasha A, Worku B, Worku A, Demtse A, Eshetu B, Tigabu Z, Gizaw MA, Workneh N. Major causes of death in preterm infants in selected hospitals in Ethiopia (SIP): a prospective, cross-sectional, observational study. The Lancet Global Health. 2019 Aug 1;7(8):e1130-8. [CrossRef]
- Unicef, World Health Organization. Ending preventable newborn and stillbirths by 2030: moving faster towards high-quality universal health coverage in 2020–2025.
- Perin J, Mulick A, Yeung D, Villavicencio F, Lopez G, Strong KL, Prieto-Merino D, Cousens S, Black RE, Liu L. Global, regional, and national causes of under-5 mortality in 2000-19: an updated systematic analysis with implications for the Sustainable Development Goals. Lancet Child Adolescent Health. 2022 Feb;6(2):106-115. doi: 10.1016/S2352-4642(21)00311-4. Epub 2021 Nov 17. [CrossRef]
- WHO, Service Availability and Readiness Assessment (SARA) An annual monitoring system for service delivery, Reference Manual, WHO/HIS/HSI/2014.5 Rev.1.
- Abawollo HS, Tsegaye ZT, Desta BF, Beshir IA. Readiness of primary hospitals in providing neonatal intensive Care Services in Ethiopia. Ethiopian journal of health sciences. 2021 Mar 1;31(2). [CrossRef]
- Federal Ministry of Health of Ethiopia (FMoH). 2014. Classification of facilities for newborn services and the minimum requirements in Ethiopia. Addis Ababa, Ethiopia.
- Ministry of health-Ethiopia, Health Sector Transformation Plan II (HSTP II) 2020/21-2024/25 (2013 EFY - 2017 EFY.
- Atiqzai F, Manalai P, Amin SS, Edmond KM, Naziri M, Soroush MS, et al. Quality of essential newborn care and neonatal resuscitation at health facilities in Afghanistan: a cross-sectional assessment. BMJ Open. 2019 Aug;9(8):e030496. [CrossRef]
- Ameha A, Engida E, Sylla M, Worku N, Oulare M, Legesse H, Gelaw B, Negash Y, Tadesse L, Selemon M, Musema Y. Readiness of primary health care units in addressing facility-based newborn care in Ethiopia. Ethiopian Medical Journal. 2019 Oct 22(3).
- Pradhan NA, Ali SA, Roujani S, Ali A, Hussain SS, Rizwan S, Ariff S, Saleem S, Siddiqi S. Quality of care assessment for small and sick newborns and young infants in Pakistan: findings from a cross-sectional study. BMC Pediatrics. 2022 Jan 29;22(1):68. [CrossRef]
- Ameh CA, White S, Dickinson F, et al. Improving facility-based care for sick newborns in low- and middle-income countries: A scoping review. BMJ Glob Health. 2021;6(4):e005039.
- de Graft-Johnson J, Vesel L, Rosen HE, Rawlins B, Abwao S, Mazia G, Bozsa R, Mwebesa W, Khadka N, Kamunya R, Getachew A. Cross-sectional observational assessment of quality of newborn care immediately after birth in health facilities across six sub-Saharan African countries. BMJ Open. 2017 Mar 1;7(3):e014680). [CrossRef]
- World Health Organization. Hand hygiene for all initiative: Improving access and behavior in health care facilities. World Health Organization; 2020 Sep 30.
- Safety WP, World Health Organization. WHO guidelines on hand hygiene in health care. World Health Organization; 2009.
- World Health Organization. Water, sanitation, hygiene and health: A primer for health professionals. Geneva: World Health Organization; 2020. Available from: https://www.who.int/publications/i/item/9789240014473.
- Tomlin K, Berhanu D, Gautham M, Umar N, Schellenberg J, Wickremasinghe D, Marchant T. Assessing capacity of health facilities to provide routine maternal and newborn care in low-income settings: what proportions are ready to provide good-quality care, and what proportions of women receive it? BMC Pregnancy and Childbirth. 2020 Dec;20:1-1. [CrossRef]
- World Health Organization. Recommendations on maternal and newborn care for a positive postnatal experience. Geneva: WHO; 2022. Available at: https://www.who.int/publications/i/item/9789240045989.
- Ethiopian Public Health Institute (EPHI) [Ethiopia], Ministry of Health (MoH) [Ethiopia] and ICF. 2023. Ethiopia Service Provision Assessment 2021–22 Final Report. Addis Ababa, Ethiopia, and Rockville, Maryland, USA: EPHI, MoH and ICF.
- Hou X, Khan MM, Pulford J, Saweri OP. Readiness of health facilities to provide emergency obstetric care in Papua New Guinea: evidence from a cross-sectional survey. BMJ Open. 2022 Feb 1;12(2):e050150. [CrossRef]
- de Graft-Johnson J, Vesel L, Rosen HE, Rawlins B, Abwao S, Mazia G, Bozsa R, Mwebesa W, Khadka N, Kamunya R, Getachew A. Cross-sectional observational assessment of quality of newborn care immediately after birth in health facilities across six sub-Saharan African countries. BMJ Open. 2017 Mar 1;7(3):e014680). [CrossRef]
- Mani S, Patnaik S, Lahariya C. Electricity access, sources, and reliability at primary health centers in India and effect on service provision: evidence from two nation-wide surveys. Indian Journal of Community Medicine. 2021 Jan 1;46(1):51-6. [CrossRef]
- Chen YJ, Chindarkar N, Xiao Y. Effect of reliable electricity on health facilities, health information, and child and maternal health services utilization: evidence from rural Gujarat, India. Journal of Health, Population and Nutrition. 2019 Feb 19;38(1):7.). [CrossRef]
- Rashid S, Mahmood H, Asma Iftikhar A, Komal N, Butt Z, Mumtaz H, Shellah D. Availability and readiness of primary healthcare facilities for the management of non-communicable diseases in different districts of Punjab, Pakistan. Frontiers in Public Health. 2023 Mar 10;11:1037946. [CrossRef]
- Khogali A, Ahmed A, Ibrahim M, Karrar K, Elsheikh M, Abdelraheem E, Cluver L, Elmukashfi E. Building powerful health systems: the impacts of electrification on health outcomes in LMICs. Psychology, Health & Medicine. 2022 Dec 15;27(sup1):124-37.). [CrossRef]
- Weiner GM, Zaichkin J. Updates for the neonatal resuscitation program and resuscitation guidelines. Neoreviews. 2022 Apr 1;23(4):e238-49). [CrossRef]
- Juma D, Stordal K, Kamala B, Bishanga DR, Kalolo A, Moshiro R, Kvaløy JT, Manongi R. Readiness to provide comprehensive emergency obstetric and neonatal care: a cross-sectional study in 30 health facilities in Tanzania. BMC Health Services Research. 2024 Jul 31;24(1):870. [CrossRef]
- World Health Organization. WHO recommendations for care of the preterm or low birth weight infant. World Health Organization; 2022 Nov 17.
- Narayanan I, Nsungwa-Sabiti J, Lusyati S, Rohsiswatmo R, Thomas N, Kamalarathnam CN, Wembabazi JJ, Kirabira VN, Waiswa P, Data S, Kajjo D. Facility readiness in low and middle-income countries to address care of high risk/small and sick newborns. Maternal Health, Neonatology and Perinatology. 2019 Dec;5:1-4. And https://doi.org/10.1186/s12913-019-4390-9. [CrossRef]
- Weldearegay HG, Abrha MW, Hilawe EH, Gebrekidan BA, Medhanyie AA. Quality of neonatal resuscitation in Ethiopia: implications for the survival of neonates. BMC pediatrics. 2020 Mar 19;20(1):129. [CrossRef]
- Teklie H, Haile Mariam D, Getachew T, et al. Health facility readiness to provide newborn care in Ethiopia: results from a national health facility survey. BMC Pediatrics. 2020;20(1):385. doi:10.1186/s12887-020-02306-0,. [CrossRef]
- Okonofua F, Ntoimo L, Ogu R, et al. Assessing the readiness of health facilities for providing quality newborn care in Nigeria: a cross-sectional survey. BMJ Open. 2019;9:e022797. doi:10.1136/bmjopen-2018-022797,. [CrossRef]
- Hammer NC, Koch JJ, Hopkins HC. Neonatal resuscitation: updated guidelines from the American Heart Association. American Family Physician. 2021 Oct;104(4):425-8).
- Siddiqi S, Haldar K, Banerjee A, et al. Facility readiness for neonatal health care in public hospitals in India: findings from a cross-sectional assessment. Journal of Global Health. 2022;12:04017. doi:10.7189/jogh.12.04017). [CrossRef]
- Weldearegay HG, Gultie T, Alemayehu YK, Desta BF. Availability of neonatal resuscitation services and equipment in public health facilities in Ethiopia: a cross-sectional study. BMC Pediatrics. 2020;20(1):33. doi:10.1186/s12887-020-1911-0. [CrossRef]
- Sendeku FW, Beyene FY, Tesfu AA, Bante SA, Azeze GG. Preterm birth and its associated factors in Ethiopia: a systematic review and meta-analysis. African Health Sciences. 2021 Sep 27;21(3):1321-33.). [CrossRef]
- Udo JJ, Ansa VO, Udoma EJ. An audit of some health facilities and equipment for neonatal resuscitation in south-south Nigeria. Nigerian Journal of Clinical Practice. 2012;15(2):175-179.
- Gichuhi CW, Wamalwa DC, Mutinda M, et al. Assessment of neonatal resuscitation equipment availability and preparedness in Kenyan health facilities. Pan African Medical Journal. 2019;34:124. doi:10.11604/pamj.2019.34.124.18790,. [CrossRef]
- Msemo G, Massawe A, Mmbando D, et al. Newborn care practices and availability of essential newborn care services in Tanzania: a cross-sectional study. BMC Pregnancy Childbirth. 2013;13:20. doi:10.1186/1471-2393-13-20). [CrossRef]
- World Health Organization. WHO recommendations on interventions to improve preterm birth outcomes. Geneva: WHO; 2015. Available from: https://www.who.int/publications/i/item/9789241508988.
- Mdoe PF, Ersdal HL, Mduma ER, et al. Preparedness for neonatal resuscitation in health facilities in sub-Saharan Africa: a multicounty study. BMJ Glob Health. 2019;4(5):e001132. doi:10.1136/bmjgh-2018-001132. [CrossRef]
- World Health Organization. Standards for improving the quality of care for small and sick newborns in health facilities. Geneva: WHO; 2020. Available from: https://www.who.int/publications/i/item/9789240010765).
- Teklie H, Haile Mariam D, Getachew T, et al. Health facility readiness to provide newborn care in Ethiopia: results from a national health facility survey. BMC Pediatrics. 2020;20(1):385. doi:10.1186/s12887-020-02306-0,. [CrossRef]
- Bashaasha B, Mutebi A, Nsubuga P. Assessment of neonatal care services in Tanzanian health facilities: Gaps and opportunities. Journal of Global Health Reports. 2020;4:e2020013.
- Pradhan NA, Ali SA, Roujani S, Ali A, Hussain SS, Rizwan S, Ariff S, Saleem S, Siddiqi S. Quality of care assessment for small and sick newborns and young infants in Pakistan: findings from a cross-sectional study. BMC Pediatrics. 2022 Jan 29;22(1):68. [CrossRef]
- Gebrehiwot SW, Berhe AH, Abay TH, Hadush MY, k Berhe K, Beyene SA, Medhanyie AA. Health facilities’ readiness to provide Kangaroo Mother Care (KMC) service in Tigrai region, northern Ethiopia. East African Journal of Health Sciences. 2021;3(2):474-89.
Table 1.
Availability of basic amenities in the labour & delivery ward by hospital level.
| Referral | General | Primary | Overall | p-value | |||||
|---|---|---|---|---|---|---|---|---|---|
| Variables | n | n (%) | n | n (%) | n | n (%) | n | n (%) | |
| Functional hand washing stations in: | |||||||||
| Prenatal room | 21 | 14 (67) | 51 | 16 (31) | 126 | 34 (27) | 198 | 64 (32) | 0.00 |
| Delivery room | 22 | 17 (77) | 56 | 28 (50) | 130 | 60 (46) | 208 | 105 (50) | 0.03 |
| Postnatal room | 21 | 10 (48) | 51 | 9 (18) | 126 | 27 (21) | 198 | 46 (23) | 0.02 |
| Curtains & bed screens in each bed in: | |||||||||
| Prenatal room | 21 | 9 (43) | 51 | 14 (27) | 82 | 21(26) | 154 | 44 (29) | 0.29 |
| Delivery room | 22 | 12 (55) | 56 | 25 (45) | 130 | 54 (42) | 208 | 91 (44) | 0.52 |
| Postnatal room | 21 | 13 (62) | 51 | 12(24) | 82 | 10 (12) | 154 | 35 (23) | 0.00 |
| Nursing station | 21 | 20 (95) | 51 | 41 (80) | 126 | 109 (87) | 198 | 170 (86) | 0.24 |
| Toilet with shower adjacent to ward | 22 | 12 (55) | 56 | 31(55) | 130 | 63 (48) | 208 | 106 (51) | 0.65 |
| Uninterrupted electricity supply | 22 | 17 (77) | 56 | 38 (68) | 130 | 45 (35) | 208 | 100 (48) | 0.00 |
| Automatic backup generator | 22 | 20 (91) | 56 | 34 (61) | 130 | 73 (56) | 208 | 127 (61) | 0.01 |
| Uninterrupted water supply | 22 | 13 (59) | 56 | 31 (55) | 130 | 30 (23) | 208 | 74 (36) | 0.00 |
| Single entrance to control access | 21 | 17 (81) | 51 | 37 (73) | 124 | 112 (90) | 196 | 166 (85) | 0.01 |
| Mean readiness score | 68 | 49 | 43 | 47 | |||||
Table 6.
Availability of basic medical equipment at NCUs by hospital level.
| Referral | General | Primary | Overall | ||||||
|---|---|---|---|---|---|---|---|---|---|
| Items | n | n (%) | n | n (%) | n | n (%) | n (%) | p-value | |
| NCU Bed | 22 | 22 (100) | 45 | 43 (96) | 129 | 122 (95) | 196 | 187 (95) | 0.53 |
| Radiant warmers | 22 | 22 (100) | 56 | 54 (96) | 130 | 116 (89) | 208 | 192 (92) | 0.09 |
| Room warmers | 21 | 11 (52) | 4- | 40 (80) | 126 | 93 (74) | 197 | 144 (73) | 0.05 |
| Room thermometer | 22 | 13 (59) | 55 | 32 (58) | 130 | 44 (34) | 207 | 89 (43) | 0.00 |
| Oxygen cylinder, 20 litres | 21 | 20 (95) | 40 | 35 (88) | 120 | 112 (93) | 181 | 167 (92) | 0.42 |
| Phototherapy | 22 | 21 (95) | 55 | 48 (87) | 128 | 79 (62) | 205 | 148 (72) | 0.00 |
| Neonatal resuscitator, hand operated, 250 ml | 11 | 8 (73) | 32 | 23 (72) | 77 | 33 (43) | 120 | 64 (53) | 0.01 |
| Suction bulb | 22 | 17 (77) | 56 | 43 (77) | 128 | 88 (69) | 206 | 148 (72) | 0.45 |
| Portable electrical suction pump | 18 | 16 (89) | 53 | 35 (66) | 130 | 56 (43) | 201 | 107 (53) | 0.00 |
| IV infusion pump | 22 | 19 (86) | 56 | 32 (57) | 130 | 36 (28) | 208 | 87 (42) | 0.00 |
| Syringe pump | 22 | 20 (91) | 50 | 38 (76) | 124 | 84 (68) | 196 | 142 (72) | 0.07 |
| Oxygen concentrators | 21 | 18 (86) | 49 | 43 (88) | 130 | 111 (85) | 200 | 172 (86) | 0.92 |
| Incubators | 22 | 19 (86) | 56 | 47 (84) | 129 | 97 (75) | 207 | 163 (79) | 0.27 |
| Glucometer | 22 | 21 (95) | 55 | 44 (80) | 130 | 93 (72) | 207 | 158 (76) | 0.04 |
| Digital thermometer, clinical | 22 | 20 (91) | 54 | 50 (93) | 129 | 121 (93) | 205 | 191 (93) | 0.87 |
| Weighing scale neonate (Digital) | 22 | 17 (77) | 54 | 42 (78) | 130 | 80 (61) | 206 | 139 (67) | 0.06 |
| Pulse oximeter, neonatal | 22 | 20 (91) | 56 | 48 (85) | 129 | 88 (68) | 207 | 156 (75) | 0.01 |
| Stethoscope, neonatal | 15 | 12 (80) | 45 | 36 (80) | 130 | 69 (53) | 190 | 117 (62) | 0.00 |
| Tape measure, vinyl-coated, 1.5 m | 15 | 8 (53) | 45 | 32 (71) | 124 | 80 (64) | 184 | 120 (65) | 0.44 |
| Infusion stands | 14 | 13 (93) | 50 | 41 (82) | 112 | 85 (75) | 176 | 139 (79) | 0.28 |
| bCPAP with a compressor | 22 | 17 (77) | 55 | 27 (49) | 130 | 28 (22) | 207 | 72 (35) | 0.00 |
| Gown and shoes for the providers | 21 | 15 (71) | 51 | 29 (57) | 120 | 59 (49) | 192 | 103 (54) | 0.15 |
| Refrigerator for drugs | 22 | 20 (90) | 55 | 28 (51) | 130 | 12 (9) | 207 | 60 (29) | 0.00 |
| Bag and mask, self-inflating | 22 | 14 (63) | 53 | 42 (79) | 130 | 66 (51) | 205 | 122 (60) | 0.00 |
| Laryngoscope | 19 | 13 (68) | 45 | 22 (49) | 105 | 17 (16) | 169 | 52 (31) | 0.00 |
| Mobile examination lights, ≥ 2 | 19 | 11 (58) | 48 | 23 (48) | 120 | 47 (39) | 187 | 81 (43) | 0.24 |
| Mean readiness score | 81 | 74 | 59 | 65 | |||||
Table 7.
Key staffing availability at the NCU by hospital level.
| Referral | General | Primary | Overall | ||||||
| Items | n | n (%) | n | n (%) | n | n (%) | n | n (%) | p-value |
| NCU trained nurses | 22 | 21 (95) | 56 | 54 (96) | 130 | 113 (87) | 208 | 188 (90) | 0.09 |
| Paediatricians | 22 | 21 (95) | 55 | 30 (55) | 57 | 3 (6) | 134 | 54 (40) | 0.00 |
| Trained general practitioner | 19 | 11(58) | 56 | 31 (55) | 124 | 65 (52) | 199 | 107 (54) | 0.87 |
| Porters | 22 | 18 (82) | 43 | 11 (25) | 124 | 42 (33) | 189 | 71 (38) | 0.00 |
| Cleaners | 22 | 21 (95) | 39 | 34 (87) | 120 | 100 (83) | 181 | 155 (86) | 0.31 |
| Guards | 22 | 11(50) | 54 | 9 (16) | 124 | 28 (23) | 200 | 48 (24) | 0.01 |
| Mean readiness score | 79 | 56 | 47 | 55 | |||||
Table 8.
Availability of basic medications in the NCU by hospital level.
| Referral | General | Primary | Overall | p-value | |||||
|---|---|---|---|---|---|---|---|---|---|
| Drugs | n | n (%) | n | n (%) | n | n (%) | n | n (%) | |
| Ampicillin | 21 | 20 (95) | 50 | 46 (92) | 126 | 123 (98) | 197 | 189 (96) | 0.23 |
| Gentamycin | 22 | 18 (82) | 51 | 49 (96) | 126 | 115 (91) | 199 | 182 (91) | 0.13 |
| Ceftriaxone | 21 | 17 (81) | 50 | 46 (92) | 126 | 114 (90) | 197 | 177 (90) | 0.35 |
| Cloxacillin | 21 | 13 (62) | 40 | 23 (58) | 126 | 68 (54) | 187 | 104 (56) | 0.77 |
| Ceftazidime | 14 | 4 (29) | 40 | 17 (43) | 120 | 41 (34) | 174 | 62 (36) | 0.54 |
| Ciprofloxacin | 14 | 7 (50) | 41 | 26 (63) | 50 | 5 (10) | 105 | 38 (36) | 0.00 |
| Azithromycin IV | 14 | 2 (14) | 34 | 5 (15) | 50 | 2 (4) | 98 | 9 (9) | 0.19 |
| Vancomycin | 13 | 8 (62) | 34 | 20 (59) | 50 | 14 (28) | 97 | 42 (43) | 0.01 |
| Tetracycline eye ointment | 20 | 13 (77) | 51 | 44 (86) | 126 | 95 (75) | 197 | 152 (77) | 0.12 |
| Vitamin K ampoules | 21 | 16 (76) | 51 | 45 (88) | 126 | 86 (68) | 198 | 147 (74) | 0.02 |
| IV fluids (N/S, 5% D/W, 40% glucose) | 21 | 21 (100) | 51 | 48 (94) | 124 | 116 (94) | 196 | 185 (94) | 0.49 |
| Antiseptics | 21 | 19 (90) | 51 | 49 (96) | 125 | 120 (96) | 197 | 188 (95) | 0.52 |
| Adrenaline amp. | 13 | 12 (92) | 32 | 26 (81) | 35 | 18 (51) | 80 | 56 (70) | 0.01 |
| Aminophylline amp. | 14 | 14 (100) | 34 | 25 (74) | 50 | 22 (44) | 98 | 61(62) | 0.00 |
| Dexamethasone injection | 14 | 14 (100) | 40 | 33 (83) | 85 | 63 (74) | 139 | 110 (79) | 0.07 |
| Phenobarbital | 14 | 11 (79) | 40 | 24 (60) | 119 | 70 (59) | 173 | 105 (61) | 0.36 |
| Mean score | 74 | 74 | 61 | 67 | |||||
Table 9.
Availability of basic diagnostic services by hospital level.
| Referral | General | Primary | Overall | ||||||
| Items | n | n (%) | n | n (%) | n | n (%) | n (%) | p-values | |
| HCT or Hgb | 18 | 14 (78) | 40 | 30 (75) | 104 | 73 (70) | 162 | 117 (72) | 0.73 |
| CBC | 18 | 14 (78) | 40 | 28 (70) | 105 | 56 (53) | 163 | 98 (60) | 0.05 |
| Random blood sugar | 16 | 16 (89) | 40 | 31 (78) | 105 | 83 (79) | 163 | 130 (80) | 0.58 |
| Blood group & Rh factor | 11 | 9 (82) | 40 | 30 (75) | 105 | 80 (76) | 156 | 119 (76) | 0.89 |
| Bilirubin total & direct | 10 | 6 (60) | 34 | 19 (56) | 52 | 8 (15) | 96 | 33 (34) | 0.00 |
| Blood Morphology | 7 | 4 (57) | 34 | 11 (32) | 11 | 3 (27) | 52 | 18 (35) | 0.39 |
| Blood Film | 11 | 10 (90) | 40 | 31 (78) | 82 | 52 (63) | 133 | 93 (70) | 0.08 |
| ESR | 11 | 6 (55) | 40 | 28 (70) | 82 | 39 (48) | 133 | 73 (55) | 0.06 |
| VDRL | 10 | 7 (70) | 40 | 29 (73) | 105 | 73 (70) | 155 | 109 (70) | 0.94 |
| Urine analysis | 11 | 8 (73) | 40 | 36 (90) | 105 | 79 (75) | 156 | 123 (79) | 0.13 |
| Stool exam | 11 | 8 (73) | 40 | 38 (95) | 105 | 81 (77) | 156 | 127 (81) | 0.04 |
| Culture and sensitivity of any fluid | 5 | 5 (71) | 34 | 5 (15) | 11 | 0 | 52 | 10 (19) | 0.00 |
| X-Ray | 15 | 11 (73) | 34 | 27 (79) | 50 | 32 (64) | 99 | 70 (71) | 0.30 |
| Ultrasound | 13 | 12 (92) | 36 | 20 (56) | 34 | 30 (88) | 83 | 62 (75) | 0.00 |
| Mean readiness score | 74 | 67 | 58 | 63 | |||||
Table 10.
Availability of infection prevention supplies at the NCU by hospital level.
| Items | Referral | General | Primary | Overall | p-value |
|---|---|---|---|---|---|
| n = 16 | n = 27 | n = 81 | n = 124 | ||
| n (%) | n (%) | n (%) | n (%) | ||
| Alcohol-based hand rub | 15 (94) | 27 (100) | 75 (93) | 117 (94) | 0.35 |
| Adequate antiseptics (chlorhexidine 7%, ethanol, povidone-iodine) | 15 (94) | 19 (70) | 57 (70) | 91 (74) | 0.14 |
| Functional hand washing facilities | 15 (94) | 27 (100) | 25 (31) | 67 (54) | 0.00 |
| Contaminated waste bins with different colours | 11 (68) | 21 (79) | 37 (46) | 69 (55) | 0.01 |
| Disinfectant solutions (e.g. chlorine bleach) | 16 (100) | 25 (92) | 70 (86) | 111 (90) | 0.23 |
| Adequate disposable gloves | 14 (87) | 20 (74) | 41 (50) | 75 (60) | 0.01 |
| Gloves (sterile) | 15 (94) | 24 (89) | 52 (64) | 91 (73) | 0.01 |
| Regular trash/waste bin | 13 (81) | 26 (96) | 36 (44) | 75 (60) | 0.00 |
| Receptacle for soiled linen | 10 (63) | 19 (70) | 24 (29) | 53 (43) | 0.00 |
| Sharps containers (puncture proof) | 14 (88) | 24 (89) | 74 (91) | 112 (90) | 0.86 |
| Autoclave | 6 (38) | 22 (81) | 36 (44) | 64 (52) | 0.00 |
| Mean readiness score | 82 | 86 | 59 | 68 |
Table 11.
Availability of guidelines at the NCU by hospital level.
| Referral | General | Primary | Overall | ||||||
|---|---|---|---|---|---|---|---|---|---|
| Items | n | n (%) | n | n (%) | n | n (%) | n | n (%) | p-value |
| NCU training guideline | 15 | 12 (80) | 25 | 23 (92) | 75 | 49 (65) | 115 | 84 (73) | 0.03 |
| IPC national manual | 11 | 10 (91) | 21 | 11 (52) | 49 | 17 (34) | 81 | 38 (47) | 0.00 |
| KMC registers | 15 | 7 (47) | 26 | 13 (50) | 75 | 8 (11) | 116 | 28 (24) | 0.00 |
| KMC flow chart/patient chart; feeding and weight | 20 | 14 (70) | 55 | 37 (67) | 130 | 48 (36) | 205 | 99 (48) | 0.00 |
| Neonatal logbook | 21 | 20 (95) | 54 | 51 (94) | 123 | 116 (94) | 198 | 187 (94) | 0.99 |
| Preterm care registration book | 17 | 11 (65) | 40 | 17 (43) | 79 | 16 (20) | 136 | 44 (32) | 0.00 |
| Preterm care counselling chart booklet | 14 | 8 (57) | 42 | 17 (40) | 94 | 11 (12) | 150 | 36 (24) | 0.00 |
| MPDSR audit | 12 | 12 (100) | 25 | 18 (72) | 75 | 44 (59) | 112 | 74 (66) | 0.02 |
| Mean readiness score | 75.6 | 63.8 | 41.4 | 51.0 | |||||
Disclaimer/Publisher’s Note: The statements, opinions and data contained in all publications are solely those of the individual author(s) and contributor(s) and not of MDPI and/or the editor(s). MDPI and/or the editor(s) disclaim responsibility for any injury to people or property resulting from any ideas, methods, instructions or products referred to in the content. |
© 2026 by the authors. Licensee MDPI, Basel, Switzerland. This article is an open access article distributed under the terms and conditions of the Creative Commons Attribution (CC BY) license (http://creativecommons.org/licenses/by/4.0/).
Copyright: This open access article is published under a Creative Commons CC BY 4.0 license, which permit the free download, distribution, and reuse, provided that the author and preprint are cited in any reuse.


