
Submitted:
19 January 2026
Posted:
13 February 2026
You are already at the latest version
Abstract
As the EU Commission strategises towards a more technologically advanced region, a critical question arises: Does frontier technology adoption (FTR) truly foster inclusive green growth (IGG)? This study answers this question by empirically examining the impact of FTR on IGG, while accounting for the contingency role of electricity access. Applying pooled least squares, Driscoll-Kraay standard errors, and the dynamic generalised method of moments techniques, we uncover a paradox: while FTR accelerates economic growth and lowers greenhouse gas emissions, it exacerbates income inequality. The second lesson from this study is that although electricity access enhances the growth and environmental sustainability benefits ofFTR, it only mitigates (but does not nullify) the downside of income inequality. These findings underscore the crucial need for the EU Commission to establish complementary and compensatory mechanisms to ensure that the EU’s technological leap delivers greener and more inclusive growth.
Keywords:
AI
; EU
; electricity access
; frontier technologies
; inclusive green growth
; technological transition
1. Introduction
Innovation is at the heart of the European Green Deal, which seeks to promote greener and more inclusive growth among member states (The European Innovation Council, 2024). In the past decade, inclusive green growth (IGG), which denotes a growth trajectory that simultaneously delivers resilient growth, equitable income distribution, and environmental quality, has gained traction in the development and ecological economics literature (Ofori et al., 2023; Fay, 2012). The EU’s commitment to IGG is enshrined in its long-term development framework, the ‘European Green Deal,’ which aims to redirect investments toward a more socially inclusive and improved environmental quality of life (European Union, 2019).
As EU member states deepen resource allocation toward this goal, a new wave of technological advancement known as ‘frontier technologies’ is fast emerging.( Examples of frontier technologies are: Artificial intelligence (AI), blockchain, the Internet of Things (IoT), 3D printing, robotics, drones, biotechnology, nanotechnology, and big data.) According to UNCTAD (2023), frontier technologies are highly efficient, low-carbon innovations with the potential to accelerate economic growth, promote social inclusion, and substantially reduce greenhouse gas emissions. This suggests that frontier technologies can provide a viable pathway for promoting IGG in emerging and advanced economies. However, evidence from previous technological waves indicates that technological transitions do not automatically guarantee equitable access to opportunities and income, nor do they necessarily enhance environmental well-being through reduced carbon emissions. This brings into question the IGG implications of frontier technology adoption (FTR) in EU member states.
Research has shown that FTR fosters economic growth by promoting production efficiency, forward and backwards linkages, entrepreneurship, and job creation (see, e.g., Ofori et al., 2025; Aghion et al., 2023; Gonzales, 2023; Acemoglu & Restrepo, 2019). For instance, frontier technologies such as robots and drones are revolutionising agricultural productivity by optimising fertiliser and pesticide use, enhancing precision irrigation, and advancing vertical farming (Petrović et al., 2024; DeLay et al., 2022). Financial technologies like Wise and Revolut are also enhancing financial inclusion, optimising resource allocation, and driving productive investment (Broby, 2021).
From the equity perspective of IGG, Cirillo et al. (2017) have shown that technological innovation reduces wage inequality in European countries. Similarly, Antonelli and Tubiana (2023) adduce evidence suggesting that radical, labour-intensive and job-enriching technological innovations mitigate both wealth and income inequality by augmenting worker productivity. Evidence also shows that innovations such as 5G and generative AI enhance fairer labour market inclusion by narrowing the digital divide, empowering remote learning, fostering skill development, and unlocking new entrepreneurial opportunities (Zouhaier, 2023; Morandini et al., 2023).
Frontier technologies can also reduce the ecological footprint in EU member states by curbing resource depletion, preserving biodiversity, and lowering greenhouse gas emissions. The literature suggests that AI, carbon capture systems and electric vehicles play a pivotal role in enhancing environmental quality and, by extension, inclusive green growth, by reducing energy demand and mitigating emissions of greenhouse gases, black carbon, and other air pollutants (UNCTAD, 2025, p.54; Sandalow, 2024).
However, recent evidence on the distributional impact of emerging technologies in advanced economies suggests that FTR may not be IGG-enhancing. Notably, Aghion et al. (2019) find that innovation deepens wage inequality, while other studies report business collapse (job losses) among small firms (the low-skilled) (Acemoglu et al., 2020; Frey & Osborne, 2017). Moreover, the end-of-life of frontier technologies such as drones, electric vehicles, and robots can also hinder IGG by intensifying electronic waste and releasing hazardous substances, including lead, mercury, and cadmium, into soil and freshwater. Similarly, large-scale solar farms can exacerbate deforestation and biodiversity loss, while AI and 5G can intensify high energy consumption and greenhouse gas emissions (UNCTAD, 2025, p. 18).
This study contributes to the emerging body of research by examining the impact of FTR on IGG in the EU, including an assessment of the contingency effects of electricity access. Two reasons motivate our attention to electricity access as a moderating variable. First, electricity access can serve as a complementary mechanism for amplifying the growth impact of frontier technologies. Furthermore, access to electricity, particularly renewable energy, can reduce the carbon footprint of frontier technologies for green growth (Llorca et al., 2024). Second, electricity access can function as a compensating mechanism, ensuring that frontier technologies foster fairer income growth and distribution. For instance, access to electricity can stimulate broad-based adoption of frontier technologies, which can reduce productivity gaps between advanced and less-developed regions. Moreover, electricity access can deepen digital inclusion and reduce production costs, ensuring that infant/small businesses benefit equitably from AI and e-commerce while also enhancing entrepreneurial opportunities by enabling digital startups (Sohag et al., 2024). Additionally, reliable electricity can improve education and upskilling, equipping low-skilled workers with the necessary tools and skills to capitalise on opportunities and thrive in a tech-driven economy. We explore these dynamics by addressing three main research questions:
- How have EU member states performed in IGG from 2000 to 2023?
- Does FTR promote IGG in EU member states?
- How does electricity access moderate the impact of FTR on IGG?
We answer these questions using macro data for a panel of 27 EU member states for the period 2000-2023. We account for regional interdependencies in technological readiness and guard against econometric issues, such as endogeneity, autocorrelation, and heteroskedasticity, by employing the Driscoll-Kraay standard errors and instrumental variable regression techniques for estimation. We find evidence suggesting that FTR does not promote IGG in the EU. This impact, however, is nuanced. Specifically, we demonstrate that although FTR promotes green growth by stimulating economic growth and reducing greenhouse gas emissions in the EU, it simultaneously exacerbates income inequality in the region. Results from the contingency analysis also reveal that electricity access plays complementary and compensatory roles in the FTR-IGG relationship. On the one hand, electricity access amplifies both the growth-enhancing and emission-reduction impacts of FTR. On the other hand, electricity access mitigates (but does not nullify) the inequality-enhancing effect of FTR.
The remainder of this study is structured as follows: Section 2 reviews related literature on frontier technology adoption, electricity access, and inclusive green growth. Section 3 outlines the methodology, while Section 4 presents and discusses the results. Section 5 highlights the study’s contributions to knowledge and policymaking, and Section 6 concludes with policy recommendations.
2. Review of the Theoretical and Empirical Literature
The conceptual linkage between frontier technology adoption (FTR) and inclusive green growth (IGG) draws on four complementary theoretical traditions: the macroeconomic model of artificial intelligence (AI), the three-sector endogenous growth theory, the Green Solow model, and the theory of skill-biased technical change. These frameworks explain how technological progress can simultaneously drive economic growth, income distribution, and environmental sustainability in advanced and emerging economies such as those in the European Union.
From the economic perspective of IGG, Acemoglu (2025) develops a macroeconomic model that integrates AI adoption into aggregate growth dynamics. Building on Hulten’s theorem, the model assumes a competitive economy with constant returns to scale and fixed stocks of labour and capital. Within this framework, an increase in AI adoption raises the productivity contribution of capital relative to labour, generating cost savings and efficiency gains. Growth, therefore, depends on the extent to which AI-induced automation and task complementarity allow firms to raise productivity and reduce production costs. This framework implies that frontier technologies can accelerate growth, but their macroeconomic effects depend critically on how firms reorganise production in response to these technologies.
Although the empirical literature on IGG remains relatively recent, several studies have identified macroeconomic, institutional, and environmental conditions that promote or constrain it. For instance, Vezzulli et al. (2023) provide evidence, based on macro data from 2000-2020 across 32 OECD countries, that urbanisation, globalisation, climate exposure, and internet access are salient drivers of IGG. In developing economies, the literature shows that economic complexity hinders IGG (Gbolonyo et al., 2024), whereas in advanced economies it supports it (Stojkoski et al., 2023). Other studies show that economic globalisation, measured by trade openness or foreign direct investment, impedes regional IGG trajectories (Ofori et al., 2024; Ofori & Figari, 2022). However, recent evidence suggests that governance quality, energy efficiency, and economic freedom can offset these adverse effects and allow globalisation to promote IGG (see e.g., Kamguia et al., 2025; Lahouel et al., 2023; Ofori et al., 2023).
Despite these important contributions, the literature has not directly examined how frontier technologies, particularly green and Industry 4.0 technologies, affect IGG in EU member states. Instead, existing studies fall into two main strands. The first strand examines how specific frontier technologies affect growth, emissions, or income distribution in isolation. Gonzales (2023), for instance, applies the system GMM estimator to macro data spanning 1970–2019 and finds that AI-related patents promote economic growth in advanced economies. Chu et al. (2025) also demonstrate that big data complements capital and labour to enhance production in Chinese provinces. Similarly, Ofori et al. (2025) apply quantile regression to data for 39 African countries and find robust evidence that green technologies spur economic growth, with particularly strong effects in contexts characterised by high egalitarianism. Complementary findings have been reported in the US, where Vijayakumar (2021) documents a positive effect of AI innovation on economic growth for the period 2010 to 2020. However, evidence from Begenau et al. (2018) and Babina et al. (2024) indicates that these growth gains of frontier technologies are driven by large firms through product innovation, sales expansion, and employment growth.
The second strand analyses how conventional technological innovation affects economic growth, inequality, and environmental performance separately, rather than within an integrated IGG framework. Studies using traditional innovation measures such as patents, research and development expenditure, and high-technology exports consistently find that innovation promotes long-run growth in advanced and emerging economies (see e.g., Maradana et al., 2017; Hasan & Tucci, 2010; Fu et al., 2011), although some report statistically insignificant effects (Blind et al., 2022; Sweet & Eterovic, 2019; Yousefi, 2011). These findings confirm the central role of innovation in growth but offer limited insight into its distributive or environmental implications.
The distributional effects of frontier technologies arise directly from the theory of skill-biased technical change developed by Acemoglu (2002) and further elaborated by Acemoglu and Autor (2011). This theory predicts that research and development-intensive radical innovations favour skilled workers and raise wage premia, thereby widening income inequality. Such innovations, especially automation tools such as robotics and AI, increase demand for advanced skills while displacing routine and low-skilled labour. Lu (2021) formalises these dynamics in a three-sector model in which AI accumulation, a major component of frontier technologies, improves household welfare when it raises productivity but reduces welfare when it replaces labour. At the core of the model lies the idea that, in the long run, the welfare effects of AI depend on how economic agents allocate resources among consumption, human capital, and physical capital, with excessive investment in AI at the expense of human development increasing unemployment and income inequality.
Empirical evidence largely supports these predictions. Studies on the UK, Japan, and the United States show that AI and general-purpose technologies raise wealth and wage inequality (Skare et al., 2024; Law et al., 2020; Aghion et al., 2019). Cross-country evidence from the Structure of Earnings Survey data for Germany, Spain, France, and Italy, by Cirillo et al. (2017), also confirms that technological innovation heightens income inequality. Research on robotics and computerisation further indicates that low-skilled workers experience downward wage pressure and job displacement in both France and the United States (Acemoglu et al., 2020; Frey & Osborne, 2017), while routine-biased technological change has hollowed out middle-skill jobs across Europe (Goos et al., 2014).
Recent findings from developing and emerging economies reveal similar patterns. Hjort and Poulsen (2019) show that 5G internet connectivity improves firm performance but polarises employment toward high-skill occupations in African countries. Zhang et al. (2025) also submit that AI widens income gaps across Chinese counties, particularly in counties with more advanced industrial technology, government support, and digital infrastructure. This conclusion aligns with Gilfoyle (2023), who emphasises the critical role of strong labour institutions, particularly employment protection and collective bargaining, in mitigating the inequality dark side of automation in developed countries.
At the same time, a growing body of research identifies forms of technological change that reduce inequality. A study by Santo et al. (2017), which explores the impact of information and communication technologies on income inequality, finds a high and statistically significant inequality-mitigating effect of cellphones, the internet, and telephones in Armenia, Hungary, Iceland, Latvia, and Switzerland. Antonelli and Tubiana (2023) and Antonelli and Gehringer (2017) also adduce evidence suggesting that labour-enriching radical innovations promote fairer income and wealth distributions across OECD and industrialising countries. The employment-centric literature also indicates that automation technologies raise labour demand and support net employment growth in advanced economies (see e.g., Aghion et al., 2023; Acemoglu & Restrepo, 2019). In developing economies, the innovation–inequality relationship appears nonlinear, with a plethora of studies confirming that inequality initially rises with technological adoption but declines as the digital economy matures (Wu et al., 2024; Ongo et al., 2024; Xiao et al., 2024; Guellec & Paunov, 2017; Rattsø & Stokke, 2013).
The innovation and environmental dimension of IGG is anchored in the Green Solow model developed by Brock and Taylor (2010), which extends the standard Solow framework by incorporating pollution and resource constraints. In this model, technological progress enables sustainable growth by improving resource efficiency and reducing emissions through abatement. In this sense, frontier technologies such as green hydrogen and electric vehicles provide a pathway for countries to decouple economic activity from carbon emissions.
Prior research provides strong support for this view. Studies demonstrate that AI, machine learning, IoT, and 5G technologies enhance environmental quality by improving energy efficiency, enabling real-time monitoring of natural capital, and supporting precision agriculture, logistics, and urban infrastructure management (see e.g., Rolnick et al., 2022; Cowls et al., 2021; Li et al., 2022). Aguilar et al. (2018) and Marchant et al. (2010) also show that nanotechnology and biotechnology foster environmental progress by facilitating carbon capture, renewable energy production, and pollution remediation. Research focusing on conventional innovation indicators yields similar conclusions. For instance, evidence indicates that process and green innovations reduce greenhouse gas emissions and natural capital depletion in both advanced and developing economies (Erdoğan et al., 2020; Sohag et al., 2024; Kharb et al., 2024; Nketiah et al., 2024).
However, not all frontier technologies are environmentally benign. Energy-intensive technologies such as AI, data centres, 5G networks, drones, and the IoTs generate substantial greenhouse gas emissions (UNCTAD, 2023; Sandalow, 2024). The net environmental effect of frontier technologies, therefore, depends critically on the energy systems that power them. Evidence suggests that electricity consumption raises both income and emissions in many countries, although the direction and magnitude of the effect vary with the energy mix (see e.g., Ajmi et al., 2015; Yang & Zhao, 2014; Fei et al., 2011). In the EU, the rising share of renewable energy could strengthen the IGG-enhancing effects of frontier technologies, consistent with evidence that non-renewable energy consumption intensifies environmental degradation (Ulucak & Ozcan, 2020).
Thus far, our review of the literature reveals three key gaps. First, there is a knowledge gap on how EU member states have performed in IGG from 2000 to 2023. Second, there is an evidence gap on whether and how frontier technologies affect IGG within these countries. In particular, existing studies have not examined the economic, distributional, and environmental effects of frontier technologies within a unified IGG framework. Third, there is a policy gap regarding how electricity access conditions the impact of frontier technology adoption on IGG in EU member states. This study advances the innovation-IGG literature by addressing these gaps through the empirical strategy outlined in the following section.
3. Data and Methodology
3.1. Data Description and Sources
The study constructs a macro panel spanning 2000-2023 for 27 EU member states to analyse how frontier technology adoption affects IGG. Table A.1 lists the countries sampled for the analysis. The outcome variable is IGG, which is computed following Ofori et al.’s (2023) approach (see Section 3.2 for the computation procedure). We further disaggregate IGG into the economy, equity, and the environment, consistent with Stojkoski et al. (2023), which suggests that a country’s progress in IGG is primarily assessed by how it promotes economic growth, addresses income inequality, and enhances environmental quality.
Following Sultana et al. (2024), we proxy the economy by gross domestic product per capita (GDP per capita) in current United States dollars. Data for the variable are sourced from the World Development Indicators [WDI] (World Bank, 2025). We also proxy income inequality by the Gini index, which measures how the distribution of income across a given population deviates from perfect equality. The index ranges from 0 (perfect equality) to 1 (absolute inequality). Inequality data are taken from the World Income Inequality Database (UNU-WIDER, 2023). Following Ofori et al. (2022), we use greenhouse gas emissions as a proxy for environmental quality. The variable is measured as total greenhouse gas emissions in metric tonnes of CO2 equivalent. The corresponding data are retrieved from the WDI (World Bank, 2025).
Our primary regressor is frontier technology adoption (FTR), measuring a country’s capacity to adopt, master, deploy, and adapt frontier technologies (UNCTAD, 2024). The FTR index ranges from 0 to 1, with higher values denoting better preparedness and integration of frontier technologies in socioeconomic activities. Figure 1 highlights significant variation in FTR adoption across member states, with Northwestern EU countries leading in technological integration across their economic sectors. Data for FTR and its various components are drawn from the UNCTAD Statistics (UNCTAD, 2024). Figure 1 illustrates the spatial overview of EU member states in terms of frontier technology adoption. It reveals that Sweden, the Netherlands, Germany, Ireland, Denmark, France, Finland, Belgium, and Luxembourg score highly in frontier technology readiness over the study period. On the other hand, countries such as Romania, Slovakia, Latvia, Croatia, and Bulgaria report low deployment, adoption and adoption capacities.
The other regressor of interest is electricity access, which is defined as the percentage of the population with access to electricity. We incorporate electricity access into our IGG models as a moderating variable. As discussed in previous sections, the role of electricity access in our empirical analysis is to enable us to assess whether it enhances (mitigates) the possible favourable (adverse) effect of frontier technology adoption on IGG. Data on electricity access are sourced from the WDI (World Bank, 2025).
Also, consistent with the IGG literature, we control for population growth, foreign direct investment, government effectiveness, trade openness, and voice and accountability to mitigate potential omitted variable bias. Trade openness has been shown to influence IGG by facilitating technological diffusion, integration into global value chains, and productivity-driven growth that can reduce poverty (Ofori et al., 2024). Conversely, Fay (2012) cautions that trade liberalisation may undermine IGG through job displacement, widening income disparities, and heightened ecological pressures. Trade openness is measured as the sum of exports and imports as a percentage of gross domestic product (GDP) and is sourced from the World Bank (2025). Population growth is incorporated to capture its dual role in IGG dynamics. Moderate growth can expand the labour force, stimulate private sector performance, and support economic diversification (Stojkoski et al., 2023). However, rapid population expansion may constrain IGG by intensifying unemployment, exacerbating inequality, and exerting unsustainable pressure on natural capital. Population growth is measured as the annual growth rate from the World Bank (2025) data. Similarly, foreign direct investment is included to reflect its potential to mobilise external capital, transfer green technologies, and strengthen sustainable production systems (Fay, 2012). While foreign direct investment can enhance environmental performance and stimulate inclusive growth, evidence also suggests it may accelerate ecological degradation, capital flight, unemployment, and income inequality in host economies (Kamguia et al., 2025; Gbolonyo et al., 2024). Foreign direct investment is defined as inward flows of foreign capital as a percentage of GDP and is obtained from UNCTAD (2024). Finally, government effectiveness and regulatory quality are controlled for, recognising the institutional foundations of IGG. Effective governance and strong regulatory frameworks enable the implementation of sound socioeconomic and environmental policies, fostering equitable and sustainable growth trajectories (Ofori et al., 2022; Vezzulli et al., 2023). Both indicators are perception-based measures drawn from the World Development Indicators (World Bank, 2025). Table A.2 provides detailed definitions, symbols, and data sources for all variables.
3.2. Computation of the IGG Index
Following Ofori et al. (2023, p. 5), we select 14 variables to generate the IGG index. These variables include exposure to hot days, life expectancy, women’s representation in parliament, income inequality, access to potable water, forest area, exposure to air pollution, environmental-related taxes, income per capita, terrestrial protected areas, water stress, natural resource rent, permanent cropland, and research and development expenditure. These variables are crucial for constructing a comprehensive IGG index, as they capture within-country progress across the natural asset base, environmental quality of life, economic opportunities and policy responses, environmental and resource productivity, and socioeconomic equity. For brevity, we present the definitions, data sources, and summary statistics for these variables in Table A.3.
We generate the IGG index using principal component analysis (PCA). The appropriateness of this approach for developing a robust index depends on three key preliminary tests: (i) the adequacy of the variables as a sample for computing the IGG index, (ii) strong pairwise correlations among the variables, and (iii) strong intercorrelations among the selected variables. First, the results in Table A.4 show evidence of strong correlations among the variables. Second, we assess the overall intercorrelation between the variables using Bartlett’s test of sphericity, which tests the null hypothesis of no intercorrelations among the variables against the alternative of significant intercorrelations. The results reported in Table A.5 reject the null hypothesis, indicating strong intercorrelations among the variables (χ² = 3584.071; p = 0.000). Finally, we evaluate the adequacy of the 14 variables as a sufficient sample for PCA using the Kaiser–Meyer–Olkin (KMO) measure of sampling adequacy. A sample is considered adequate if the KMO statistic is at least 0.5, within a range of 0 to 1. The results in Table A.5 show a KMO statistic of 0.647, confirming the adequacy of the sample for PCA.
Having satisfied these conditions, we perform two preparatory steps before generating the index. First, to enhance interpretability, we reverse the direction of four of the fourteen variables, namely water stress, exposure to air pollution, income inequality, and exposure to hot days, as increases in these indicators are expected to hinder IGG progress. Second, since the variables are measured on different scales (see Table A.3), we standardise them by converting them into z-scores. The index is generated by applying the ‘pca’ command in Stata to the standardised z-scores. Following Jolliffe (2002), we compute the IGG scores based on the first five principal components, as each fulfils the selection requirement of an eigenvalue of at least 1. We provide a detailed presentation of our IGG index in Section 4.2. (Figure A.1 presents a scree plot of the IGG components as well as the eigenvalue cut of point of 1.)
3.3. Econometric Models and Estimation Strategy
To empirically estimate the impact of FTR on IGG, including the contingency effects of electricity access, we follow the reduced-form econometric specification in Ofori et al. (2023) and Stojkoski et al. (2023). Equation 1 shows that IGG is driven by frontier technology adoption, electricity access and the set of control variables.
where is frontier technology adoption, is electricity access and is inclusive green growth in country i at time t, which is further disaggregated into economic growth (GDPG), income inequality (GINI), and greenhouse gas emissions (GHG), following Stojkoski et al. (2023). Similarly, , , and denote the intercept, unobserved period-specific factors, country-specific effects, and the error term, respectively. The parameter of interest in Equation 1 is , which denotes the impact of frontier technology adoption on inclusive green growth. Likewise, is a vector of control variables: population growth, foreign direct investment, government effectiveness, trade openness, and voice and accountability. (Note: In the economic growth model, population growth, political stability, gross fixed capital formation, and tax revenue serve as the controls, while regulatory quality, average income, the square of average income, trade, and foreign direct investment enter the inequality model. For the greenhouse gas emission model, the control variables are regulatory quality, average income, the square of average income, population growth, and foreign direct investment).
Consistent with Brambor et al. (2006; p.73), we introduce an interaction term for electricity access and frontier technology adoption () to answer research question 3. Accordingly, Equation (1) is modified as follows:
where and are the parameters of interest, which, in respective terms, capture the direct and conditional effects of frontier technology adoption on the IGG variables. However, to isolate the true marginal/total effect of frontier technology adoption, we differentiate Equation (2) with respect to :
where is the average electricity access level (see Table 1), meaning that the total effects of on the IGG indicators are evaluated at the mean of .
Research has established that econometric issues such as cross-sectional dependence, autocorrelation, endogeneity, and heteroskedasticity are inherent in panel data and can lead to biased and inconsistent parameter estimates if unaddressed. Accordingly, we assess cross-sectional dependence using the Pesaran (2015) test for weak cross-sectional dependence. This test is particularly relevant given the evidence of temporal and spatial linkages between countries in the diffusion of innovation (see e.g., Aghion & Jaravel, 2015). This test is based on the null hypothesis that the residuals are weakly cross-sectionally dependent, against the alternative that they are strongly correlated across panels. A p-value greater than 5% implies failure to reject the null hypothesis, suggesting no concern for cross-sectional dependence. However, the results reported in Table A.6 indicate strong cross-sectional dependence in the data (t = 26.583; p < 0.000), confirming the need to apply estimators robust to such correlations.
We also investigate the presence of serial correlation in the data by applying the Wooldridge (2002) test for autocorrelation. The test evaluates the null hypothesis of no first-order autocorrelation against the alternative of autocorrelation in the idiosyncratic errors. A p-value less than 5% indicates rejection of the null hypothesis, confirming the presence of autocorrelation. The results reported in Table A.6 reveal significant serial correlation in the data (χ² = 29.385; p = 0.000), indicating that conventional estimators that assume constant errors would be inappropriate. The study further tests for heteroskedasticity using Greene’s (2000) modified Wald test for groupwise heteroskedasticity in the residuals of Equation (2) estimated using the fixed effect estimator. The test evaluates the null hypothesis of homoskedasticity against the alternative hypothesis of groupwise heteroskedasticity. The results, which we disclose in Table A.6, indicate a Chi-square statistic of 284.89 with a p-value of 0.000, leading to the rejection of the null hypothesis at the 5% significance level. This provides strong evidence of heteroskedasticity in the data.
There is a strong case for endogeneity, primarily arising from potential reverse causality between IGG and frontier technology adoption. As argued in Section 1, frontier technology adoption can promote IGG through three key mechanisms: (1) fostering higher economic growth, (2) enhancing labour market inclusion for fairer income distribution, and (3) facilitating net reductions in greenhouse gas emissions (UNCTAD, 2023). In the EU, where environmental regulations are generally stringent, these dynamics can attract green foreign direct investment, further reinforcing IGG outcomes. Conversely, foreign investors can also enhance IGG by introducing environmentally sustainable production and management practices, which promote growth while mitigating ecological footprints (Fay, 2012; Ofori et al., 2024). Moreover, foreign investors often adapt and innovate frontier technologies, strengthening domestic capacity for sustainable development. Finally, the dynamic specification of the IGG, growth, inequality, and environmental quality models introduces additional endogeneity concerns, as the lagged dependent variables are correlated with their error terms, which are in turn influenced by country-specific effects (Arellano & Bover, 1995). (Our dynamic Sys-GMM estimation is based on a modified version of Equation (2), expressed as:)
To ensure robust and consistent estimation, this study employs three complementary econometric techniques: the pooled least squares, the Driscoll–Kraay (1998) standard errors, and Roodman’s (2009) two-step generalised method of moments (Sys-GMM) estimators for the analysis. The pooled least squares estimator serves as the baseline model, providing an average estimate of the effect of frontier technology adoption on IGG. Notwithstanding, it does not correct for econometric problems such as serial correlation, heteroskedasticity, and endogeneity. Consequently, the main inferences and policy conclusions are based on the Driscoll–Kraay and Sys-GMM estimates.
This study employs the Driscoll–Kraay estimator to obtain heteroskedasticity- and cross-sectionally robust estimates, given the presence of temporal dependence and non-constant errors in the data. This makes it suitable for macro-panel data, such as the EU sample used in this study, where cross-country spillovers and contemporaneous shocks are common. We also apply the Sys-GMM estimator (Roodman, 2009), which is an extension of Blundell and Bond (1998)’s instrumental variable regression procedure, to address the autocorrelation and endogeneity concerns in the data. The approach combines equations in levels and first differences, using lagged values of the endogenous regressors as internal instruments, thereby producing asymptotically consistent and efficient estimates. The Sys-GMM approach is also appropriate given the dataset’s structure, where the time dimension (T = 24) is shorter than the cross-sectional dimension (N = 27), minimising the risk of instrument proliferation and small-sample bias.
Several diagnostic checks are conducted to validate the Sys-GMM results. First, instrument validity is assessed using Hansen’s (1982) J-test for overidentifying restrictions; failure to reject the null hypothesis implies that the instruments are valid and uncorrelated with the residuals. We also evaluate instrument proliferation by comparing the number of cross-sectional units to the number of instruments. Finally, we test for second-order serial correlation [AR(2)] using the Arellano–Bond test, where a p-value greater than 5% confirms the absence of higher-order autocorrelation, thereby supporting the consistency and reliability of the Sys-GMM estimates.
4. Results Presentation and Discussion
4.1. Exploratory Data Analysis
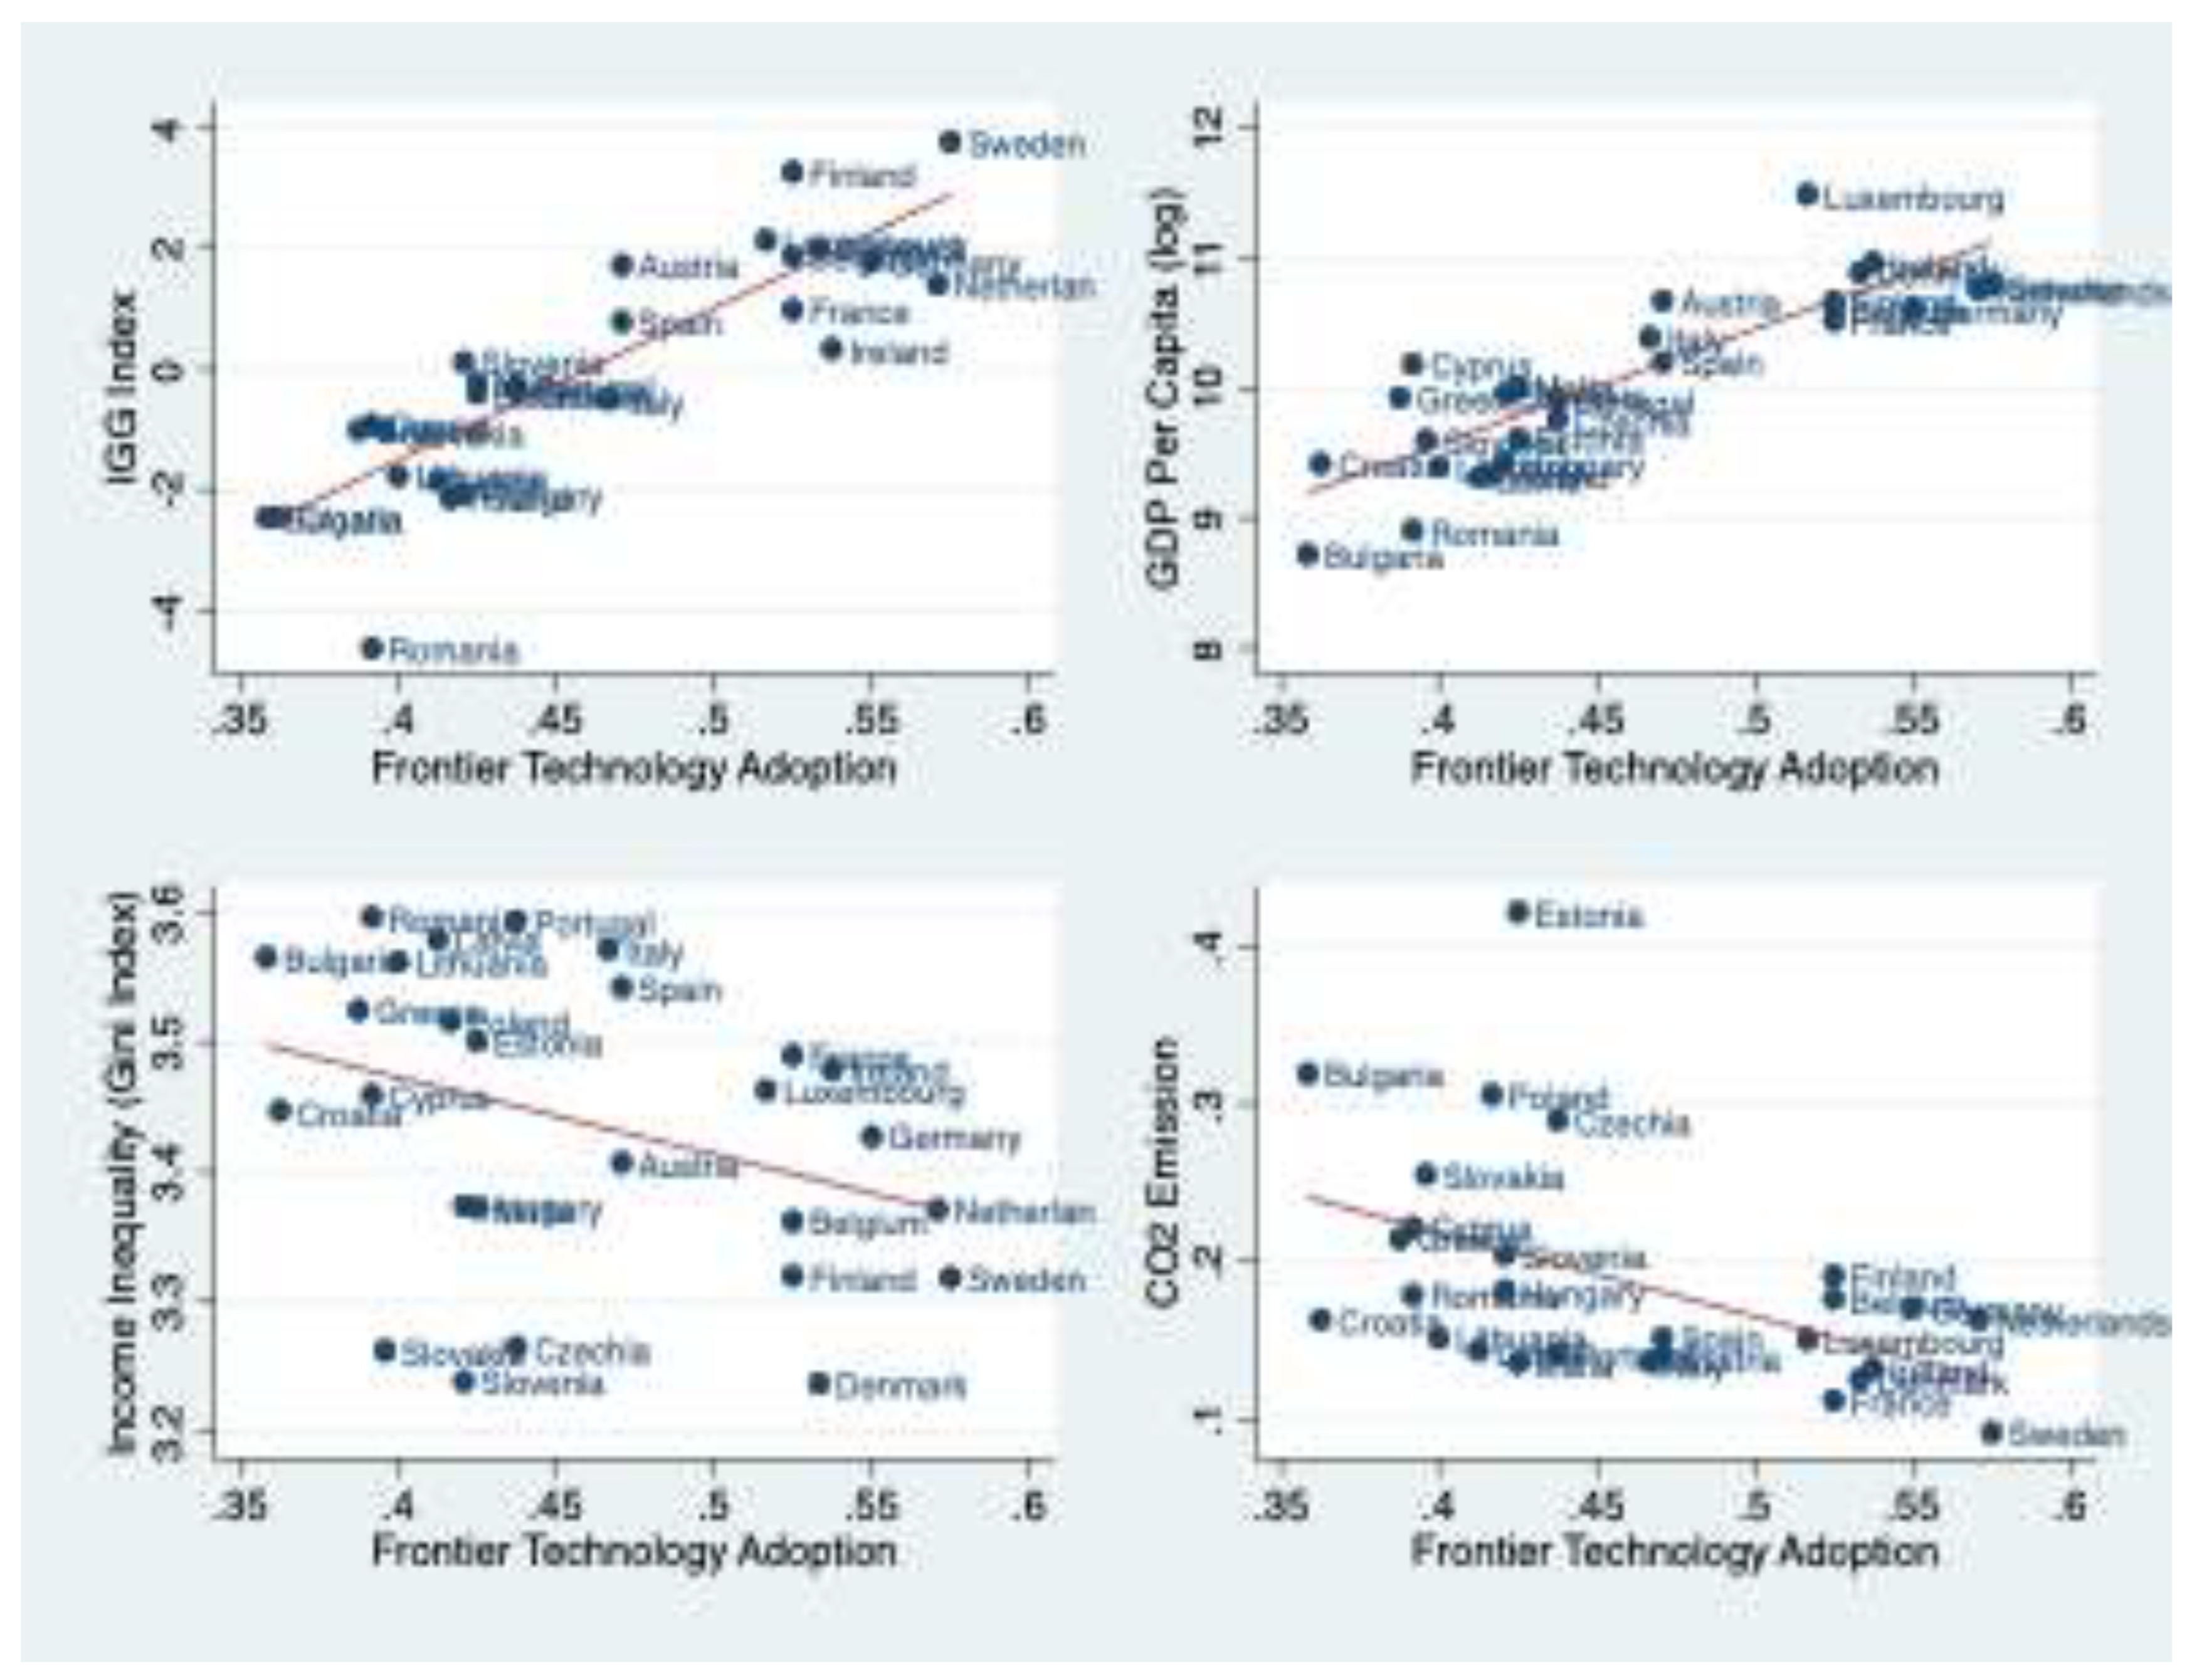
Table 1 reports the summary of the data. The data shows an average GDP per capita of US$ 30,921.6, emphasising the high living standard of the study area. Income inequality also averages 31.36% (0.3136), which is moderately high, as per UNU-WIDER (2023). For the main predictor, FTR, the data show a mean value of 0.457, which indicates that, overall, the region has a moderately high capacity for deploying frontier technologies in its socioeconomic sectors. Figure A.2 provides average within-country performance in frontier technology adoption over the study period. The data also show average tax revenue, regulatory quality, and electricity access levels of 22.5%, 1.15 and 99.6%. We further examine the bivariate relationships between FTR, IGG, and the three domains of IGG. As illustrated in Figure A.3, progress in FTR is positively associated with higher average income, suggesting that enhanced capacity to adopt, master, and deploy frontier technologies can stimulate economic growth.
Figure A.3 further reveals that FTR is negatively correlated with income inequality and greenhouse gas emissions, implying that technological advancement may foster both social equity and environmental sustainability. These associations are consistent with the correlation matrix presented in Table A.7, which reinforces the observed relationships. However, while such exploratory data analysis provides useful insights into the socioeconomic and environmental dynamics of the sampled countries, it remains descriptive rather than inferential, as it does not control for econometric challenges such as heteroskedasticity, endogeneity, cross-sectional dependence, and omitted variable bias.
4.2. The IGG Performance of EU Member States
This section addresses Question 1, which assesses the performance of EU member states in (IGG) performance. The findings are derived from our IGG index, constructed using the PCA. The result, displayed in Figure 2, reveals that over the study period, only 12 of the 27 EU member countries are growing green and inclusive. Figure 2 shows that the top five performers are Sweden, Finland, Luxembourg, Denmark and Belgium. Our analysis indicates that their strong performance stems from significant advancements in environmental quality, social inclusion and equity. For instance, these countries have enhanced women’s participation in decision-making, improved access to safely managed drinking water and terrestrial protected areas, while reducing income inequality, water stress, and exposure to air pollution. Our analysis also identifies a distinct cluster of lower-performing nations, with Romania, Bulgaria, Croatia, Poland, and Hungary displaying the most significant gaps in IGG performance.
4.3. Effects of FTR on IGG in EU Member States
To address Question 2, this section examines the estimated effects of FTR on IGG across EU member states. The results are derived from pooled least squares, Driscoll–Kraay, and two-step system GMM estimators, ensuring robust inference against autocorrelation, heteroskedasticity, cross-sectional dependence, and endogeneity.
Both the baseline and the Driscoll–Kraay estimates reported in Table 2 suggest that FTR does not have a consistent positive/negative impact on IGG. Precisely, whereas Column 2 indicates that FTR significantly reduces IGG, Column 5 shows otherwise. However, after accounting for endogeneity in the data, we find that the impact of FTR on IGG is largely negative, albeit statistically insignificant. For instance, the estimates in Columns 7 and 9 reveal that a one-point increase in FTR is associated with a 0.190 and 5.792-point reduction in the IGG score.
We address research Question 3 by examining the moderating role of electricity access in the FTR–IGG relationship. The results, reported in Columns 3, 6, and 9 of Table 2, indicate that electricity access conditions the effect of FTR in a way that enhances IGG, as evidenced by the consistently positive coefficients of the interaction terms. The corresponding total effects of FTR are 1.656 (Column 3), 1.655 (Column 6), and 0.216 (Column 9) points. These findings suggest that expanding electricity access across EU member states effectively offsets the possible adverse impact of FTR on IGG, thereby fostering greener and more inclusive growth. This is plausible in the sense that access to electricity can facilitate wider participation in technology-driven activities, which can promote entrepreneurship (e.g., family business or startups). This can enable low-income households or small enterprises to benefit from technological waves rather than being excluded from them. Additionally, access to modern and reliable energy can improve the efficiency of frontier technology deployment while simultaneously reducing its carbon footprint, thereby supporting greener growth.
Regarding the control variables, the results indicate that trade openness and foreign direct investment impede IGG. This outcome corroborates recent empirical evidence by Kharb et al. (2024) and Ofori et al. (2024), which highlights that intensified trade and capital flows can undermine IGG by increasing income inequality, worsening employment disparities, and intensifying environmental pressures. However, both regulatory quality and government effectiveness appear to exert a positive influence on IGG. These findings are consistent with Vezzulli et al. (2023) and Sohag et al. (2024), who emphasise that robust environmental governance and proactive socioeconomic policy frameworks are pivotal for promoting greener and more inclusive growth in OECD countries.
The postestimation test also confirms that our estimates are robust and reliable for inference and policy recommendations. First, all the Fisher statistics are high and statistically significant, indicating that our models jointly and effectively explain IGG. Moreover, all Hansen test probability values exceed the 5% significance threshold, confirming that the overidentifying restrictions are valid. Additionally, the number of instruments is consistently lower than the number of cross-sectional units, which demonstrates that the models are free from instrument proliferation. Finally, the p-values of the second-order autocorrelation tests [AR(2)] are statistically insignificant, implying that the two-step GMM estimations adequately address the serial correlation issues in the data.
4.4. Effects of FTR Across the Economy, Equity and Environmental Domains of IGG
This section presents robust findings across the economic, equity, and environmental quality dimensions of IGG. Such nuanced analysis is particularly important given IGG’s sensitivity to the effects of FTR across different model specifications, as well as the potentially heterogeneous impacts of FTR on economic growth, income inequality, and environmental quality. We present the corresponding findings in Table 3 (economic growth estimates), 4 (income inequality estimates), and 5 (greenhouse gas emissions estimates).
4.4.1. Effects of FTR on Economic Growth in EU Member States
Table 3 presents the estimated effects of frontier technology adoption on economic growth. Regarding the first question of this study, the results indicate that the adoption of frontier technology promotes economic growth. The pooled least squares estimates in Column 2 suggest that a one-unit increase in frontier technology adoption leads to a 0.442% rise in average income. This positive impact remains robust when employing the Driscoll-Kraay standard errors and the dynamic Sys-GMM estimators. Specifically, the results in Columns 5 and 8 of Table 3 demonstrate that frontier technology adoption enhances economic growth by 0.639% and 0.066%, respectively.
We proceed to examine the moderating role of electricity access in the relationship between frontier technology adoption and economic growth. The findings are reported in Columns 3, 6, and 9 of Table 3. We find that electricity access engenders positive synergy with frontier technology adoption to spur growth in EU member states. Specifically, the interactive effect of electricity access and frontier technology adoption on economic growth, as estimated by the baseline least squares method, is 0.637%, which is statistically significant at the 1% level. Similarly, the total effects of FTR on economic growth from the Driscoll-Kraay and dynamic Sys-GMM estimations are 0.636% and 0.042%, respectively. As documented in Li et al. (2022) and Llorca and Rodriguez-Alvarez (2024), this finding can be substantiated by the indispensable role of reliable electricity in: (1) enhancing operational efficiency, facilitating firm imitation, and strengthening participation in global value chains; (2) promoting effective labour market engagement through the growth of startups, business expansion, and employment creation; and (3) refining the skills, dexterity, and productivity of workers through improved access to digital resources and remote learning.
4.4.2. Effects of FTR on Income Inequality in EU Member States
This section reports the (un)conditional effects of frontier technology adoption on income inequality among EU member states. Our findings, presented in Table 4, indicate that frontier technology adoption exerts a positive and statistically significant effect on income inequality. This relationship remains robust across all three estimation techniques. Specifically, the fixed effects estimates reveal that a one-unit increase in frontier technology adoption is associated with a 0.018-point rise in income inequality (Column 2). Comparable results are obtained using the Driscoll–Kraay (5.608) and the system GMM (2.921) estimators, as shown in Columns 6 and 9, respectively. These results suggest that in emerging and advanced economies, the diffusion of AI and other frontier technologies tends to amplify existing income disparities. This evidence aligns with prior evidence that technological innovation widens income gaps by collapsing low-skilled jobs (Acemoglu et al. 2020; Frey & Osborne, 2017), and/or disproportionately increasing the wages (profits) of workers (adopting firms) (Cirillo et al., 2020). According to Alekseeva et al. (2021), this arises because the adoption and mastery of frontier technologies raise the demand and wages for high-skilled workers such as data scientists, AI specialists, bioinformaticians, robotics engineers, and drone operators, relative to their low- and medium-skilled counterparts.
The results regarding the moderating role of electricity access are equally revealing. We find strong evidence, significant at the 1% level, that electricity access moderates frontier technology adoption to reduce income inequality. Specifically, the conditional effect of frontier technology adoption on income inequality in Column 6 (0.026 points) is substantially lower than its direct (unconditional) effect of 5.608 points. Similarly, the marginal effect of frontier technology adoption on income inequality, estimated through the dynamic system GMM model (0.011 points), is markedly smaller than the corresponding unconditional effect of 2.921 points reported in Column 9. These findings suggest that broader access to electricity mitigates, though does not nullify, the inequality-enhancing effect of frontier technology adoption. There are multiple strategic pathways through which this can be possible. First, as Topcu and Tugcu (2020) argue, access to reliable electricity can accelerate labour market inclusion, particularly among low-income households and workers, by facilitating entrepreneurship, startup creation, and employment opportunities.
Similarly, as documented in Riva et al. (2018), improved electricity access can lower the operational costs of running businesses, which can reduce the spatial disparities in economic activity. This can be critical in narrowing employment and income gaps between technologically advanced and lagging regions. Moreover, access to electricity enables broader use of 5G and generative AI technologies for learning and skill upgrading, allowing low-skilled workers to catch up with their highly skilled counterparts. By closing gaps in human capital, employability, and earnings, electricity access extends the benefits of frontier technologies beyond high-skilled groups for equitable income distribution.
4.4.3. Effects of FTR on Greenhouse Gas Emission in EU Member States
This section presents our findings on the environmental impacts of frontier technology adoption. Our analysis provides robust evidence that the adoption of frontier technologies contributes to a reduction in greenhouse gas emissions across the region. As shown in Table 5, the results from the pooled least squares and dynamic system GMM estimations consistently indicate that a one-unit increase in frontier technology adoption is associated with a 17.4% (Column 2) and 7.1% (Column 8) decrease in greenhouse gas emissions, respectively. This evidence can be explained from two perspectives. Foremost, insights from UNCTAD (2025) indicate that frontier technologies, such as drones, IoT, AI analytics, and remote sensing, allow firms and governments to significantly improve environmental monitoring. These tools facilitate real-time data collection, pinpoint inefficiencies, and strengthen regulatory enforcement. Furthermore, technologies such as AI, 5G, and big data contribute to emissions reduction by easing congestion, improving energy distribution, and reducing energy intensity through the implementation of smart grids and efficient transportation systems (UNCTAD, 2023, p. 13).
When we condition the effect of frontier technology adoption on electricity access, a compelling pattern emerges. The results indicate that electricity access amplifies the emissions-reducing impact of frontier technology adoption. This moderating effect is statistically significant across all three estimation techniques: pooled least squares (17.5%), Driscoll–Kraay (49.1%), and dynamic system GMM (6.1%), as reported in Table 5. This is plausible because access to electricity can play a dual role in accelerating the widespread adoption of clean technologies, such as carbon capture and storage devices, while also mitigating their carbon footprints.
5. Contributions to the Innovation and IGG Literature
This study makes three contributions to the literature on the socioeconomic and environmental impacts of frontier technologies in emerging and advanced economies. The first lesson from this study is that frontier technology adoption promotes green growth by accelerating economic growth while reducing greenhouse gas emissions. On the growth side, our findings lend empirical support to Acemoglu (2025), who demonstrates that AI adoption can spur growth through cost savings derived from automation and task complementarities. There are several feasible channels through which Industry 4.0 and green technologies may foster resilient and environmentally sustainable growth. In the agricultural sector, for example, Petrović et al. (2024) and DeLay et al. (2022) show that drones, robotic weed control systems, and land and soil sensors enhance agricultural efficiency and productivity while limiting ecological impact. Similarly, in the financial sector, Broby (2021) highlights the crucial role of blockchain and the Internet of Things (IoT) in improving information flow, securing assets, and facilitating efficient resource allocation to productive investments and entrepreneurship. In the EU, where the financial system is generally well-developed, frontier technologies can significantly deepen financial inclusion and stimulate private sector growth by reducing credit and transaction costs. Empirically, our results build on studies such as Babina et al. (2024), Gonzales (2023), and Nguyen and Doytch (2022), who demonstrate that the diffusion of AI and information and communication technologies promotes economic growth in both emerging and advanced economies.
From the ‘green’ perspective of growth, our evidence further indicates that frontier technologies offer a new window of opportunity through which the European Commission can advance its Green Deal agenda. In line with the Green Solow Model, we show that EU member states can leverage the current wave of technological revolution to reduce the ecological footprint inherent in economic activities. For instance, Sandalow (2024) argues that industrial IoT sensors enable low-carbon growth by optimising energy use and adjusting operations to minimise CO₂ emissions, while UNCTAD (2025, p.128) provides fresh data suggesting that carbon capture and utilisation technologies can redirect industrial CO₂ toward productive uses in chemicals, fuels, and construction materials. Our results corroborate prior findings by Sohag et al. (2024), Kharb et al. (2024), and Erdoğan et al. (2020), which emphasise the criticality of innovation, particularly green technologies, in reducing the ecological footprint of both emerging and advanced economies.
The second significant contribution of this study is that frontier technology adoption exacerbates income inequality in EU member states. Our evidence provides strong support for the predictions of the skill-biased technological change theory, which posits that technological transitions are associated with both opportunities and risks. Seminal research by Autor et al. (1998) and Acemoglu (2002) clearly shows that the rise of the internet, computers, and automation was not neutral, but a skill-biased revolution that fundamentally reshaped labour markets and significantly widened wage inequality in both the United States and Europe. Recent theoretical advances by Acemoglu (2025, 2021) and Lu (2021) suggest that emerging technologies, such as artificial intelligence, robotics, and drones, have the potential to exacerbate existing disparities in wages and welfare across households, firms, and regions. Aligned with this body of work, our regional evidence novel regional-level evidence suggesting that while frontier technologies contribute to green growth within the EU, their benefits are unevenly distributed, resulting in patterns of non-inclusive growth.
Several mechanisms help explain this pattern. First, the deployment, mastery, and adaptation of frontier technologies require substantial upfront capital investments, resources that only large firms and financially sound investors can realistically afford to risk. This dynamic often triggers an economic realignment in which technology-oriented corporations and investors capture a disproportionate share of the gains from frontier technologies, as empirically demonstrated by Babina et al. (2024). Second, the effective utilisation of frontier technologies hinges on the technical competence, experience, and ingenuity of highly skilled workers, notably engineers, data scientists, automation specialists, researchers, and robot technicians. Consequently, the adoption of these technologies tends to widen wage and income disparities by increasing the skill premium and/or enhancing returns for investing firms. This view aligns with earlier studies showing that automation, robotics, and AI (i) disproportionately augment the productivity of high-skilled workers relative to their low-skilled counterparts (Cirillo et al., 2017), and (ii) often lead to the collapse of small firms or the displacement of low-skilled labour (Acemoglu et al., 2020). Our findings, therefore, extend the literature on technological transitions and income distribution across emerging and advanced economies (see e.g., Law et al., 2020; Aghion et al., 2019; Santos et al., 2017). However, we contradict the conclusions of Antonelli and Tubiana (2023) and Domini et al. (2022) that labour-intensive, radical, and incremental innovations such as AI and automation reduce income inequality in OECD countries.
The third notable contribution from this study is that electricity access is a significant complementary (compensating) mechanism for amplifying (mitigating) the green growth (inequality) impacts of frontier technologies. Specifically, we show that the socioeconomic and environmental effects of frontier technologies present emerging and advanced economies with a green growth–equity trade-off, underscoring the need for complementary and mitigating mechanisms to foster greener and more inclusive growth. On the one hand, electricity access can complement frontier technologies to foster green growth in two key ways. Foremost, reliable electricity, especially from renewable sources, is indispensable for the efficient operation of frontier technologies such as electric vehicles, 3D printing, AI, and big data systems. Our study builds on Sohag et al. (2024), who emphasise that renewable electricity mitigates the environmental costs associated with stringent environmental policies. Additionally, electricity access reduces the carbon footprint of energy-intensive technologies such as blockchain, big data, robotics, and AI (Sandalow, 2024). On the other hand, electricity access can mitigate the inequality-enhancing effects of frontier technologies by expanding digital inclusion. Greater access to reliable power facilitates distance learning, upskilling, and participation in remote labour markets—key channels for bridging skill and income gaps. It also reduces the operational costs of leveraging frontier technologies, enabling entrepreneurship, market expansion, and job creation. Consistent with Llorca and Rodríguez-Álvarez (2024), our evidence suggests that distributional energy justice plays a pivotal role in addressing the environmental and socioeconomic trade-offs inherent in the EU’s green transitions.
6. Concluding Remarks and Policy Recommendations
This study contributes to the emerging body of scientific research examining the socioeconomic and environmental sustainability impacts of frontier technologies in emerging and advanced economies using EU member states as a case study. It is the first of its kind to investigate the effects of frontier technology adoption on inclusive green growth while accounting for the role of electricity access in emerging and advanced economies. Two developments motivate our focus on the EU as a case study. First, data from the World Development Indicators and the UNCTAD’s Technology and Innovation Statistics indicate that EU member states (i) are pacesetters in frontier technology readiness/adoption and (ii) report high electricity access rates, which is a critical enabler for deploying, adopting, mastering, and adapting frontier technologies.
We employ rigorous econometric techniques that explicitly correct for cross-sectional dependence, autocorrelation, heteroskedasticity, and endogeneity, ensuring that the estimated relationships are both robust and broadly generalisable across the EU and comparable emerging and advanced economies. First, we find that frontier technology adoption does not promote inclusive green growth. Further analysis reveals that frontier technologies are a ‘double-edged sword’. We show that while frontier technology adoption enhances economic growth and improves environmental quality, it also deepens regional income inequality. This leads to the conclusion that, although frontier technologies foster green growth across EU member states, their benefits are unevenly distributed. Moreover, findings from the interactive analysis also reveal that access to electricity amplifies the growth- and environmental quality-enhancing impact of frontier technologies while only mitigating, but not nullifying, the inequality-inducing effect.
We hereby make the following policy recommendations. First, to ensure that technological progress fosters inclusivity and sustainability, EU policymakers must adopt a more balanced strategy. A first step is to strengthen frontier technology readiness through sustained investment in digital infrastructure, innovation financing, and research and development capacity. Member states should also strive to create education and training programmes that equip workers with digital and green skills to address technological exclusion and enhance labour mobility within the single market. Second, we recommend that EU member states deepen their investment in renewable energy systems, such as wind, bioenergy, green hydrogen, and solar, to accelerate the green transition while offsetting some of the inequality effects linked to rapid automation and digitalisation. By integrating renewable expansion with technological upgrading, member states can align industrial competitiveness with climate objectives. To complement this, we recommend that EU member states develop coordinated fiscal and industrial policies to ensure that frontier technologies contribute to a low-carbon, resource-efficient economy without exacerbating existing income and regional disparities. Finally, we recommend that the European Commission develop mechanisms to manage the redistributive consequences of frontier technology adoption. This can be achieved through progressive taxation on technology-driven rents, enhanced social protection and retraining schemes for displaced workers, and targeted investment in lagging regions to promote convergence.
The main limitation of this study is that it does not examine whether the joint effect of electricity access and frontier technology adoption varies across Northern, Southern, Eastern, and Western EU member states. This omission reflects a deliberate methodological choice, as regional disaggregation could have resulted in a substantial loss of information, thereby weakening the empirical robustness of the analysis. A further limitation concerns the inability to disaggregate frontier technologies into distinct categories, such as green frontier technologies, Industry 4.0 technologies, and other emerging technologies identified by UNCTAD (2023, p. 13), due to data constraints. With access to comprehensive data across these typologies, future studies can address these limitations.
Despite our significant contributions to knowledge and policy formulation, particularly regarding the European Commission’s IGG agenda, there remain promising avenues for further inquiry. Future research could extend this analysis by exploring how the adoption of frontier technologies and regulatory quality affect IGG in EU member states or other territories, given the criticality of regulatory regimes to the effective deployment, adoption and adaption of frontier technologies. Finally, future research could complement this macro-level analysis by utilising firm-level survey data to examine how the adoption of frontier technology influences productivity, income distribution, and emission outcomes within and across firms.
Declaration
This research was funded by the Irish Higher Education Authority [HCI PILLAR 3, 2024]. The authors also appreciate the review comments and suggestions from the editor and the two anonymous reviewers, which significantly enhanced the paper’s quality.
Acknowledgments
This research was funded by the Irish Higher Education Authority [HCI PILLAR 3, 2024].
Appendices

Table A1.
List of countries.
| Country | Code | Country | Code |
|---|---|---|---|
| Austria | AUT | Italy | ITA |
| Belgium | BEL | Latvia | LVA |
| Bulgaria | BGR | Lithuania | LTU |
| Croatia | HRV | Luxembourg | LUX |
| Cyprus | CYP | Malta | MLT |
| Czechia | CZE | Netherlands | NLD |
| Denmark | DNK | Poland | POL |
| Estonia | EST | Portugal | PRT |
| Finland | FIN | Romania | ROU |
| France | FRA | Slovakia | SVK |
| Germany | DEU | Slovenia | SVN |
| Greece | GRC | Spain | ESP |
| Hungary | HUN | Sweden | SWE |
| Ireland | IRL |
Table A2.
Description of variables and data sources.
| Variables | Symbols | Descriptions | Sources |
|---|---|---|---|
| Inclusive green growth | IGG | Inclusive green growth index | Authors |
| Economic growth | GDPG | Natural logarithm of gross domestic product per capita (current US$) | World Bank (2025) |
| Income inequality | GINI | The Gini index | UNU-WIDER (2025) |
| Environmental quality | GHG | Natural logarithm of total greenhouse gas emissions (metric tons of carbon dioxide emission equivalent) | World Bank (2025) |
| Frontier technology adoption | FTR | Country-level capacity to deploy, adopt and adapt frontier technologies: | UNCTAD (2023b) |
| Electricity access | ELEC | Access to electricity (% of population) | World Bank (2025) |
| Government effectiveness | GOVEF | Government effectiveness (estimate) | World Bank (2025) |
| Trade openness | TRADE | Sum of imports and exports as a percentage of gross domestic product | World Bank (2025) |
| Voice and accountability | VOICE | Voice and Accountability (estimate) | World Bank (2025) |
| Political stability | POLSTAB | Political Stability and Absence of Violence/Terrorism (estimate) | World Bank (2025) |
| Domestic investment | GFCF | Gross fixed capital formation (% of GDP) | Svirydzenka (2016) |
| Tax revenue | TREV | Tax revenue (% of GDP) | World Bank (2025) |
| Foreign direct investment | FDI | Inward foreign direct investment flow as a percentage of gross domestic product | UNCTAD (2025) |
| Regulatory quality | REGU | Regulatory Quality (estimate) | World Bank (2025) |
| Average income | GPC | GDP per capita, PPP (current international $) | World Bank (2025) |
| Population growth | POPG | Population growth (annual %) | World Bank (2025) |
Source: Authors’ construct, 2025.
Table A3.
Description of IGG variables and data sources.
| variables | Symbol | Definition | Source | Data source |
Obs. | Std. Dev. | Min. | Max. |
|---|---|---|---|---|---|---|---|---|
| Cropland | CLAND | Permanent cropland (% of land area) | World Bank (2025) | 621 | 2.253 | 2.912 | .006 | 10.18 |
| Water stress | LWSTRESS | Level of water stress (freshwater withdrawal as a proportion of available fresh water) | OECD (2017) | 590 | 22.197 | 20.177 | .993 | 92.544 |
| Natural resource rent | NATRSRENT | Total natural resources rents (% of GDP) | World Bank (2025) | 594 | .548 | .708 | 0 | 5.714 |
| Exposure to air pollution | POPPM25 | Population exposure to PM2.5 | OECD (2017) | 567 | 15.611 | 5.227 | 4.92 | 30.36 |
| Environmental related taxes | ERTAXES | Environment related taxes revenue | OECD (2017) | 620 | 3.015 | 1.961 | .31 | 15.3 |
| Terrestrial protected area | TERRSPA | Terrestrial protected area | OECD (2017) | 648 | 22.123 | 9.699 | 3.72 | 44.16 |
| Exposure to hot days | HOTDAYS | population exposure to hot days | OECD (2017) | 648 | 26.821 | 29.265 | 0 | 100 |
| Life expectancy | LIFEXP | Life expectancy at birth | OECD (2017) | 648 | 78.482 | 3.259 | 69.91 | 83.72 |
| Forest area | FORESTA | Forest area (% of land area) | World Bank (2025) | 621 | 34.33 | 16.926 | 1.094 | 73.736 |
| R&D expenditure | RND | Research and development expenditure (% of GDP) | World Bank (2025) | 587 | 1.485 | .891 | .227 | 3.874 |
| Income per capita | RGPPC | GDP per capita (constant 2015 US$) | World Bank (2025) | 648 | 29931.228 | 21311.382 | 3721.303 | 112417.88 |
| Palma ratio | PALMA | Palma ratio | UNU-WIDER (2025) | 567 | 1.204 | .229 | .745 | 1.983 |
| Women in parliament | SPSHW | Share of parliament seats held by women | World Bank (2025) | 621 | 24.632 | 10.493 | 5.56 | 47.28 |
| Safe drinking water | SFWATER | People using safely managed drinking water services (% of population) | World Bank (2025) | 601 | 95.267 | 6.288 | 64.429 | 100 |
Source: Authors’ construct, 2025.
Table A4.
Correlation Matrix for IGG variables.
| Variables | (1) | (2) | (3) | (4) | (5) | (6) | (7) | (8) | (9) | (10) | (11) | (12) | (13) | (14) |
|---|---|---|---|---|---|---|---|---|---|---|---|---|---|---|
| (1) CLAND | 1.000 | |||||||||||||
| (2) LWSTRESS | 0.271* | 1.000 | ||||||||||||
| (3) NATRSRENT | -0.286* | -0.161* | 1.000 | |||||||||||
| (4) POPPM25 | 0.135* | 0.181* | 0.195* | 1.000 | ||||||||||
| (5) ERTAXES | -0.022 | -0.199* | 0.345* | 0.163* | 1.000 | |||||||||
| (6) TERRSPA | 0.105* | 0.012 | -0.111* | 0.199* | -0.114* | 1.000 | ||||||||
| (7) HOTDAYS | 0.388* | -0.005 | -0.126* | 0.348* | 0.155* | 0.252* | 1.000 | |||||||
| (8) LIFEXP | 0.332* | 0.250* | -0.544* | -0.473* | -0.268* | 0.169* | -0.001 | 1.000 | ||||||
| (9) FORESTA | -0.169* | -0.444* | 0.160* | -0.266* | -0.078 | 0.052 | -0.140* | -0.100* | 1.000 | |||||
| (10) RND | -0.313* | -0.060 | -0.187* | -0.561* | -0.188* | -0.135* | -0.220* | 0.516* | 0.360* | 1.000 | ||||
| (11) RGPPC | -0.196* | -0.095* | -0.336* | -0.497* | -0.211* | -0.035 | -0.229* | 0.574* | -0.057 | 0.515* | 1.000 | |||
| (12) PALMA | 0.399* | 0.014 | 0.173* | 0.093* | 0.177* | -0.021 | 0.188* | -0.248* | -0.069 | -0.505* | -0.270* | 1.000 | ||
| (13) SPSHW | -0.126* | 0.029 | -0.082 | -0.568* | -0.199* | -0.159* | -0.227* | 0.477* | 0.323* | 0.748* | 0.443* | -0.256* | 1.000 | |
| (14) SFWATER | 0.127* | 0.318* | -0.295* | -0.211* | -0.365* | 0.248* | -0.016 | 0.592* | 0.086* | 0.377* | 0.348* | -0.317* | 0.426* | 1.000 |
*** p<0.01, ** p<0.05, * p<0.1.
Table A5.
PCA Eigenvalues and Eigenvectors for IGG Index.
| Component | Eigenvalue | Difference | Proportion | Cumulative | KMO | ||||||||||||||
|---|---|---|---|---|---|---|---|---|---|---|---|---|---|---|---|---|---|---|---|
| Comp1 | 4.085 | 1.613 | 0.292 | 0.292 | 0.617 | ||||||||||||||
| Comp2 | 2.472 | 1.145 | 0.177 | 0.468 | 0.447 | ||||||||||||||
| Comp3 | 1.327 | 0.051 | 0.095 | 0.563 | 0.751 | ||||||||||||||
| Comp4 | 1.276 | 0.243 | 0.091 | 0.654 | 0.605 | ||||||||||||||
| Comp5 | 1.033 | 0.103 | 0.074 | 0.728 | 0.433 | ||||||||||||||
| Comp6 | 0.929 | 0.180 | 0.066 | 0.794 | 0.769 | ||||||||||||||
| Comp7 | 0.750 | 0.219 | 0.053 | 0.848 | 0.744 | ||||||||||||||
| Comp8 | 0.531 | 0.102 | 0.038 | 0.886 | 0.352 | ||||||||||||||
| Comp9 | 0.429 | 0.083 | 0.031 | 0.916 | 0.624 | ||||||||||||||
| Comp10 | 0.346 | 0.019 | 0.025 | 0.941 | 0.421 | ||||||||||||||
| Comp11 | 0.327 | 0.091 | 0.023 | 0.965 | 0.698 | ||||||||||||||
| Comp12 | 0.236 | 0.072 | 0.017 | 0.982 | 0.731 | ||||||||||||||
| Comp13 | 0.164 | 0.069 | 0.012 | 0.993 | 0.823 | ||||||||||||||
| Comp14 | 0.095 | . | 0.007 | 1.000 | 0.764 | ||||||||||||||
| KMO | – | – | – | – | 0.647 | ||||||||||||||
| Variable | Comp1 | Comp2 | Comp3 | Comp4 | Comp5 | Comp6 | Comp7 | Comp8 | Comp9 | Comp10 | Comp11 | Comp12 | Comp13 | Comp14 | |||||
| z_palma_r | 0.250 | 0.094 | -0.116 | -0.546 | -0.247 | 0.217 | -0.336 | 0.325 | 0.123 | 0.370 | -0.094 | -0.001 | 0.358 | 0.040 | |||||
| z_lwstress_r | -0.027 | 0.379 | 0.453 | 0.111 | -0.415 | -0.244 | -0.053 | -0.006 | 0.363 | 0.221 | -0.027 | -0.354 | -0.312 | 0.001 | |||||
| z_poppm25_r | 0.345 | 0.162 | 0.028 | 0.393 | -0.007 | -0.180 | 0.155 | 0.089 | -0.258 | 0.142 | -0.676 | 0.077 | 0.241 | 0.164 | |||||
| z_hotdays_r | 0.159 | 0.295 | -0.408 | -0.051 | 0.250 | -0.356 | 0.342 | 0.538 | 0.085 | 0.001 | 0.262 | -0.146 | -0.146 | 0.072 | |||||
| z_cland | -0.078 | -0.454 | 0.187 | 0.408 | 0.190 | 0.021 | -0.118 | 0.288 | 0.264 | 0.365 | 0.231 | 0.014 | 0.148 | 0.416 | |||||
| z_natrsrent | -0.210 | 0.356 | -0.012 | -0.060 | 0.331 | 0.339 | 0.395 | -0.271 | 0.228 | 0.503 | -0.057 | 0.252 | -0.014 | -0.013 | |||||
| z_ertaxes | -0.211 | 0.167 | 0.034 | 0.261 | -0.330 | 0.626 | 0.250 | 0.438 | -0.016 | -0.310 | 0.002 | -0.040 | 0.068 | 0.017 | |||||
| z_terrspa | -0.015 | -0.243 | 0.480 | -0.423 | -0.083 | -0.089 | 0.548 | 0.079 | -0.387 | 0.096 | 0.089 | -0.102 | 0.064 | 0.168 | |||||
| z_lifexp | 0.373 | -0.317 | 0.045 | 0.160 | -0.114 | 0.101 | 0.138 | 0.182 | -0.010 | 0.283 | 0.059 | 0.199 | -0.292 | -0.670 | |||||
| z_foresta | 0.116 | 0.323 | 0.561 | -0.015 | 0.352 | -0.095 | -0.181 | 0.213 | 0.059 | -0.273 | 0.163 | 0.374 | 0.259 | -0.211 | |||||
| z_rnd1 | 0.415 | 0.169 | 0.059 | -0.012 | -0.010 | 0.264 | -0.183 | -0.060 | -0.274 | 0.006 | 0.187 | 0.261 | -0.535 | 0.473 | |||||
| z_rgppc | 0.358 | 0.001 | -0.112 | 0.097 | -0.414 | -0.119 | 0.313 | -0.326 | 0.317 | -0.146 | 0.339 | 0.284 | 0.354 | 0.135 | |||||
| z_spshw | 0.384 | 0.119 | 0.058 | 0.165 | 0.259 | 0.288 | -0.017 | -0.234 | -0.158 | 0.051 | 0.268 | -0.649 | 0.257 | -0.124 | |||||
| z_sfwater | 0.312 | -0.259 | 0.109 | -0.229 | 0.259 | 0.183 | 0.162 | 0.003 | 0.550 | -0.351 | -0.386 | -0.149 | -0.187 | 0.113 | |||||
Principal components (eigenvectors).
Table A6.
Preliminary test results.
| Test | Test Statistic | P-value |
|---|---|---|
| Greene (2000) Groupwise heteroskedasticity test | 284.89 *** | 0.000 |
| Pesaran (2015) cross-sectional dependence test | 26.583 *** | 0.000 |
| Wooldridge’s (2002) serial correlation test | 29.385*** | 0.000 |
Note: The results are obtained from Equation (2), with IGG index as the outcome variable; * p < 0.05, ** p < 0.01, *** p < 0.001.
Table A7.
Correlation Matrix.
| Variables | (1) | (2) | (3) | (4) | (5) | (6) | (7) | (8) | (9) | (10) | (11) | (12) | (13) | (14) | (15) | (16) |
|---|---|---|---|---|---|---|---|---|---|---|---|---|---|---|---|---|
| (1) IGGINDEX | 1.000 | |||||||||||||||
| (2) GHG | 0.124* | 1.000 | ||||||||||||||
| (3) GDPG | 0.741* | 0.069 | 1.000 | |||||||||||||
| (4) GINI | -0.489* | 0.120* | -0.234* | 1.000 | ||||||||||||
| (5) FTR | 0.411* | 0.033 | 0.368* | -0.053 | 1.000 | |||||||||||
| (6) ELEC | 0.411* | 0.097* | 0.285* | -0.231* | 0.179* | 1.000 | ||||||||||
| (7) GOVEF | 0.370* | -0.073 | 0.425* | -0.058 | 0.483* | 0.182* | 1.000 | |||||||||
| (8) TRADE | 0.159* | -0.394* | 0.479* | -0.217* | 0.175* | 0.116* | 0.330* | 1.000 | ||||||||
| (9) VOICE | 0.817* | 0.125* | 0.724* | -0.424* | 0.104* | 0.450* | 0.260* | 0.179* | 1.000 | |||||||
| (10) POLSTAB | 0.455* | -0.191* | 0.428* | -0.486* | -0.109* | 0.346* | 0.127* | 0.406* | 0.662* | 1.000 | ||||||
| (11) GFCF | -0.159* | -0.199* | -0.140* | -0.079 | -0.266* | -0.073 | -0.184* | 0.038 | -0.069 | 0.096* | 1.000 | |||||
| (12) TREV | 0.230* | -0.354* | 0.239* | -0.178* | -0.079 | 0.098* | 0.299* | 0.139* | 0.312* | 0.265* | -0.122* | 1.000 | ||||
| (13) FDI | -0.018 | -0.119* | 0.013 | -0.069 | -0.082 | 0.009 | 0.251* | 0.249* | 0.062 | 0.176* | -0.021 | 0.483* | 1.000 | |||
| (14) REGU | 0.744* | 0.080 | 0.691* | -0.390* | 0.182* | 0.371* | 0.239* | 0.281* | 0.879* | 0.638* | 0.075 | 0.210* | 0.034 | 1.000 | ||
| (15) GPC | 0.693* | 0.050 | 0.930* | -0.184* | 0.482* | 0.307* | 0.458* | 0.582* | 0.591* | 0.349* | -0.139* | 0.143* | 0.031 | 0.588* | 1.000 | |
| (16) POPG | 0.540* | 0.001 | 0.685* | -0.359* | 0.144* | 0.315* | 0.360* | 0.456* | 0.598* | 0.495* | -0.053 | 0.284* | 0.142* | 0.516* | 0.663* | 1.000 |
*** p<0.01, ** p<0.05, * p<0.1
Figure A1.
Scree plot IGG components.
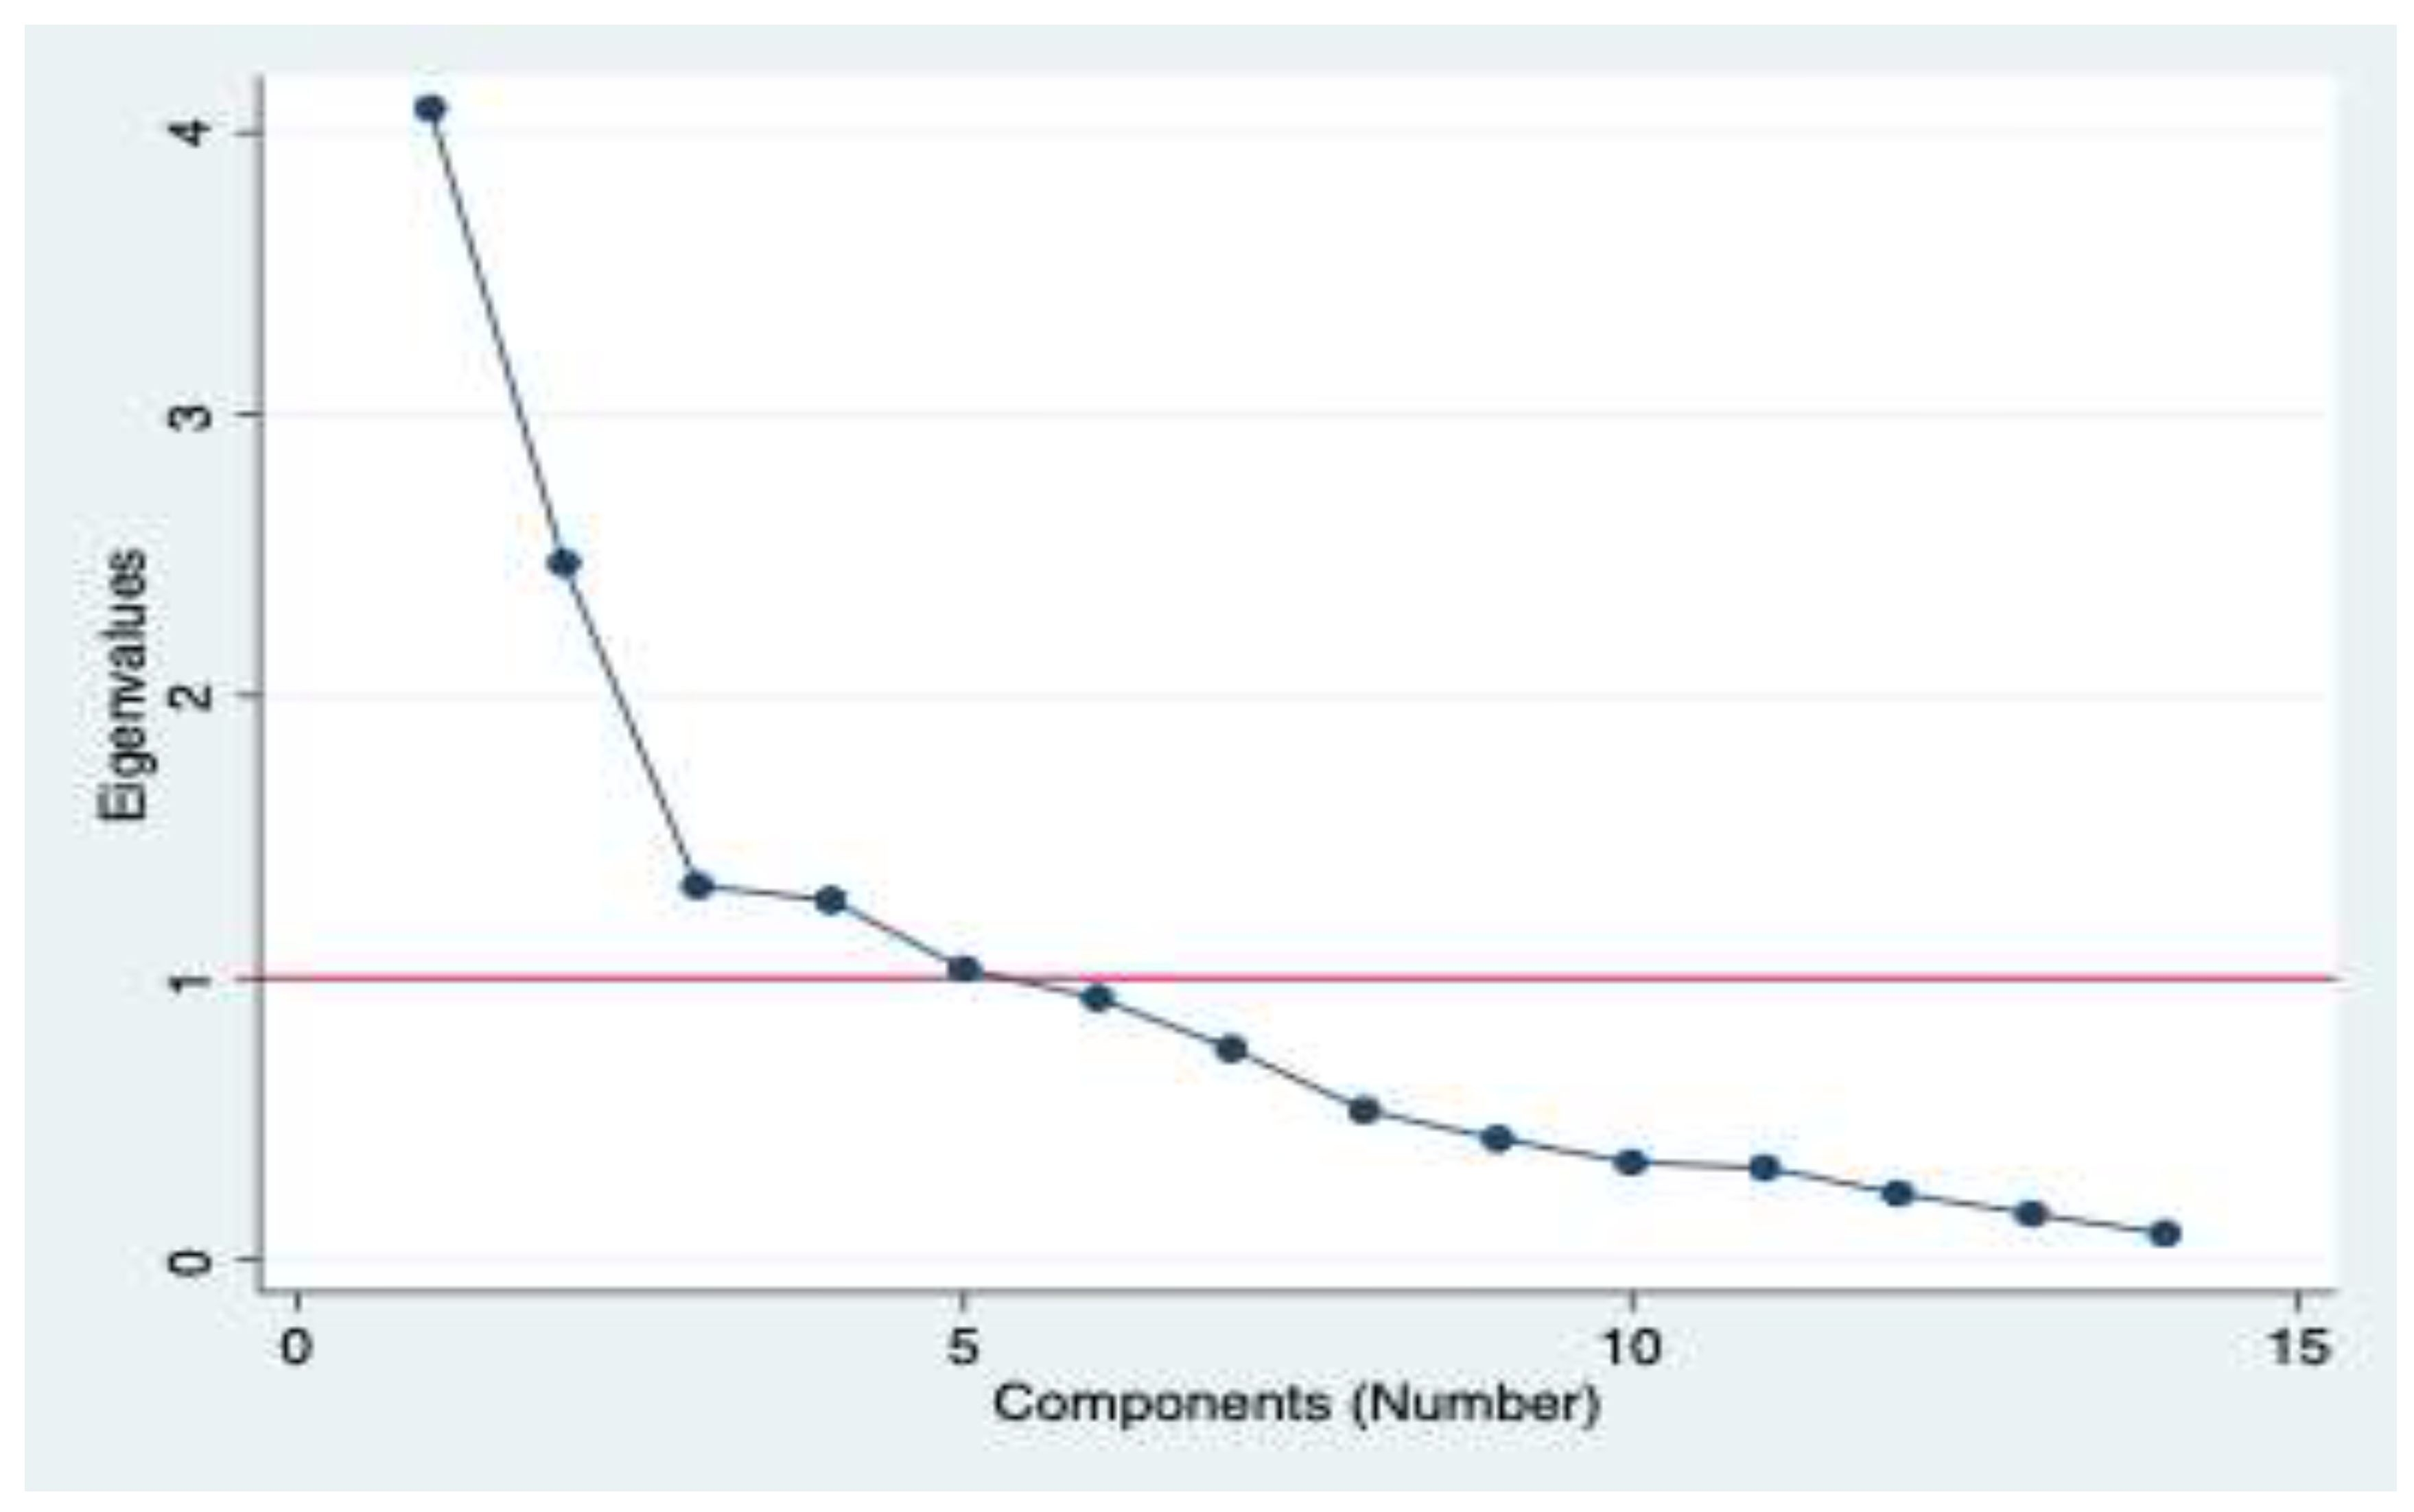
Figure A2.
Average within-country FTR performance of EU member states, 2000-2023.
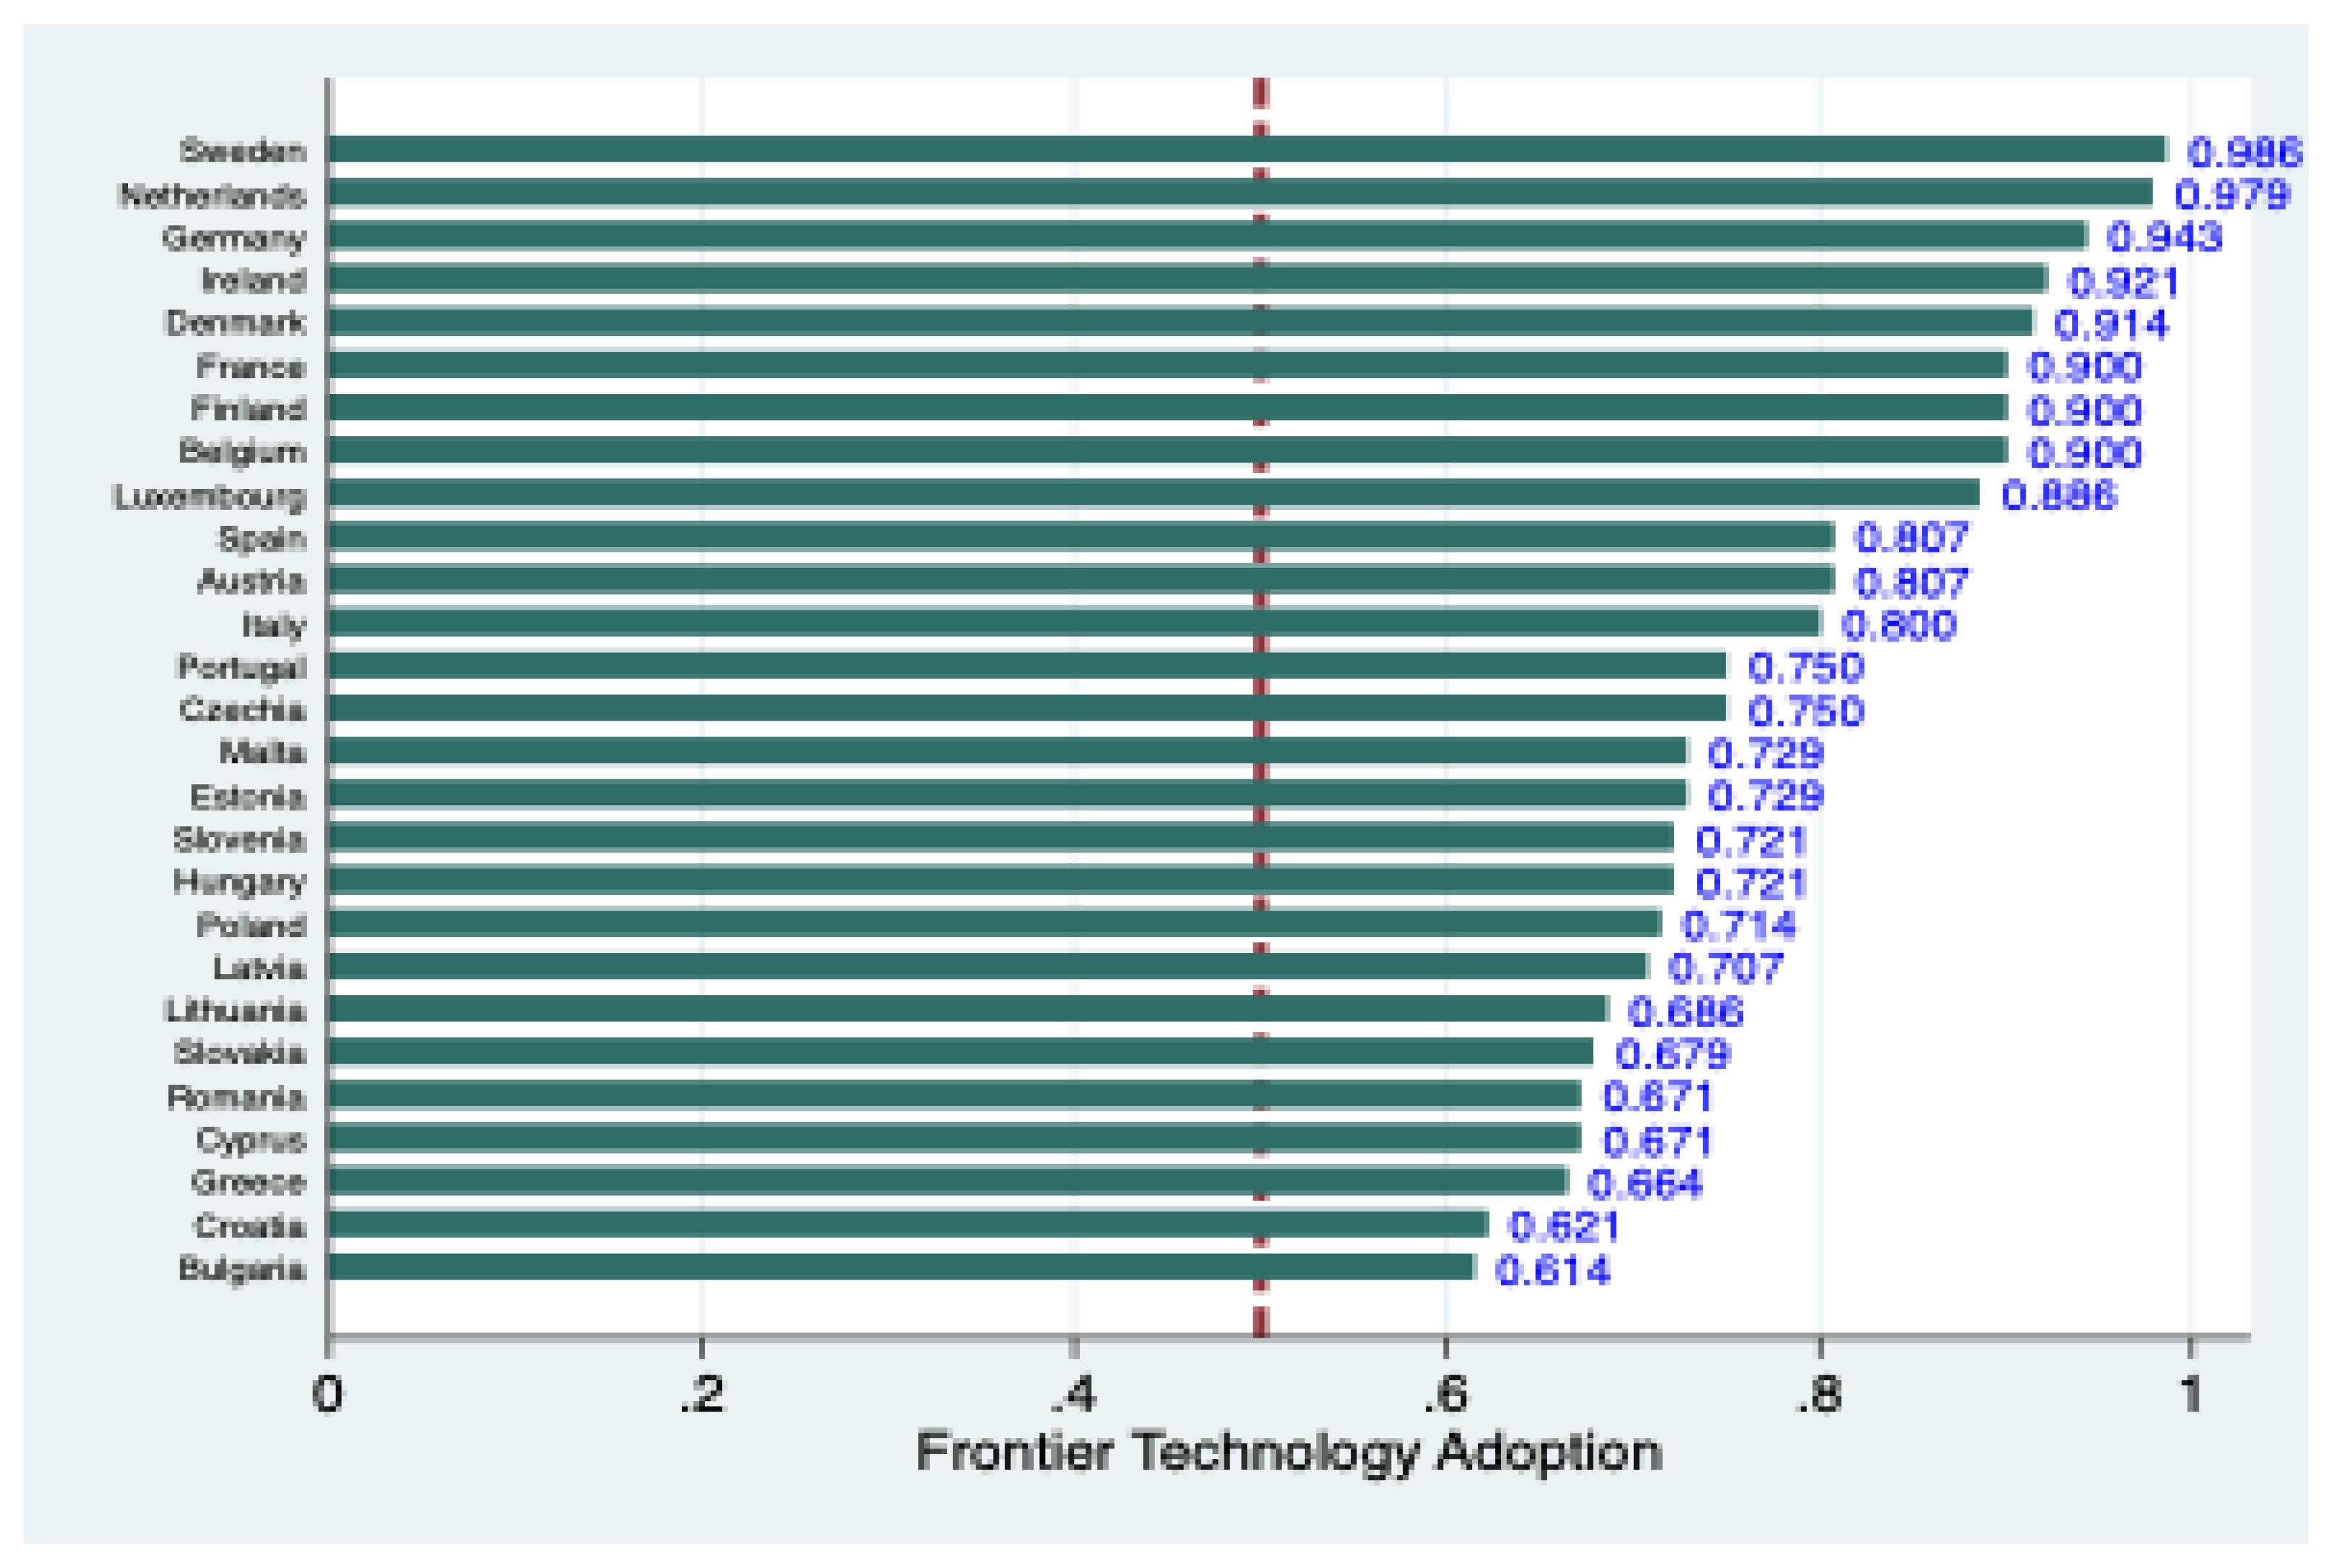
Figure A3.
Relationship between FTR and IGG, 2000-2023.
References
- Acemoglu, D. Technical change, inequality, and the labour market. Journal of Economic Literature 2002, 40, 7–72. [Google Scholar] [CrossRef]
- Acemoglu, D. Harms of AI. In National Bureau of Economic Research; Technical report; 2021. [Google Scholar]
- Acemoglu, D. The simple macroeconomics of AI. Economic Policy 2025, 40, 13–58. [Google Scholar] [CrossRef]
- Acemoglu, D.; Autor, D. Skills, tasks and technologies: Implications for employment and earnings. In Handbook of Labour Economics; Elsevier, 2011; Vol. 4, pp. 1043–1171. [Google Scholar]
- Acemoglu, D.; Lelarge, C.; Restrepo, P. Competing with robots: Firm-level evidence from France. In AEA Papers and Proceedings; American Economic Association, 2020; Volume 110, pp. 383–388. [Google Scholar]
- Acemoglu, D.; Restrepo, P. Automation and new tasks: How technology displaces and reinstates labor. Journal of Economic Perspectives 2019, 33, 3–30. [Google Scholar] [CrossRef]
- Aghion, P.; Akcigit, U.; Bergeaud, A.; Blundell, R.; Hémous, D. Innovation and top income inequality. The Review of Economic Studies 2019, 86, 1–45. [Google Scholar] [CrossRef]
- Aghion, P.; Antonin, C.; Bunel, S.; Jaravel, X. The effects of automation on labor demand. Robots and AI 2023, 15–39. [Google Scholar]
- Aghion, P.; Jaravel, X. Knowledge spillovers, innovation and growth. The Economic Journal 2015, 125, 533–573. [Google Scholar] [CrossRef]
- Aguilar, A.; Wohlgemuth, R.; Twardowski, T. Perspectives on bioeconomy. New Biotechnology 2018, 40, 181–184. [Google Scholar] [CrossRef]
- Ajmi, A. N.; Hammoudeh, S.; Nguyen, D. K.; Sato, J. R. On the relationships between CO2 emissions, energy consumption and income: The importance of time variation. Energy Economics 2015, 49, 629–638. [Google Scholar] [CrossRef]
- Alekseeva, L.; Azar, J.; Giné, M.; Samila, S.; Taska, B. The demand for AI skills in the labor market. Labour Economics 2021, 71, 102002. [Google Scholar] [CrossRef]
- Antonelli, C.; Gehringer, A. Technological change, rent and income inequalities: A Schumpeterian approach. Technological Forecasting and Social Change 2017, 115, 85–98. [Google Scholar] [CrossRef]
- Antonelli, C.; Tubiana, M. The rate and direction of technological change and wealth and income inequalities in advanced countries. Technological Forecasting and Social Change 2023, 191, 122508. [Google Scholar] [CrossRef]
- Arellano, M.; Bover, O. Another look at the instrumental variable estimation of error-components models. Journal of Econometrics 1995, 68, 29–51. [Google Scholar] [CrossRef]
- Autor, D. H.; Katz, L. F.; Murphy, K. M. Changes in the wage structure and earnings inequality. The Quarterly Journal of Economics 1998, 113, 1271–1321. [Google Scholar]
- Babina, T.; Fedyk, A.; He, A.; Hodson, J. Artificial intelligence, firm growth, and product innovation. Journal of Financial Economics 2024, 151, 103745. [Google Scholar] [CrossRef]
- Begenau, J.; Farboodi, M.; Veldkamp, L. Big data in finance and the growth of large firms. Journal of Monetary Economics 2018, 97, 71–87. [Google Scholar] [CrossRef]
- Ben Lahouel, B.; Taleb, L.; Managi, S.; Abaoub, N. Inclusive green growth in OECD countries: What are the impacts of stringent environmental and employment regulations? Environmental Economics and Policy Studies 2023, 1–29. [Google Scholar] [CrossRef]
- Blind, K.; Ramel, F.; Rochell, C. The influence of standards and patents on long-term economic growth. The Journal of Technology Transfer 2022, 47, 979–999. [Google Scholar] [CrossRef]
- Blundell, R.; Bond, S. Initial conditions and moment restrictions in dynamic panel data models. Journal of Econometrics 1998, 87, 115–143. [Google Scholar] [CrossRef]
- Broby, D. Financial technology and the future of banking. Financial Innovation 2021, 7, 47. [Google Scholar] [CrossRef]
- Brock, W. A.; Taylor, M. S. The green Solow model. Journal of Economic Growth 2010, 15, 127–153. [Google Scholar] [CrossRef]
- Chu, Z.; Chen, X.; Yang, J. Impact of data factor and data integration on economic development: Empirical insights from China. Telecommunications Policy Advance online publication. 2025. [Google Scholar] [CrossRef]
- Cirillo, V.; Sostero, M.; Tamagni, F. Innovation and within-firm wage inequalities: Empirical evidence from major European countries. Industry and Innovation 2017, 24, 468–491. [Google Scholar] [CrossRef]
- Cowls, J.; Tsamados, A.; Taddeo, M.; Floridi, L. The AI gambit: Leveraging artificial intelligence to combat climate change—Opportunities, challenges, and recommendations. AI & Society 2023, 38, 283–307. [Google Scholar]
- European Innovation. The European Innovation Council tech report 2024. In Technical report; Publications Office of the European Union, 2024. [Google Scholar] [CrossRef]
- DeLay, N. D.; Thompson, N. M.; Mintert, J. R. Precision agriculture technology adoption and technical efficiency. Journal of Agricultural Economics 2022, 73, 195–219. [Google Scholar] [CrossRef]
- Ding, Y.; Duan, H.; Xie, M.; Mao, R.; Wang, J.; Zhang, W. Carbon emissions and mitigation potentials of 5G base station in China. Resources, Conservation and Recycling 2022, 182, 106339. [Google Scholar] [CrossRef]
- Domini, G.; Grazzi, M.; Moschella, D.; Treibich, T. For whom the bell tolls: The firm-level effects of automation on wage and gender inequality. Research Policy 2022, 51, 104533. [Google Scholar] [CrossRef]
- Driscoll, J. C.; Kraay, A. C. Consistent covariance matrix estimation with spatially dependent panel data. Review of Economics and Statistics 1998, 80, 549–560. [Google Scholar] [CrossRef]
- Erdoğan, S.; Yıldırım, S.; Yıldırım, D.; Gedikli, A. The effects of innovation on sectoral carbon emissions: Evidence from G20 countries. Journal of Environmental Management 2020, 267, 110637. [Google Scholar] [CrossRef]
- European Commission. The European Green Deal. Communication COM 2019, 640 Final. European Commission, Brussels, 2019. [Google Scholar]
- Fay, M. Inclusive green growth: The pathway to sustainable development; World Bank Publications, 2012. [Google Scholar]
- Fei, L.; Dong, S.; Xue, L.; Liang, Q.; Yang, W. Energy consumption-economic growth relationship and carbon dioxide emissions in China. Energy Policy 2011, 39, 568–574. [Google Scholar] [CrossRef]
- Frey, C. B.; Osborne, M. A. The future of employment: How susceptible are jobs to computerisation? Technological Forecasting and Social Change 2017, 114, 254–280. [Google Scholar] [CrossRef]
- Fu, X.; Pietrobelli, C.; Soete, L. The role of foreign technology and indigenous innovation in the emerging economies: Technological change and catching up. World Development 2011, 39, 1204–1212. [Google Scholar] [CrossRef]
- Gbolonyo, E. Y.; Ofori, I. K.; Ojong, N. Does economic complexity promote inclusive green growth? Technical report. ZBW-Leibniz Information Centre for Economics 2024, 1–35. [Google Scholar]
- Gilfoyle, A. The impact of automation on income inequality: A cross-country analysis. arXiv 2023, arXiv:2304.07835. [Google Scholar] [CrossRef]
- Gonzales, J. T. Implications of AI innovation on economic growth: A panel data study. Journal of Economic Structures 2023, 12, 13. [Google Scholar] [CrossRef]
- Goos, M.; Manning, A.; Salomons, A. Explaining job polarization: Routine-biased technological change and offshoring. American Economic Review 2014, 104, 2509–2526. [Google Scholar] [CrossRef]
- Greene, W. H. Econometric analysis, 4th ed.; Prentice Hall, 2000. [Google Scholar]
- Guellec, D.; Paunov, C. Digital innovation and the distribution of income. In Measuring and Accounting for Innovation in the 21st Century; University of Chicago Press, 2017. [Google Scholar]
- Hansen, L. P. Large sample properties of generalized method of moments estimators. Econometrica: Journal of the Econometric Society 1982, 1029–1054. [Google Scholar] [CrossRef]
- Hasan, I.; Tucci, C. L. The innovation–economic growth nexus: Global evidence. Research Policy 2010, 39, 1264–1276. [Google Scholar] [CrossRef]
- Hjort, J.; Poulsen, J. The arrival of fast internet and employment in Africa. American Economic Review 2019, 109, 1032–1079. [Google Scholar] [CrossRef]
- Hötte, K.; Somers, M.; Theodorakopoulos, A. Technology and jobs: A systematic literature review; Technical Report 2022-2; Oxford Martin School, 2022. [Google Scholar]
- Jolliffe, I. Principal component analysis. In International Encyclopedia of Statistical Science; Springer, 2011; pp. 1094–1096. [Google Scholar]
- Kamguia, B.; Tadadjeu, S.; Ndoya, H.; Djeunankan, R. Assessing the nexus between industrialisation and inclusive green growth in Africa: The critical role of energy efficiency. Ecological Economics 2025, 233, 108601. [Google Scholar] [CrossRef]
- Kharb, R.; Saini, N.; Kumar, D. Driving environmental sustainability in emerging economies: The nexus of green finance, foreign direct investment, financial development, and green technology innovation. Business Strategy & Development 2024, 7, e70008. [Google Scholar]
- Law, S. H.; Naseem, N. A. M.; Lau, W. Y.; Trinugroho, I. Can innovation improve income inequality? Evidence from panel data. Economic Systems 2020, 44, 100815. [Google Scholar] [CrossRef]
- Li, Y.; Zhang, Y.; Pan, A.; Han, M.; Veglianti, E. Carbon emission reduction effects of industrial robot applications: Heterogeneity characteristics and influencing mechanisms. Technology in Society 2022, 70, 102034. [Google Scholar] [CrossRef]
- Llorca, M.; Rodriguez-Alvarez, A. Economic, environmental, and energy equity convergence: Evidence of a multi-speed Europe? Ecological Economics 2024, 219, 108133. [Google Scholar] [CrossRef]
- Lu, C.-H. The impact of artificial intelligence on economic growth and welfare. Journal of Macroeconomics 2021, 69, 103342. [Google Scholar] [CrossRef]
- Maradana, R. P.; Pradhan, R. P.; Dash, S.; Gaurav, K.; Jayakumar, M.; Chatterjee, D. Does innovation promote economic growth? Evidence from European countries. Journal of Innovation and Entrepreneurship 2017, 6, 1–23. [Google Scholar] [CrossRef]
- Marchant, G. E.; Sylvester, D. J.; Abbott, K. W. A new soft law approach to nanotechnology oversight: A voluntary product certification scheme. UCLA Journal of Environmental Law & Policy 2010, 28, 123–152. [Google Scholar]
- Morandini, S.; Fraboni, F.; De Angelis, M.; Puzzo, G.; Giusino, D.; Pietrantoni, L. The impact of artificial intelligence on workers’ skills: Upskilling and reskilling in organisations. Informing Science 2023, 26, 39–68. [Google Scholar] [CrossRef]
- Nguyen, C. P.; Doytch, N. The impact of ICT patents on economic growth: An international evidence. Telecommunications Policy 2022, 46, 102291. [Google Scholar] [CrossRef]
- Nketiah, E.; Song, H.; Adjei, M.; Obuobi, B.; Adu-Gyamfi, G. Assessing the influence of research and development, environmental policies, and green technology on ecological footprint for achieving environmental sustainability. Renewable and Sustainable Energy Reviews 2024, 199, 114508. [Google Scholar] [CrossRef]
- Ofori, I. K.; Figari, F. Economic globalisation and inclusive green growth in Africa: Contingencies and policy-relevant thresholds of governance. Sustainable Development 2023, 31, 452–482. [Google Scholar] [CrossRef]
- Ofori, I. K.; Freytag, A.; Asongu, S. A. Economic globalisation and Africa’s quest for greener and more inclusive growth: The missing link. International Economics 2024, 178, 100509. [Google Scholar] [CrossRef]
- Ofori, I. K.; Gbolonyo, E. Y.; Ojong, N. Towards inclusive green growth in Africa: Critical energy efficiency synergies and governance thresholds. Journal of Cleaner Production 2022, 369, 132917. [Google Scholar] [CrossRef]
- Ofori, I. K.; Gbolonyo, E. Y.; Ojong, N. Foreign direct investment and inclusive green growth in Africa: Energy efficiency contingencies and thresholds. Energy Economics 2023, 117, 106414. [Google Scholar] [CrossRef]
- Ofori, I. K.; Gbolonyo, E. Y.; Vezzulli, A. Heterogeneous effects of frontier technology adoption on economic growth in Africa. Structural Change and Economic Dynamics 2025, 15, 526–540. [Google Scholar] [CrossRef]
- Ongo, E. B. N.; Bitoto, F. E.; Ondoua, B. B.; Mbognou, C. N. Does innovation drive up income inequality in Africa? Journal of the Knowledge Economy 2024, 1–27. [Google Scholar] [CrossRef]
- Rolnick, D.; Donti, P. L.; Kaack, L. H.; Kochanski, K.; Lacoste, A.; Sankaran, K.; Bengio, Y. Tackling climate change with machine learning. ACM Computing Surveys 2022, 55, 1–96. [Google Scholar] [CrossRef]
- UNCTAD United Nations Conference on Trade and Development. Technology and innovation report 2025: Inclusive artificial intelligence for development. UNCTAD/TIR/2025. 2025. Available online: https://unctad.org/system/files/official-document/tir2025_en.pdf.
- UNCTAD [United Nations Conference on Trade; Development. UNCTADStat: Foreign direct investment (FDI) database. 2025. Available online: https://unctadstat.unctad.org/datacentre/dataviewer/US.FdiFlowsStock.
- UNCTAD [United Nations Conference on Trade; Development. UNCTADStat: Frontier technology readiness index (FTRI) database. 2024. Available online: https://unctadstat.unctad.org/datacentre/dataviewer/US.FTRI.
- United Nations Conference on Trade and Development. Technology and innovation report 2023: Opening green windows: Technological opportunities for a low-carbon world. 2023. Available online: https://unctad.org/system/files/official-document/tir2023_en.pdf.
- Pesaran, M. H. Testing weak cross-sectional dependence in large panels. Econometric Reviews 2015, 34, 1089–1117. [Google Scholar] [CrossRef]
- Petrović, B.; Bumbálek, R.; Zoubek, T.; Kuneš, R.; Smutný, L.; Bartoš, P. Application of precision agriculture technologies in Central Europe – review. Journal of Agriculture and Food Research 2024, 15, 101048. [Google Scholar] [CrossRef]
- Rattsø, J.; Stokke, H. E. Trade, skill-biased technical change and wage inequality in South Africa. Review of International Economics 2013, 21, 419–431. [Google Scholar] [CrossRef]
- Reddy, S.; Fox, J.; Purohit, M. P. Artificial intelligence-enabled healthcare delivery. Journal of the Royal Society of Medicine 2019, 112, 22–28. [Google Scholar] [CrossRef]
- Riva, F.; Ahlborg, H.; Hartvigsson, E.; Pachauri, S.; Colombo, E. Electricity access and rural development: Review of complex socio-economic dynamics and causal diagrams for more appropriate energy modelling. Energy for Sustainable Development 2018, 43, 203–223. [Google Scholar] [CrossRef]
- Roodman, D. How to do xtabond2: An introduction to difference and system GMM in Stata. The Stata Journal 2009, 9, 86–136. [Google Scholar] [CrossRef]
- Sandalow, D. Greenhouse gas emissions from AI. In ICEF AI for Climate Change Mitigation Roadmap, 2nd ed.; Innovation for Cool Earth Forum, 2024; p. pp. 15-1–15-23. [Google Scholar]
- Santos, M.; Sequeira, T. N.; Ferreira-Lopes, A. Income inequality and technological adoption. Journal of Economic Issues 2017, 51, 979–1000. [Google Scholar] [CrossRef]
- Skare, M.; Gavurova, B.; Burić, S. B. Artificial intelligence and wealth inequality: A comprehensive empirical exploration of socioeconomic implications. Technology in Society 2024, 79, 102719. [Google Scholar] [CrossRef]
- Sohag, K.; Husain, S.; Soytas, U. Environmental policy stringency and ecological footprint linkage: Mitigation measures of renewable energy and innovation. Energy Economics 2024, 136, 107721. [Google Scholar] [CrossRef]
- Soytas, U.; Sari, R. Energy consumption and income in G-7 countries. Journal of Policy Modeling 2006, 28, 739–750. [Google Scholar] [CrossRef]
- Stojkoski, V.; Koch, P.; Hidalgo, C. A. Multidimensional economic complexity and inclusive green growth. Communications Earth & Environment 2023, 4, 130. [Google Scholar] [CrossRef]
- Sultana, N.; Rahman, M. M.; Murad, S. M. W. Asymmetric role of the informal sector on economic growth: Empirical investigation on a developing country. Structural Change and Economic Dynamics 2024, 69, 96–107. [Google Scholar] [CrossRef]
- Sweet, C.; Eterovic, D. Do patent rights matter? 40 years of innovation, complexity and productivity. World Development 2019, 115, 78–93. [Google Scholar] [CrossRef]
- Topcu, M.; Tugcu, C. T. The impact of renewable energy consumption on income inequality: Evidence from developed countries. Renewable Energy 2020, 151, 1134–1140. [Google Scholar] [CrossRef]
- Ulucak, R.; Ozcan, B.; et al. Relationship between energy consumption and environmental sustainability in OECD countries: The role of natural resources rents. Resources Policy 2020, 69, 101803. [Google Scholar] [CrossRef]
- Umlauf, R.; Burchardt, M. Infrastructure-as-a-service: Empty skies, bad roads, and the rise of cargo drones. Environment and Planning A: Economy and Space 2022, 54, 1489–1509. [Google Scholar] [CrossRef]
- UNU-WIDER. World Income Inequality Database (WIID). Database 2023. [Google Scholar]
- Vezzulli, A.; Ofori, I. K.; Ofori, P. E.; Gbolonyo, E. Y. Inclusive green growth in OECD countries: Insights from the Lasso regularization and inferential techniques. In Engineering Mathematics and Artificial Intelligence; CRC Press, 2023; pp. 425–462. [Google Scholar]
- Wooldridge, J. M. Simple solutions to the initial conditions problem in dynamic, nonlinear nonlinear panel data models with unobserved heterogeneity. Journal of Applied Econometrics 2002, 17, 435–465. [Google Scholar]
- World Bank. World development indicators. Database. 2025. Available online: https://databank.worldbank.org/source/world-development-indicators.
- Wu, M.; Ma, Y.; Gao, Y.; Ji, Z. The impact of the digital economy on income inequality from the perspective of technological progress-biased transformation: Evidence from China. Empirical Economics 2024, 67, 567–607. [Google Scholar] [CrossRef]
- Xiao, A.; Xu, Z.; Skare, M.; Qin, Y.; Wang, X. Bridging the digital divide: The impact of technological innovation on income inequality and human interactions. Humanities and Social Sciences Communications 2024, 11, 1–18. [Google Scholar] [CrossRef]
- Yang, Z.; Zhao, Y. Energy consumption, carbon emissions, and economic growth in India: Evidence from directed acyclic graphs. Economic Modelling 2014, 38, 533–540. [Google Scholar] [CrossRef]
- Yousefi, A. The impact of information and communication technology on economic growth: Evidence from developed and developing countries. Economics of Innovation and New Technology 2011, 20, 581–596. [Google Scholar] [CrossRef]
- Yu, L.; Wang, Y.; Wei, X.; Zeng, C. Towards low-carbon development: The role of industrial robots in decarbonization in Chinese cities. Journal of Environmental Management 2023, 330, 117216. [Google Scholar] [CrossRef]
- Zouhaier, S. The impact of artificial intelligence on higher education: An empirical study. European Journal of Educational Sciences 2023, 10, 17–33. [Google Scholar]
- Zhang, W.; Han, J.; Işık, C.; Song, J.; Liu, X.; Dembińska, I.; Radulescu, M. Inequality in the digital economy: The impact of artificial intelligence on income gap—An empirical analysis based on county-level data from China. Cities 2025, 166, 106280. [Google Scholar] [CrossRef]
Figure 1.
Frontier Technology Readiness (Average) in the EU Member States, 2000-2023.
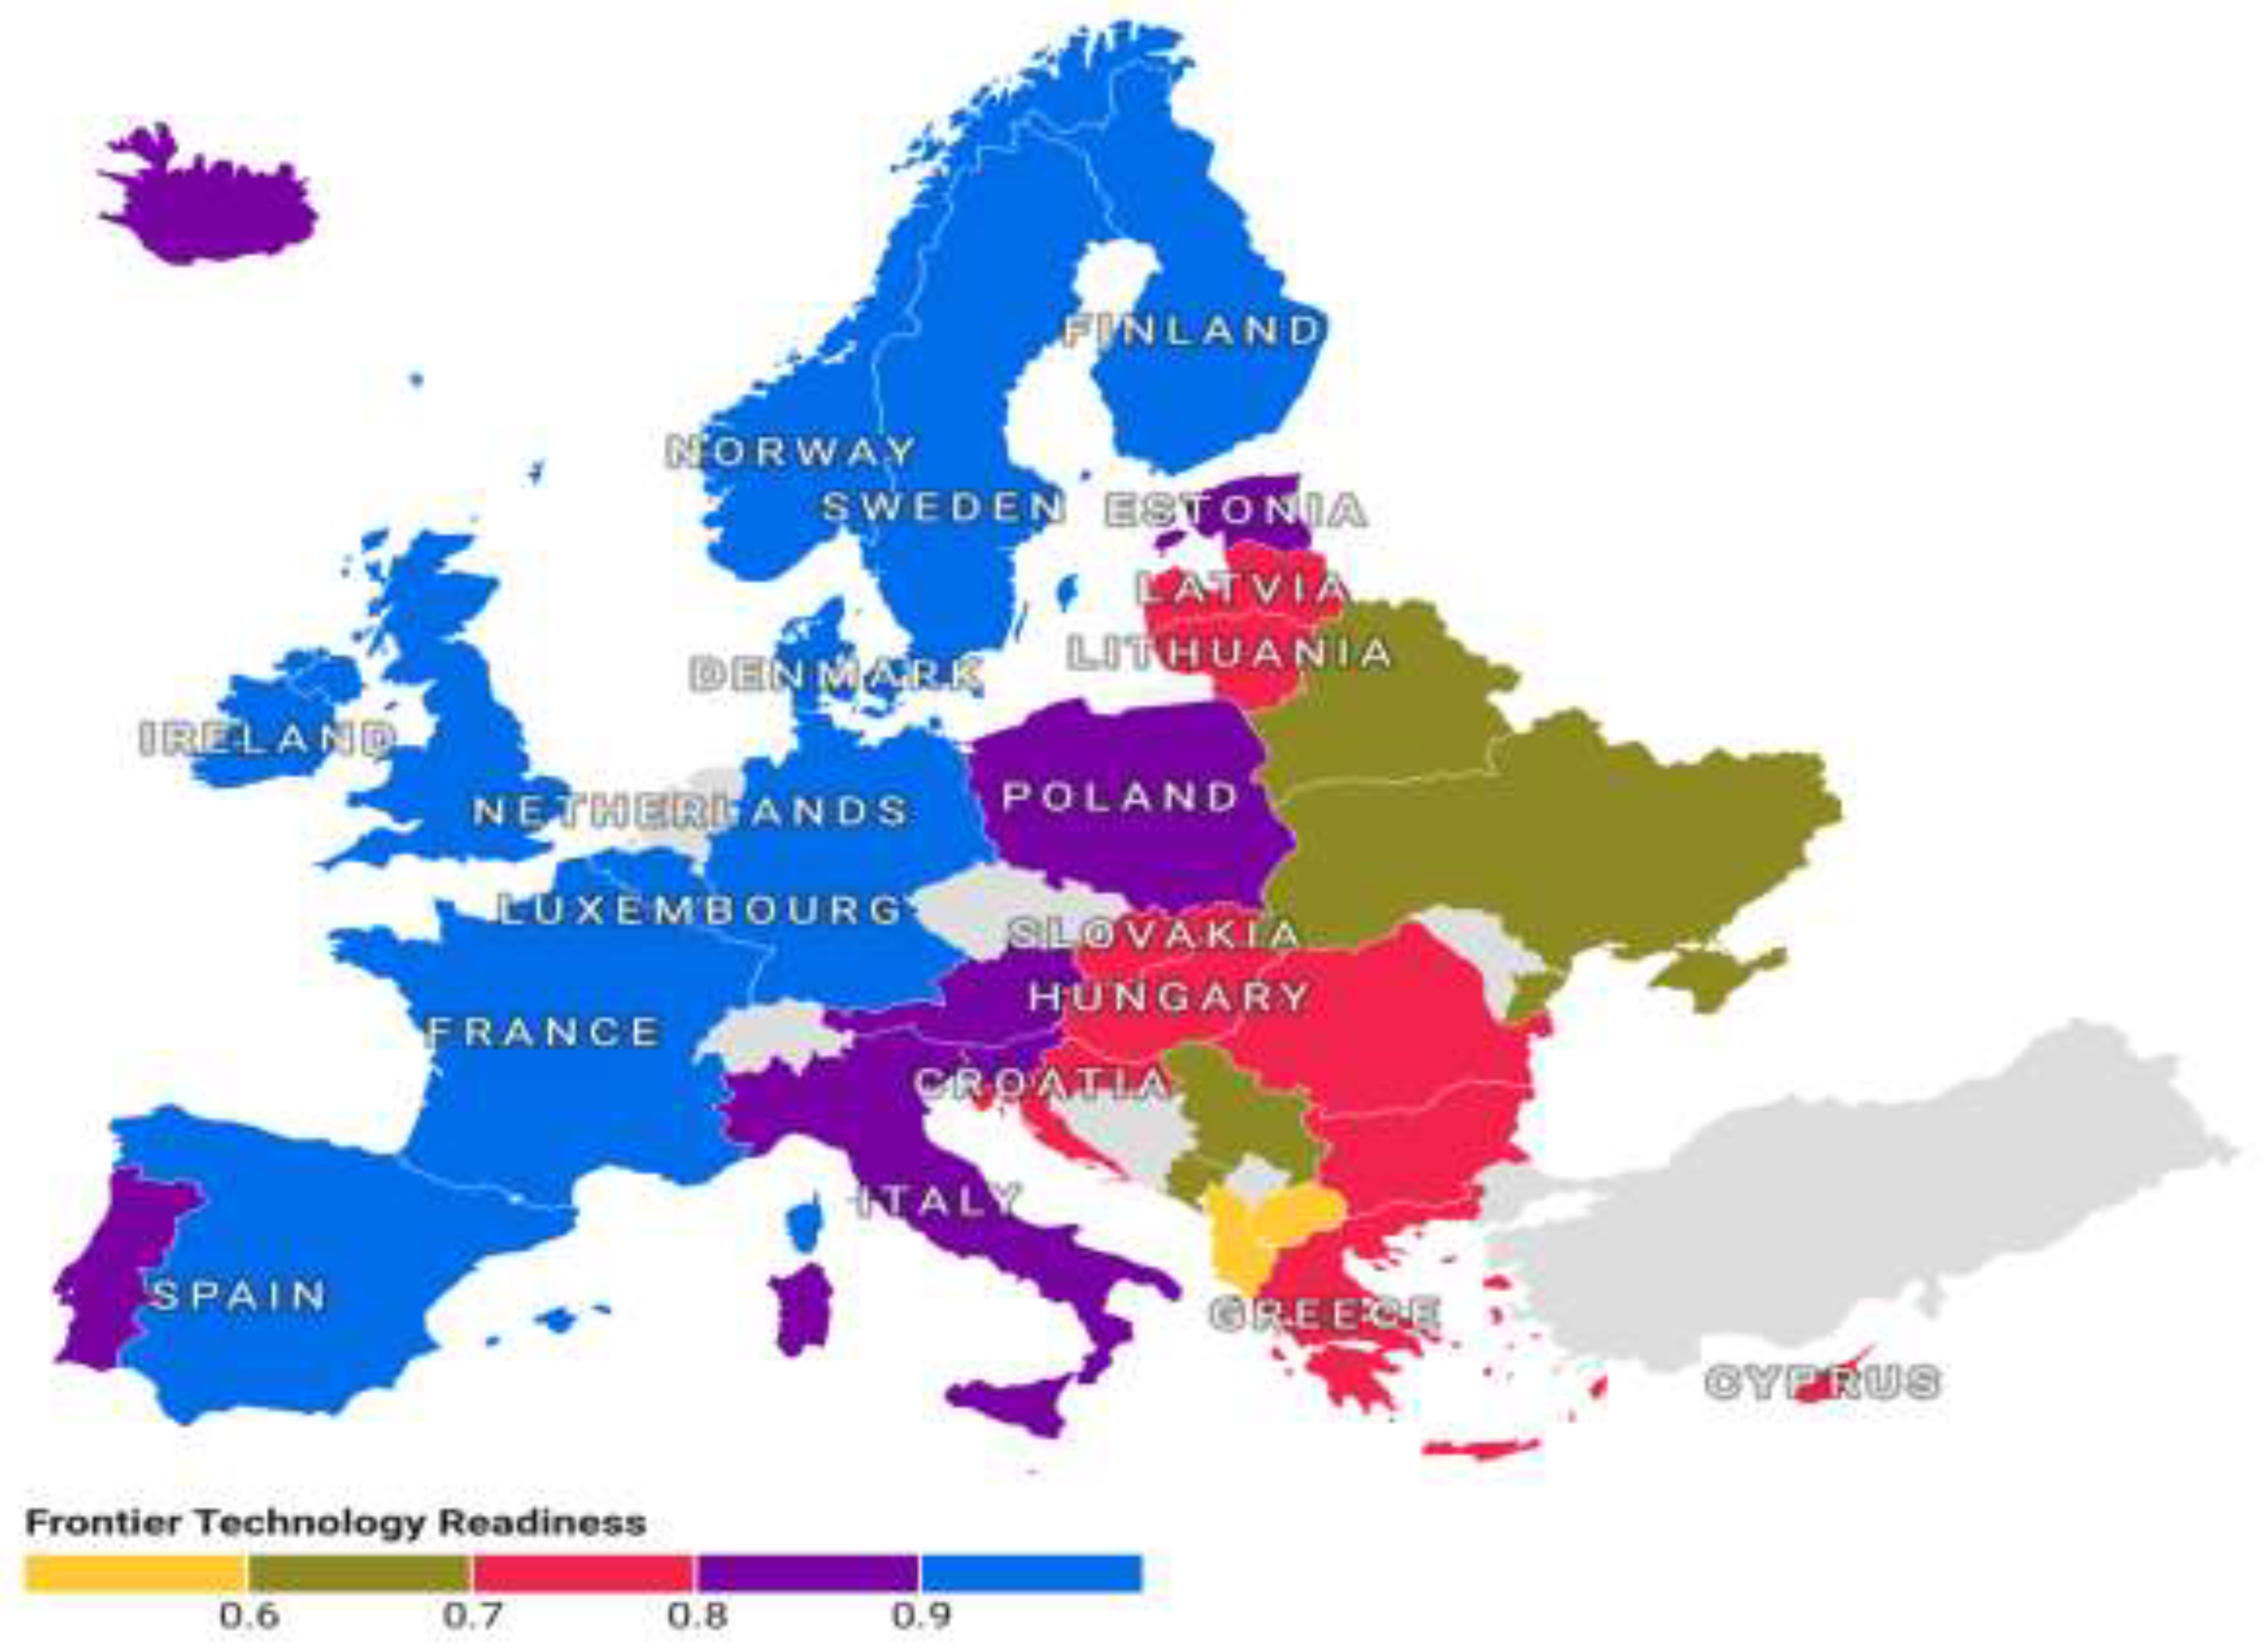
Figure 2.
Performance of EU Member States in IGG, 2000-2023.
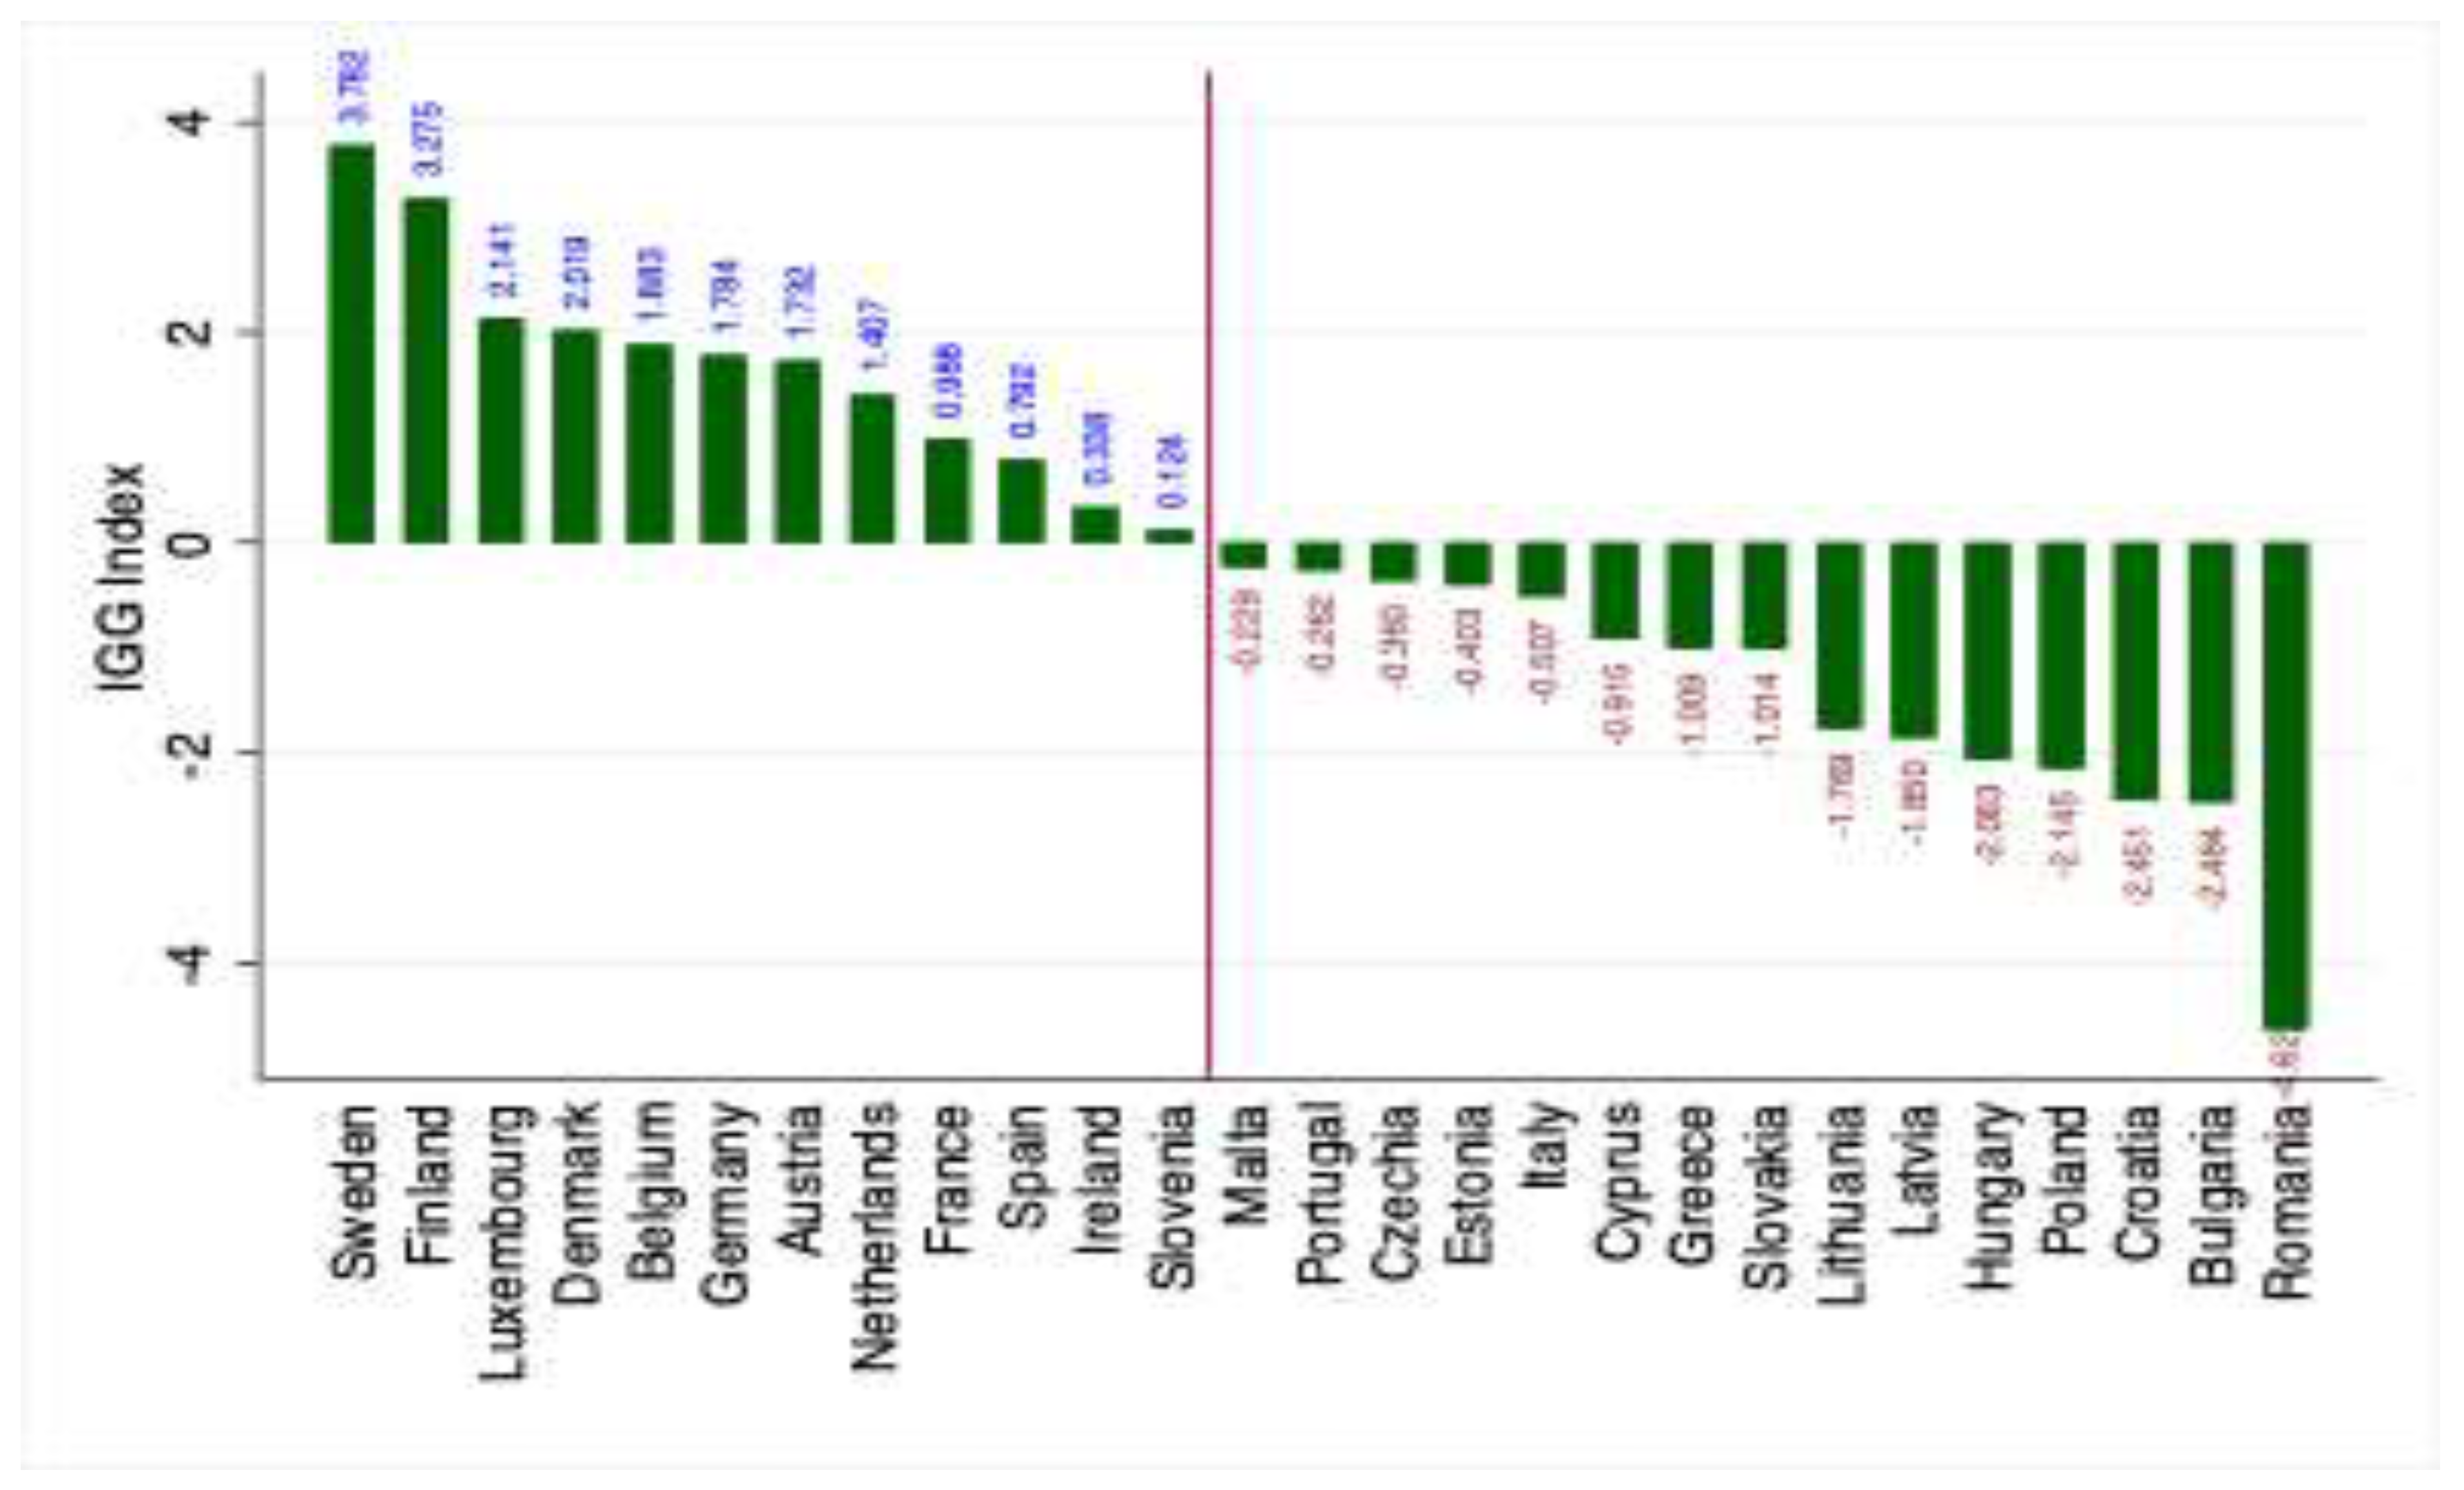
Table 1.
Summary statistics, 2000-2023.
| Variable | Obs. | Mean | Std. Dev. |
Min. | Max. |
|---|---|---|---|---|---|
| IGGINDEX | 537 | 0.000 | 2.021 | -5.984 | 4.238 |
| GDPG | 648 | 30921.6 | 22589.9 | 1621.2 | 133711.7 |
| GINI | 567 | 31.365 | 3.712 | 23.211 | 41.159 |
| GHG | 567 | 142.687 | 204.732 | -2.705 | 1037.365 |
| FTR | 648 | 0.457 | 0.397 | 0.000 | 1.000 |
| POLSTAB | 621 | 0.762 | 0.390 | -0.475 | 1.759 |
| TRADE | 648 | 119.301 | 58.999 | 45.141 | 394.221 |
| ELEC | 621 | 99.675 | 1.439 | 88.10 | 100.0 |
| POPG | 648 | 0.248 | 0.907 | -3.848 | 3.931 |
| REGU | 621 | 1.150 | 0.451 | -0.119 | 2.040 |
| FDI | 622 | 7.927 | 39.551 | -440.73 | 496.77 |
| TREV | 609 | 22.006 | 6.431 | 10.288 | 62.634 |
| GPC | 648 | 36670.4 | 20250.2 | 5848.8 | 144750.8 |
| GPC Sq. | 648 | 1.75e+09 | 2.45e+09 | 3.42e+07 | 2.10e+10 |
| GOVEF | 621 | 0.214 | 0.018 | 0.178 | 0.287 |
| VOICE | 621 | 1.105 | 0.345 | 0.259 | 1.801 |
Note: Obs. is observation; Std. Dev. Is standard deviation; Max. is Maximum; Min. is minimum.
Table 2.
Effects of FTR on IGG.
| Pooled OLS estimates | Driscoll-Kraay estimates | Sys-GMM estimates | |||||||
|---|---|---|---|---|---|---|---|---|---|
| Variables | 1 | 2 | 3 | 4 | 5 | 6 | 7 | 8 | 9 |
| FTR | 1.6649*** | 1.6661*** | -5.2164 | 1.6649*** | 1.6661*** | -5.2164 | -0.1908 | 0.2210 | -5.7921 |
| (0.134) | (0.135) | (10.598) | (0.336) | (0.339) | (7.931) | (0.149) | (0.209) | (6.848) | |
| POPG | 0.2041*** | 0.2044*** | 0.2055*** | 0.2041*** | 0.2044*** | 0.2055*** | -0.2436 | -0.3290** | -0.2093** |
| (0.072) | (0.072) | (0.072) | (0.045) | (0.043) | (0.044) | (0.149) | (0.134) | (0.096) | |
| FDI | -0.0022* | -0.0022* | -0.0022* | -0.0022*** | -0.0022*** | -0.0022*** | -0.0007 | -0.0007 | -0.0008* |
| (0.001) | (0.001) | (0.001) | (0.001) | (0.001) | (0.001) | (0.000) | (0.001) | (0.000) | |
| GOVEF | 0.9369 | 0.9368 | 0.9431 | 0.9369 | 0.9368 | 0.9431 | 0.8747 | 0.1860 | 0.3249 |
| (0.834) | (0.835) | (0.835) | (1.297) | (1.300) | (1.290) | (0.633) | (0.773) | (0.595) | |
| TRADE | -0.0024*** | -0.0024*** | -0.0024*** | -0.0024*** | -0.0024*** | -0.0024*** | 0.0007 | 0.0005 | -0.0000 |
| (0.001) | (0.001) | (0.001) | (0.000) | (0.000) | (0.000) | (0.000) | (0.000) | (0.000) | |
| VOICE | 4.4699*** | 4.4743*** | 4.4544*** | 4.4699*** | 4.4743*** | 4.4544*** | 1.0494*** | 2.0352*** | 1.7508*** |
| (0.160) | (0.170) | (0.173) | (0.248) | (0.279) | (0.286) | (0.317) | (0.498) | (0.217) | |
| ELEC | -0.0025 | -0.0125 | -0.0025 | -0.0125 | 0.1169 | 0.1100* | |||
| (0.033) | (0.036) | (0.036) | (0.033) | (0.070) | (0.056) | ||||
| FTR x ELEC | 0.0689 | 0.0689 | 0.0603 | ||||||
| (0.106) | (0.081) | (0.070) | |||||||
| Total effect of FTR | 1.6555*** | 1.6555*** | 0.2165 | ||||||
| (0.1363) | (0.3326) | (0.1889) | |||||||
| L.IGG | – | – | – | – | – | – | 0.9755*** | 0.7963*** | 0.8055*** |
| – | – | – | – | – | – | (0.075) | (0.102) | (0.092) | |
| Constant | -4.1098*** | -3.8684 | -2.8338 | -4.1098* | -3.8684 | -2.8338 | 0.3578 | -13.6475* | -12.3939** |
| (1.388) | (3.470) | (3.820) | (2.239) | (3.664) | (3.221) | (1.321) | (7.275) | (5.301) | |
| Observations | 494 | 494 | 494 | 494 | 494 | 494 | 468 | 468 | 468 |
| F-Statistics | 287.8*** | 246.2*** | 215.2*** | 818.8*** | 695.3*** | 877.4*** | 8517.5*** | 1813.2*** | 2188.7*** |
| Countries/Instruments | 26/- | 26/- | 26/- | 26/- | 26/- | 26/- | 26/21 | 26/21 | 26/25 |
| Hansen p-value | – | – | – | – | – | – | 0.2414 | 0.1697 | 0.2141 |
| AR(1)/AR(2) p-values | – | – | – | – | – | – | 0.0003/0.3327 | 0.0005/0.4243 | 0.0003/0.3768 |
Note: Standard errors in parentheses; * p < 0.10, ** p < 0.05, *** p < 0.1*Our evidence, thus, suggests that the diffusion of frontier technologies such as AI, robots, the IoTs, drones and 5G, in emerging and advanced economies, undermines IGG. This outcome can be rationalised from at least two interrelated perspectives. First, the literature shows that advanced technologies tend to exacerbate income inequality in adopting economies by disproportionately benefitting their developers and high-skilled labour (Aghion et al., 2019; Guellec & Paunov, 2017), while displacing low- and medium-skilled workers (Acemoglu et al., 2020). Second, broad-based deployment of frontier technologies, particularly those that expand digital infrastructure and data connectivity, can significantly increase energy demand and carbon emissions. Further, the short lifespan and rapid turnover of electronic devices and sensors generate electronic waste, which can adversely affect environmental quality and, consequently, IGG.
Table 3.
Effects of FTR on Economic Growth.
| Pooled OLS estimates | Driscoll-Kraay estimates | Sys-GMM estimates | |||||||
|---|---|---|---|---|---|---|---|---|---|
| Variables | 1 | 2 | 3 | 4 | 5 | 6 | 7 | 8 | 9 |
| FTR | 0.7090*** | 0.6390*** | -0.8998 | 0.7090*** | 0.6390*** | -0.8998 | -0.0179 | 0.0661 | -5.4115 |
| (0.056) | (0.053) | (5.093) | (0.206) | (0.186) | (4.691) | (0.028) | (0.046) | (13.273) | |
| POLSTAB | 0.4633*** | 0.3273*** | 0.3259*** | 0.4633*** | 0.3273*** | 0.3259*** | -0.0503 | -0.1698** | -0.1472** |
| (0.061) | (0.059) | (0.059) | (0.081) | (0.070) | (0.072) | (0.043) | (0.062) | (0.056) | |
| GFCF | -0.0114** | -0.0081* | -0.0079 | -0.0114 | -0.0081 | -0.0079 | 0.0090*** | 0.0158*** | 0.0150*** |
| (0.005) | (0.005) | (0.005) | (0.009) | (0.010) | (0.010) | (0.003) | (0.004) | (0.004) | |
| POPG | 0.4326*** | 0.3985*** | 0.3982*** | 0.4326*** | 0.3985*** | 0.3982*** | -0.0489 | -0.0489 | -0.0405 |
| (0.028) | (0.026) | (0.026) | (0.052) | (0.040) | (0.040) | (0.029) | (0.037) | (0.034) | |
| TREV | 0.1676** | 0.1744** | 0.1745** | 0.1676 | 0.1744* | 0.1745* | 0.8351*** | 1.3773*** | 1.1615*** |
| (0.085) | (0.079) | (0.079) | (0.110) | (0.098) | (0.098) | (0.287) | (0.390) | (0.370) | |
| ELEC | 0.1384*** | 0.1359*** | 0.1384*** | 0.1359*** | 0.1199** | 0.1057** | |||
| (0.015) | (0.017) | (0.018) | (0.016) | (0.047) | (0.045) | ||||
| FTR x ELEC | 0.0154 | 0.0154 | 0.0547 | ||||||
| (0.051) | (0.047) | (0.133) | |||||||
| Total effect | 0.6366*** | 0.6366*** | 0.0423 | ||||||
| (0.0533) | (0.1862) | (0.0467) | |||||||
| L.GDPG | – | – | – | – | – | – | 0.9260*** | 0.7701*** | 0.7850*** |
| – | – | – | – | – | – | (0.021) | (0.054) | (0.047) | |
| Constant | 9.0147*** | -4.7262*** | -4.4847*** | 9.0147*** | -4.7262** | -4.4847** | -1.8815** | -14.0199*** | -12.0954** |
| (0.301) | (1.525) | (1.723) | (0.531) | (2.045) | (1.714) | (0.765) | (4.970) | (4.811) | |
| Observations | 583 | 583 | 583 | 583 | 583 | 583 | 557 | 557 | 557 |
| F-Statistics | 62.1135 | 84.5857 | 72.5424 | 498.9318 | 1177.3773 | 1231.6628 | 40906.9963 | 20421.7585 | 21644.3747 |
| Countries/Instruments | 27/- | 27/- | 27/- | 27/- | 27/- | 27/- | 27/13 | 27/13 | 27/13 |
| Hansen p-value | – | – | – | – | – | – | 0.0008 | 0.0013 | 0.0004 |
| AR(1)/ AR(2) p-values | – | – | – | – | – | – | 0.000/0.000 | 0.0001/0.0004 | 0.0003/0.0001 |
Note: Standard errors in parentheses; * p < 0.10, ** p < 0.05, *** p < 0.1*According to Ofori et al. (2025), this growth-enhancing effect of frontier technologies operates through three interrelated channels: production efficiency, new industries and employment, and human capital development. First, frontier technologies stimulate open innovation and optimise resource allocation. For instance, tools such as 3D printing, robotics, drones, and industrial IoT systems enhance production design, automate routine tasks, and improve monitoring processes, thereby increasing productivity and reducing labour costs (Gonzales, 2023). Second, Hötte et al. (2022) have shown that frontier technologies catalyse the emergence of new industries and revenue streams that drive net job creation and economic growth. For instance, AI-based solutions like AgriDiagnose and KaraAgro AI promote precision agriculture (Delay et al., 2022), while fintech platforms such as Wise and Revolut facilitate efficient transactions and business expansion (Broby, 2021). Third, frontier technologies advance human capital development by enabling distance learning, reskilling, and upskilling through platforms such as EduTech, Copilot, DeepSeek, and ChatGPT (Morandini et al., 2023). Likewise, drones such as Zipline facilitate the delivery of medical supplies, while AI platforms, including AI chatbots, MDLive, and Teladoc Health, enhance telemedicine (see, e.g., Umlauf & Burchardt, 2022; Reddy et al., 2019). These mechanisms collectively foster productivity-led and inclusive economic expansion.
Table 4.
Effects of FTR on Income Inequality.
| Pooled OLS estimates | Driscoll-Kraay estimates | Sys-GMM estimates | |||||||
|---|---|---|---|---|---|---|---|---|---|
| Variables | 1 | 2 | 3 | 4 | 5 | 6 | 7 | 8 | 9 |
| FTR | 0.0177 | 0.0181 | 5.6089*** | 0.0177 | 0.0181 | 5.6089*** | 0.0067** | 0.0050** | 2.9212** |
| (0.016) | (0.016) | (1.214) | (0.012) | (0.011) | (1.414) | (0.002) | (0.002) | (1.051) | |
| FDI | 0.0000 | 0.0000 | 0.0000 | 0.0000 | 0.0000 | 0.0000 | -0.0000** | -0.0000** | 0.0000 |
| (0.000) | (0.000) | (0.000) | (0.000) | (0.000) | (0.000) | (0.000) | (0.000) | (0.000) | |
| REGU | -0.0814*** | -0.0815*** | -0.0798*** | -0.0814*** | -0.0815*** | -0.0798*** | 0.0040* | 0.0025 | -0.0006 |
| (0.015) | (0.015) | (0.014) | (0.008) | (0.008) | (0.008) | (0.002) | (0.002) | (0.002) | |
| GPC | -1.6254*** | -1.6465*** | -2.0546*** | -1.6254** | -1.6465** | -2.0546*** | -0.0031 | 0.0477 | -0.4296** |
| (0.276) | (0.316) | (0.322) | (0.597) | (0.598) | (0.599) | (0.056) | (0.073) | (0.156) | |
| GPC Sq. | 0.0792*** | 0.0802*** | 0.1003*** | 0.0792** | 0.0802** | 0.1003*** | -0.0004 | -0.0026 | 0.0207** |
| (0.014) | (0.015) | (0.016) | (0.029) | (0.029) | (0.029) | (0.003) | (0.003) | (0.008) | |
| TRADE | -0.0005*** | -0.0005*** | -0.0006*** | -0.0005*** | -0.0005*** | -0.0006*** | -0.0000 | -0.0000 | -0.0001** |
| (0.000) | (0.000) | (0.000) | (0.000) | (0.000) | (0.000) | (0.000) | (0.000) | (0.000) | |
| ELEC | 0.0006 | 0.0121** | 0.0006 | 0.0121** | -0.0031*** | 0.0054* | |||
| (0.004) | (0.005) | (0.004) | (0.005) | (0.001) | (0.003) | ||||
| FTR x ELEC | -0.0560*** | -0.0560*** | -0.0292** | ||||||
| (0.012) | (0.014) | (0.011) | |||||||
| Total effect | 0.0180*** | 0.0262*** | o.0111*** | ||||||
| (0.0065) | (0.0125) | (0.0027) | |||||||
| L.GINI | – | – | – | – | – | – | 0.9506*** | 0.9376*** | 0.9201*** |
| – | – | – | – | – | – | (0.015) | (0.016) | (0.016) | |
| Constant | 11.9018*** | 11.9557*** | 12.8864*** | 11.9018*** | 11.9557*** | 12.8864*** | 0.2374 | 0.2993 | 1.9712*** |
| (1.410) | (1.464) | (1.450) | (3.123) | (3.111) | (2.905) | (0.303) | (0.314) | (0.507) | |
| Observations | 519 | 519 | 519 | 519 | 519 | 519 | 494 | 494 | 494 |
| F-statistics | 21.0*** | 17.9*** | 19.0*** | 35.0002*** | 68.3234*** | 132.6786*** | 2.9214e+08*** | 1.8681e+08*** | 1.4377e+08*** |
| Countries/Instruments | 26/- | 26/- | 26/- | 26/- | 26/- | 26/- | 26/26 | 26/26 | 26/26 |
| Hansen p-value | – | – | – | – | – | – | 0.2982 | 0.2593 | 0.3514 |
| AR(1)/AR(2) p-values | – | – | – | – | – | – | 0.0005/0.9451 | 0.0006/0.9579 | 0.0004/0.9113 |
Note: GPC Sq. is the square of average income; Standard errors in parentheses; * p < 0.10, ** p < 0.05, *** p < 0.1*.
Table 5.
Effects of FTR on the greenhouse emissions.
| Pooled OLS estimates | Driscoll-Kraay estimates | Sys-GMM estimates | |||||||
|---|---|---|---|---|---|---|---|---|---|
| Variables | 1 | 2 | 3 | 4 | 5 | 6 | 7 | 8 | 9 |
| FTR | -0.4546*** | -0.5065*** | 9.3217 | -0.4546*** | -0.5065*** | 9.3217 | -0.0646*** | -0.0717*** | -6.4903 |
| (0.162) | (0.164) | (12.008) | (0.144) | (0.136) | (7.509) | (0.015) | (0.011) | (9.307) | |
| FDI | -0.0056*** | -0.0057*** | -0.0056*** | -0.0056*** | -0.0057*** | -0.0056*** | -0.0003 | -0.0002 | -0.0003 |
| (0.001) | (0.001) | (0.001) | (0.001) | (0.001) | (0.001) | (0.000) | (0.000) | (0.000) | |
| REGU | -0.1634 | -0.1575 | -0.1540 | -0.1634** | -0.1575** | -0.1540** | 0.0193 | 0.0164 | 0.0259 |
| (0.143) | (0.143) | (0.143) | (0.070) | (0.072) | (0.070) | (0.022) | (0.017) | (0.020) | |
| GPC | -5.9740** | -2.3309 | -3.1136 | -5.9740*** | -2.3309 | -3.1136 | 2.6328** | 2.1092** | 2.3832** |
| (2.747) | (3.209) | (3.350) | (1.649) | (2.695) | (3.058) | (0.962) | (0.814) | (1.013) | |
| GPC Sq. | 0.3543*** | 0.1834 | 0.2217 | 0.3543*** | 0.1834 | 0.2217 | -0.1278*** | -0.1013** | -0.1149** |
| (0.135) | (0.156) | (0.163) | (0.085) | (0.135) | (0.153) | (0.046) | (0.038) | (0.048) | |
| TRADE | -0.0167*** | -0.0164*** | -0.0165*** | -0.0167*** | -0.0164*** | -0.0165*** | 0.0003 | 0.0002 | 0.0002 |
| (0.001) | (0.001) | (0.001) | (0.001) | (0.001) | (0.001) | (0.000) | (0.000) | (0.000) | |
| POPG | 0.0459 | 0.0507 | 0.0508 | 0.0459 | 0.0507 | 0.0508 | -0.0165 | -0.0162 | -0.0078 |
| (0.083) | (0.083) | (0.083) | (0.103) | (0.108) | (0.108) | (0.014) | (0.013) | (0.015) | |
| ELEC | -0.0922** | -0.0712 | -0.0922*** | -0.0712* | -0.0104 | -0.0391 | |||
| (0.042) | (0.050) | (0.028) | (0.034) | (0.023) | (0.042) | ||||
| FTR X ELEC | -0.0985 | -0.0985 | 0.0645 | ||||||
| (0.120) | (0.076) | (0.093) | |||||||
| Total effect | -0.4912*** | -0.4912*** | -0.0601*** | ||||||
| (0.1646) | (0.1254) | (0.0131) | |||||||
| L.GHG | – | – | – | – | – | – | 0.9794*** | 0.9808*** | 0.9766*** |
| – | – | – | – | – | – | (0.029) | (0.033) | (0.034) | |
| Constant | 30.3870** | 20.2040 | 22.1192 | 30.3870*** | 20.2040* | 22.1192* | -13.4781** | -9.8471*** | -8.3816*** |
| (14.048) | (14.761) | (14.950) | (8.017) | (11.351) | (12.238) | (4.915) | (2.738) | (2.674) | |
| Observations | 516 | 516 | 516 | 516 | 516 | 516 | 491 | 491 | 491 |
| F-statistics | 52.2*** | 46.6*** | 41.5*** | 181.002*** | 468.4*** | 458.0*** | 439809.6*** | 5223708.3*** | 1303901.2*** |
| Countries/Instruments | 26/- | 26/- | 26/- | 26/- | 26/- | 26/- | 26/25 | 26/28 | 26/28 |
| Hansen p-value | – | – | – | – | – | – | 0.1437 | 0.1426 | 0.1381 |
| AR(1)/AR(2) p-values | – | – | – | – | – | – | 0.0056/0.1942 | 0.0068/0.2014 | 0.0059/0.2548 |
Note: GPC Sq. is the square of average income; Standard errors in parentheses; * p < 0.10, ** p < 0.05, *** p < 0.1*Ding et al. (2022) and Yu et al. (2023), for instance, suggest that when electricity is generated from renewable sources, it can significantly improve the energy saving and lower the carbon footprint of robots, electric vehicles, drones, and 5G systems.
Disclaimer/Publisher’s Note: The statements, opinions and data contained in all publications are solely those of the individual author(s) and contributor(s) and not of MDPI and/or the editor(s). MDPI and/or the editor(s) disclaim responsibility for any injury to people or property resulting from any ideas, methods, instructions or products referred to in the content. |
© 2026 by the authors. Licensee MDPI, Basel, Switzerland. This article is an open access article distributed under the terms and conditions of the Creative Commons Attribution (CC BY) license (http://creativecommons.org/licenses/by/4.0/).
Copyright: This open access article is published under a Creative Commons CC BY 4.0 license, which permit the free download, distribution, and reuse, provided that the author and preprint are cited in any reuse.


