
Submitted:
20 January 2026
Posted:
21 January 2026
You are already at the latest version
Abstract
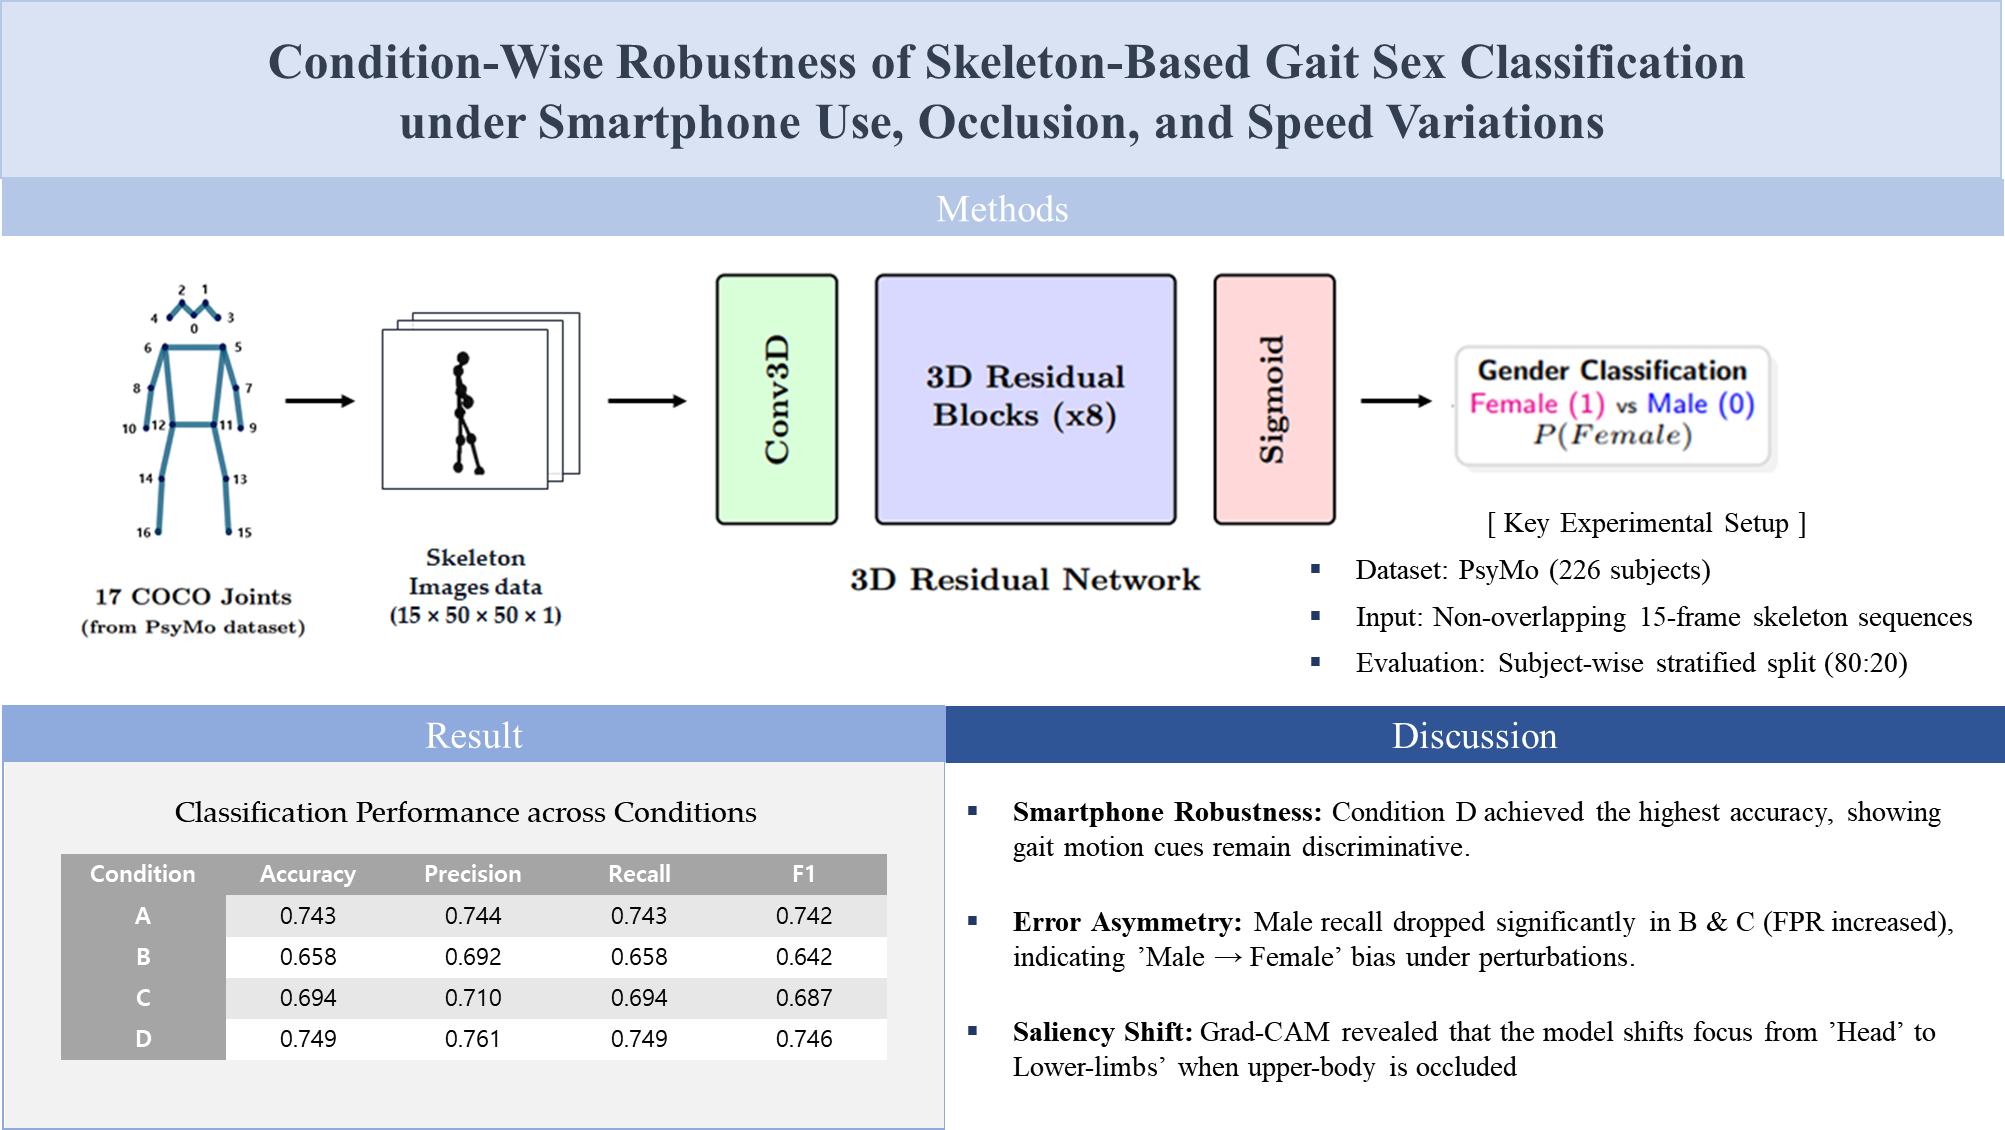
Gait is a repetitive whole-body movement that encodes inter-segmental coordination and spatiotemporal patterns and has been used not only for identity recognition but also for inferring attributes such as sex. Many vision-based approaches, however, rely on appearance cues, which are sensitive to occlusion and clothing variation and may raise privacy concerns; robustness under everyday perturbations remains insufficiently quantified. Here, we investigate skeleton-based gait sex classification using 2D pose sequences from the PsyMo dataset. We rendered 17 COCO keypoints into 50×50 grayscale skeleton images and trained a 3D residual CNN on non-overlapping 15-frame clips. Evaluation used a subject-wise, stratified split with balanced sexes, and the same test-subject set was shared across four aggregated conditions (A: overall; B: partial occlusion/carrying; C: speed changes; D: smartphone use). Accuracy ranged from 0.658 to 0.749, with the lowest performance in B. Confusion-matrix–based error decomposition with subject-level bootstrap confidence intervals revealed pronounced sex-wise error asymmetry in B and C, driven by reduced male recall and increased male-to-female misclassification. In D, a simple arm-swing amplitude index was not significantly associated with prediction confidence or misclassification. Grad-CAM quantification further suggested that joint-group importance shifts across conditions, indicating condition-dependent reliance on motion cues.
Keywords:
gait
; sex classification
; 2D pose estimation
; skeleton representation
; robustness
; occlusion
; walking speed
; smartphone dual-task
; Grad-CAM
; subgroup error
1. Introduction
Gait is one of the most frequently repeated whole-body movements in daily life and involves inter-segmental coordination and periodic motor patterns. Owing to these characteristics, gait has long been used as a biometric signal for personal identification [1], and recent research has expanded its scope beyond identity to infer attributes such as age [2], disease status [3], and emotion [4].
Among these attributes, sex has been considered useful either as prior information in medical settings and security and surveillance environments [5] or as a means to rapidly capture user context in human–computer interaction [6] and personalized services [7]. Accordingly, vision-based sex classification has been extensively studied; however, many approaches have relied on appearance cues such as the face, hair, and clothing [8], making them vulnerable to occlusion, changes in apparel, and variations in camera distance and viewpoint. In addition, face-based analysis can impose privacy and ethical burdens [9]. (Hereafter, we use “sex” to denote the binary label provided by the dataset.)
To address these limitations, gait-based sex classification that leverages motion cues rather than appearance cues has been repeatedly proposed. Studies exploiting the dynamical cues of gait have reported the feasibility of sex classification in controlled settings [10,11], and joint-based skeleton representations are useful because they summarize movement structure without directly revealing body shape. For example, studies using sensor-derived joint information from devices such as Kinect have reported high classification performance under controlled conditions [12,13]. However, such approaches face practical constraints in everyday deployment due to hardware dependency and installation requirements.
Moreover, a substantial portion of prior work has focused on reporting performance in laboratory or semi-controlled environments; comparatively fewer studies have systematically examined how model performance changes under perturbations that frequently occur in daily life and whether such changes relate to weakened motion cues. In particular, smartphone texting represents a prototypical dual-task condition that simultaneously demands cognitive, visual, and upper-limb tasks, and it has been reported to significantly alter gait speed, spatiotemporal gait parameters, and postural control strategies [14,15]. Therefore, analyses that jointly characterize real-world robustness and the causes of condition-specific performance degradation are important for discussing the practical applicability of gait-based sex classification.
These questions have been difficult to address, largely because large-scale acquisition of joint information in everyday environments and validation across diverse conditions have been constrained. Recently, however, pose estimation methods that can stably estimate 2D joints in multi-person scenes using RGB videos alone have become widespread [16], and datasets that include representations such as skeletons have been released [17], providing a basis for evaluation and interpretation under naturalistic conditions without additional sensors. Nevertheless, studies remain scarce that quantitatively explain not only how sex-classification performance varies under everyday perturbations but also which subgroups exhibit increased errors across conditions and how performance degradation relates to weakened motion cues.
The main contributions of this study are as follows:
- We systematically compare skeleton-based sex-classification performance across four walking conditions involving realistic perturbations—smartphone use, partial occlusion, and speed variations—and quantitatively assess applicability under everyday conditions.
- We decompose errors based on condition-wise and sex-group–wise precision and recall, quantifying under which conditions misclassification increases and in which subgroup. Under the smartphone-use condition, we compute changes in upper-limb motion using simple kinematic indices and analyze how these changes relate to prediction confidence and increased misclassification.
- Using Grad-CAM–based saliency analysis, we quantify importance at the joint level and across gait segments and show how condition-dependent performance variations relate to weakened motion cues.
2. Materials and Methods
2.1. Dataset and Experimental Conditions
This study used the PsyMo dataset, which was constructed for analyzing psychological characteristics and gait [17]. PsyMo contains seven walking conditions (NM, CL, BG, WSS, WSF, TXT, PH) recorded from six camera viewpoints and provides metadata including sex, along with silhouette-, skeleton-, and SMPL-based representations for gait data from a total of 312 subjects (199 male and 113 female). In this study, we used the provided 2D skeleton representation and the sex labels, and we restricted the analysis to the 90° side-view data to reduce the influence of appearance variations across viewpoints. The 2D skeleton is provided as keypoints for 17 COCO-format joints (Figure 1); from each frame’s keypoints vector, we extracted only the x and y coordinates to construct subsequent inputs. The PsyMo data may include multiple recording units (takes) per subject for each condition. We generated clips from all valid takes corresponding to the target conditions (A–D), while performing the training/evaluation split at the subject level (subject-wise) so that takes or clips from the same subject did not simultaneously appear in both the training and test sets. Accordingly, even when multiple takes existed per subject, we compared condition-wise performance under a setting that mitigates information leakage and performance overestimation due to repeated recordings.

Table 1.
Seven walking conditions.
| Abbreviation | Meaning | Abbreviation | Meaning |
|---|---|---|---|
| NM | Normal walking | WSF | Walking speed fast |
| CL | Changing clothing | TXT | Walking while texting |
| BG | Carry bag | PH | Talking on the phone |
| WSS | Walking speed slow |
To compare sex-classification accuracy across walking conditions, we reorganized the seven PsyMo walking conditions (NM, CL, BG, WSS, WSF, TXT, PH) into four aggregated settings based on similar factors, as shown in Table 2. The overall condition (A) included NM, CL, BG, WSS, WSF, TXT, and PH; the partial-occlusion condition (B) included NM, CL, and BG; the speed-variation condition (C) included NM, WSS, and WSF; and the smartphone-use condition (D) included NM, TXT, and PH.
2.2. Skeleton Preprocessing and Input Representation
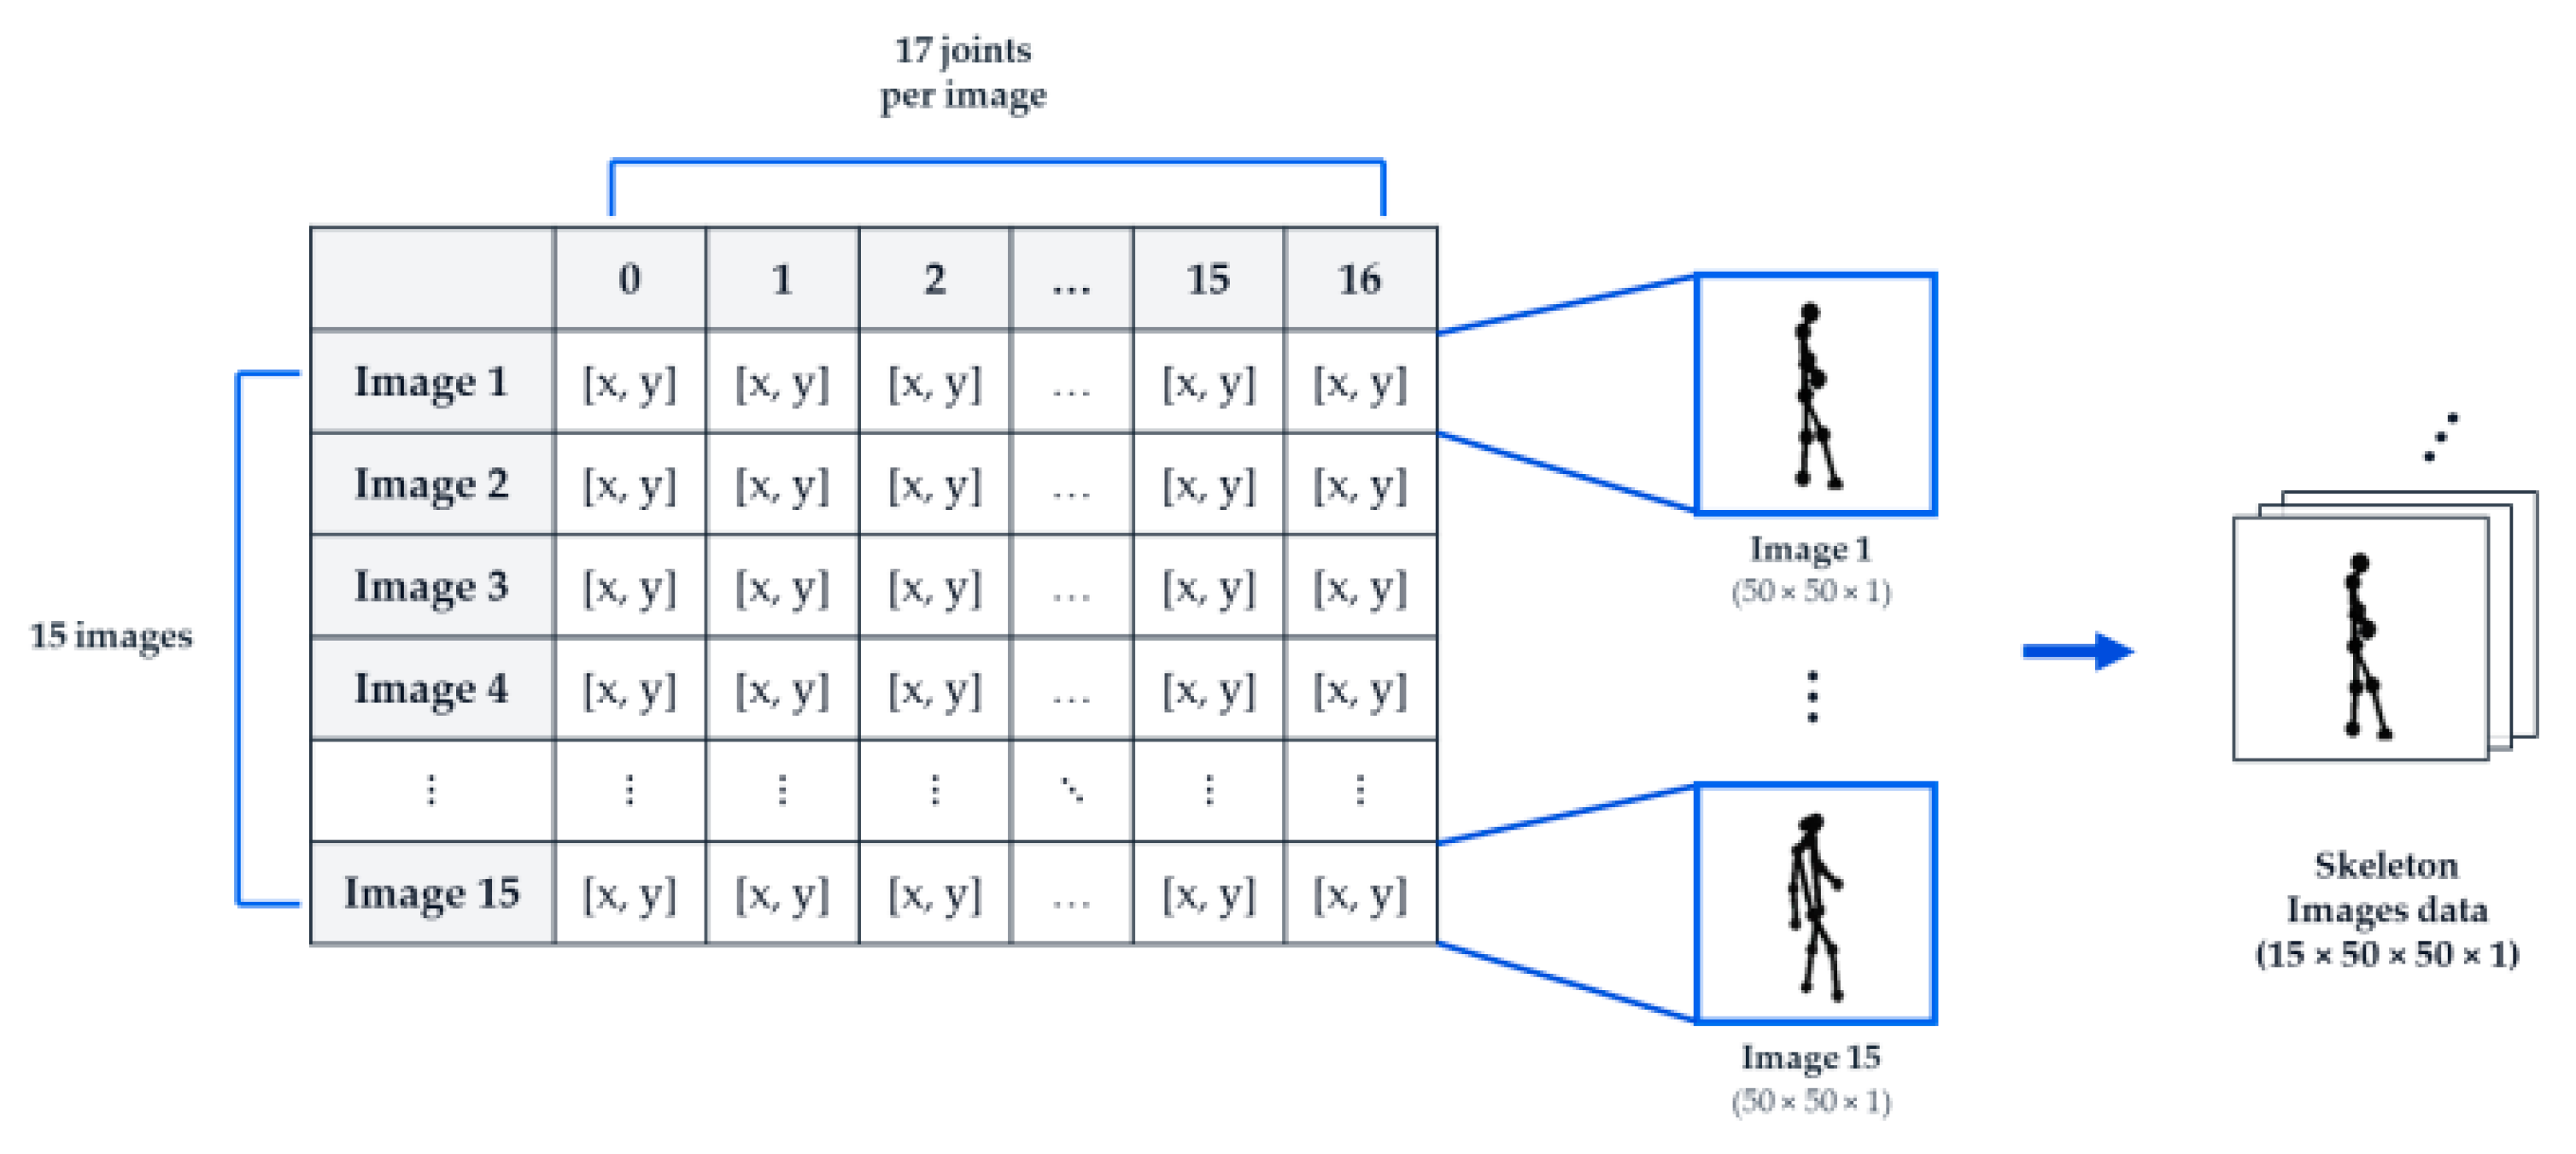
2D From each frame’s keypoints vector, we extracted only the x and y coordinates of the 17 joints and visualized the skeleton by drawing inter-joint connections according to the COCO joint definitions and connectivity rules. During visualization, we computed a scale using the per-frame minimum and maximum joint coordinates and normalized the coordinates so that the skeleton was centered and aligned to a consistent size within a 50×50 single-channel image.
Although gait-cycle–based segmentation and phase alignment can facilitate interpretation, they require prior detection of gait events such as heel strike. In this study, because the input was limited to 2D skeleton-rendered images and we judged the reliability of event detection to be insufficient, we constructed inputs as non-overlapping 15-frame clips using up to 45 frames per sequence instead of detecting and segmenting gait cycles. Specifically, we generated up to three 15-frame clips per sequence—frames (1–15), (16–30), and (31–45)—and defined each clip as one model input. Clips with fewer than 15 frames were excluded. The final input tensor had the shape (15, 50, 50, 1), and the rendered images were scaled to the range 0–1 during training by dividing pixel values by 255.
We encoded sex labels as 0 for male and 1 for female for training and inference. To mitigate sex imbalance, we randomly removed 86 male subjects (seed = 42), resulting in a balanced cohort of 226 subjects (113 male and 113 female). We then applied a subject-wise stratified split (80:20) to create training and test sets comprising 180 and 46 subjects, respectively (test set: 23 male and 23 female). After preprocessing and 15-frame clip construction, the numbers of clips in the training set were 7,509/3,220/3,220/3,213 for conditions A/B/C/D, and the corresponding numbers in the test set were 1,923/825/823/821 (Table 2). The four aggregated conditions (A–D) shared the same subject split; therefore, differences in sample size across conditions reflect the included walking types and the resulting number of valid clips rather than differences in subject composition.
Figure 2.
Preprocessing pipeline for constructing model input sequences from 2D joint coordinates. The skeleton is rendered from 17 joint coordinates, converted to a 50×50×1 image, and min–max normalization is applied. A sequence is then constructed from 15 images, yielding a final input tensor shape of (15, 50, 50, 1).
2.3. Sex Classification Model and Baseline Evaluation
2.3.1. Model Architecture
To classify sex from 15-frame input clips (15×50×50×1) composed of 2D skeleton-rendered images, we used a 3D convolutional residual neural network [18,19]. In the initial stage, the network extracts low-level spatiotemporal features using a 7×7×7 Conv3D (stride 2)–Batch Normalization (BN)–ReLU block and a 3×3×3 MaxPool3D (stride 2). It then comprises four stages in which the number of channels increases to 64, 128, 256, and 512, respectively, and each stage contains two residual blocks (×2) to learn hierarchical representations. In each residual block, the main path consists of Conv3D–BN–ReLU–Conv3D–BN. When a stride change or a mismatch between input and output channels occurs, the skip path applies a 1×1×1 Conv3D (with the same stride) to match dimensions; the block then combines the two paths via element-wise addition followed by ReLU.
At the final stage, the network aggregates features using Global Average Pooling 3D, passes them through a fully connected layer (256 units, ReLU), and produces a sigmoid output representing the probability of being female (1). The overall architecture is shown in Figure 3. This design enables direct learning of gait spatiotemporal patterns, including the temporal dimension, via 3D convolutions, improves training stability through residual connections, and reduces the number of parameters via Global Average Pooling to mitigate overfitting under limited data.
2.3.2. Training Protocol and Evaluation Metric
We trained the model for 100 epochs with a batch size of 32. We used binary cross-entropy as the loss function and Adam as the optimizer. For learning-rate scheduling, we applied ReduceLROnPlateau based on the validation loss, with a factor of 0.2, patience of 20, and a minimum learning rate of 1e-5. During training, we used 20% of the training data as a validation set constructed via a subject-wise stratified split (StratifiedShuffleSplit) within the training-subject set, ensuring that clips from the same subject did not simultaneously appear in both the training and validation sets.
We evaluated performance using accuracy, precision, recall, F1-score, and the confusion matrix. We also reported class-wise precision and recall using a classification report.
2.4. Robustness and Interpretation Analyses
2.4.1. Error Decomposition by Condition and Sex
To quantify condition-dependent error patterns, we computed confusion matrices on the test set for each condition (A–D) and reported accuracy, precision, recall, and F1-score. To compare sex-group–specific error bias, we additionally reported class-wise precision and recall for male (0) and female (1) under each condition. Defining female (1) as the positive class, we further computed the false positive rate (FPR), i.e., the proportion of males misclassified as females, and the false negative rate (FNR), i.e., the proportion of females misclassified as males. We obtained predicted labels by binarizing the model’s predicted probabilities using a threshold of 0.5.
We assessed uncertainty in condition-wise performance differences using subject-level nonparametric bootstrap resampling (1,000 resamples; 95% percentile confidence intervals) [20]. In each resample, we sampled test-set subjects with replacement and included all clips from the selected subjects when computing metrics, thereby estimating confidence intervals that reflect subject-level variability. We defined confidence intervals as the 2.5th–97.5th percentiles of the resampled distributions and reported 95% confidence intervals for accuracy and sex-group–specific precision/recall.
2.4.2. Kinematic Evidence Under Smartphone Use
Motivated by prior studies reporting that smartphone texting alters spatiotemporal gait parameters and gait strategies [14,15], we computed a simple kinematic index representing arm swing from 2D skeleton coordinates under the smartphone-use condition (D) to evaluate how upper-limb constraints relate to classification performance and prediction confidence. Using bilateral wrist and shoulder joints, we computed, for each 15-frame clip, the left–right amplitude range (max–min) of the wrists in a shoulder-centered coordinate frame. We normalized this value by the mean shoulder width (distance between left and right shoulders) to account for differences in body size and scale, and we defined the clip-level arm-swing index as the mean of the left and right wrist amplitudes. We defined prediction confidence such that it increases as the predicted probability moves farther from 0.5, and we evaluated the association between the arm-swing index and confidence using Spearman correlation. We further tested differences in the index between correctly and incorrectly classified samples using the Mann–Whitney U test.
2.4.3. Grad-CAM–Based Importance Quantification
To quantitatively relate condition-dependent performance variations to changes in motion cues, we applied a Grad-CAM–based interpretation method [21]. For each 3D CNN classifier trained under conditions (A–D), we computed Grad-CAM using gradients with respect to the Conv3D feature maps for the model output and applied ReLU to retain only positive contributions. We then applied clip-wise min–max normalization to the resulting CAM and upsampled it to the input resolution (50×50) to obtain a spatiotemporal saliency map for each 15-frame clip.
To compute joint-based importance, we mapped each frame’s joint coordinates to the 50×50 coordinate system using the same procedure as for the input skeleton images and accumulated CAM values within a radius r (default: 2 pixels) around each joint. We aggregated joint-wise importance into four joint groups (head, upper, trunk, lower; dis-joint4) and normalized by the group sum so that the total group importance summed to 1. We summarized joint-group importance by averaging within each condition and additionally computed averages by walking type.
To examine long-range temporal trends in frame importance, we concatenated the frame-wise Grad-CAM sums (raw frame mass) from three consecutive 15-frame clips within the same sequence in chronological order, thereby constructing a 45-frame importance distribution. Because we did not perform event-based phase alignment, we partitioned the 45 frames into three segments (1–15, 16–30, 31–45), defined them as early/mid/late temporal segments, and compared segment-wise importance distributions.
3. Results
3.1. Baseline Sex Classification Performance Across Walking Conditions
Under a stringent evaluation setting with a subject-wise split, the 3D residual network trained on 15-frame skeleton clips achieved an accuracy of 0.658–0.749 across the four walking conditions (A–D) (Table 3). The numbers of test clips were 1,923 for A, 825 for B, 823 for C, and 821 for D. Overall, the highest accuracy was observed under the smartphone-use condition (D; 0.749), whereas the lowest performance was observed under the partial-occlusion condition (B; 0.658).
3.2. Error Decomposition by Condition and Sex
To compare error patterns under condition changes, we computed confusion-matrix–based metrics for each condition (A–D) and summarized sex-group–specific precision/recall and error rates (FPR and FNR). We assessed uncertainty in between-condition differences using subject-level nonparametric bootstrap resampling (1,000 resamples) and reported 95% confidence intervals for accuracy and sex-group–specific precision/recall. The results are shown in Table 4.
In condition A, female and male recall values were relatively balanced (0.713 and 0.772, respectively). In contrast, conditions B and C showed pronounced sex-wise error asymmetry: female recall remained high (0.870 and 0.835), whereas male recall decreased substantially (0.445 and 0.551). Accordingly, the false positive rate (FPR) increased to 0.555 in condition B and 0.449 in condition C. Under the smartphone-use condition (D), accuracy was 0.749, and male recall improved to 0.636 compared with B/C; however, FPR remained elevated (0.364) relative to condition A.
In addition, we visualized condition-wise predicted probability distributions by computing, for each subject in the test set, the mean of clip-level predicted probabilities p(Female=1), thereby obtaining a subject-level mean probability, and plotting sex-stratified histograms (Figure 4). As shown in Figure 4, condition A exhibited a general tendency for the two sex distributions to separate, with some overlap near the decision threshold (0.5). In conditions B and C, the male (y=0) distribution extended into the region above 0.5, increasing overlap; this pattern is consistent with the increased FPR and reduced male recall observed under these conditions (Table 4).
3.3. Kinematic Evidence Under Smartphone Use
Among the condition-D test clips (n = 821), 816 clips were included in the kinematic analysis after excluding clips with insufficient keypoint data for computing arm_swing. Under the smartphone-use condition (D), we evaluated the association between the 2D skeleton–based arm-swing index (arm_swing) and prediction confidence (confidence; 2|p−0.5|). Across 816 clips, Spearman correlation analysis yielded ρ = −0.032 (p = 0.366), indicating no significant monotonic association between arm_swing and confidence. Moreover, a Mann–Whitney U test comparing arm_swing distributions between misclassified (206 clips) and correctly classified (610 clips) groups showed no significant difference (p = 0.933). Descriptive statistics for arm_swing were 1.993 ± 1.276 (median 1.690) overall, 1.946 ± 1.180 (median 1.663) in the misclassified group, and 2.009 ± 1.308 (median 1.694) in the correctly classified group.
3.4. Grad-CAM–Based Importance Distribution Across Conditions
We compared Grad-CAM–based importance distributions across conditions A–D. The joint-group (head, upper, trunk, lower) importance ratios are summarized in Table 5. In conditions A and D, the head contributed the largest proportion (0.743 and 0.671, respectively), and in condition A, the lower-limb group followed with 0.194. Condition C also showed the largest head proportion (0.577), while upper (0.145), trunk (0.136), and lower (0.142) were observed at similar levels. In condition B, the proportions were highest for lower (0.391), followed by upper (0.276), trunk (0.197), and head (0.137). Notably, condition B had a relatively small number of valid clips used to compute the joint-group distribution (n=18), and thus the interpretation requires caution.
Figure 5 shows the proportions of the summed Grad-CAM importance over three segments of a 45-frame timeline (1–15, 16–30, 31–45) for each condition. In condition A, the proportion was largest in the 16–30 segment, and conditions B and D also showed relatively higher proportions in the 16–30 segment. In contrast, condition C exhibited a notably larger proportion in the 31–45 segment compared with the other conditions.
4. Discussion
This study analyzed the robustness of sex classification under gait perturbations that frequently occur in everyday environments, using 2D skeleton sequences from the PsyMo dataset. By applying a subject-wise stratified split with balanced sexes and configuring the four aggregated conditions (A–D) to share the same test-subject set, we aimed to evaluate performance under realistic generalization settings. The 3D residual CNN classifier achieved moderate accuracy across conditions A–D (0.658–0.749), with the lowest performance under the partial occlusion/carrying condition (B) and the highest under the smartphone-use condition (D). Confusion-matrix–based error decomposition further revealed clear condition-dependent and sex-dependent error asymmetry in conditions B and C, characterized by reduced male recall and an increased tendency to misclassify males as females. In addition, Grad-CAM–based importance quantification suggested that the joint-group cues used by the model can be reallocated depending on the perturbation type, indicating that the classifier’s evidential basis is not fixed but may shift across conditions.
4.1. Why the Largest Performance Degradation Occurred Under Partial Occlusion/Carrying (Condition B)
To interpret condition-wise performance differences, it is necessary to first examine, in the most degraded condition, what specifically weakens the inputs and discriminative cues. In this study, condition B showed the lowest accuracy, and error decomposition indicated the strongest sex-wise asymmetry. The pronounced degradation and asymmetry in condition B were largely driven by a sharp decrease in male recall and an increase in the false positive rate (FPR; misclassifying males as females). This pattern is consistent with real-world characteristics of partial occlusion or carrying objects, which make it difficult to extract gait cues stably.
In a skeleton-based pipeline, occlusion/carrying can manifest as (i) missing keypoints or coordinate jitter, (ii) reduced temporal consistency across frames, and (iii) changes in arm or upper-body posture due to task constraints. In particular, occlusion is treated as a central challenge in multi-person 2D pose estimation; it not only reduces the reliability of joint localization but also induces errors in the person–joint association (part association) stage, thereby increasing estimation uncertainty [16]. Moreover, quantitative reports have shown that the performance of existing pose-estimation methods degrades significantly as crowdedness/occlusion becomes more severe, supporting that occlusion in crowded scenes translates into measurable performance loss [22].
From a modeling perspective, condition B likely weakens spatiotemporal discriminative cues that are relatively stable under normal walking. In our Grad-CAM analysis, unlike other conditions where head importance was dominant, condition B showed reduced head contribution and a relative shift of importance toward the upper/trunk/lower groups (noting that the joint-group average in condition B requires caution due to the small number of valid clips). This shift suggests that when head/upper-body keypoints become unreliable (e.g., due to occlusion or arm constraints) or when those cues are attenuated by perturbations, the network may compensate by relying more on comparatively observable lower-limb or trunk cues. Accordingly, improving robustness under occlusion may benefit from weighted inputs using keypoint confidence, occlusion-aware augmentation, temporal smoothing, or structural changes such as using coordinate- or graph-based representations rather than low-resolution skeleton-rendered images (see Section 4.6).
4.2. Effects of Walking Speed Variations (Condition C): Phase Mismatch and Speed–Sex Confounding
Whereas occlusion primarily degrades input observability, speed variation constitutes a different perturbation that alters motion dynamics and temporal structure even under the same observation scheme. Therefore, interpreting condition C requires focusing on whether (i) gait-pattern changes and (ii) the temporal alignment strategy jointly influenced performance. Condition C (speed variation) showed a moderate decrease in accuracy and, similar to condition B, exhibited error asymmetry characterized by reduced male recall and increased male-to-female misclassification. Walking speed strongly modulates gait features and affects overall spatiotemporal gait parameters and joint kinematics. Prior biomechanics studies have reported that controlling for speed and body size can reduce sex differences previously observed in some spatiotemporal parameters, whereas certain whole-body joint-kinematic differences may persist even under dimensionless speed conditions [23].
In this study, it is likely that (i) speed-induced changes in gait strategy interacted with (ii) the use of fixed-length 15-frame clips without gait-cycle alignment or phase normalization based on events (e.g., heel strike). We omitted cycle alignment because heel-strike event detection was difficult to perform reliably using only 2D skeleton-rendered inputs, and event-detection errors could negate potential benefits of phase alignment. However, this design choice leaves a limitation whereby performance under speed variation may degrade due to phase mismatch; thus, future work should consider lightweight phase normalization based on periodicity estimation or weak alignment that does not require explicit event detection.
Because we did not perform event-based segmentation, the gait phase captured by a 15-frame clip may differ across speeds and subjects, which can reduce the correspondence between the learned spatiotemporal patterns and the underlying gait cycle. The temporal shift in Grad-CAM importance observed in condition C (increased weight on the late segment when concatenating 45 frames) is consistent with the possibility that speed changes alter when the model captures the most discriminative cues. Future studies should test whether introducing lightweight temporal alignment through periodicity estimation or data-driven alignment—without explicit event detection—can improve robustness to speed perturbations.
4.3. Smartphone Dual-Task (Condition D): High Accuracy and Limitations of a Simple Arm-Swing Index
Condition D represents a prototypical real-world perturbation in which cognitive, visual, and upper-limb tasks are simultaneously imposed (dual-task), and prior work has consistently reported clear gait-strategy changes under such conditions [24,25]. Interestingly, our study observed the highest accuracy in condition D. This pattern requires plausible explanations without overinterpretation. Although condition D achieved the highest accuracy among the four conditions, it did not fully eliminate elevated FPR or reduced male recall. Multiple studies have reported that smartphone use (particularly texting), as a dual-task, alters spatiotemporal gait parameters and increases gait variability [24,25]. Such changes may reshape the feature distribution on which the classifier relies. One possible explanation is that, in this dataset/viewpoint, the dual-task constraint may have reduced within-condition variability and yielded more constrained movement patterns, which could have made sex discrimination easier.
In addition, the finding that the arm-swing amplitude index (arm_swing) did not explain prediction confidence or misclassification does not necessarily imply that upper-limb motion is unimportant; rather, the chosen index likely failed to capture the cues used by the model. A max–min amplitude computed from single-view 2D keypoints cannot represent the full complexity of 3D motion, and discriminative upper-limb cues may involve not only amplitude but also phase relationships, left–right asymmetry, and trunk–arm coordination. Furthermore, suppressing arm swing can affect gait mechanics and energetics, potentially altering the overall gait strategy in ways that a simple amplitude index cannot capture [26]. Therefore, future work should re-evaluate informative cues under smartphone use [24,25] using frequency-domain features, inter-joint coupling metrics, or embedding-based interpretation from skeleton-native models.
4.4. Meaning and Uncertainty of Sex-Wise Error Asymmetry: The Need for Reliability and Bias Checks
A key contribution of this study is demonstrating that average accuracy alone is insufficient for assessing robustness, as evidenced by clear sex-wise error asymmetry in conditions B and C. If perturbations amplify a tendency to misclassify males as females, applications such as HCI personalization or user-context inference may accumulate systematic errors that disadvantage a specific subgroup even when overall performance appears acceptable.
Methodologically, we used subject-level nonparametric bootstrap confidence intervals to estimate uncertainty while accounting for clustered data, where multiple clips are generated per subject [27]. This choice is important because treating clips as independent samples can underestimate uncertainty. Bootstrap methods also provide a classical methodological basis for uncertainty quantification of complex statistics [20]. Future work should go beyond threshold-based (0.5) binarized metrics and examine probability calibration (e.g., reliability diagrams, ECE) and condition-wise shifts in probability distributions to evaluate whether a single threshold is appropriate across all conditions.
4.5. Grad-CAM Interpretation: Reallocation of Joint Cues and Cautions in Interpretation
When error asymmetry is observed, the next step is to inspect, by condition, what the model used as evidence and connect it to plausible causes at a hypothesis level. Grad-CAM, as applied here, was proposed as a method that produces class-discriminative localization maps using gradients flowing into the final convolutional layer. In our analysis, the Grad-CAM mass ratios showed that importance concentrated heavily on the head joint group in conditions A and D, shifted toward the lower/upper/trunk groups in condition B, and appeared more distributed in condition C. This pattern suggests that (i) the actual gait cues (posture/coordination) may change across perturbations and/or (ii) the 50×50 low-resolution skeleton-rendered representation may stabilize certain joint-group patterns more than others. Thus, Grad-CAM results should be interpreted not as biomechanical causality but as a hypothesis-generating tool indicating which cues the model may have leveraged. In particular, because condition B had a small number of valid clips, its estimates may be sensitive to sampling variability; therefore, further verification of reproducibility is warranted.
4.6. Practical Considerations, Limitations, and Future Work
From a practical standpoint, skeleton-based approaches can preserve movement structure while reducing reliance on appearance cues (face/clothing). PsyMo enables reproducible benchmarking by releasing relatively anonymized gait representations such as silhouettes, 2D/3D skeletons, and SMPL. However, privacy is not binary; because sensitive attribute inference may remain possible even from skeletons, additional protection strategies may be required, and anonymization-oriented research has been proposed. Therefore, when sex classification is used in user profiling or surveillance contexts, contextual review—including application purpose, ethics, and data minimization principles—is essential alongside technical performance.
This study has several limitations: (i) reliance on the dataset’s binary sex labels (which may not reflect gender identity), (ii) restriction to a single (side-view) viewpoint without validating multi-view generalization, (iii) potential increased sensitivity to speed variation due to fixed-length clip sampling without phase alignment, and (iv) the correlational nature of Grad-CAM interpretation. Future work should consider (1) improving robustness via keypoint confidence and occlusion-aware learning, (2) benchmarking coordinate- or graph-based models that reduce rasterization artifacts, (3) addressing speed perturbations through lightweight phase alignment without explicit event detection, and (4) extending evaluation to multi-view settings and more diverse demographic distributions. Moreover, given the sex-wise error asymmetry observed here, future studies should routinely report condition-wise subgroup-conditional performance and test whether calibration or domain-adaptation strategies can mitigate systematic misclassification patterns.
5. Conclusions
In this study, we constructed non-overlapping 15-frame clips from 2D skeleton sequences in the PsyMo dataset and performed sex classification using a 3D residual CNN. Using a subject-wise split, we compared performance and error patterns across four aggregated walking conditions (A–D) that reflect common real-world perturbations. The condition-wise accuracy ranged from 0.658 to 0.749, with the lowest performance under partial occlusion/carrying (condition B) and the highest under smartphone use.
Error decomposition revealed pronounced sex-wise error asymmetry in conditions B and C, characterized by reduced male recall and an increased tendency to misclassify males as females. In contrast, the single arm-swing amplitude index (arm_swing) computed under the smartphone-use condition (D) showed no significant association with prediction confidence or misclassification. Together, these findings quantify not only average performance changes under perturbations but also how group-wise error imbalance can be amplified across conditions. This work provides an empirical basis for improving both accuracy and reliability through model and training refinements, thereby supporting more generalizable and trustworthy skeleton-based gait sex classification in everyday settings.
Future work should further examine input-quality factors, including pose-estimation reliability, and test whether phase normalization as well as calibration and condition-adaptive learning can improve performance stability and mitigate sex-wise error asymmetry under perturbations.
Author Contributions
Conceptualization, A.H.J. and S.D.M.; methodology, A.H.J.; software, A.H.J.; validation, A.H.J. and Y.O.; formal analysis, A.H.J.; investigation, A.H.J., Y.E.K.; resources, S.D.M.; data curation, A.H.J. and Y.O.; writing—original draft preparation, A.H.J.; writing—review and editing, A.H.J., Y.O., Y.E.K. and S.D.M.; visualization, A.H.J., Y.E.K; supervision, S.D.M.; project administration, S.D.M.; funding acquisition, S.D.M. All authors have read and agreed to the published version of the manuscript.
Funding
This research was funded by the National Research Foundation of Korea (NRF), funded by the Ministry of Education of the Republic of Korea, grant number NRF-2021R1I1A3059769; and by the Ministry of Education of the Republic of Korea (Brain Korea 21 FOUR (BK21 FOUR): Fostering Outstanding Universities for Research), grant number 5199990914048; and by Soonchunhyang University Research Fund.
Institutional Review Board Statement
Not applicable. This study used a publicly available dataset (PsyMo), and no new data were collected from human participants by the authors.
Informed Consent Statement
Not applicable. The study used a publicly available dataset (PsyMo) provided by the dataset authors.
Data Availability Statement
The PsyMo dataset is available from the original authors/source (see Ref. [17]) under the terms and conditions described therein. The code used for training and evaluation is available from the corresponding author upon reasonable request.
Conflicts of Interest
The authors declare no conflicts of interest. The funders had no role in the design of the study; in the collection, analyses, or interpretation of data; in the writing of the manuscript; or in the decision to publish the results.
References
- Nixon, M.S.; Tan, T.; Chellappa, R. Human Identification Based on Gait; Springer: Boston, MA, USA, 2006. [Google Scholar] [CrossRef]
- Xu, C.; Makihara, Y.; Ogi, G.; Li, X.; Yagi, Y.; Lu, J. The OU-ISIR Gait Database Comprising the Large Population Dataset with Age and Performance Evaluation of Age Estimation. IPSJ Trans. Comput. Vis. Appl. 2017, 9, 24. [Google Scholar] [CrossRef]
- Franco, D.; Russo, M.; Amboni, M.; Ponsiglione, A.; Di Filippo, A.; Romano, M.; Amato, F.; Ricciardi, C. The Role of Deep Learning and Gait Analysis in Parkinson’s Disease: A Systematic Review. Sensors 2024, 24, 5957. [Google Scholar] [CrossRef] [PubMed]
- Bisogni, C.; Cimmino, L.; Nappi, M.; Pannese, T.; Pero, C. Walk as you feel: Privacy preserving emotion recognition from gait patterns. Eng. Appl. Artif. Intell. 2024, 128, 107565. [Google Scholar] [CrossRef]
- Galiyawala, H.; Raval, M.S.; Patel, M. Person Retrieval in Surveillance Video using Height, Color and Gender. arXiv 2018, arXiv:1810.05080. [Google Scholar] [CrossRef]
- Zhang, W.; Smith, M.L.; Smith, L.N.; Farooq, A. Gender and gaze gesture recognition for human–computer interaction. Comput. Vis. Image Underst. 2016, 149, 32–50. [Google Scholar] [CrossRef]
- Naham, A.-Z.; Wang, J.; Raeed, A.-S. Multi-Task Learning and Gender-Aware Fashion Recommendation System Using Deep Learning. Electronics 2023, 12, 3396. [Google Scholar] [CrossRef]
- Li, B.; Lian, X.-C.; Lu, B.-L. Gender classification by combining clothing, hair and facial component classifiers. Neurocomputing 2012, 76, 18–27. [Google Scholar] [CrossRef]
- Sun, Z.; Liu, Z. Ensuring privacy in face recognition: a survey on data generation, inference and storage. Discov. Appl. Sci. 2025, 7, 441. [Google Scholar] [CrossRef]
- Yu, S.; Tan, T.; Huang, K.; Jia, K.; Wu, X. A Study on Gait-Based Gender Classification. IEEE Trans. Image Process. 2009, 18, 1905–1910. [Google Scholar] [CrossRef]
- Hu, M.; Wang, Y.; Zhang, Z.; Zhang, D. Gait-Based Gender Classification Using Mixed Conditional Random Field. IEEE Trans. Syst. Man Cybern. B Cybern. 2011, 41, 1429–1439. [Google Scholar] [CrossRef]
- Azhar, M.; Ullah, S.; Ullah, K.; Syed, I.; Choi, J. A Gait-Based Real-Time Gender Classification System Using Whole Body Joints. Sensors 2022, 22, 9113. [Google Scholar] [CrossRef]
- Azhar, M.; Ullah, S.; Raees, M.; Rahman, K.U.; Rehman, I.U. A real-time multi view gait-based automatic gender classification system using kinect sensor. Multimed. Tools Appl. 2023, 82, 11993–12016. [Google Scholar] [CrossRef]
- Schabrun, S.M.; van den Hoorn, W.; Moorcroft, A.; Greenland, C.; Hodges, P.W. Texting and Walking: Strategies for Postural Control and Implications for Safety. PLoS ONE 2014, 9, e84312. [Google Scholar] [CrossRef] [PubMed]
- Bruyneel, A.-V.; Reinmann, A.; Gafner, S.C.; Sandoz, J.-D.; Duclos, N.C. Does texting while walking affect spatiotemporal gait parameters in healthy adults, older people, and persons with motor or cognitive disorders? A systematic review and meta-analysis. Gait Posture 2023, 100, 284–301. [Google Scholar] [CrossRef]
- Cao, Z.; Simon, T.; Wei, S.-E.; Sheikh, Y. Realtime Multi-Person 2D Pose Estimation Using Part Affinity Fields. In Proceedings of the IEEE Conference on Computer Vision and Pattern Recognition (CVPR), Honolulu, HI, USA, 22–25 July 2017; pp. 7291–7299. [Google Scholar] [CrossRef]
- Cosma, A.; Radoi, I. PsyMo: A Dataset for Estimating Self-Reported Psychological Traits From Gait. In Proceedings of the IEEE/CVF Winter Conference on Applications of Computer Vision (WACV), Waikoloa, HI, USA, 3–8 January 2024; pp. 4603–4613. [Google Scholar] [CrossRef]
- He, K.; Zhang, X.; Ren, S.; Sun, J. Deep Residual Learning for Image Recognition. In Proceedings of the IEEE Conference on Computer Vision and Pattern Recognition (CVPR), Las Vegas, NV, USA, 27–30 June 2016; pp. 770–778. [Google Scholar] [CrossRef]
- Yang, J.; Sun, S.; Chen, J.; Xie, H.; Wang, Y.; Yang, Z. 3D-STARNET: Spatial–Temporal Attention Residual Network for Robust Action Recognition. Appl. Sci. 2024, 14, 7154. [Google Scholar] [CrossRef]
- Efron, B. Bootstrap Methods: Another Look at the Jackknife. Ann. Stat. 1979, 7, 1–26. [Google Scholar] [CrossRef]
- Selvaraju, R.R.; Cogswell, M.; Das, A.; Vedantam, R.; Parikh, D.; Batra, D. Grad-CAM: Visual Explanations from Deep Networks via Gradient-Based Localization. Int. J. Comput. Vis. 2020, 128, 336–359. [Google Scholar] [CrossRef]
- Li, J.; Wang, C.; Zhu, H.; Mao, Y.; Fang, H.-S.; Lu, C. CrowdPose: Efficient Crowded Scenes Pose Estimation and a New Benchmark. In Proceedings of the IEEE/CVF Conference on Computer Vision and Pattern Recognition (CVPR), Long Beach, CA, USA, 16–20 June 2019; pp. 10863–10872. Available online: https://openaccess.thecvf.com/content_CVPR_2019/html/Li_CrowdPose_Efficient_Crowded_Scenes_Pose_Estimation_and_a_New_Benchmark_CVPR_2019_paper.html (accessed on 20 January 2026).
- Bruening, D.A.; Baird, A.R.; Weaver, K.J.; Rasmussen, A.T. Whole body kinematic sex differences persist across non-dimensional gait speeds. PLoS ONE 2020, 15, e0237449. [Google Scholar] [CrossRef]
- Bovonsunthonchai, S.; Ariyaudomkit, R.; Susilo, T.E.; Sangiamwong, P.; Puchaphan, P.; Chandee, S.; Richards, J. The impact of different mobile phone tasks on gait behaviour in healthy young adults. J. Transp. Health 2020, 19, 100920. [Google Scholar] [CrossRef]
- Crowley, P.; Madeleine, P.; Vuillerme, N. The effects of mobile phone use on walking: a dual task study. BMC Res. Notes 2019, 12, 352. [Google Scholar] [CrossRef]
- Umberger, B.R. Effects of suppressing arm swing on kinematics, kinetics, and energetics of human walking. J. Biomech. 2008, 41, 2575–2580. [Google Scholar] [CrossRef] [PubMed]
- Field, C.A.; Welsh, A.H. Bootstrapping clustered data. J. R. Stat. Soc. Ser. B Stat. Methodol. 2007, 69, 369–390. [Google Scholar] [CrossRef]
Figure 1.
COCO pose format.
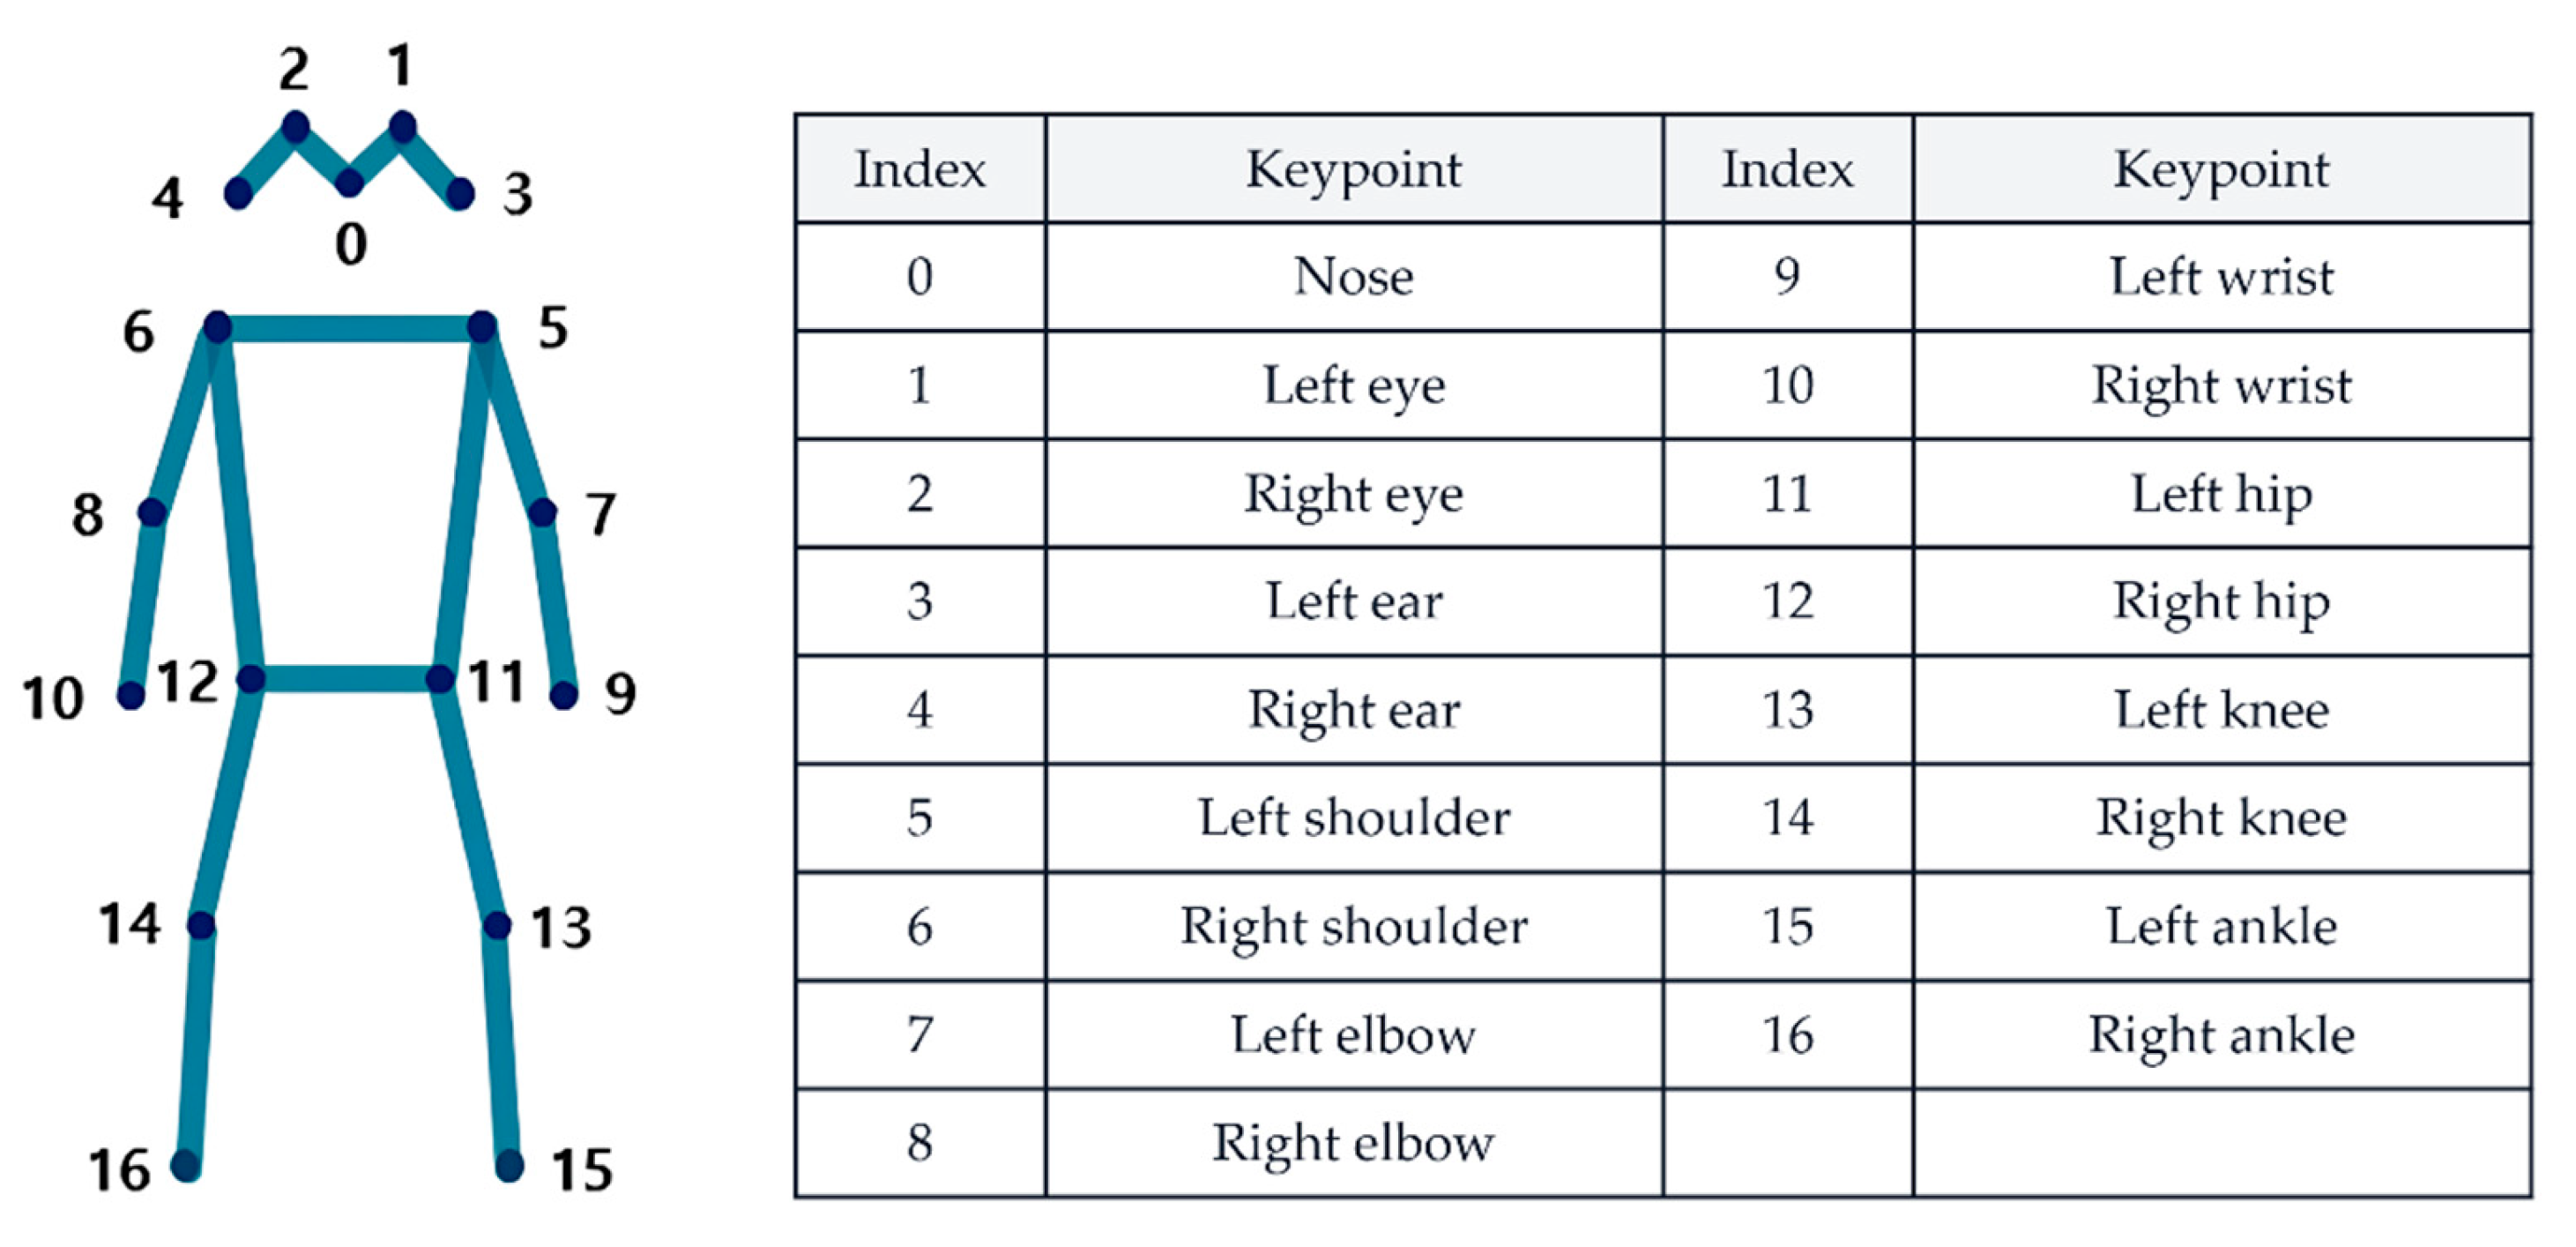
Figure 3.
Overview of the sex-classification model architecture. Given a 15×50×50×1 skeleton clip, the network extracts initial features using a 7×7×7 Conv3D and a 3×3×3 MaxPool3D, learns spatiotemporal features through 3D residual blocks (64→128→256→512), and outputs the sex (female=1) probability via Global Average Pooling 3D and fully connected layers with a sigmoid output.
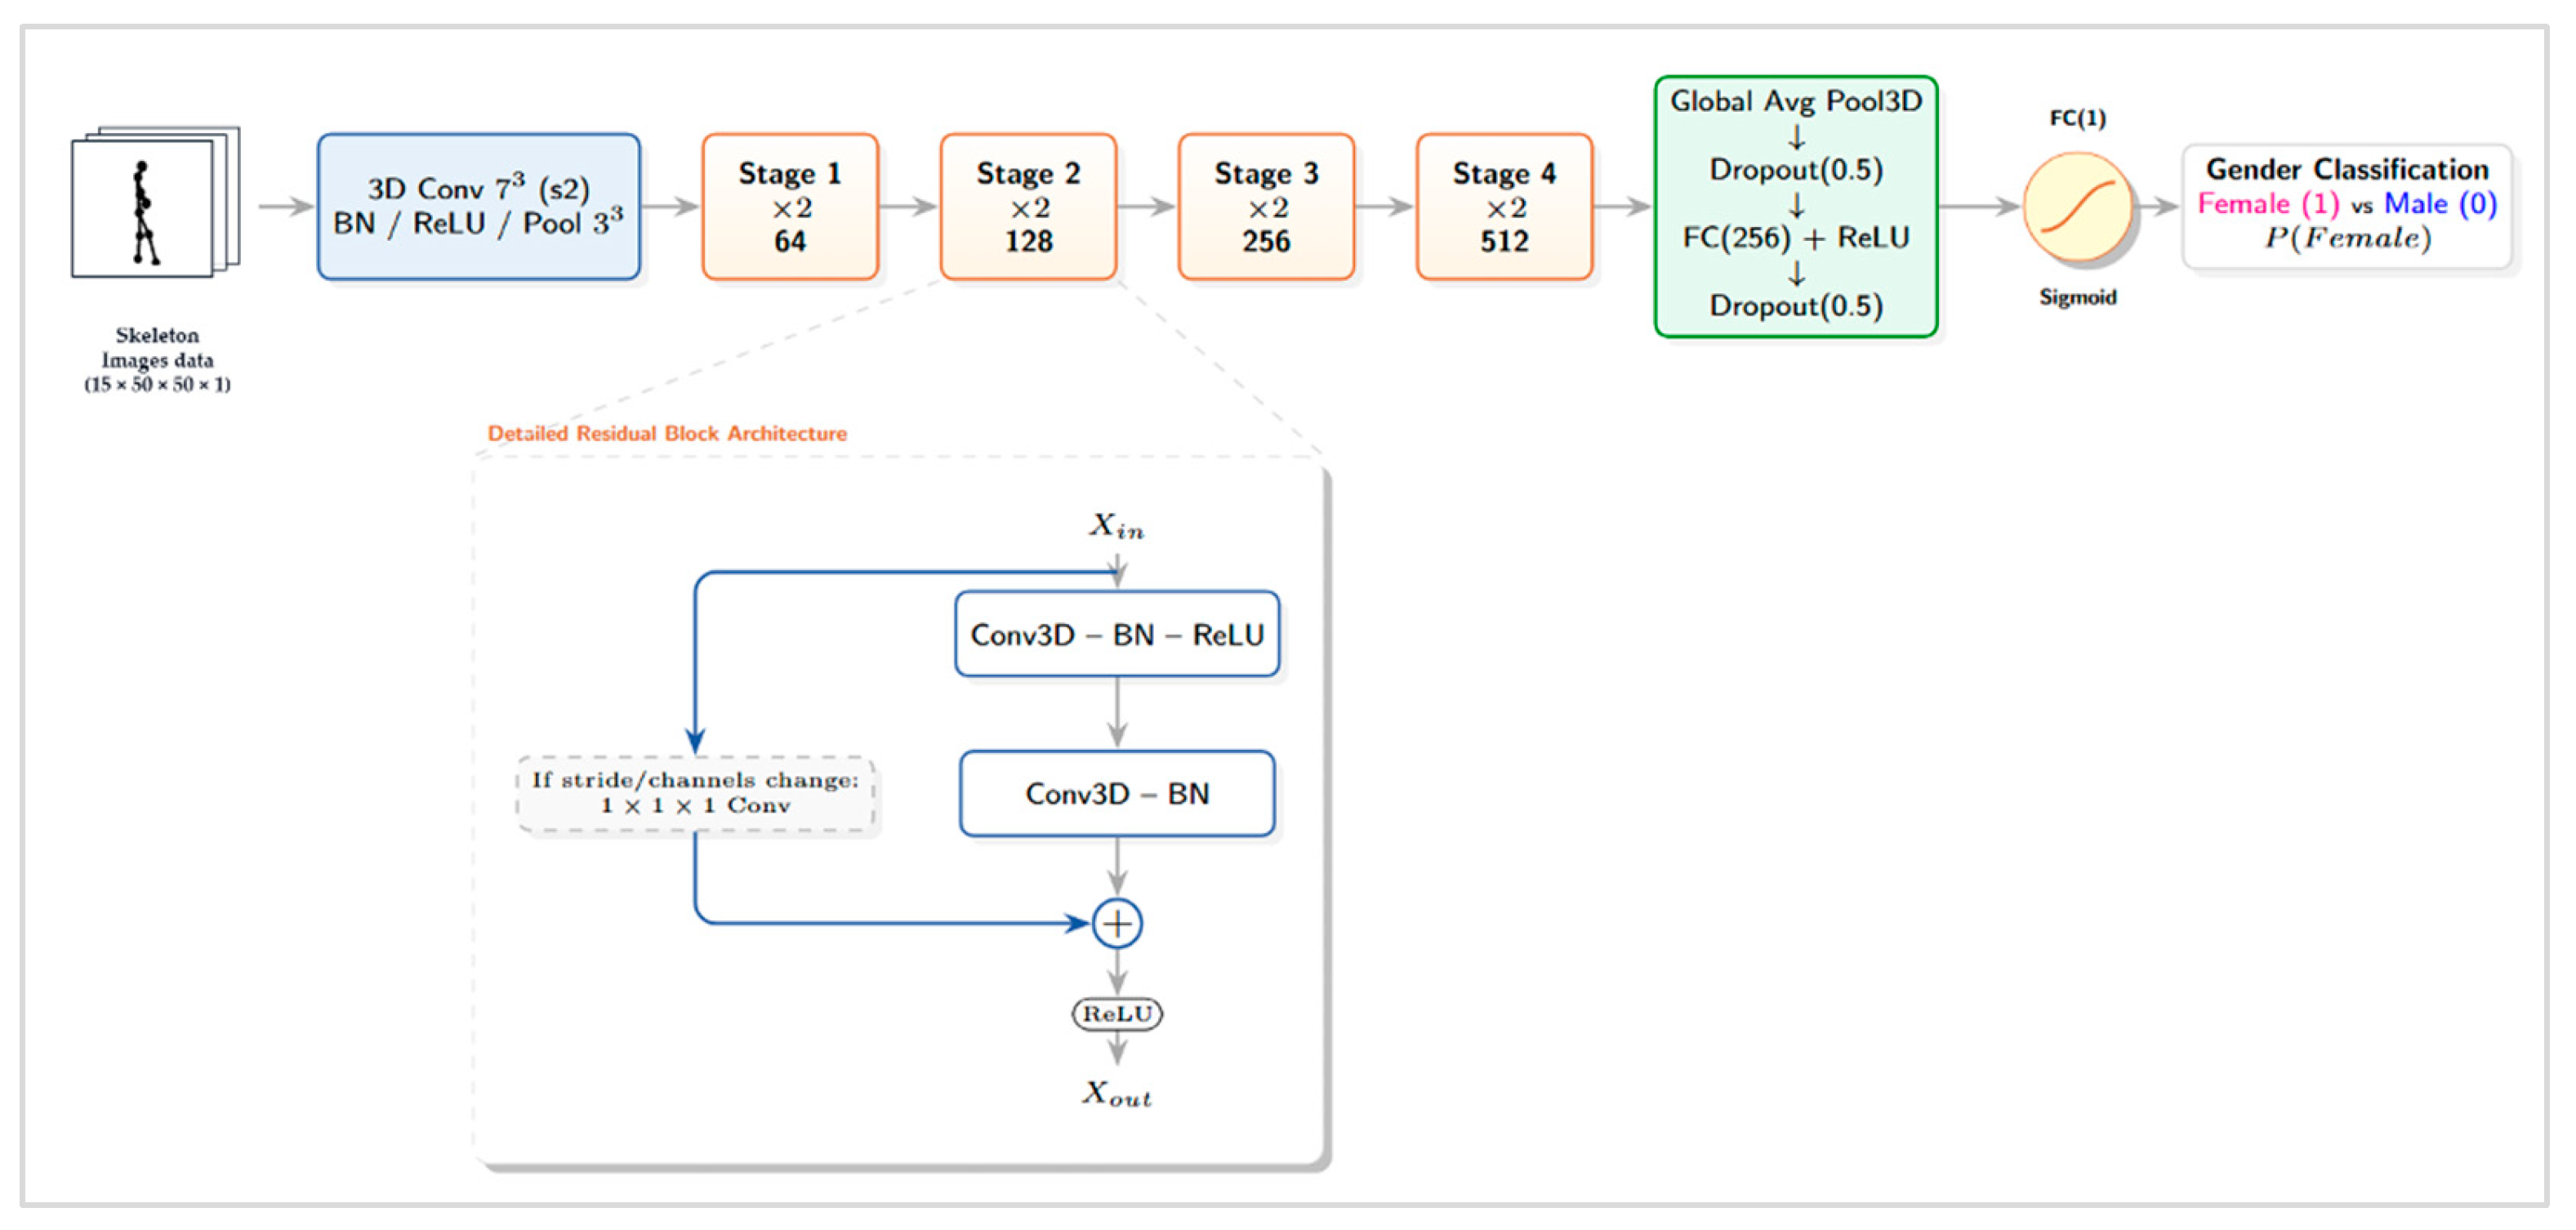
Figure 4.
Subject-level mean predicted probability distributions by condition and sex. Histograms of subject-level mean predicted probability p(Female=1) for male (y=0) and female (y=1) subjects across conditions (A–D). The dashed line indicates the decision threshold (0.5).
Figure 4.
Subject-level mean predicted probability distributions by condition and sex. Histograms of subject-level mean predicted probability p(Female=1) for male (y=0) and female (y=1) subjects across conditions (A–D). The dashed line indicates the decision threshold (0.5).
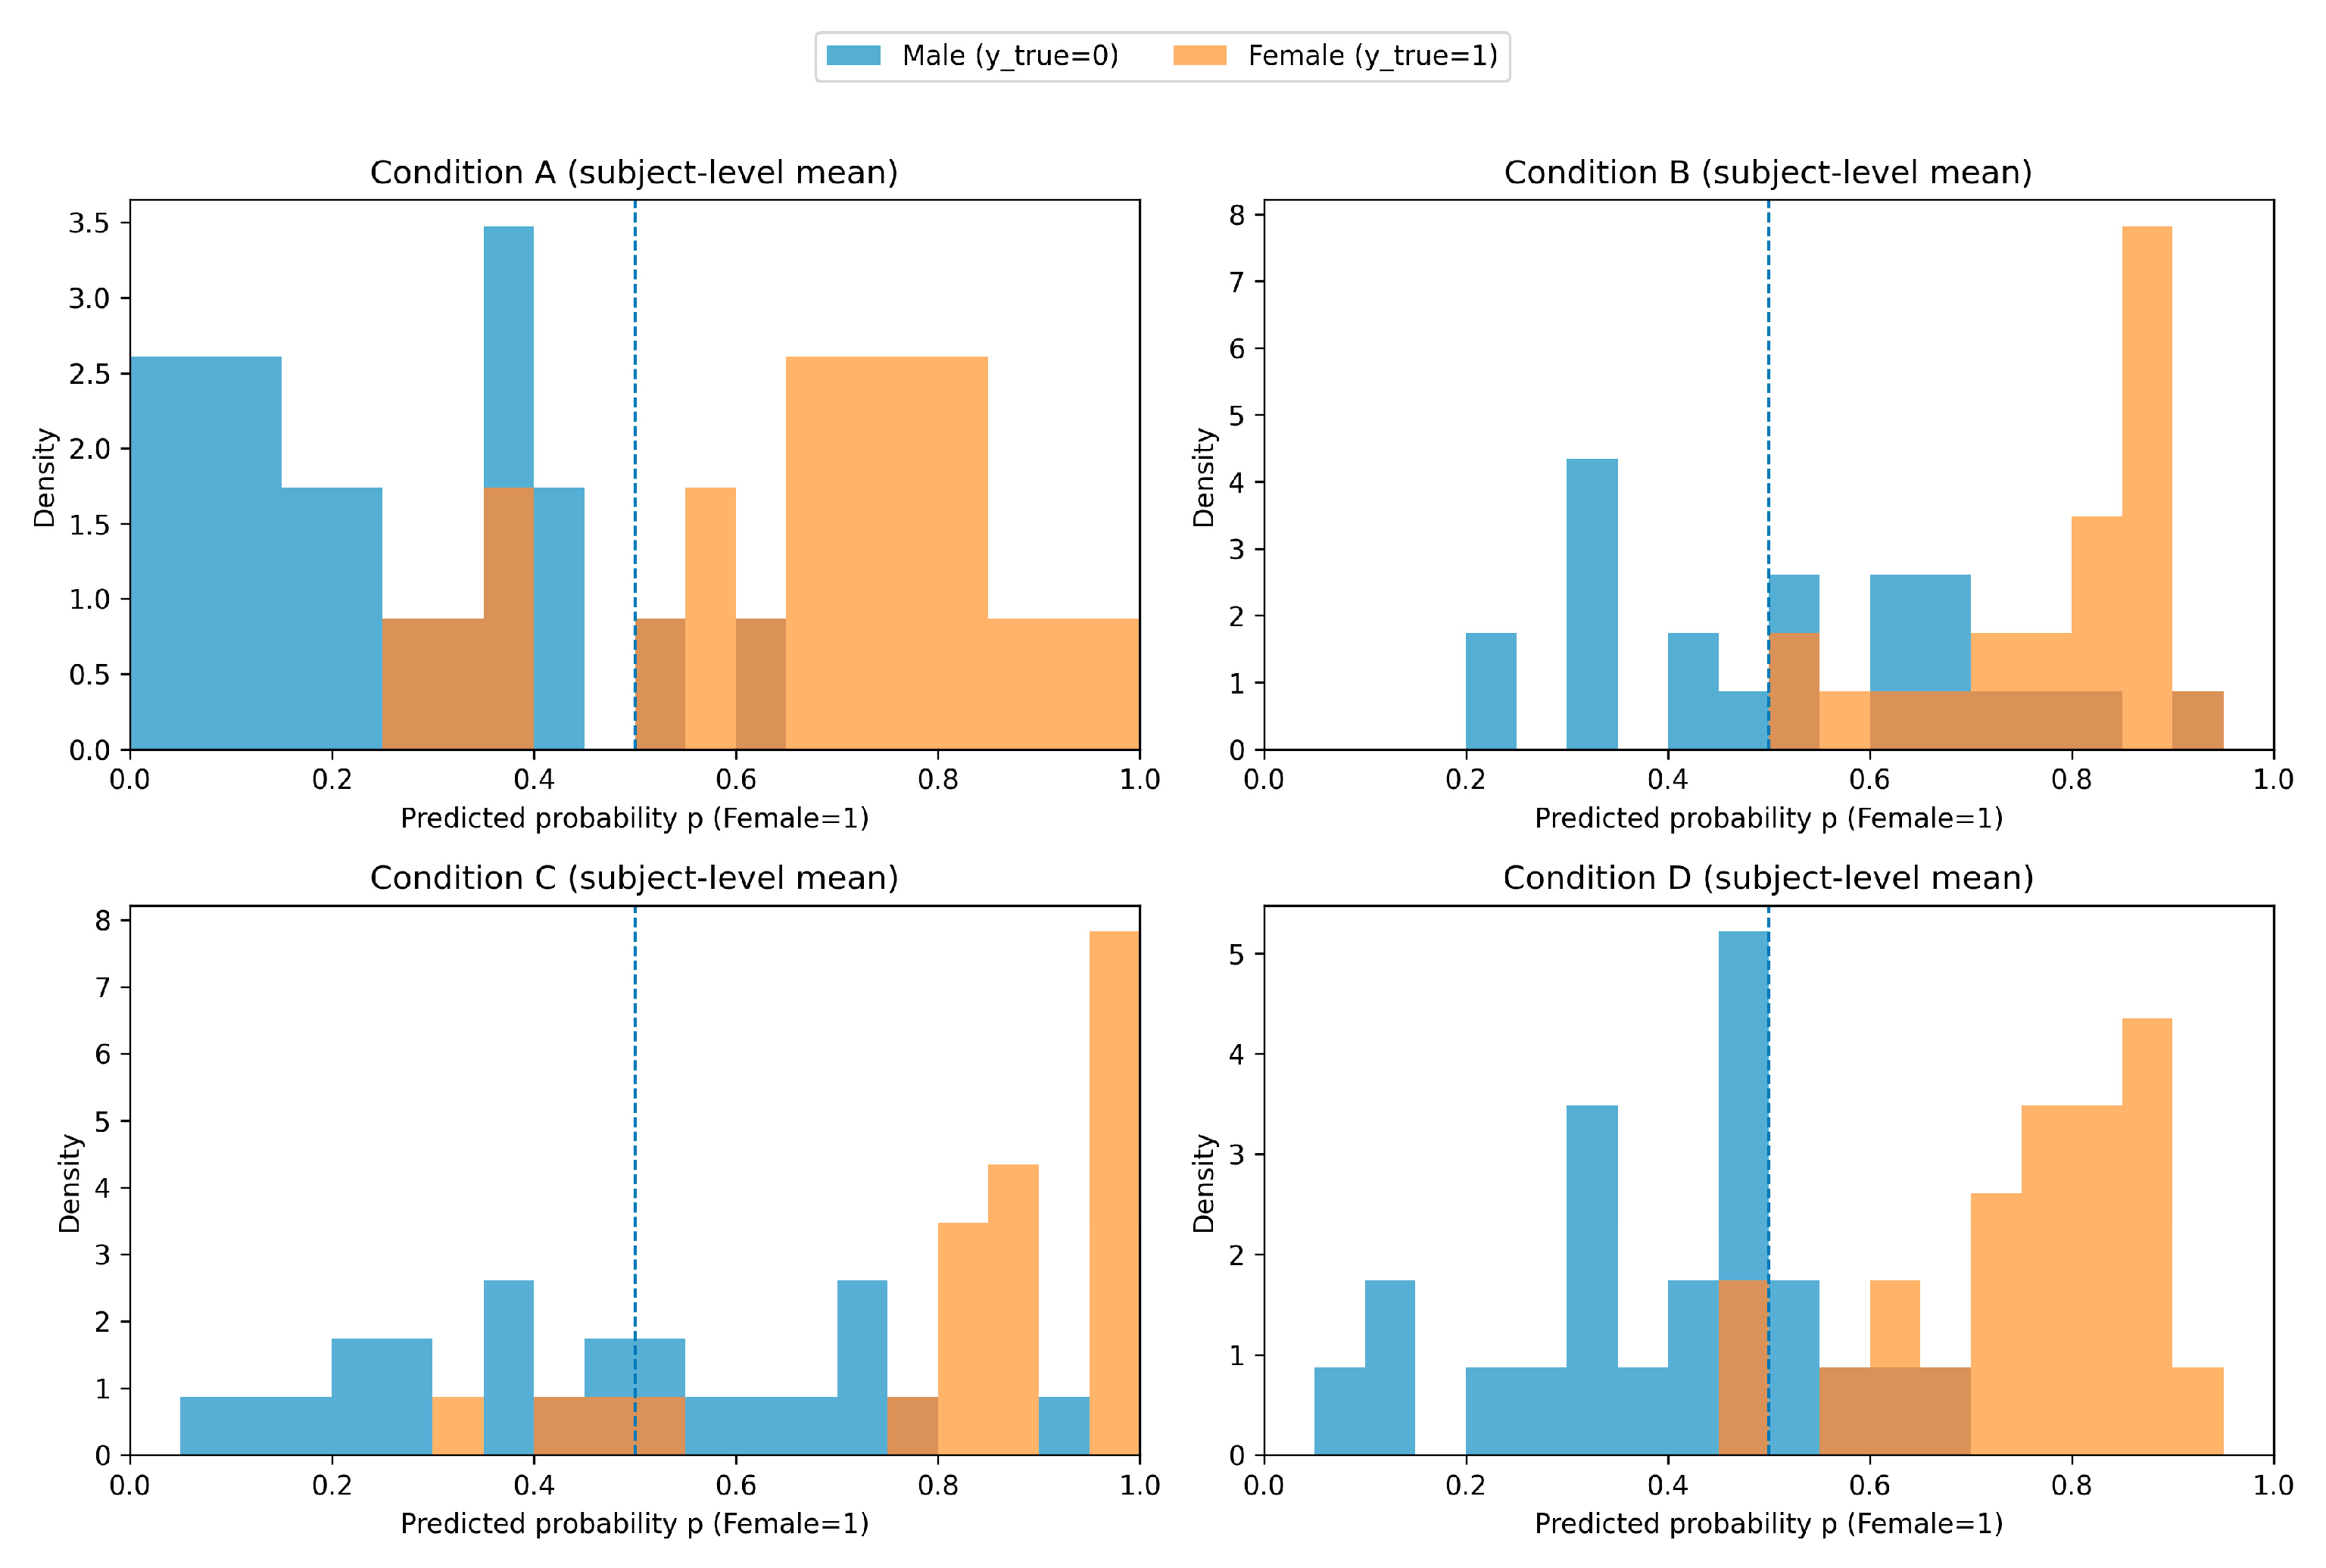
Figure 5.
Segment-wise Grad-CAM mass ratios over the 45-frame timeline (imp_all). Three consecutive 15-frame clips were concatenated into a 45-frame timeline and normalized per sequence. The proportions of Grad-CAM mass within early (1–15), mid (16–30), and late (31–45) segments were compared across conditions.
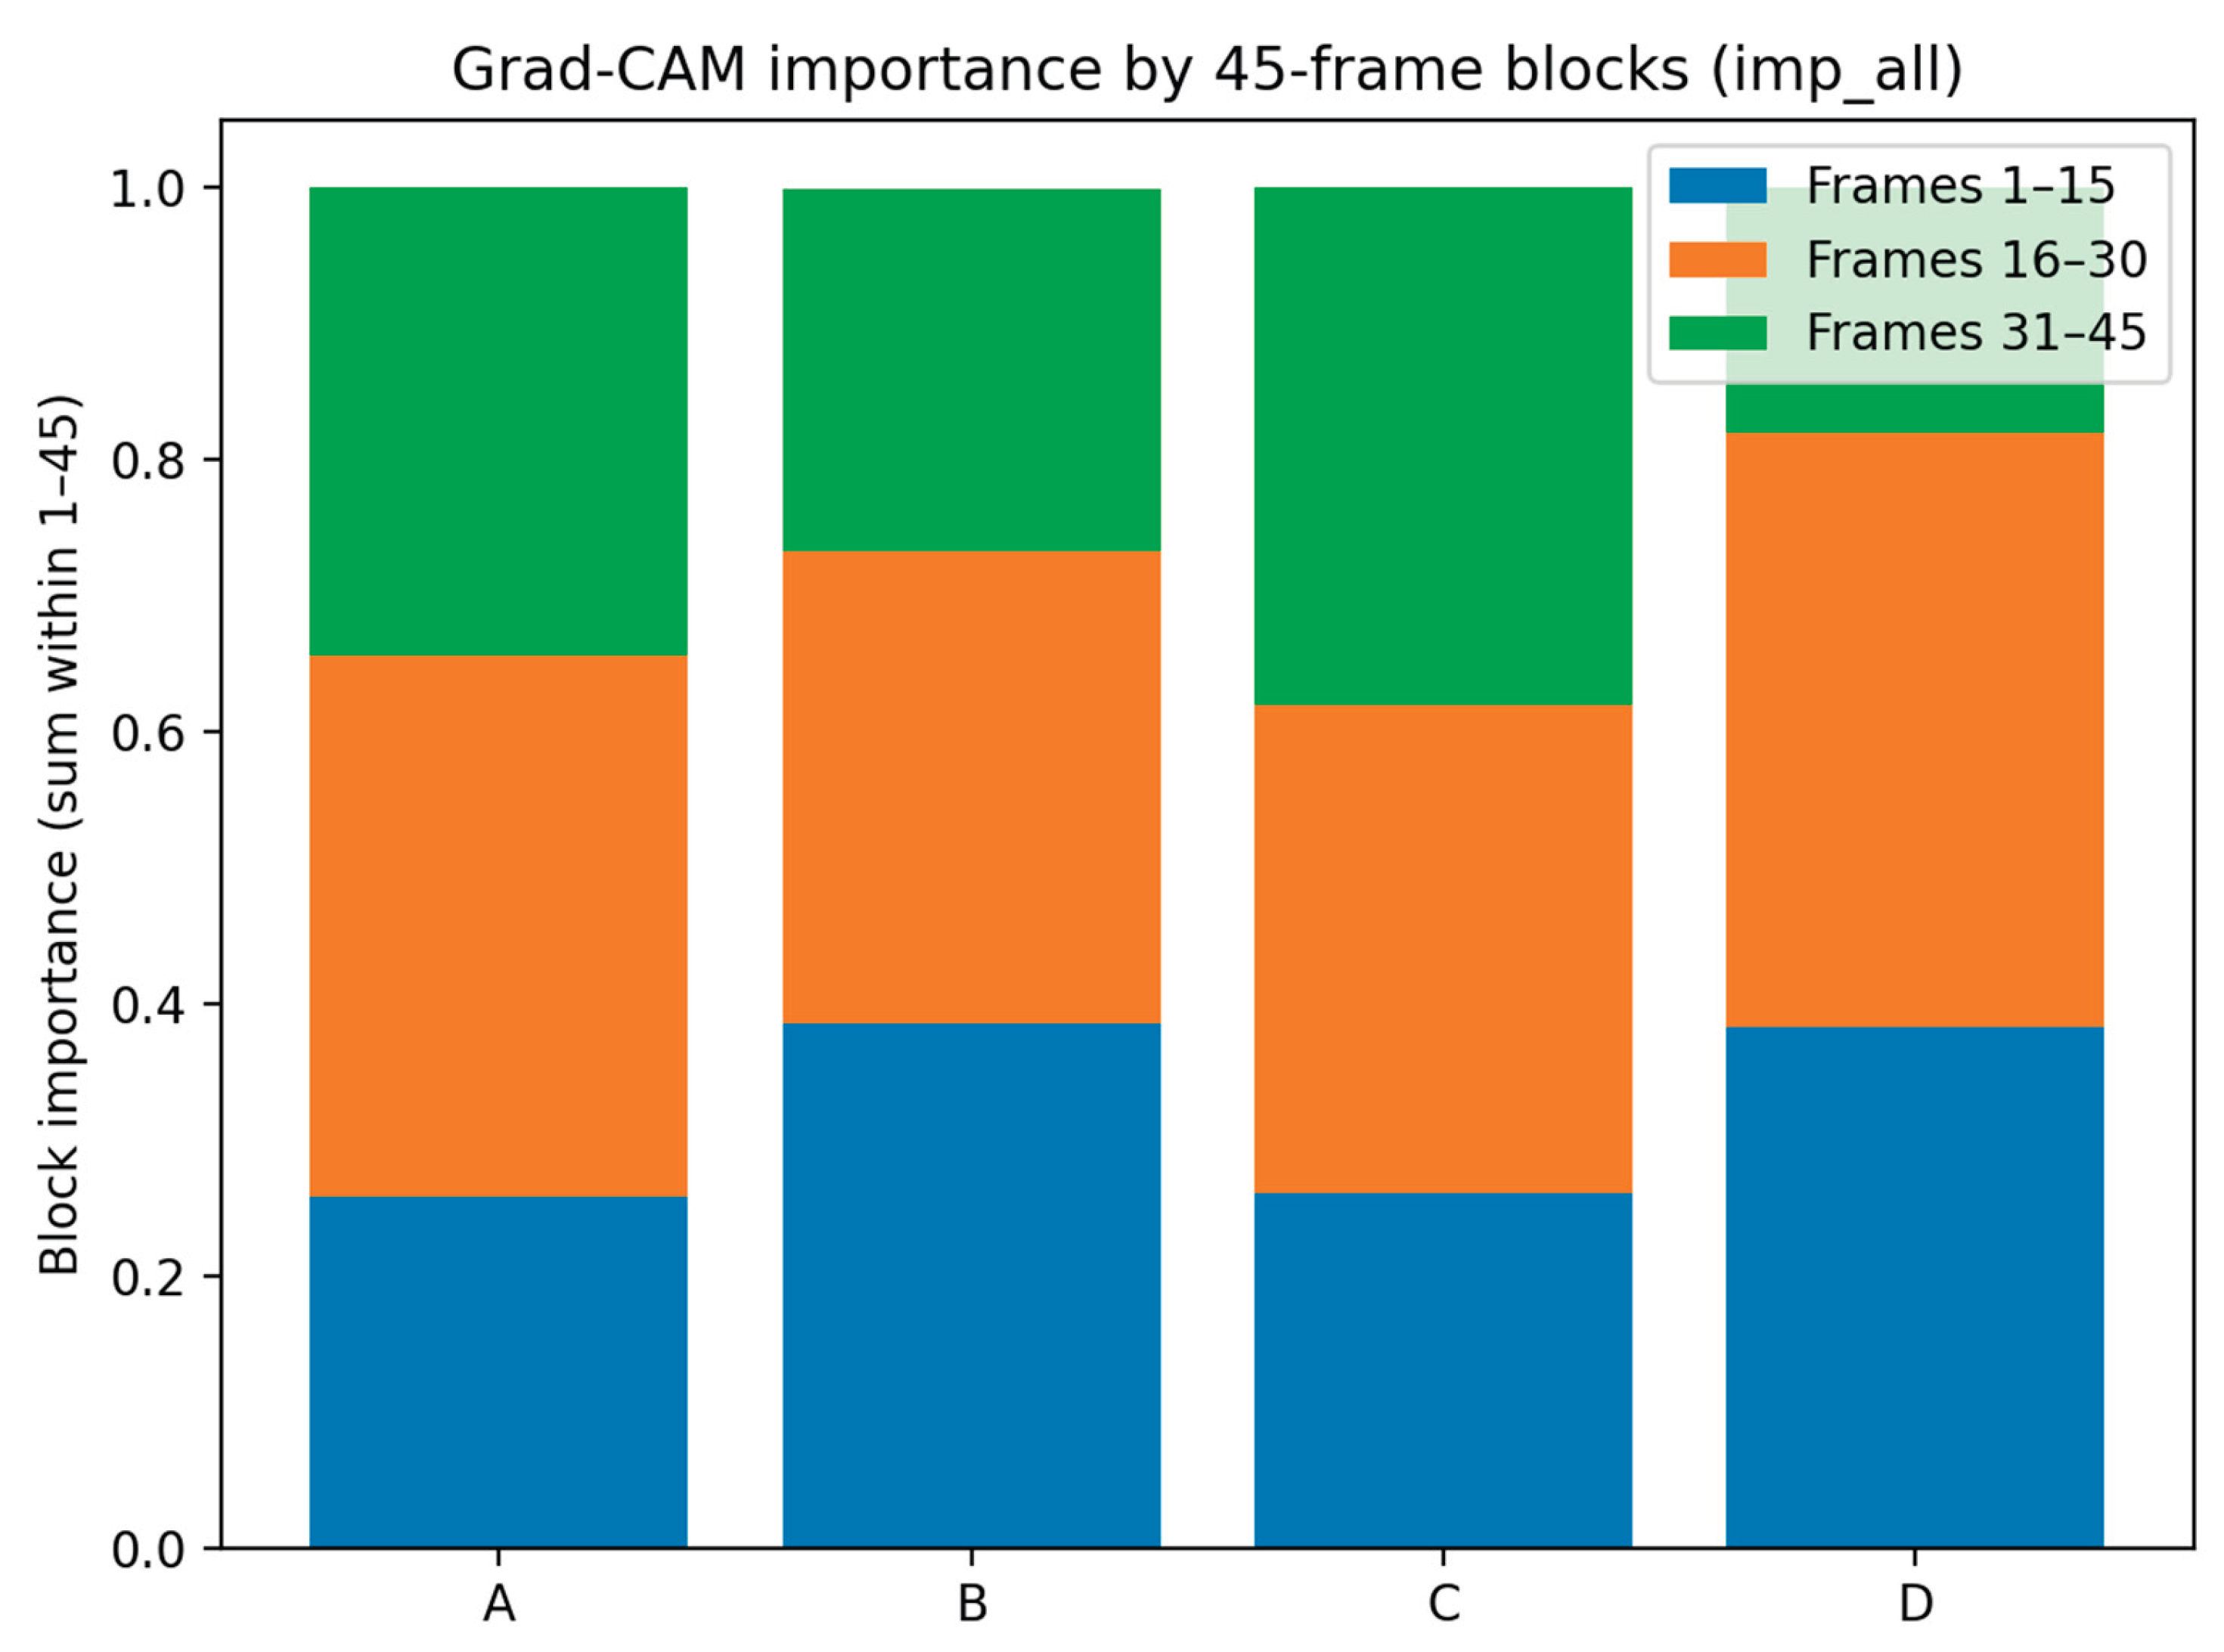
Table 2.
Datasets for the four aggregated conditions.
| Condition | Included data | 15-frame clips (Train/Test) |
|---|---|---|
| Overall dataset (A) | NM, CL, BG, WSS, WSF, TXT, PH | 9,432 (7,509 / 1,923) |
| Partial-occlusion dataset (B) | NM, CL, BG | 4,045 (3,220 / 825) |
| Speed-variation dataset (C) | NM, WSS, WSF | 4,043 (3,220 / 823) |
| Smartphone-use dataset (D) | NM, TXT, PH | 4,034 (3,213 / 821) |
1 All conditions share the same subject split (Total = 226, Train/Test = 180/46; test: 23 male and 23 female). 2 Conditions B–D are subsets of A; therefore, clip counts across conditions are not additive.
Table 3.
Baseline performance across walking conditions (test set).
| Condition | Accuracy | Precision | Recall | F1 |
|---|---|---|---|---|
| A | 0.743 | 0.744 | 0.743 | 0.742 |
| B | 0.658 | 0.692 | 0.658 | 0.642 |
| C | 0.694 | 0.710 | 0.694 | 0.687 |
| D | 0.749 | 0.761 | 0.749 | 0.746 |
Table 4.
Error decomposition by condition and sex with 95% subject-bootstrap confidence intervals.
| Condition | Accuracy (CL) | Precision_F (CL) | Recall_F (CL) | Precision_M (CL) | Recall_M (CL) | FPR | FNR |
|---|---|---|---|---|---|---|---|
| A | 0.743 (0.684–0.802) |
0.759 (0.619–0.869) |
0.713 (0.629–0.796) |
0.728 (0.587–0.845) |
0.772 (0.695–0.854) |
0.228 | 0.287 |
| B | 0.658 (0.572–0.743) |
0.612 (0.452–0.749) |
0.870 (0.806–0.931) |
0.772 (0.623–0.895) |
0.445 (0.340–0.563) |
0.555 | 0.130 |
| C | 0.694 (0.611–0.773) |
0.652 (0.494–0.786) |
0.835 (0.747–0.919) |
0.769 (0.620–0.897) |
0.551 (0.448–0.666) |
0.449 | 0.165 |
| D | 0.749 (0.682–0.812) |
0.706 (0.550–0.820) |
0.860 (0.789–0.923) |
0.817 (0.695–0.915) |
0.636 (0.549–0.731) |
0.364 | 0.140 |
1 Mean computed over valid clips (rounded to three decimal places). n denotes the number of valid clips used to compute the joint-group distribution.
Table 5.
Joint-group Grad-CAM mass ratios by condition (imp_all).
| Condition | n | head | upper | trunk | lower |
|---|---|---|---|---|---|
| A | 427 | 0.743 | 0.041 | 0.022 | 0.194 |
| B | 18 | 0.137 | 0.276 | 0.197 | 0.391 |
| C | 252 | 0.577 | 0.145 | 0.136 | 0.142 |
| D | 204 | 0.671 | 0.101 | 0.137 | 0.09 |
1 Mean computed over valid clips (rounded to three decimal places). n denotes the number of valid clips used to compute the joint-group distribution.
Disclaimer/Publisher’s Note: The statements, opinions and data contained in all publications are solely those of the individual author(s) and contributor(s) and not of MDPI and/or the editor(s). MDPI and/or the editor(s) disclaim responsibility for any injury to people or property resulting from any ideas, methods, instructions or products referred to in the content. |
© 2026 by the authors. Licensee MDPI, Basel, Switzerland. This article is an open access article distributed under the terms and conditions of the Creative Commons Attribution (CC BY) license.
Copyright: This open access article is published under a Creative Commons CC BY 4.0 license, which permit the free download, distribution, and reuse, provided that the author and preprint are cited in any reuse.


