Submitted:
17 January 2026
Posted:
20 January 2026
Read the latest preprint version here
Abstract
This paper proposes an AI-enhanced Marketing Mix Modeling (MMM) framework that integrates machinelearning (ML), explainable AI (XAI), and large language models (LLMs) to evaluate marketing effectiveness withimproved predictive accuracy, interpretability, and practical applicability. Moving beyond traditional MMMapproaches, the framework employs the XGBoost algorithm to capture nonlinear relationships between multichannelmarketing investments and business outcomes. SHAP analysis further enhances model interpretability throughfeature-importance rankings, beeswarm visualizations, and dependence plots that quantify each channel’s marginalcontribution. In addition, a Claude-based LLM module translates complex model outputs into natural-languageperformance insights and budget allocation recommendations, lowering technical barriers and improving decision-making actionability. Experimental results demonstrate that, compared with an OLS baseline, the XGBoost modelsignificantly improves predictive performance, increasing R² from 0.8572 to 0.9123 while reducing RMSE and MAEby 21.7% and 22.8%, respectively. The integrated SHAP and LLM components further elucidate channel impacts andsuggest budget optimization strategies, yielding an estimated 18–25% improvement in marketing ROI. Overall, theproposed AI-enhanced MMM framework democratizes advanced marketing analytics by providing businesses withan accessible, automated solution that guides strategic marketing decision-making, enables efficient resourceallocation, and improves marketing returns.
Keywords:
marketing mix modeling
; machine learning
; explainable artificial intelligence
; large language model
1. Introduction
In the era of digital marketing and multi-channel ecosystems, marketing decisions have become increasingly complex across diverse online channels such as search engines, social media, and e-commerce platforms. Accurately measuring return on investment (ROI) and allocating budgets efficiently among these channels require rigorous, data-driven analytical approaches. Traditional attribution models, including last-click and multi-touch attribution, often fail to capture the true contribution of each channel, especially under growing data-privacy restrictions. Consequently, Marketing Mix Modeling (MMM) has regained importance as a statistical framework for evaluating media effectiveness and guiding budget optimization.
However, conventional MMM approaches based on ordinary least squares (OLS) regression face critical limitations. Their linear assumptions constrain the ability to capture real-world complexities, such as diminishing returns, nonlinear patterns, and cross-channel interactions, leading to biased or oversimplified results. Although machine learning (ML) techniques can accommodate these nonlinear structures, their “black-box” nature and lack of transparency make it difficult for practitioners to interpret results and extract actionable insights.
To address these limitations, this study proposes an AI-enhanced MMM framework that integrates machine learning (ML), explainable AI (XAI), and large language models (LLMs). The framework leverages the XGBoost algorithm to improve predictive accuracy and robustness while employing SHAP (SHapley Additive Explanations) to generate transparent, channel-level interpretations of marketing impact. In addition, a Claude-based LLM module converts complex model outputs into intuitive natural-language explanations and actionable recommendations, enabling non-technical users to effectively interpret analytical results and make informed decisions. This integrated framework bridges the gap between accuracy, interpretability, and usability, enhancing the transparency and scientific rigor of marketing analytics.
2. Literature Review
Marketing mix modeling has evolved significantly since its foundational work by Hanssens et al., who established econometric principles for measuring advertising effectiveness across media channels [1]. Traditional MMM approaches rely predominantly on linear regression techniques to estimate the relationship between marketing investments and business outcomes [2]. While these methods provide interpretable coefficients and statistical inference, their restrictive linear assumptions limit their ability to capture the complex, nonlinear dynamics characteristic of modern digital marketing ecosystems, including diminishing returns, saturation effects, and cross-channel interactions [3].
Recent advances in machine learning have introduced new possibilities for MMM. Researchers have demonstrated that gradient boosting methods, particularly XGBoost, can substantially improve predictive accuracy in marketing analytics by modeling nonlinear relationships without restrictive parametric assumptions [4]. However, the widespread adoption of ML-based approaches in business contexts has been hindered by their “black-box” nature, which complicates interpretation and reduces stakeholder trust [5].
To address this interpretability gap, explainable AI (XAI) techniques have emerged as critical enablers for transparency in complex models. SHAP values, grounded in cooperative game theory, provide consistent and theoretically sound feature attribution that decomposes model predictions into individual variable contributions [6]. Recent marketing studies have successfully applied SHAP to interpret consumer behavior models and advertising response patterns [7,8].
Despite these methodological advances, a significant gap remains between technical model outputs and managerial decision-making. Large language models (LLMs) offer promising solutions for bridging this gap by automating the translation of complex analytical results into natural-language insights [9,10]. However, few studies have systematically integrated ML, XAI, and LLMs into a unified marketing analytics framework that simultaneously optimizes accuracy, interpretability, and business usability, a gap this research aims to address.
3. Methodology
3.1. Machine Learning: XGBoost-based MMM
In contrast to the traditional regression-based MMM framework, this study introduces an XGBoost-based MMM model to improve predictive accuracy and robustness. XGBoost is a gradient-boosted decision-tree algorithm that models nonlinear relationships and interaction effects among marketing variables, providing a more realistic representation of advertising phenomena such as diminishing returns, saturation, and cross-channel synergies. In this framework, marketing expenditures across channels (e.g., search, social media, and display) serve as input features to predict business response variables such as daily sales or revenue. The boosted ensemble model can be expressed as:
where denotes the predicted marketing response, x represents the multidimensional vector of marketing inputs, T is the total number of boosted trees, and is the t-th regression tree. Each tree is added sequentially to minimize the residual errors of the previous iteration, allowing the model to approximate highly nonlinear and interactive relationships without restrictive parametric assumptions.
XGBoost incorporates several mechanisms such as learning rate, tree-specific regularization, and weighted quantile-sketch algorithms to prevent overfitting and improve computational efficiency, making it suitable for high-dimensional marketing data. To validate the performance improvement, the XGBoost-based MMM model is compared with a baseline regression-based model through R2, RMSE, MAE, and MAPE.
3.2. Explainable AI: SHAP Method
To enhance the interpretability of the XGBoost-based MMM, this study incorporates SHapley Additive exPlanations (SHAP), a game-theoretic framework that decomposes model predictions into additive contributions from individual marketing spend features. SHAP quantifies how changes in each channel’s spending shift the predicted business outcome relative to a baseline, enabling transparent attribution of media effects within the XGBoost-based nonlinear modeling framework. The model prediction can be expressed as:
where represents the predicted business outcome, is the expected model output across all samples, and denotes the Shapley value for marketing spend feature j, capturing its marginal contribution. Conceptually, reflects how the expected business outcome changes when channel j’s spending is observed at its actual level , compared with when it is replaced by a reference value :
By aggregating local Shapley values across all observations, the model reveals global insights into each channel’s importance, nonlinear spend-response patterns, and cross-channel interactions. These relationships are visualized through feature-importance bar plots, beeswarm summaries, and dependence plots, which illustrate how business outcomes respond to different levels of marketing investment across channels. The resulting explanatory structure also serves as input to the LLM translation module, enabling SHAP outputs to be converted into coherent natural-language explanations that support business interpretation and strategic recommendations.
3.3. Generative AI: LLM-Based Interpretation and Recommendation
To improve the business usability of the machine learning and explainable AI outputs, this study integrates a generative large language model (LLM) to automate the translation of technical results into structured business reports. Implemented through Anthropic’s Claude API, the LLM processes the XGBoost-based MMM model outcomes and SHAP visualization plots to generate coherent natural-language summaries tailored for marketing decision-making. Guided by a structured prompt that emulates the reasoning of a senior data scientist, the LLM synthesizes three components: (1) an executive summary of findings; (2) key insights on channel effectiveness; and (3) data-driven recommendations for budget allocation and ROI optimization.
By integrating the LLM translation module into the analytical pipeline, the framework converts complex model outputs into interpretable narratives and actionable marketing recommendations. This enhancement improves the readability, accessibility, and managerial relevance of the results, enabling marketing stakeholders to obtain data-driven insights without requiring statistical or technical expertise and to optimize their marketing strategies to achieve maximum return on investment.
4. Framework Design
The overall system architecture, illustrated in Figure 1, consists of four integrated layers that function as an automated end-to-end pipeline. The first layer is the data input layer, which ingests daily marketing expenditures and business metrics and performs initial data checks, cleaning, and exploratory data analysis. The cleaned data flows directly into the second layer, a machine learning module, where an XGBoost-based MMM is trained and evaluated to model the relationships between marketing inputs and business outcomes. Building on these model outputs, the third layer applies the SHAP explainable AI module to generate feature-level marginal contributions and global impact distributions through feature-importance bar charts, beeswarm plots, and dependence curves. The fourth layer integrates the Claude-based LLM module, which transforms the model predictions and SHAP visualizations into executive summaries, key insights, and channel allocation guidance. Together, these interdependent layers form a unified system that seamlessly transforms raw data into business reports while ensuring predictive accuracy, interpretability, and managerial usability.
5. Empirical Analysis
5.1. Data Selection and Preprocessing
To evaluate the proposed framework, this study utilizes the “Multi-Region Marketing Mix Modeling (MMM) Dataset for Several eCommerce Brands” published on Figshare [11]. The dataset provides daily marketing expenditures across Google, Meta, and TikTok, along with online purchase records for 82 global e-commerce brands. For analysis, we focus on a U.S. apparel e-commerce brand with daily data spanning July 26, 2021 to May 20, 2024. The empirical objective is to quantify the relationship between daily digital marketing investments and online store revenue. The dependent variable, Revenue, is defined as the net value of online purchases after deducting discounts:
The independent variables consist of daily spending across nine channels, including: GOOGLE_PAID_SEARCH_SPEND, GOOGLE_SHOPPING_SPEND, GOOGLE_PMAX_SPEND, GOOGLE_DISPLAY_SPEND, GOOGLE_VIDEO_SPEND, META_FACEBOOK_SPEND, META_INSTAGRAM_SPEND, META_OTHER_SPEND, and TIKTOK_SPEND.
5.2. Exploratory Data Analysis
Before model estimation, an exploratory data analysis (EDA) was conducted to obtain an overview of the temporal dynamics and inter-variable relationships within the dataset. Figure 2 presents the weekly time series of total digital marketing expenditure and revenue from 2021 to 2024. The two series exhibit strong co-movement, with revenue peaks generally following periods of intensified marketing investment. This pattern suggests a close short-term linkage between aggregate digital advertising activity and online sales performance, providing initial evidence of the relevance of marketing spend variations for revenue generation.
Figure 3 reports the correlation heatmap between revenue and daily spending across the nine marketing channels. Meta Instagram and Google PMax display the strongest positive correlations with revenue, followed by Google Paid Search and Meta Facebook. In contrast, channels such as TikTok, Google Shopping, Google Display, and Google Video show weak or negative correlations, indicating limited direct contribution to short-term revenue. Several channels also exhibit moderate intercorrelation particularly across Meta and Google platforms, suggesting overlapping activation patterns and highlighting potential multicollinearity concerns that further motivate the use of nonlinear machine learning models in subsequent analysis.
Collectively, the EDA results demonstrate that variations in digital marketing investments are strongly associated with short-term revenue dynamics and reveal heterogeneous performance across channels. These observations underscore the need for a more flexible modeling framework to quantify marketing effectiveness, as developed in the following sections.
5.3. Baseline and Machine Learning Models
This study develops two modeling approaches to quantify the relationship between marketing spend and revenue: (1) a traditional linear regression-based MMM baseline and (2) an XGBoost-based MMM model. These models are used to assess the predictive performance of the proposed framework and illustrate the potential gains from adopting nonlinear machine learning methods.
- (1)
- Baseline Model: Linear Regression-based MMM
A standard ordinary least squares (OLS) specification is employed as the benchmark. The model relates daily revenue to the nine digital marketing channels as follows:
Although widely used in classical MMM applications, the linear form limits the model’s ability to represent nonlinear advertising responses, diminishing returns, and interaction effects, which are common in digital marketing settings.
- (2)
- XGBoost-based MMM
To address these limitations, the primary machine learning model in this study is XGBoost. As described in Section 3.1, XGBoost is well suited for capturing nonlinear patterns and complex dependencies among marketing channels. In this empirical analysis, the model is trained using the following hyperparameters:
- n_estimators = 50
- max_depth = 6
- learning_rate = 0.1
- subsample = 0.8
- colsample_bytree = 0.8
- objective = ‘reg:squarederror’
- n_jobs = 1, verbosity = 0, random_state = seed
These settings provide a balance between model complexity and generalization, with regularization controlled through subsampling and tree-depth constraints. All models were evaluated using an 80/20 train-test split to ensure consistent out-of-sample performance comparison. As shown in Section 5.4, XGBoost-based MMM achieves substantially higher predictive accuracy than the linear baseline.
5.4. Model Performance Comparison
Table 1 compares the predictive accuracy of the linear regression-based MMM and the XGBoost-based MMM model using four standard evaluation metrics R², RMSE, MAE, and MAPE on the test dataset. The XGBoost model achieves a substantially higher R² (0.9123 vs. 0.8572) and markedly lower error rates, reducing RMSE by 21.7%, MAE by 22.8%, and MAPE by 33.1%. These improvements indicate that nonlinear effects and interaction patterns missed by the linear baseline are effectively captured by the boosting model.
To further evaluate the predictive reliability of the XGBoost-based model, Figure 4 presents the Predicted vs. Actual plot and the residual distribution. In Figure 4(a), the predicted values align closely with the 45-degree reference line, demonstrating strong predictive fidelity across the full revenue range. Figure 4(b) plots the residuals against predicted values. The residuals are centered around zero with no visible systematic pattern, indicating that XGBoost-based model effectively mitigates heteroskedasticity and nonlinear biases present in the linear baseline. Overall, these results validate the robustness and stability of the XGBoost-based MMM model in predicting revenue based on multi-channel digital marketing expenditures.
5.5. Explainable AI Analysis: SHAP
Next, SHAP was employed to quantify and visualize the marginal contributions of each marketing channel to revenue, providing a transparent decomposition of the XGBoost-based MMM model results. Figure 5 (a-c) presents the SHAP-based explainability analysis:
The Feature Importance Plot (Figure 5a) ranks variables by their mean absolute SHAP values, showing that Meta Instagram Spend, Google PMax Spend, and Meta Facebook Spend are the most influential predictors, jointly accounting for the largest share of model explainability, affirming that social media and integrated Google campaigns play dominant roles in driving sales. The Beeswarm Plot (Figure 5b) further illustrates the direction and magnitude of each feature’s impact on predicted revenue: Higher spending levels (shown in red) for Meta Instagram, Google PMax, and Meta Facebook are consistently associated with strong positive SHAP values, confirming their revenue-generating roles. In contrast, Google Display and Google Video exhibit predominantly negative SHAP values regardless of spend, suggesting inefficiency or saturation at very low spend levels. TikTok shows minimal yet slightly positive contributions, consistent with its small share in the marketing mix. Finally, the Dependence Plots (Figure 5c) visualize nonlinear relationships between marketing spending and revenue predictions across all channels. Meta Instagram, Google PMax, and Google Paid Search show strong positive returns. Meta Facebook delivers moderate gains with noticeable saturation at higher spend levels. Shopping, Display, Video, and Meta Other exhibit weak or limited short-term impact. TikTok shows minimal spend and small but positive effects, suggesting underinvestment rather than low effectiveness.
5.6. LLM-Based Summary and Recommendation
This section reports the key outputs generated by the LLM after synthesizing the XGBoost-based MMM predictions and SHAP plots using the prompts designed in Section 3.3. The automated Executive Summary highlights the strong predictive performance of the model (R² = 0.9123) and emphasizes a notable mismatch between current spending allocation and revenue impact efficiency. It identifies Meta Instagram and Google PMax as the dominant contributors, while also noting saturation in Meta Facebook and Google Paid Search, negative returns from Google Display and Video, and substantial underinvestment in TikTok. The Key Insights further detail channel effectiveness: (i) Instagram yields the highest SHAP impact with sustained positive returns; (ii) PMax maintains stable efficiency across its spend range; (iii) Facebook and Paid Search experience diminishing returns at higher levels; (iv) Display and Video depress revenue; and (v) TikTok offers the strongest growth potential given minimal current investment. The Business Recommendations consolidate these findings into actionable budget guidance. The LLM suggests increasing investment in Instagram (to $1,500-2,000 daily) and TikTok (to $85-150 daily or a $2,000-3,000 monthly testing budget), modestly raising Paid Search (to $500-650 daily), and fully eliminating Display and Video. It also recommends maintaining PMax at its current level ($779 daily) and capping Meta Facebook at roughly $2,000 daily to avoid inefficiency. This model-inferred reallocation strategy is expected to increase overall marketing ROI by 18–25% and potentially generate an additional $50,000–75,000 in monthly revenue without increasing total spend.
6. Results & Discussion
The proposed AI-enhanced marketing mix modeling (MMM) framework demonstrates clear improvements in accuracy, interpretability, and practical business utility. Compared with the traditional OLS regression baseline, the XGBoost-based MMM model achieves substantially higher predictive precision (R² = 0.9123) and reduces RMSE and MAE by 21.7% and 22.8%, respectively. These gains confirm the model’s ability to capture nonlinear response patterns and cross-channel interactions that linear models typically overlook. By integrating SHAP explainable AI, the framework further quantifies each channel’s marginal contribution to revenue, revealing that Meta Instagram, Google PMax, and Meta Facebook generate the strongest positive impacts, whereas channels such as Google Display, Google Video, and TikTok exhibit limited short-term effectiveness under current spending levels. The addition of the Claude LLM further enhances managerial usability by converting technical model outputs into clear natural-language insights, enabling non-technical stakeholders to interpret analytical results and adjust channel allocations accordingly. The recommended reallocation strategy is expected to improve overall marketing ROI by approximately 18-25%.
Although the empirical analysis is demonstrated using a single brand, the proposed framework is designed to be broadly applicable across industries and organizational contexts. It offers substantial practical value for a wide range of firms, particularly small and medium-sized businesses (SMBs) with limited analytical resources. By automating model interpretation and transforming advanced ML/AI outputs into accessible insights, the system significantly lowers the barrier to adopting data-driven decision-making. This accessibility enables non-technical users to make more informed budget decisions, reduce inefficiencies, and enhance marketing performance at lower analytical cost. Moreover, as a scalable and domain-agnostic solution, the framework can support SMBs across diverse sectors, contributing to the broader democratization of advanced marketing analytics, accelerating digital transformation, and enhancing the competitiveness and sustainable growth.
7. Conclusions & Future Research
This study presents an AI-enhanced marketing mix modeling (MMM) framework that integrates machine learning-based predictive accuracy with explainable AI interpretability and LLM-enabled managerial usability. By combining XGBoost-based MMM with SHAP and a Claude-based LLM module, the framework enhances modeling precision, transparency, and business applicability, making data-driven marketing insights more accessible to non-technical users. Future research will extend this approach by incorporating causal inference techniques (e.g., geo-experiments and Bayesian structural time-series models) to further strengthen real-world robustness and attribution accuracy. In addition, advancing the framework toward real-time analytics and adaptive budget optimization will improve its ability to respond to dynamic market conditions. Ultimately, the long-term objective is to develop a scalable SaaS platform that enables small and medium-sized enterprises (SMEs) to leverage AI-driven marketing intelligence, improve ROI, and accelerate their digital transformation.
Data Availability Statement
The dataset used in this study is publicly available at Figshare: https://figshare.com/articles/dataset/25314841.
References
- Hanssens, D. M., Parsons, L. J., and Schultz, R. L. 2001. Market response models: Econometric and time series analysis (2nd ed.). Springer Science & Business Media, New York, NY, USA.
- Chan, D. and Perry, M. 2017. Challenges and opportunities in media mix modeling. Google Research, Mountain View, CA, USA. https://research.google/pubs/challenges-and-opportunities-in-media-mix-modeling/.
- Naik, P. A., Schultz, D. E., and Srinivasan, S. 2007. Perils of using OLS to estimate multimedia communications effects. Journal of Advertising Research 47, 3 (September 2007), 257–269. [CrossRef]
- Chen, T. and Guestrin, C. 2016. XGBoost: A scalable tree boosting system. In Proceedings of the 22nd ACM SIGKDD International Conference on Knowledge Discovery and Data Mining (KDD ‘16). Association for Computing Machinery, New York, NY, USA, 785–794. [CrossRef]
- Rudin, C. 2019. Stop explaining black box machine learning models for high stakes decisions and use interpretable models instead. Nature Machine Intelligence 1, 5 (May 2019), 206–215. [CrossRef]
- Lundberg, S. M. and Lee, S.-I. 2017. A unified approach to interpreting model predictions. In Proceedings of the 31st International Conference on Neural Information Processing Systems (NIPS ‘17). Curran Associates Inc., Red Hook, NY, USA, 4765–4774. https://dl.acm.org/doi/10.5555/3295222.3295230.
- Bastos, J. A. and Bernardes, M. I. 2024. Understanding online purchases with explainable artificial intelligence. Information 15, 10 (2024), Article 587. [CrossRef]
- Zhao, X. and Mahboobi, S. 2018. Shapley value methods for attribution modeling in online advertising. arXiv preprint arXiv:1802.06657 (2018).
- Brown, T. B., Mann, B., Ryder, N., Subbiah, M., Kaplan, J., Dhariwal, P., Neelakantan, A., Shyam, P., Sastry, G., Askell, A., Agarwal, S., Herbert-Voss, A., Krueger, G., Henighan, T., Child, R., Ramesh, A., Ziegler, D. M., Wu, J., Winter, C., Hesse, C., Chen, M., Sigler, E., Litwin, M., Gray, S., Chess, B., Clark, J., Berner, C., McCandlish, S., Radford, A., Sutskever, I., and Amodei, D. 2020. Language models are few-shot learners. In Proceedings of the 34th International Conference on Neural Information Processing Systems (NeurIPS ‘20). Curran Associates Inc., Red Hook, NY, USA, 1877–1901.
- Kasneci, E., Seßler, K., Küchemann, S., Bannert, M., Dementieva, D., Fischer, F., Gasser, U., Groh, G., Günnemann, S., Hüllermeier, E., Krusche, S., Kutyniok, G., Michaeli, T., Nerdel, C., Pfeffer, J., Poquet, O., Sailer, M., Schmidt, A., Seidel, T., Stadler, M., Weller, J., Kuhn, J., and Kasneci, G. 2023. ChatGPT for good? On opportunities and challenges of large language models for education. Learning and Individual Differences 103 (April 2023), Article 102274. [CrossRef]
- Anderson, A. 2024. Multi-region marketing mix modelling (MMM) dataset for several eCommerce brands. figshare Dataset. [CrossRef]
Figure 1.
Architecture of AI-Enhanced MMM System.
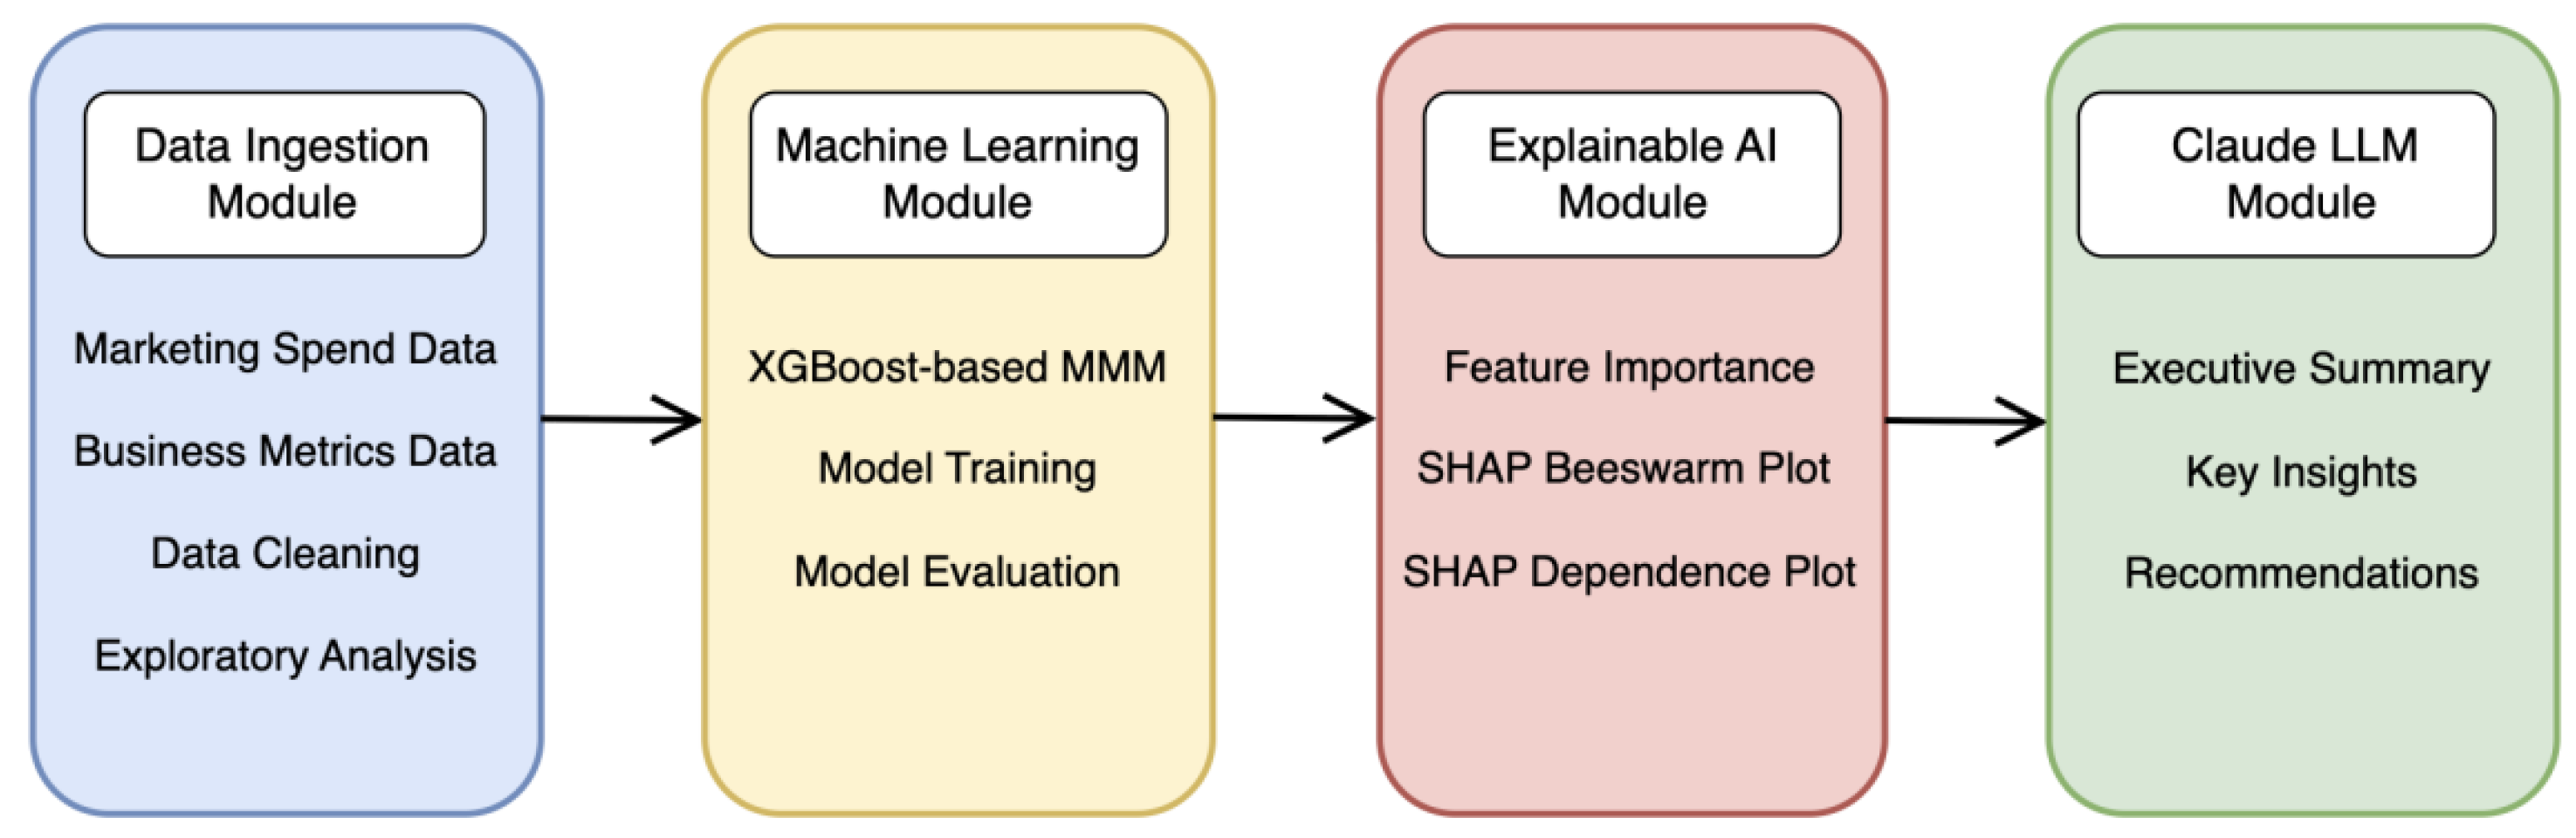
Figure 2.
Weekly Trend of Total Marketing Expenditure and Revenue.
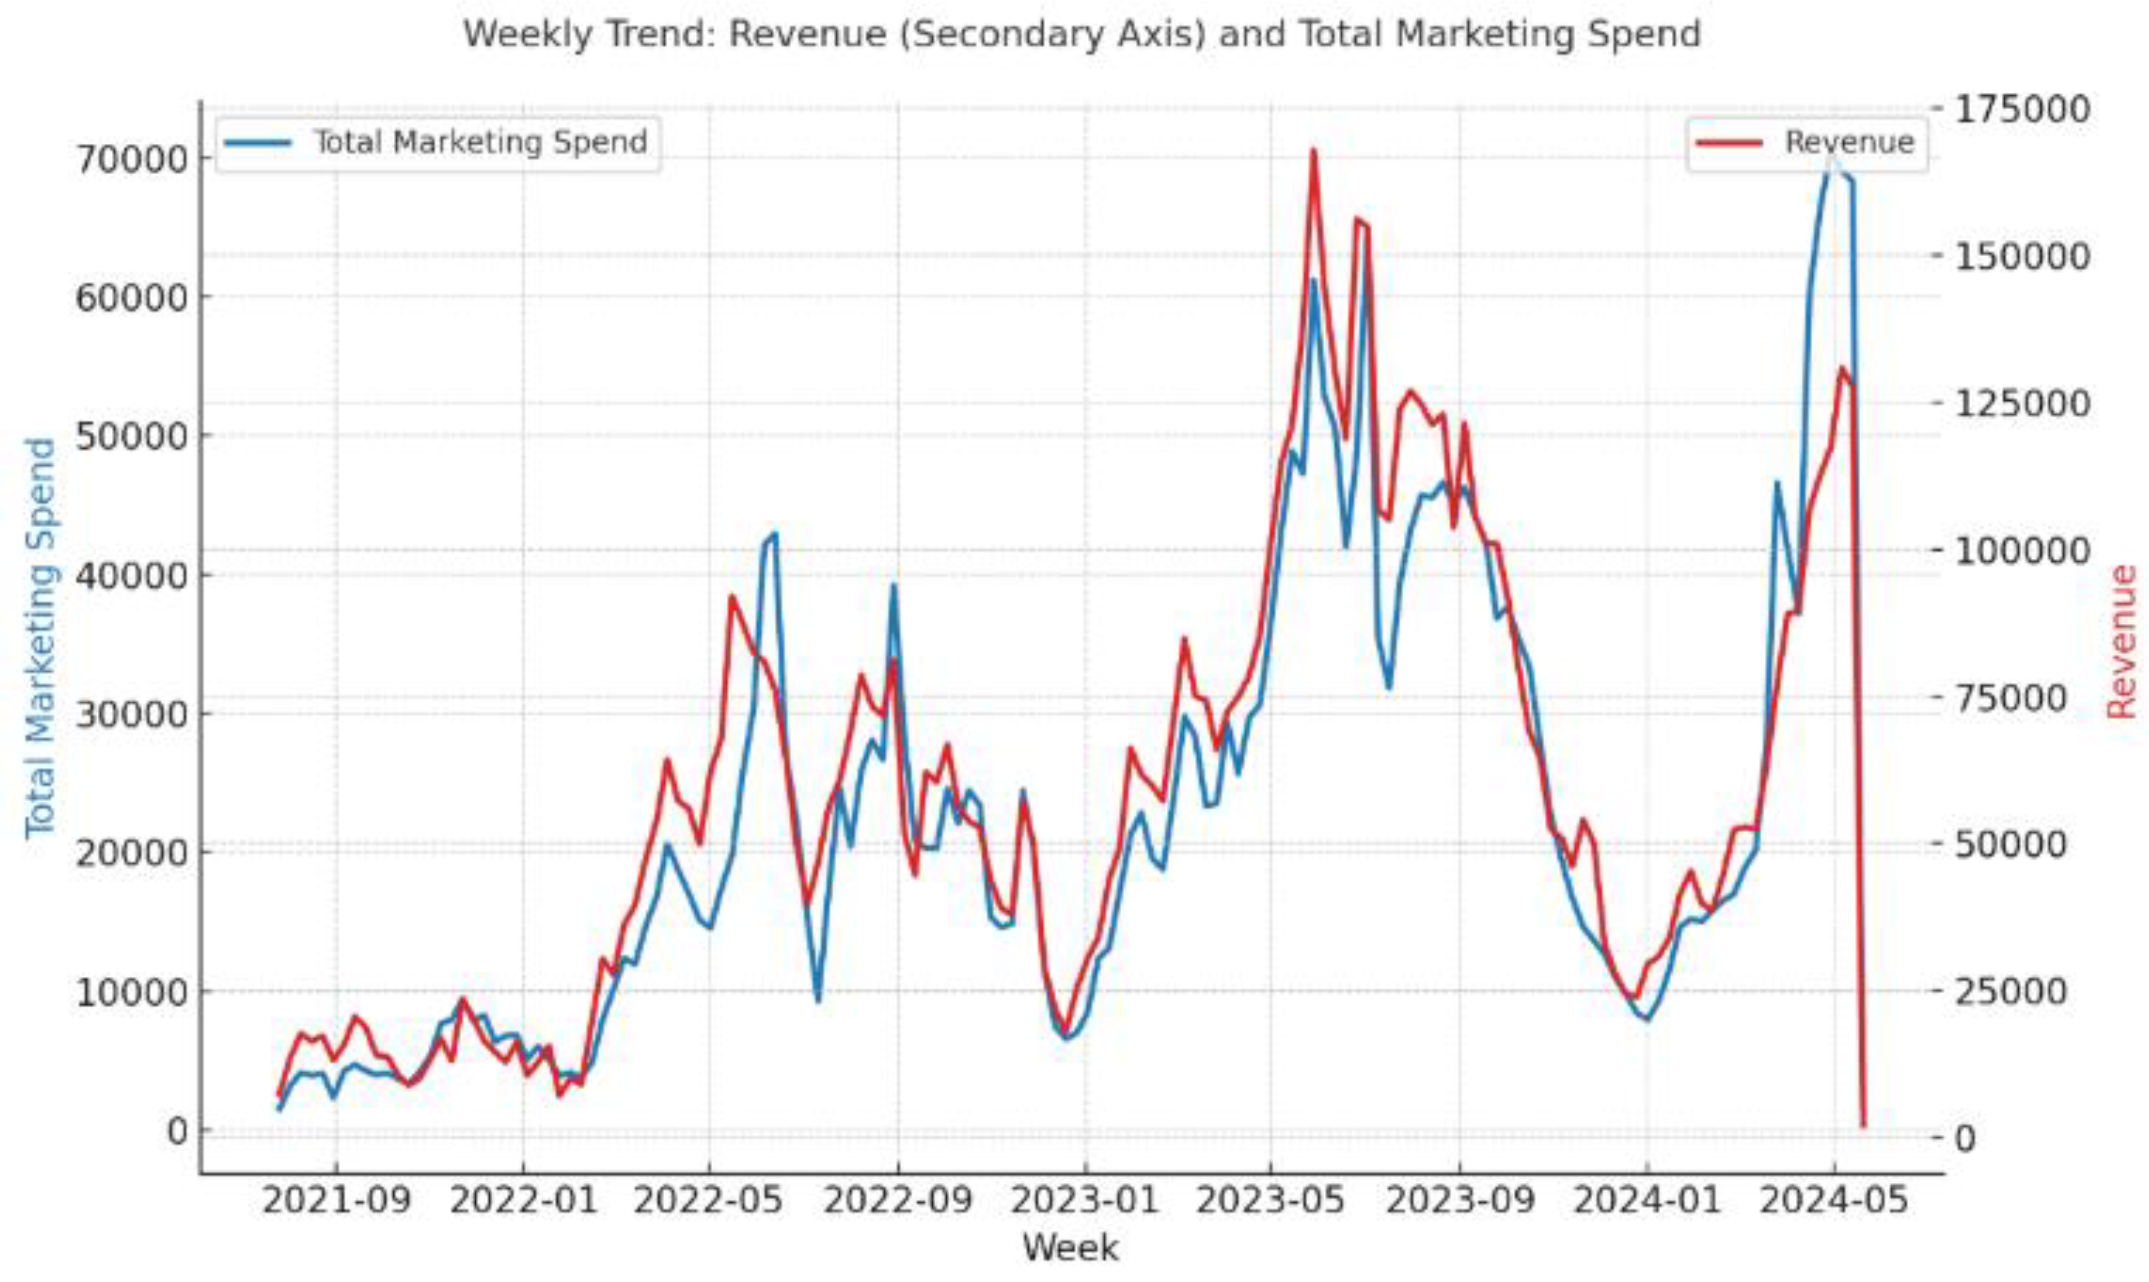
Figure 3.
Correlation Heatmap (Revenue vs Marketing spend).
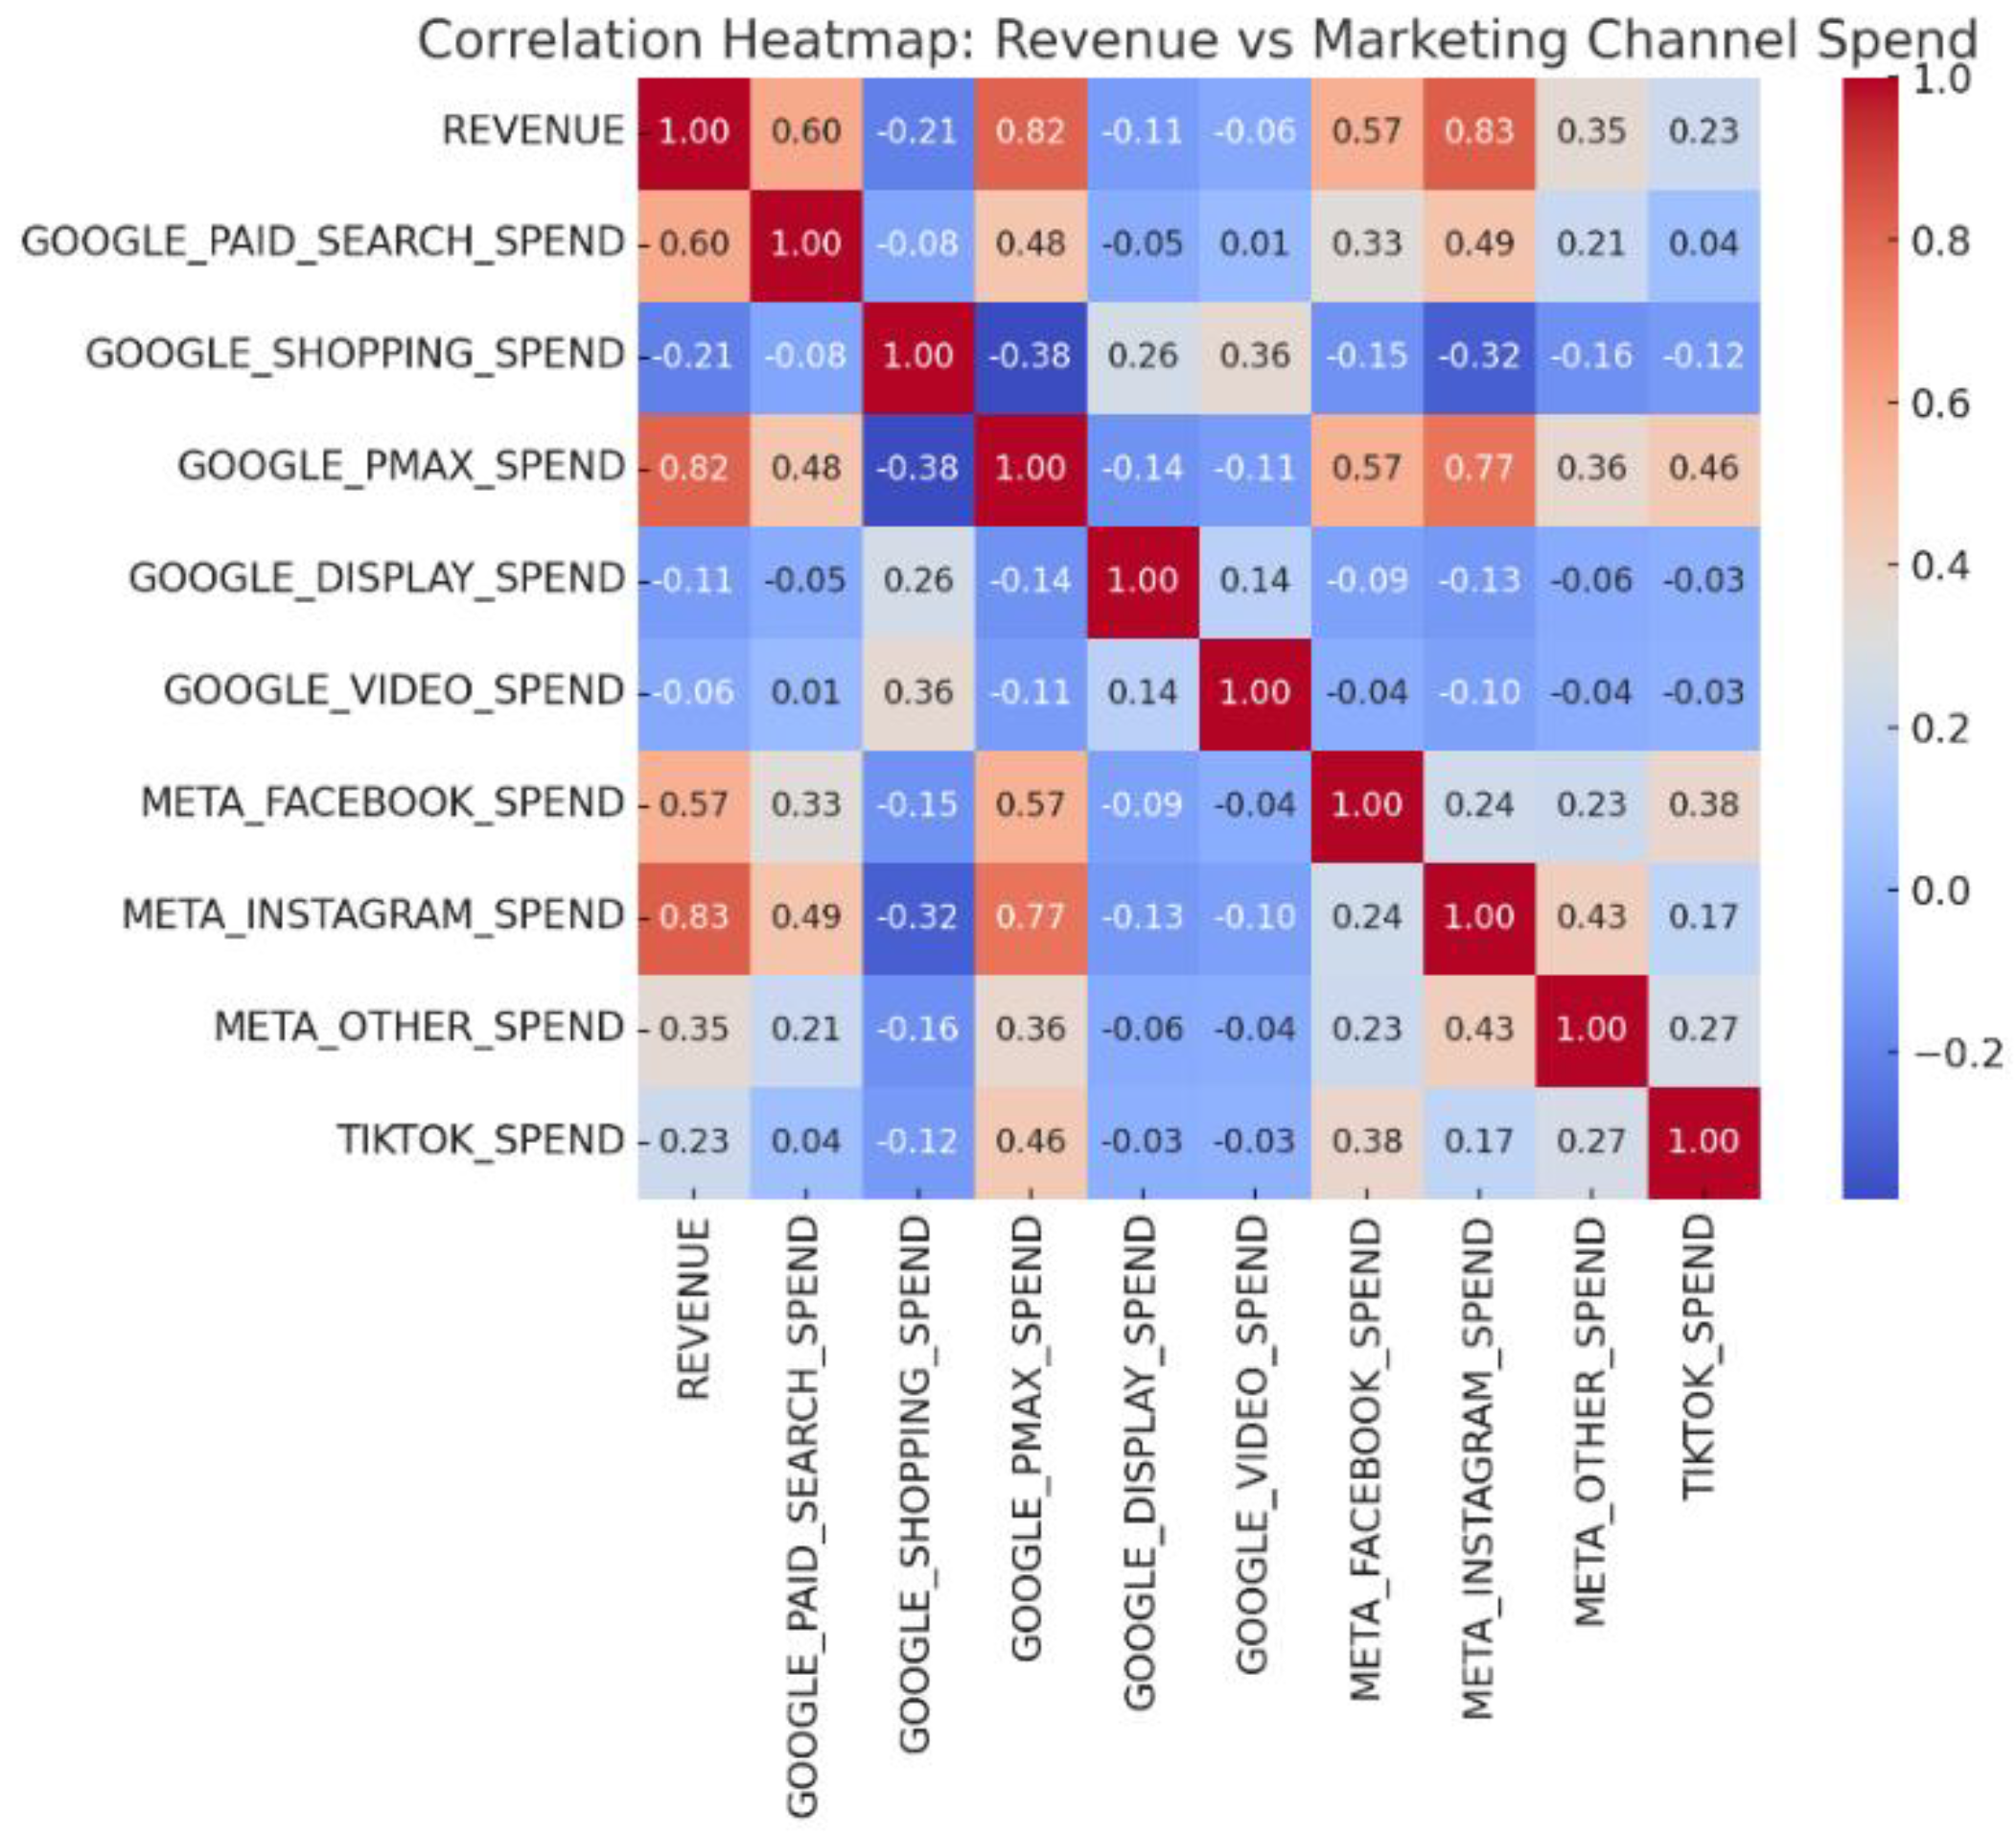
Figure 4.
XGBoost-based Model Evaluation: (a) Predictions vs. Actual Values; (b) Residual Distribution.
Figure 4.
XGBoost-based Model Evaluation: (a) Predictions vs. Actual Values; (b) Residual Distribution.
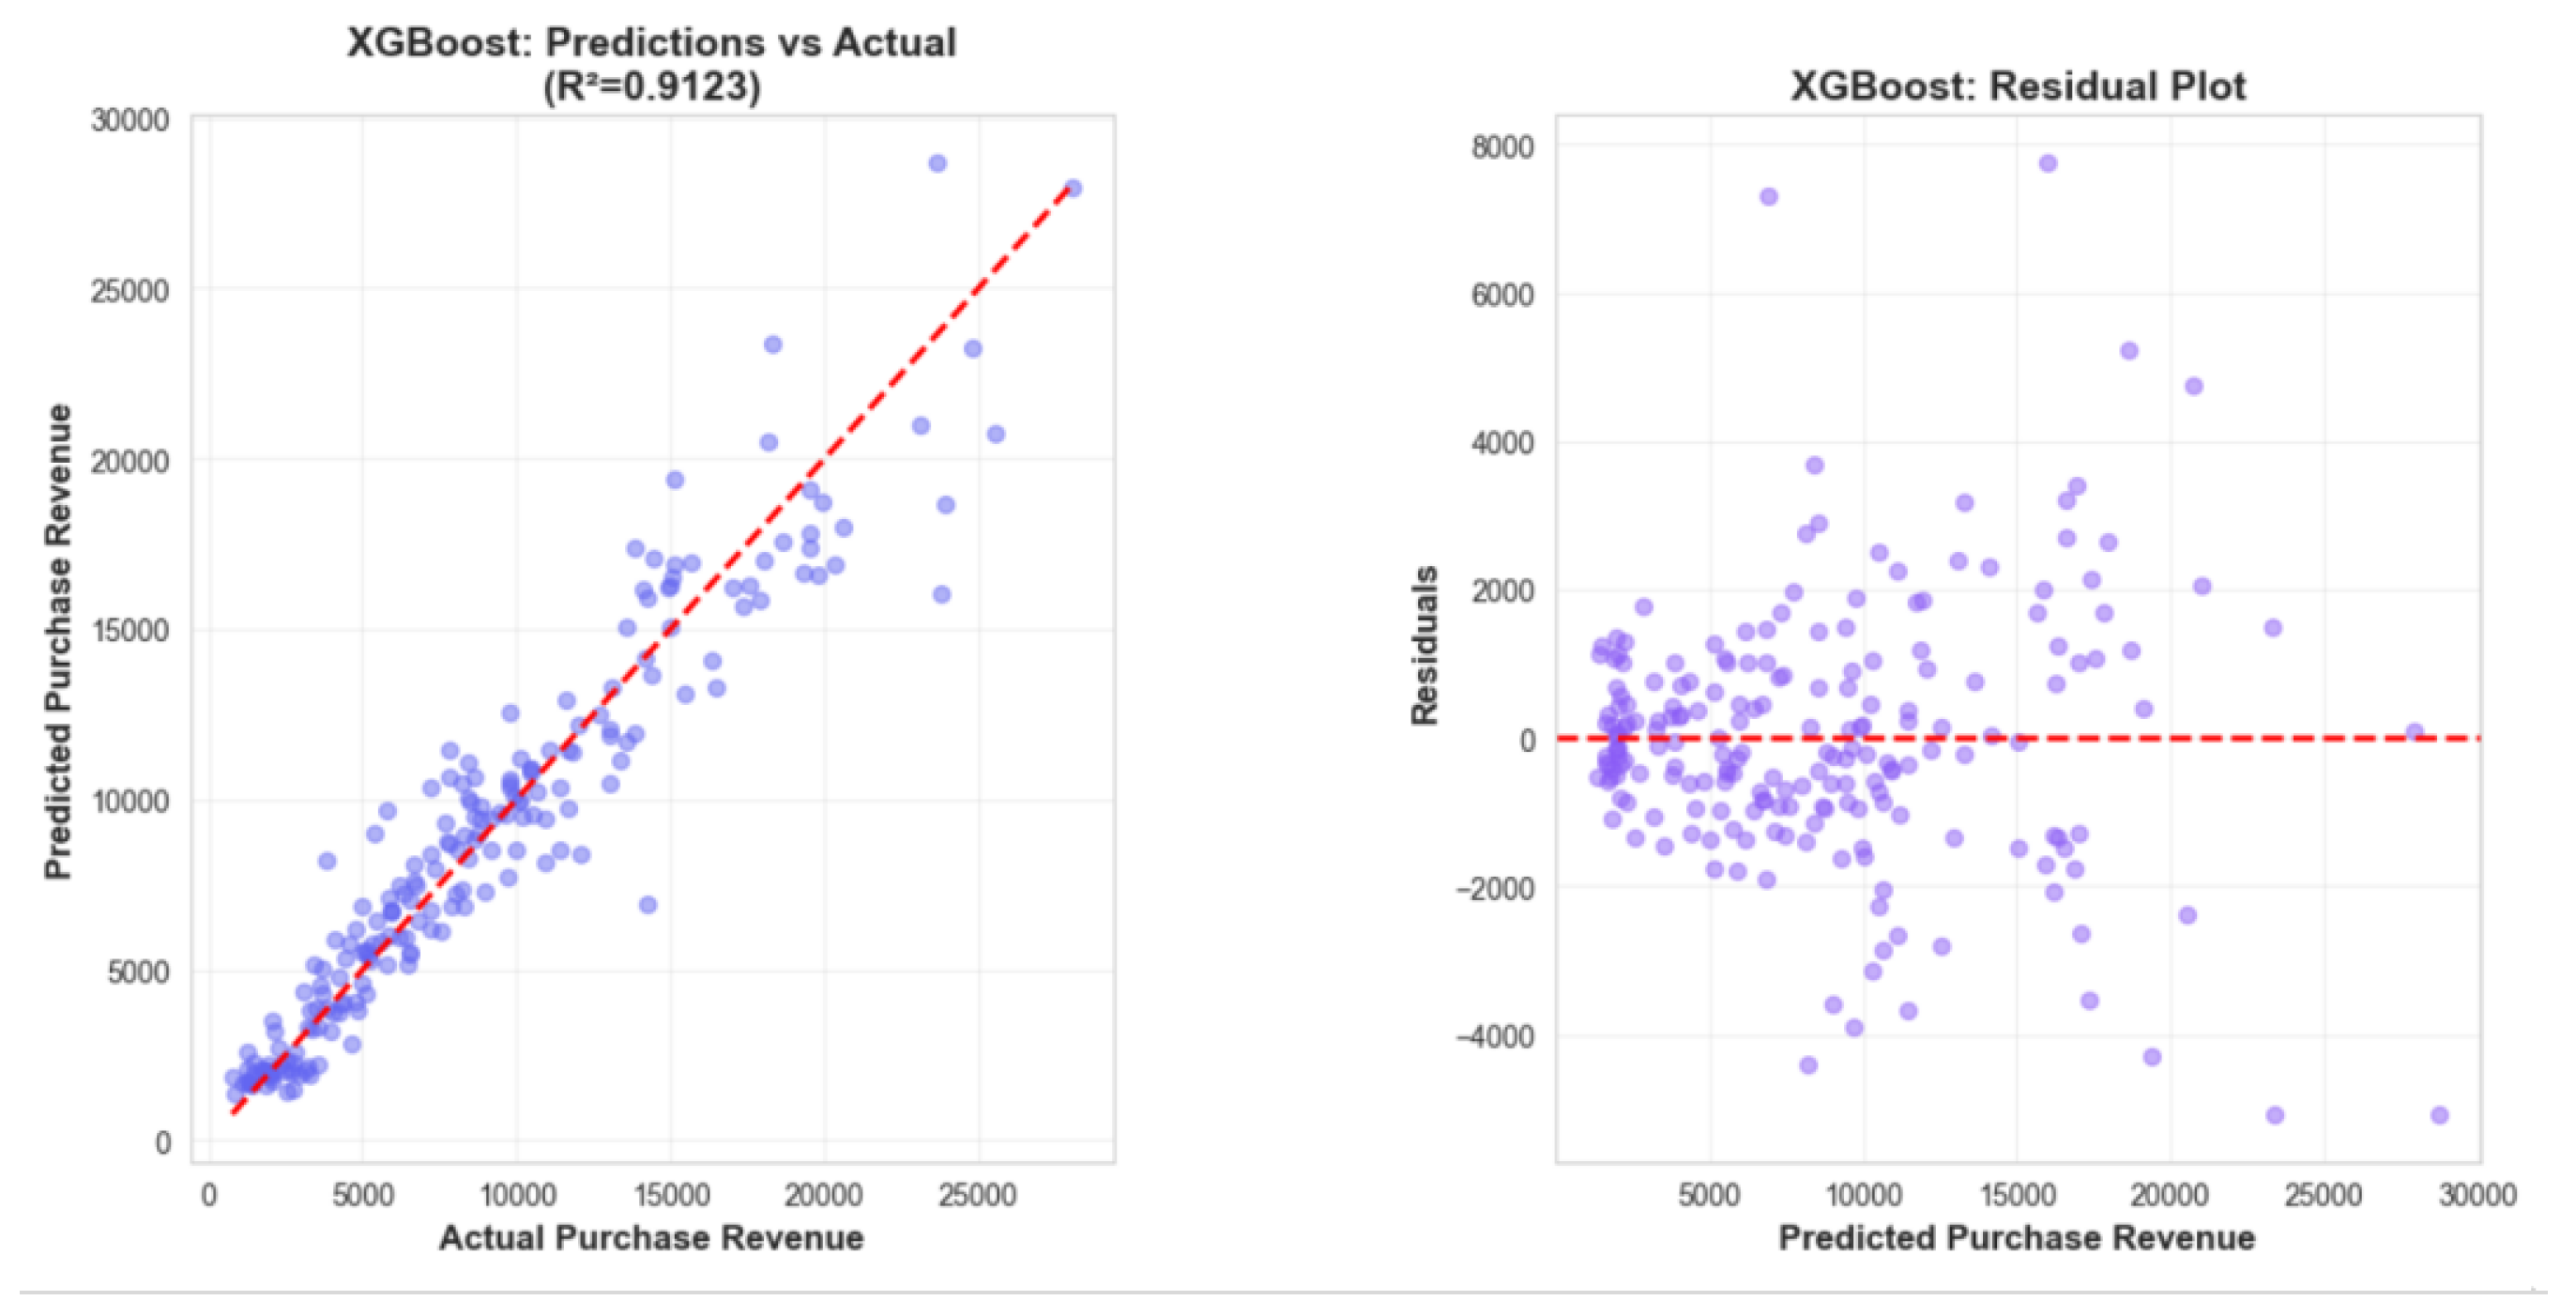
Figure 5.
SHAP-Based Explainability Analysis: (a) Feature Importance Bar Plot; (b) Beeswarm Summary Plot; (c) Dependence Plots Across Marketing Channels.
Figure 5.
SHAP-Based Explainability Analysis: (a) Feature Importance Bar Plot; (b) Beeswarm Summary Plot; (c) Dependence Plots Across Marketing Channels.
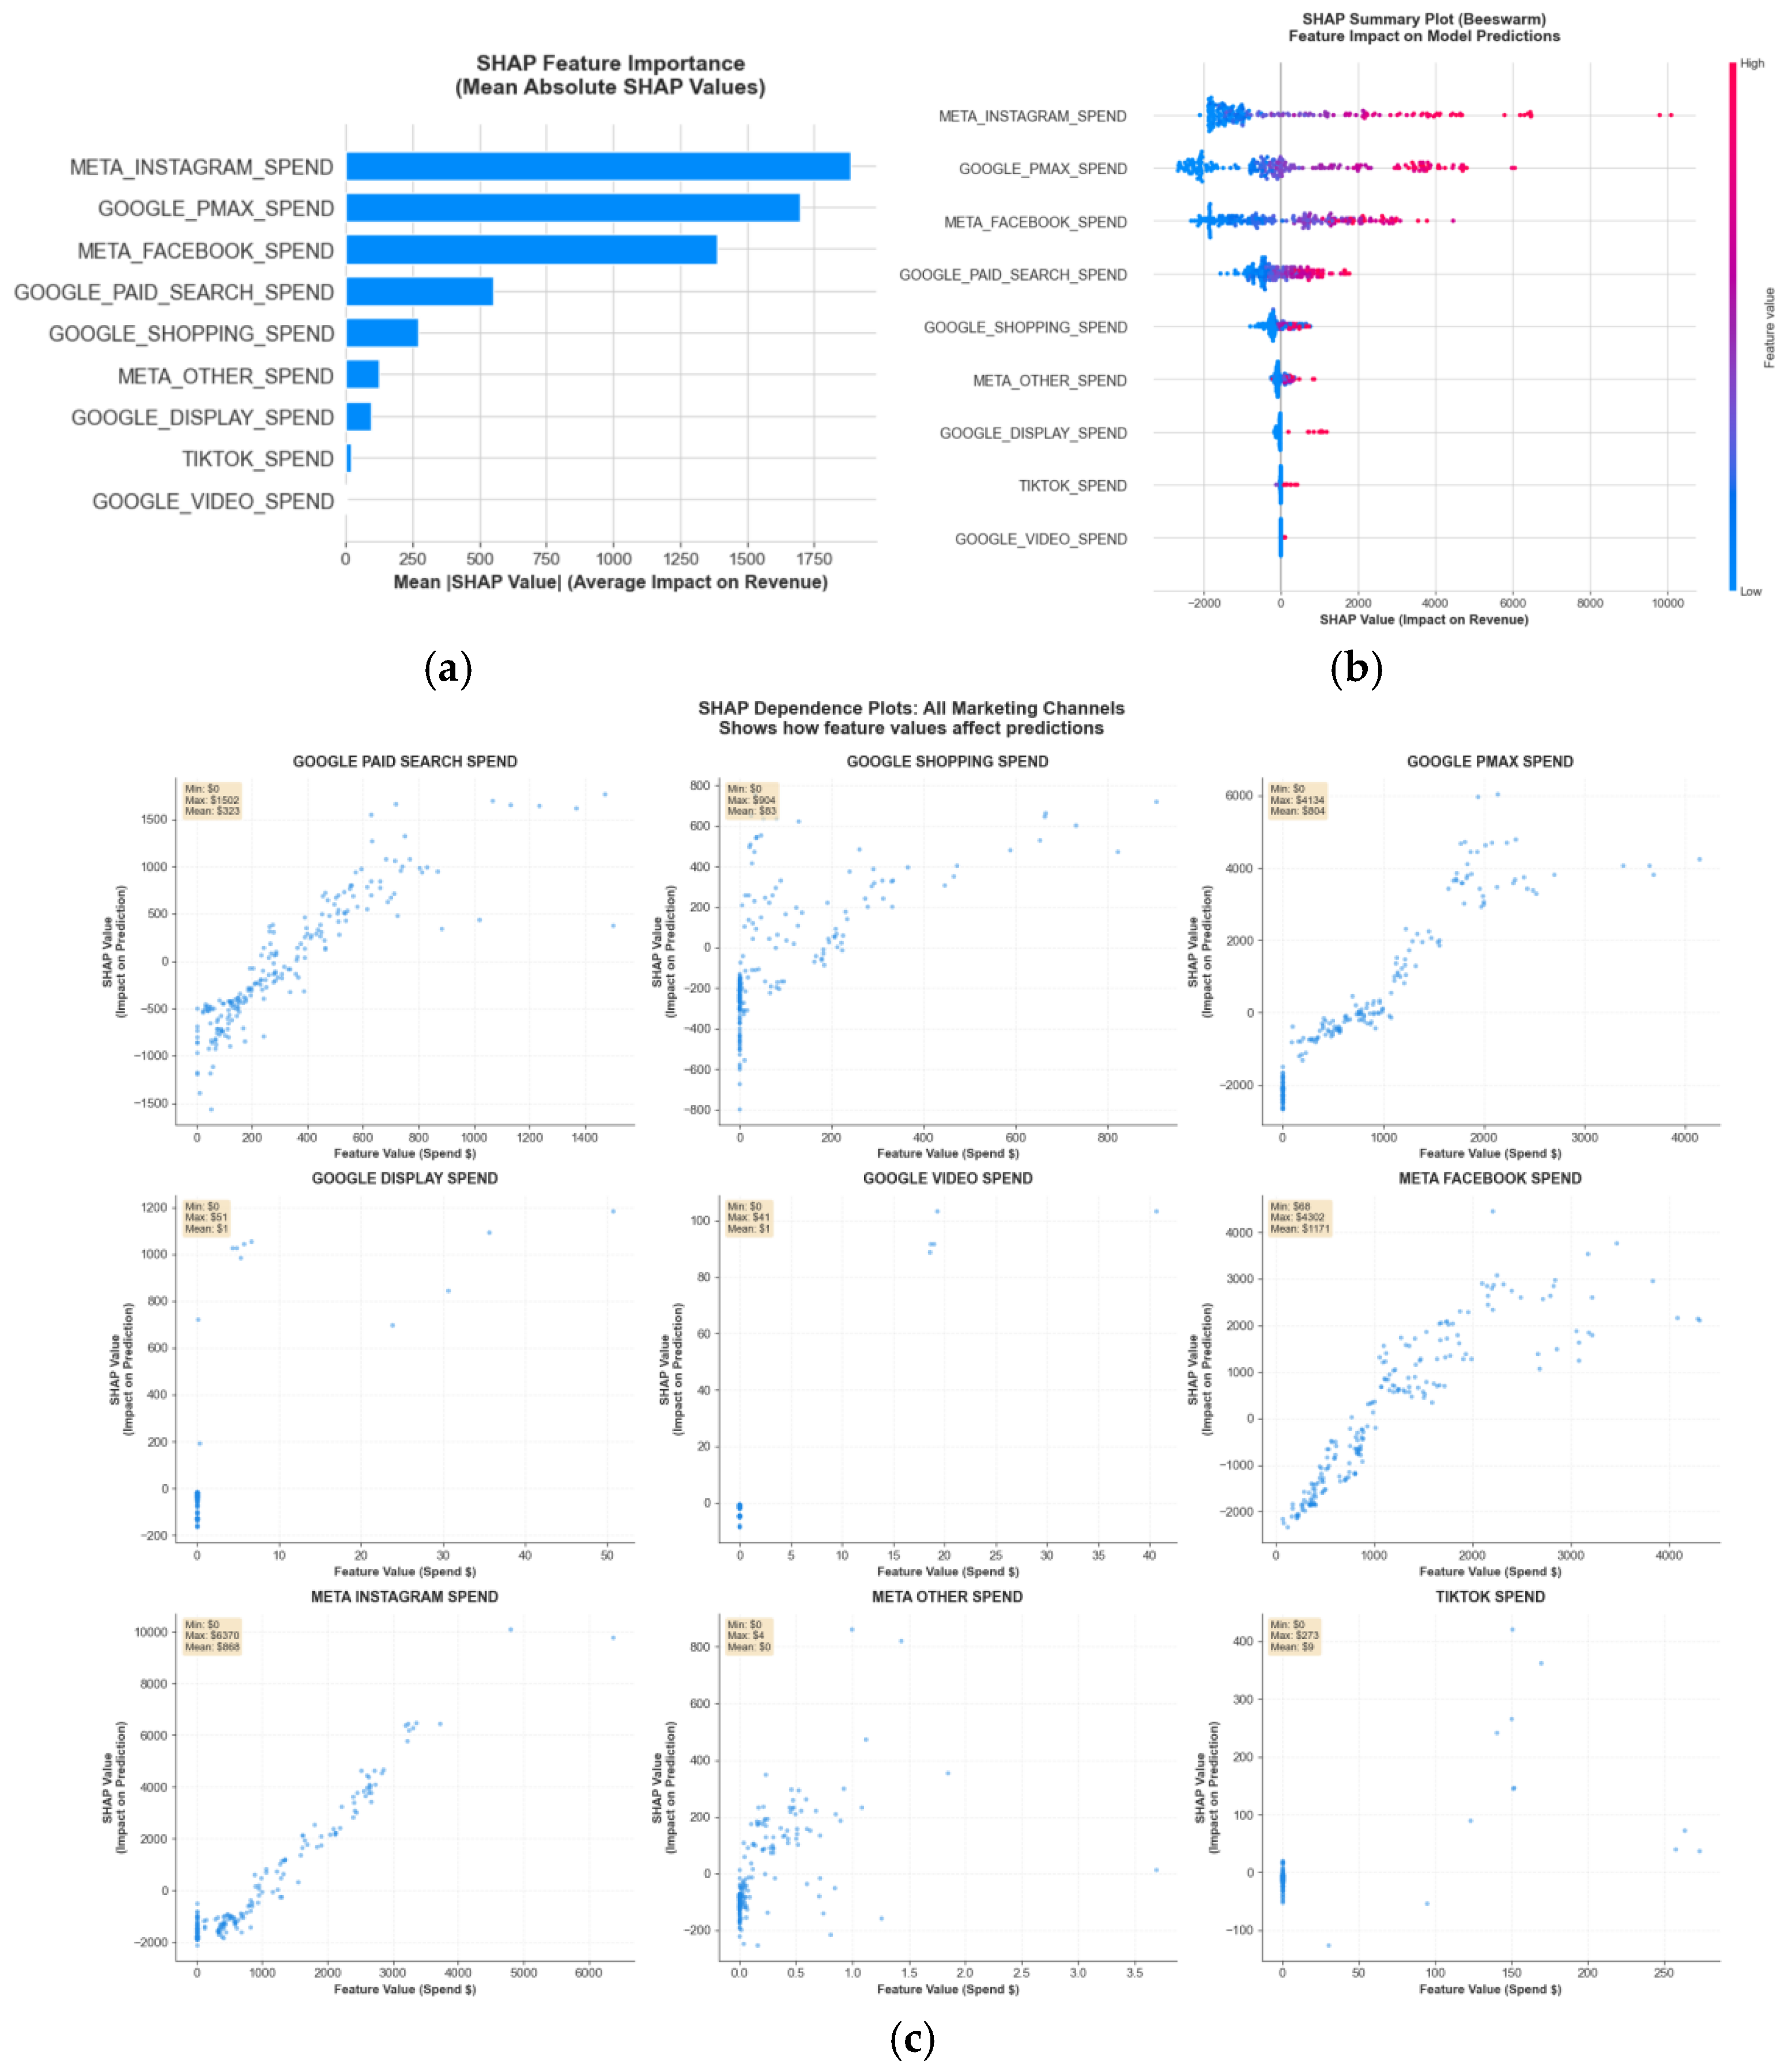

Table 1.
Model Performance Comparison.
| Model | R² | RMSE | MAE | MAPE |
|---|---|---|---|---|
| Linear Regression-based MMM | 0.8572 | 2222.12 | 1590.11 | 27.37% |
| XGBoost-based MMM | 0.9123 | 1741.03 | 1228.14 | 18.33% |
Disclaimer/Publisher’s Note: The statements, opinions and data contained in all publications are solely those of the individual author(s) and contributor(s) and not of MDPI and/or the editor(s). MDPI and/or the editor(s) disclaim responsibility for any injury to people or property resulting from any ideas, methods, instructions or products referred to in the content. |
© 2026 by the authors. Licensee MDPI, Basel, Switzerland. This article is an open access article distributed under the terms and conditions of the Creative Commons Attribution (CC BY) license (http://creativecommons.org/licenses/by/4.0/).
Copyright: This open access article is published under a Creative Commons CC BY 4.0 license, which permit the free download, distribution, and reuse, provided that the author and preprint are cited in any reuse.


