Submitted:
17 January 2026
Posted:
19 January 2026
You are already at the latest version
Abstract
Background: Acute coronary syndrome (ACS) is a cannot miss diagnosis. The gold standard workup for this requires serial troponin biomarker evaluation over a period of hours. Traditionally, many of these patients required telemetry while being evaluated in this fashion, however high-quality literature suggesting that low risk patients do not require ongoing continuous cardiac monitoring. Further to this, it was found locally that over 70% of patients presenting with chest pain to our local high volume urgent care undergoing a cardiac work-up were transferred to the main hospital for this via emergency medical services (EMS). We felt this intersection of patient care and medical services could be streamlined to reduce critical resource utilization. Objective: The aim of this study is to reduce the usage of EMS for transport of chest pain patients from the urgent care to the main hospital by 25% over a 3- month period. Methods: This study was conducted as an uncontrolled before-after interrupted time series design. Comprehensive data drilldown was performed through chart review and structured clinical practise evaluation. This led to the creation of an evidence-based safe-for-self-transport tool to be applied in this patient population. The primary outcome measure was the proportion of patients transported via EMS with main balancing measures being proportion of self-transported patients admitted to hospital and time to troponin blood draw in self-transported patients. Results: The education and the newly developed transport tool resulted in a sustained shift below the previous baseline system mean control limit, indicating a significant reduction in EMS usage for patient transport. The overall reduction in usage was 30%. No change in balancing (safety) measures was identified post implementation. Conclusions: EMS remains a finite resource within many Canadian health regions. The results of this study show that by focusing on a cardinal emergency department presentation like chest pain, adapting evidence-based practise through quality improvement methodologies can result in a significant sustained reduction of EMS utilization.
Keywords:
chest pain
; interfacility transport
; data drilldown
; quality improvement
; emergency medical services
; cardiac monitoring
1. Introduction
Acute coronary syndrome (ACS) is a cannot miss diagnosis. While there are no specific criteria for who requires a diagnostic work-up for this pathology, most adult patients presenting with chest pain to an emergency department (ED) will require this diagnosis to be ‘ruled-out’ before discharge. The use of serial troponin biomarkers to aide in this diagnosis has become the standard of care when assessing patients. Further streamlining this care is a growing body of high-quality literature suggesting that patients possessing an ECG with no signs of ischemia and either normal initial troponin value or resolved chest pain do not require ongoing continuous cardiac monitoring (CCM) throughout the remainder of their evaluation(1–3). This becomes a clinically important ideal when evaluating patients for placement in overcrowded emergency departments or facilitating transport from urgent care / outpatient facilities.
Local data suggests that only 1.1% of these chest pain patients presenting to our local urgent care centre (UCC) with initially negative cardiac markers go on to have a positive change at three hours necessitating admission. Despite this, over 70% of them are transported by an ambulance to the affiliated hospital, citing a need for CCM as the main reason. While there is no direct comparison of Emergency Medical Services (EMS) over-usage for interfacility transport in Canada, the National Hospital Ambulatory Medical Care Survey in the United States indicates that at least 13-17% of all EMS transport is medically unnecessary in all-comers (4). Furthermore, local data suggests that only 20% of these patients are offloaded to a hospital stretcher within 30 minutes of arrival to the main hospital, further tying up EMS resources. With an additional transport time on average of 30 minutes per patient (local data) this represents a significant burden on the local EMS availability, potentially limiting community access to care. Therefore, the aim of this study is to reduce the usage of EMS for transport of chest pain patients from the urgent care to the main hospital by 25% over a 3- month period.
2. Methods
2.1. Context
This improvement project was carried out at a large tertiary care, inner city academic hospital system within Ontario, Canada with an average census of 65,000 visits per year. The adjacent UCC for this hospital sees an additional 65,000 patients per year. The same physician group regularly rotate through both sites as part of their clinical commitments.
2.2. Study Design
This study was conducted as an uncontrolled before-after interrupted time series design. The retrospective chart access for audit and data collection was approved by the Hamilton Integrated Research Ethics Board (HIREB 12865-C) and quality improvement (QI) exemption granted for ongoing prospective data collection through the duration of this study.
The first phase of the study focused on baseline data acquisition of the specific chest pain population presenting to the UCC for an 8-month inclusive sample period. Inclusion criteria:
- -
- Age over 18 presenting to UCC
- -
- Serial troponin testing
- -
- ECG acquisition.
2.3. Main Intervention
The second phase of this study consisted of stakeholder engagement in root-cause analysis interviews to further delineate perspective on practise patterns and departmental flow. A driver diagram (Appendix A, Figure A1) is an illustrative representation of all root-causes identified for potential interventions.
Focused development and implementation of a “safe-for-self-transport” Clinical Decision Tool (CDT) was pursued following identification of the perceived need for continuous cardiac monitoring in this population as a consistent driver for EMS transport of this patient population.
2.3.1. Developmental PDSA – Chest Pain Monitoring Transport Decision Tool
Evidence surrounding the use of CCM in the emergency chest pain population was obtained through a comprehensive literature review (search strategy can be found in Appendix A: Figure A2). From this, a two-step decision tool evaluating patient ECG and chest pain was created through an iterative process with a third step; initial cardiac biomarker, being added for future use in a separate initiative. The tool delineates if a patient needs transport by EMS or if safe for non-monitored transport.
2.3.2. Developmental PDSA - Feasibility Testing - Chest Pain Monitoring Transport Tool
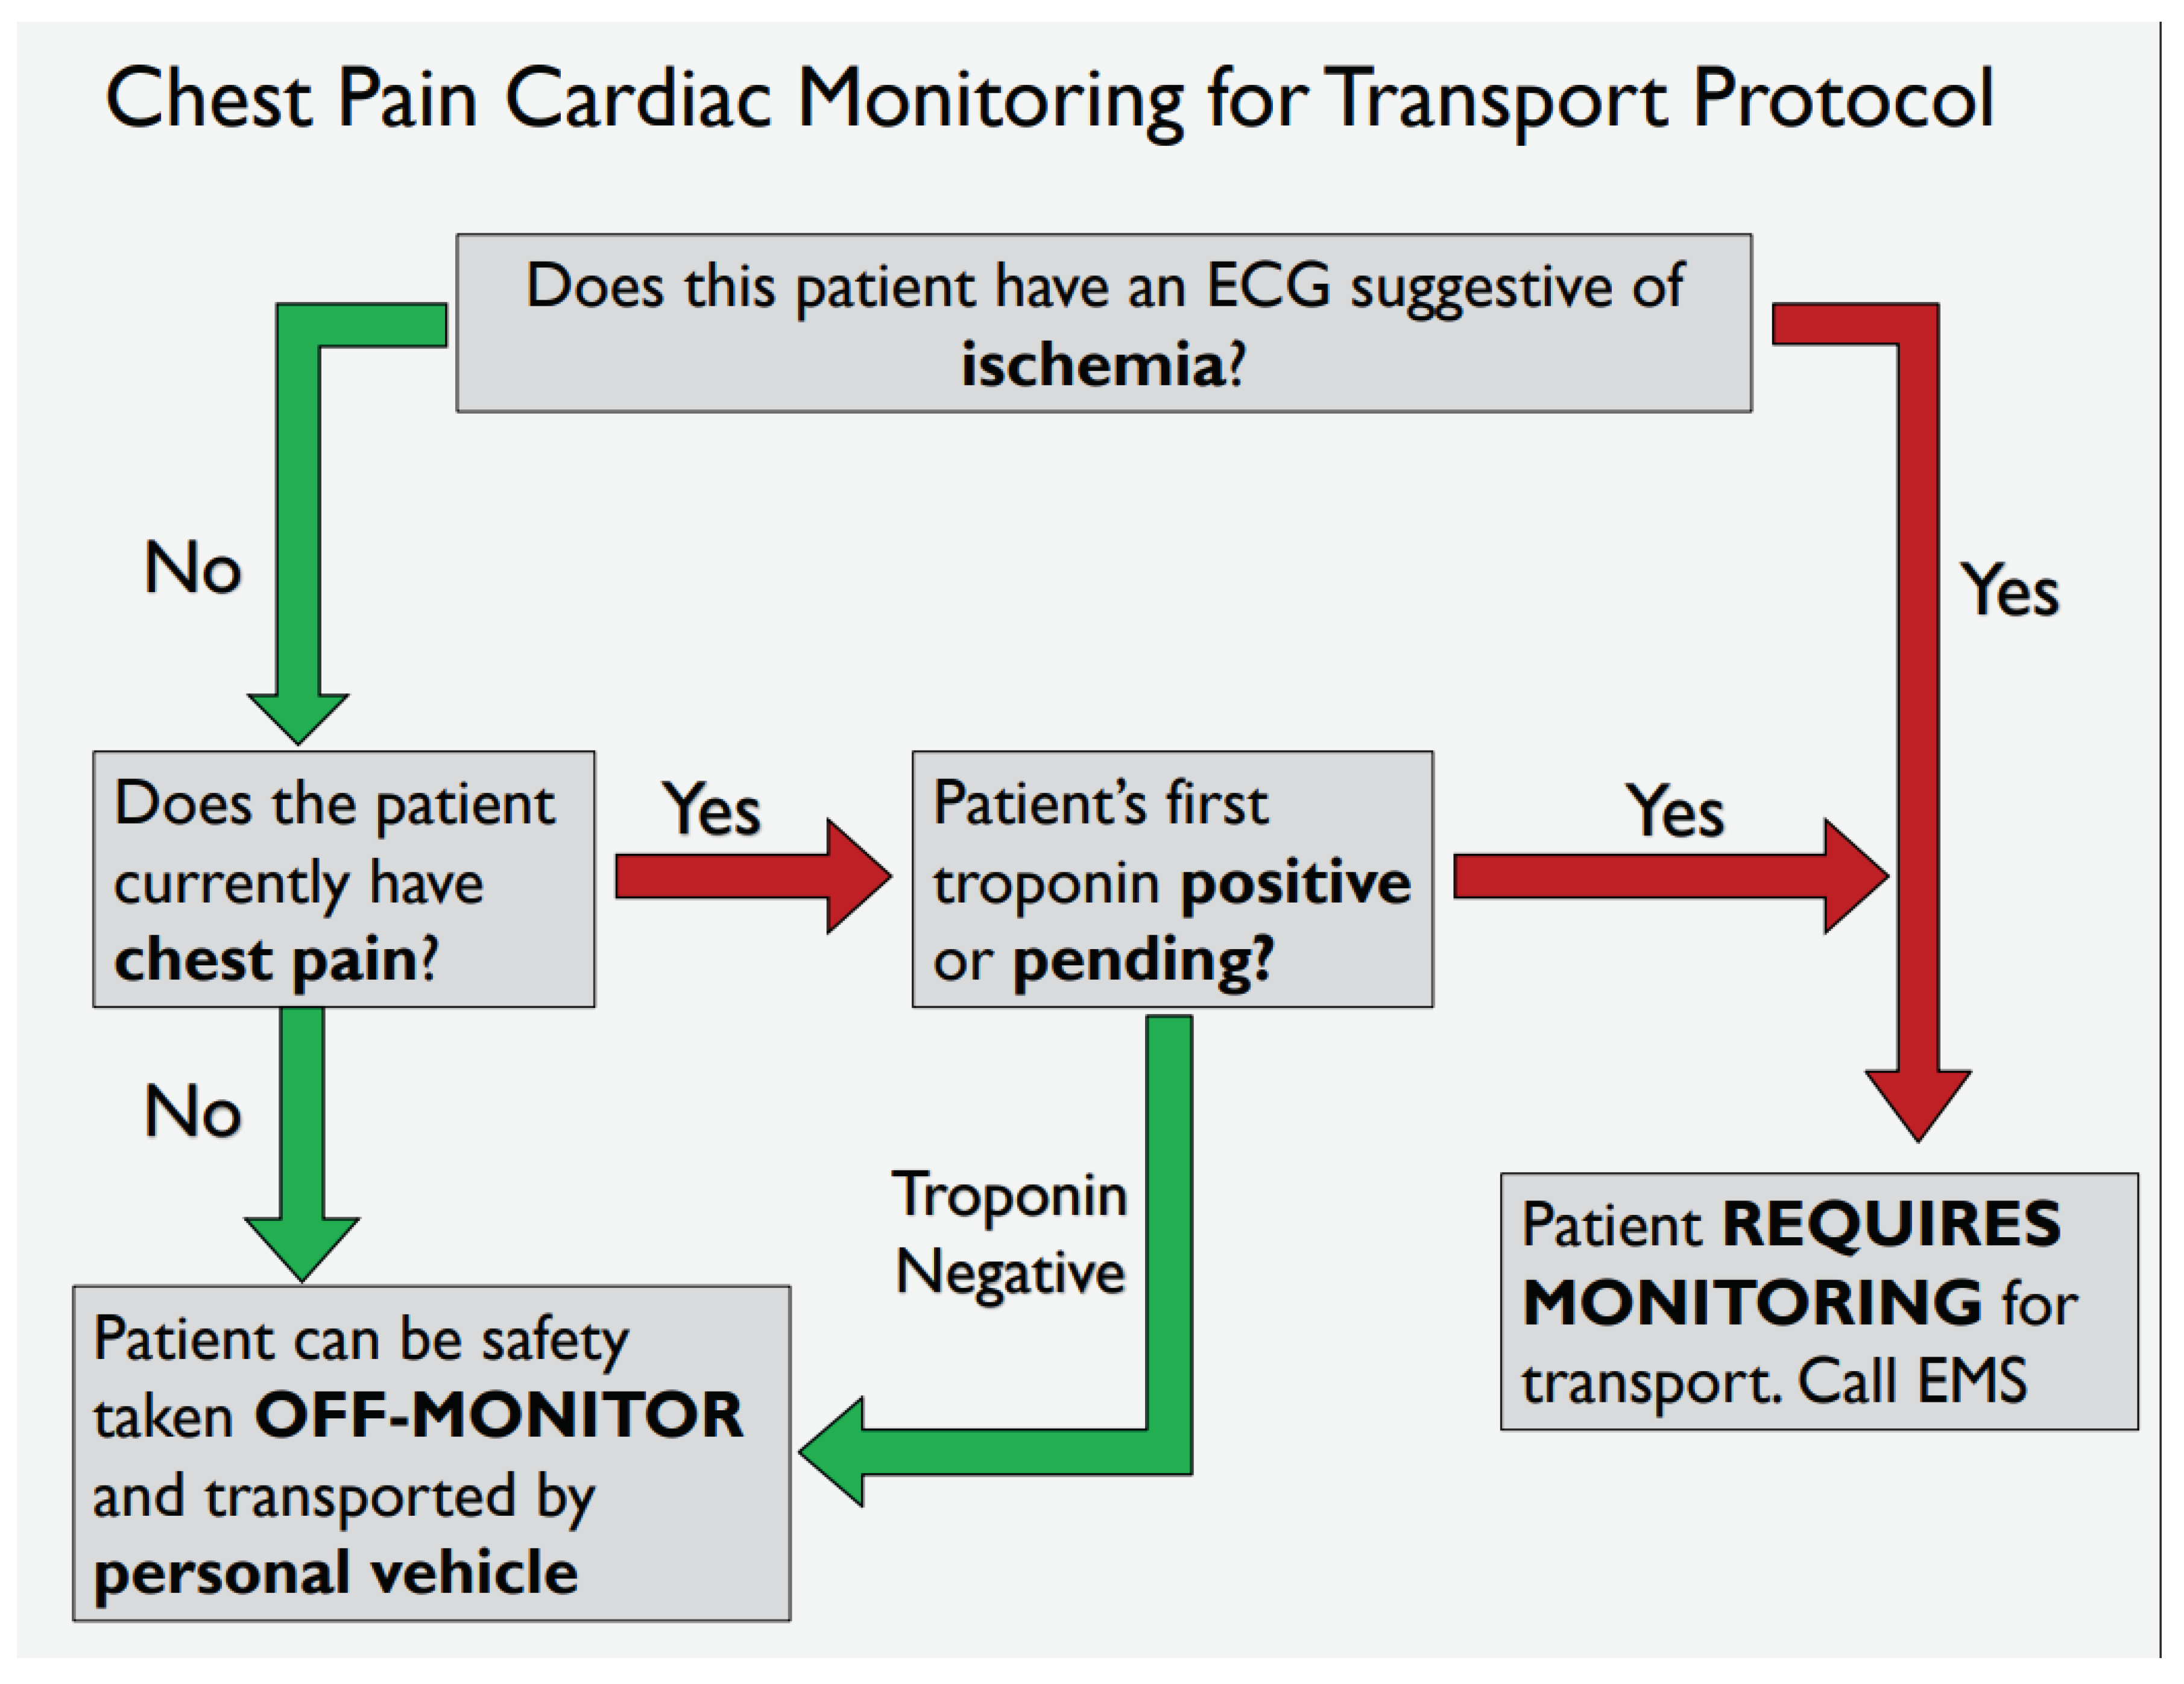
Following development of the “safe-for-self-transport” CDT, two variations (Appendix A, Figure A3 and Figure A4) were provided to 11 resident physicians. A series of 5 clinical test scenarios were completed using each tool. In addition to whether residents answered the clinical scenarios correctly, participants were asked a short series of questions surrounding the aesthetics of each tool, the ease of function and their overall preference if using clinically. The results of this feasibility study led to the adoption of Appendix A, Figure A4 as the “Safe-for-self-transport” chest pain transport tool implemented in this study.
2.3.3. Implementation PDSA – Chest Pain Monitoring Transport Tool
Implementation occurred in usual fashion with departmental notification of its impending usage and educational rollout. This was followed by a soft-launch period where usage was encouraged but not mandated to familiarize oneself with the CDT. Lastly formal CDT adoption occurred as the tool was built into the EMR and mandated usage.
2.4. Measures
2.4.1. Main Outcome Measures
- Proportion (%) of patients presenting with chest pain to UCC transported by EMS to the main hospital for repeat troponin (bi-weekly)
2.4.2. Fidelity/Process Measures
- Proportion (%) of eligible patients where transport monitoring tool was documented as applied (bi-weekly).
2.4.3. Balancing Measures
-
Time to second troponin draw in minutes (comparison between self-transported patients before and after intervention bundles).
- -
- Concern that patients self-transporting would not receive their second troponin biomarker blood draw within the normal timeframe as this proportion of patients theoretically increased.
- 2.
-
Proportion (%) of patients self-transported that were admitted
- -
- To ensure that the CDT was not responsible for an increase in patients with other pathology that require admission to be unsafely transported.
- 3.
-
Proportion (%) of self-transported patients that had an increased Canadian triage acuity score (CTAS) on arrival to main hospital
- -
- By looking at the change in score between UCC and the main hospital, we can infer if self-transported patients were either presenting sicker to the main hospital. In theory this would also capture if these patients suffered an adverse event on transport necessitating a higher acuity triage on arrival to the main hospital
2.5. Analysis
Primary outcome measures were analyzed with the appropriate statistical process control charts. Control limits were fixed around the baseline data acquisition period and post-intervention data was analyzed for established special cause variation rules; shifts, trends, astronomical data points and the two-out-of-three rules. P-charts were chosen as the main SPC chart for the primary outcome through the statistical software; QI Macros©. Non-paired two-tailed t-tests were performed to compare differences between self-transported and EMS-transported groups of patients for all balancing measures listed.
3. Results
3.1. Outcome Measure
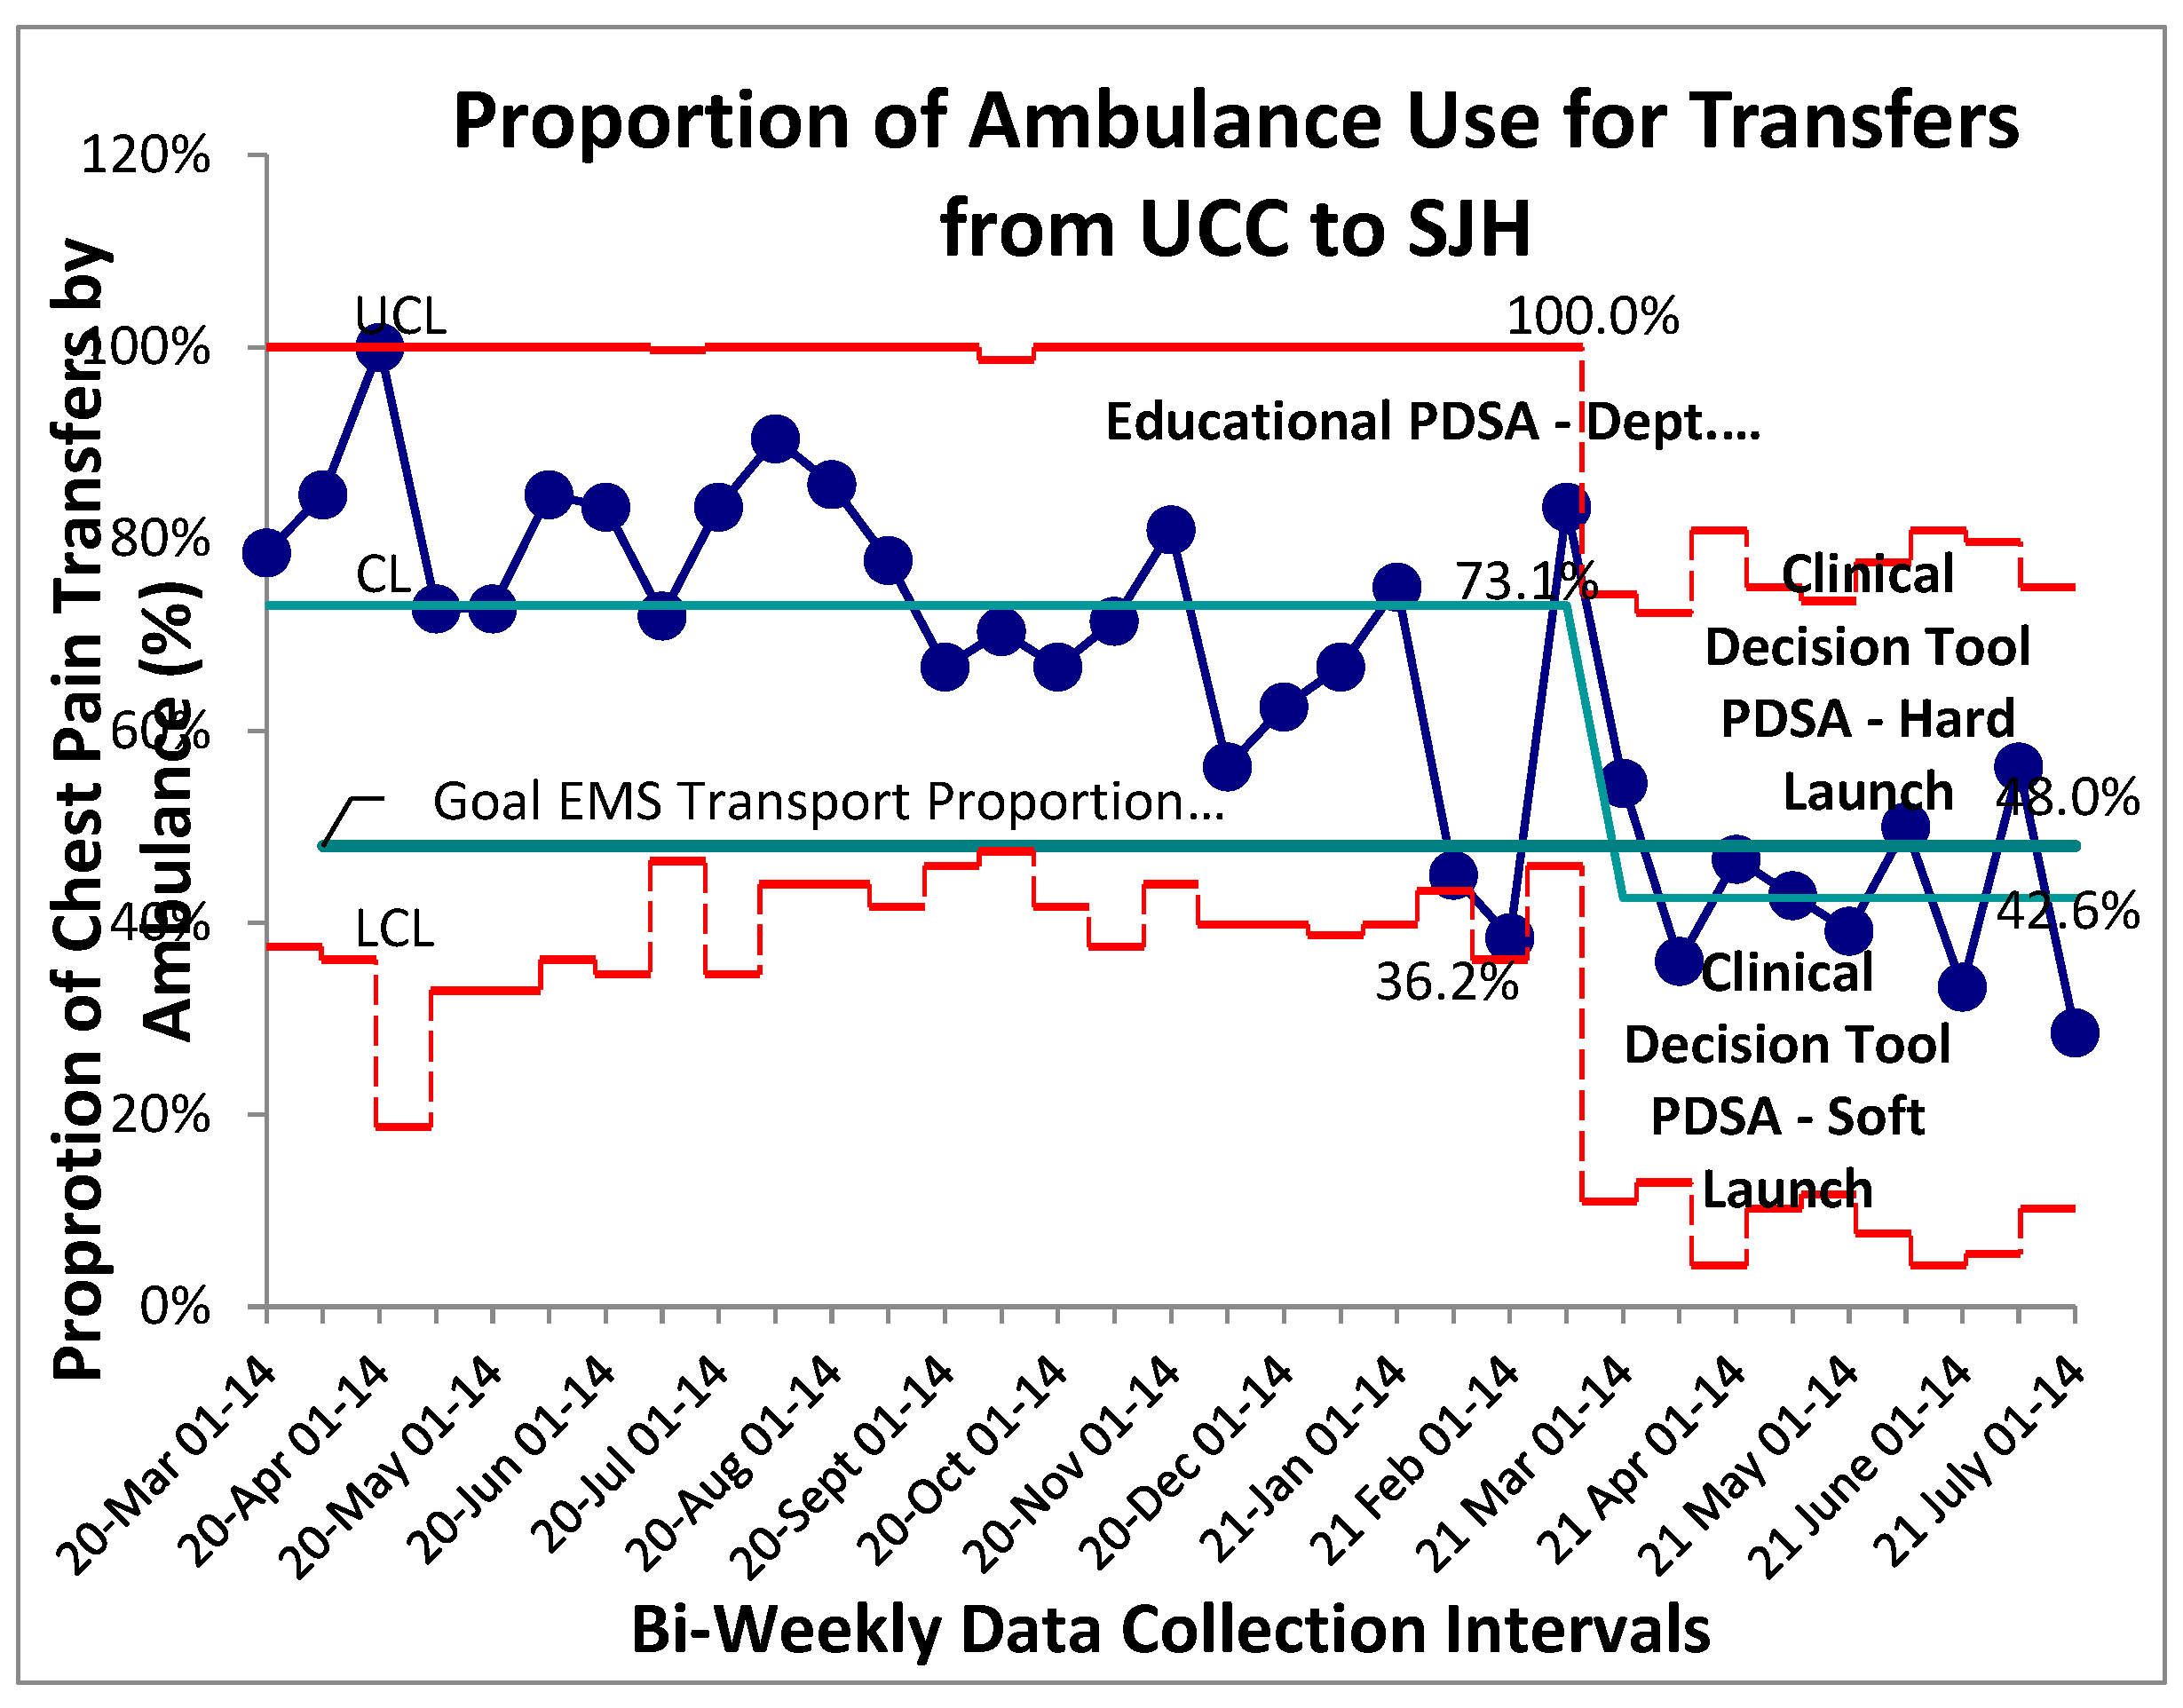
Baseline data for proportion of patients with chest pain transferred from UCC to the main hospital by EMS was collected and aggregated bi-weekly through an 8-month retrospective review followed by a 4-month prospective review. Stable common cause variation was found within this system with a mean proportion of EMS transfers for patients with chest pain established at 73% (Figure 1). No established special cause variation was identified within the baseline system. A package of interventions was introduced in rapid succession beginning with an educational PDSA then staged rollout of the “safe-for-self-transport” CDT. Following initial educational PDSA all prospective post-intervention data points were found to be below the previous control limit (mean) indicating a shift and establishing special cause variation secondary to the implemented PDSAs. New baseline control limits were established for this post-intervention system at 43% (figure 1). Given the sequential roll-out of three system changes over a short interval within this special cause variation, it is difficult to identify one single contributing factor to the overall successful reduction in proportion of EMS transfers from UCC to the main hospital. Ongoing success of the interventions 14-weeks post intervention can likely be attributed to the implementation of the departmental-endorsed clinical decision tool, as educational interventions in isolation are prone to Hawthorne effects and eventual regression to previous mean.
Figure 1.
Proportion of EMS use for UCC to SJH Transfers. SPC – P chart showing continuous time interval data of the proportion of patients with a chief complaint of chest pain transported with EMS services. Study interventions are labelled on graph. Special cause variation identified beginning with the Feb 15-28 data point.
3.2. Fidelity (Process Measure)
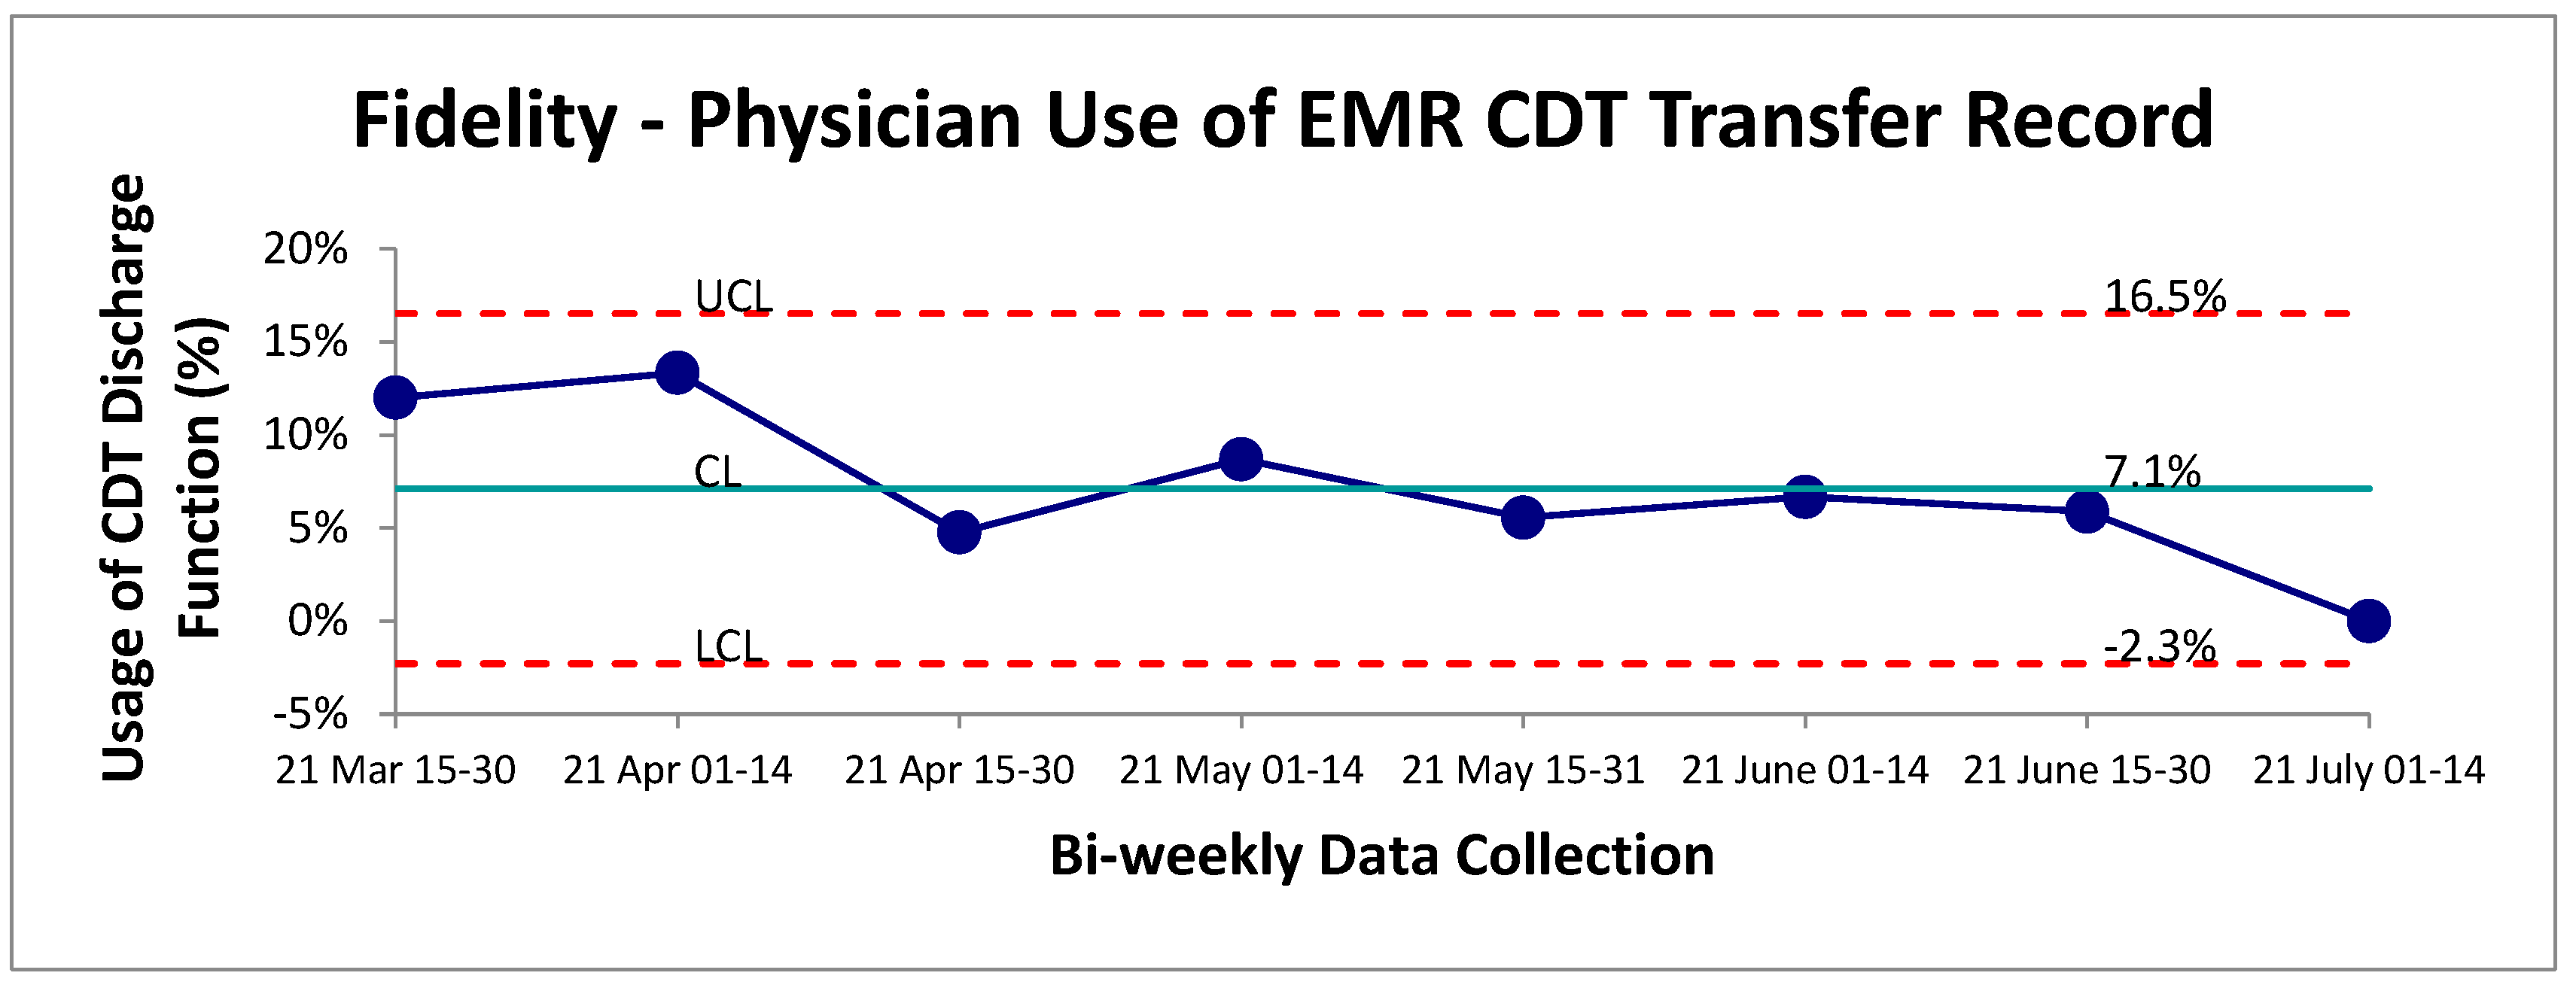
Adherence to the CDT implemented was monitored through the addition of a new EMR discharge function designed for physicians following the use of the CDT. Overall, this function appeared to be minimally utilized by staff physicians following the transport of a chest pain patient from UCC to the main hospital. The mean adherence was established at 7% over the post-intervention period (Figure 2). Given the positive outcome measure results, it is likely that physicians were either unaware of this discharge tracking metric or found the extra search and click for this specific discharge button too cumbersome to be utilized effectively in a busy clinical setting. Further root-cause analysis will be required to optimize this process and ensure accurate tracking of CDT usage.
Figure 2.
Physician adherence to tracking procedure for use of CDT. SPC-chart P continuous data evaluation of physician usage of discharge button indicating which type of transport (self vs EMS) was selected on the EMR.
Figure 2.
Physician adherence to tracking procedure for use of CDT. SPC-chart P continuous data evaluation of physician usage of discharge button indicating which type of transport (self vs EMS) was selected on the EMR.
3.3. Balancing Measures
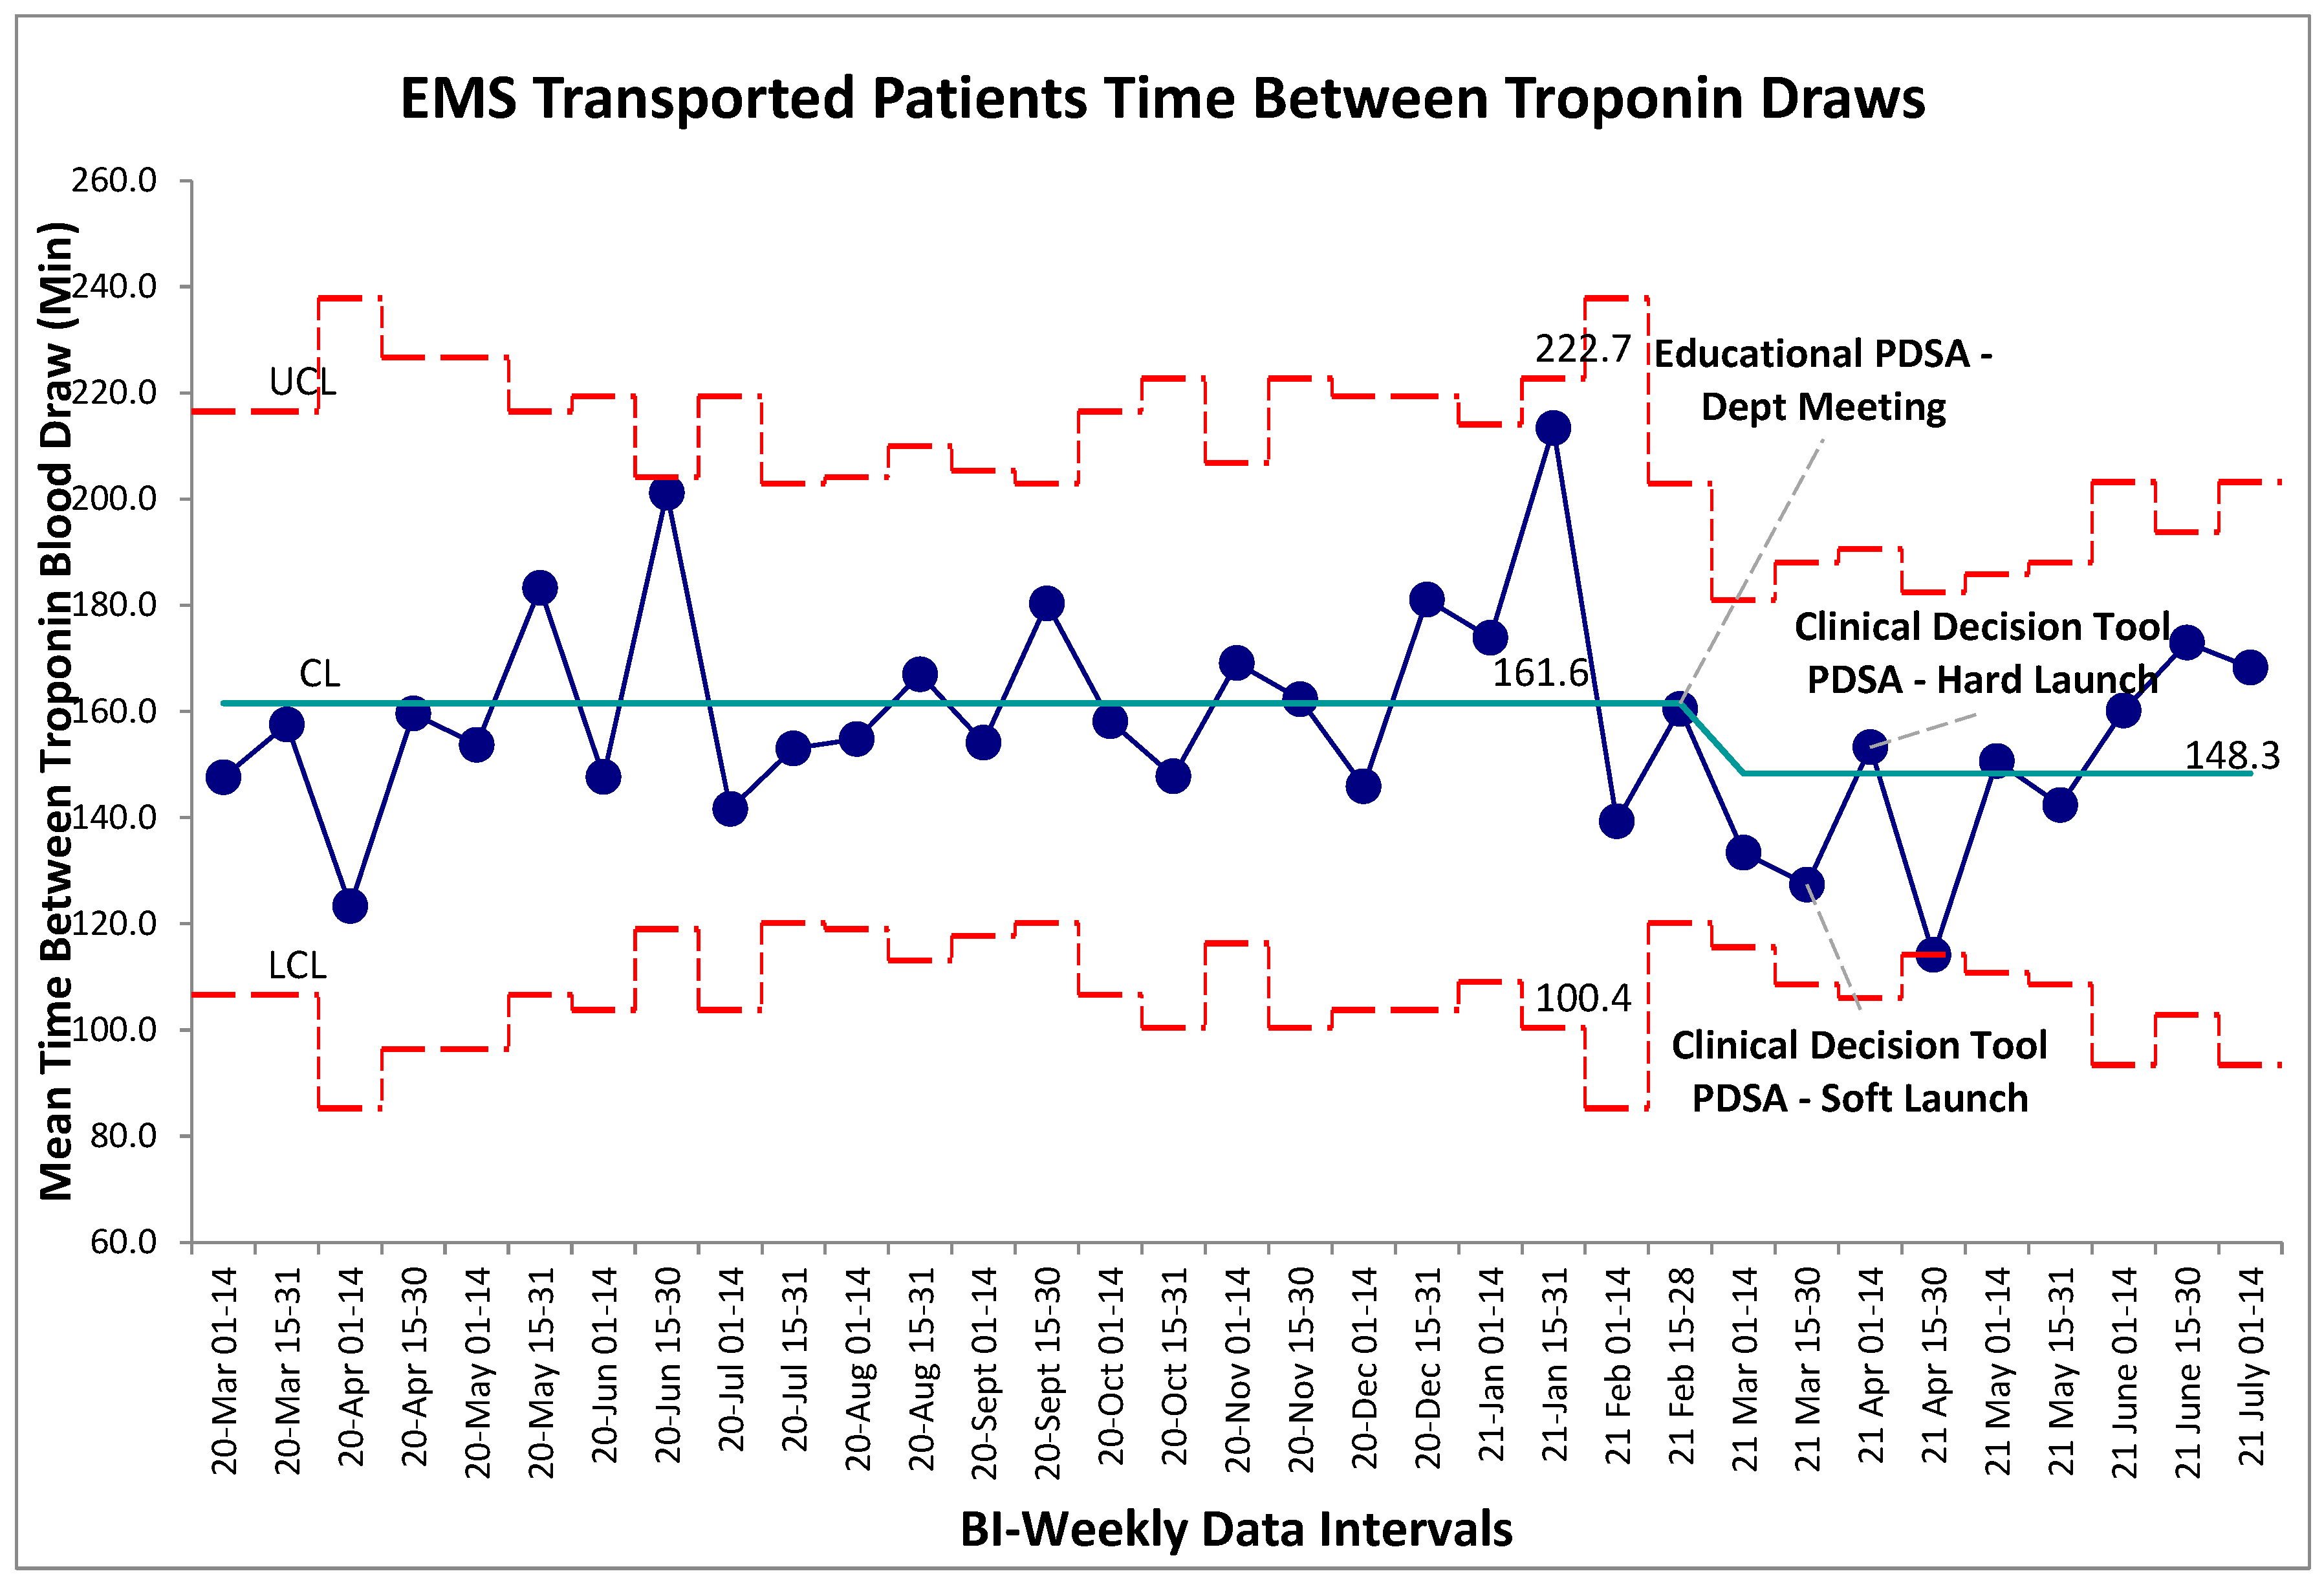
Balancing measures for unintended harms were tracked through three separate metrics for this study, the first being time between troponin blood draws for self-transported patients. The established gold-standard is a repeat troponin biomarker test 180 minutes following the initial blood draw. Within the baseline data collection period, mean time-between-troponin (TBT) was established at 160 minutes. Following the series of interventions the post intervention mean was found to be 180 minutes. Within the post-intervention period, new control limits were calculated for visual representation on the graph (Figure 3), however no special cause variation was identified to suggest a deviation from a stable system within this timeframe. Non-significance was additionally established in pre/post comparison between aggregate baseline and post intervention data (p>0.05, two-tailed t-test), further establishing that the intervention package did not alter TBT. For comparison the TBT for EMS transferred patients was also calculated which also revealed no special cause variation post intervention (Figure 4). Given that the intervention should not have altered the pathway by which EMS transferred patients receive bloodwork, this result was expected.
Figure 3.
Self-transport patient time between cardiac troponin biomarker bloodwork. SPC X-bar chart identifying continuous time interval data for the time between evaluation of cardiac biomarkers within the self-transported chest pain patients. No special cause variation identified.
Figure 3.
Self-transport patient time between cardiac troponin biomarker bloodwork. SPC X-bar chart identifying continuous time interval data for the time between evaluation of cardiac biomarkers within the self-transported chest pain patients. No special cause variation identified.
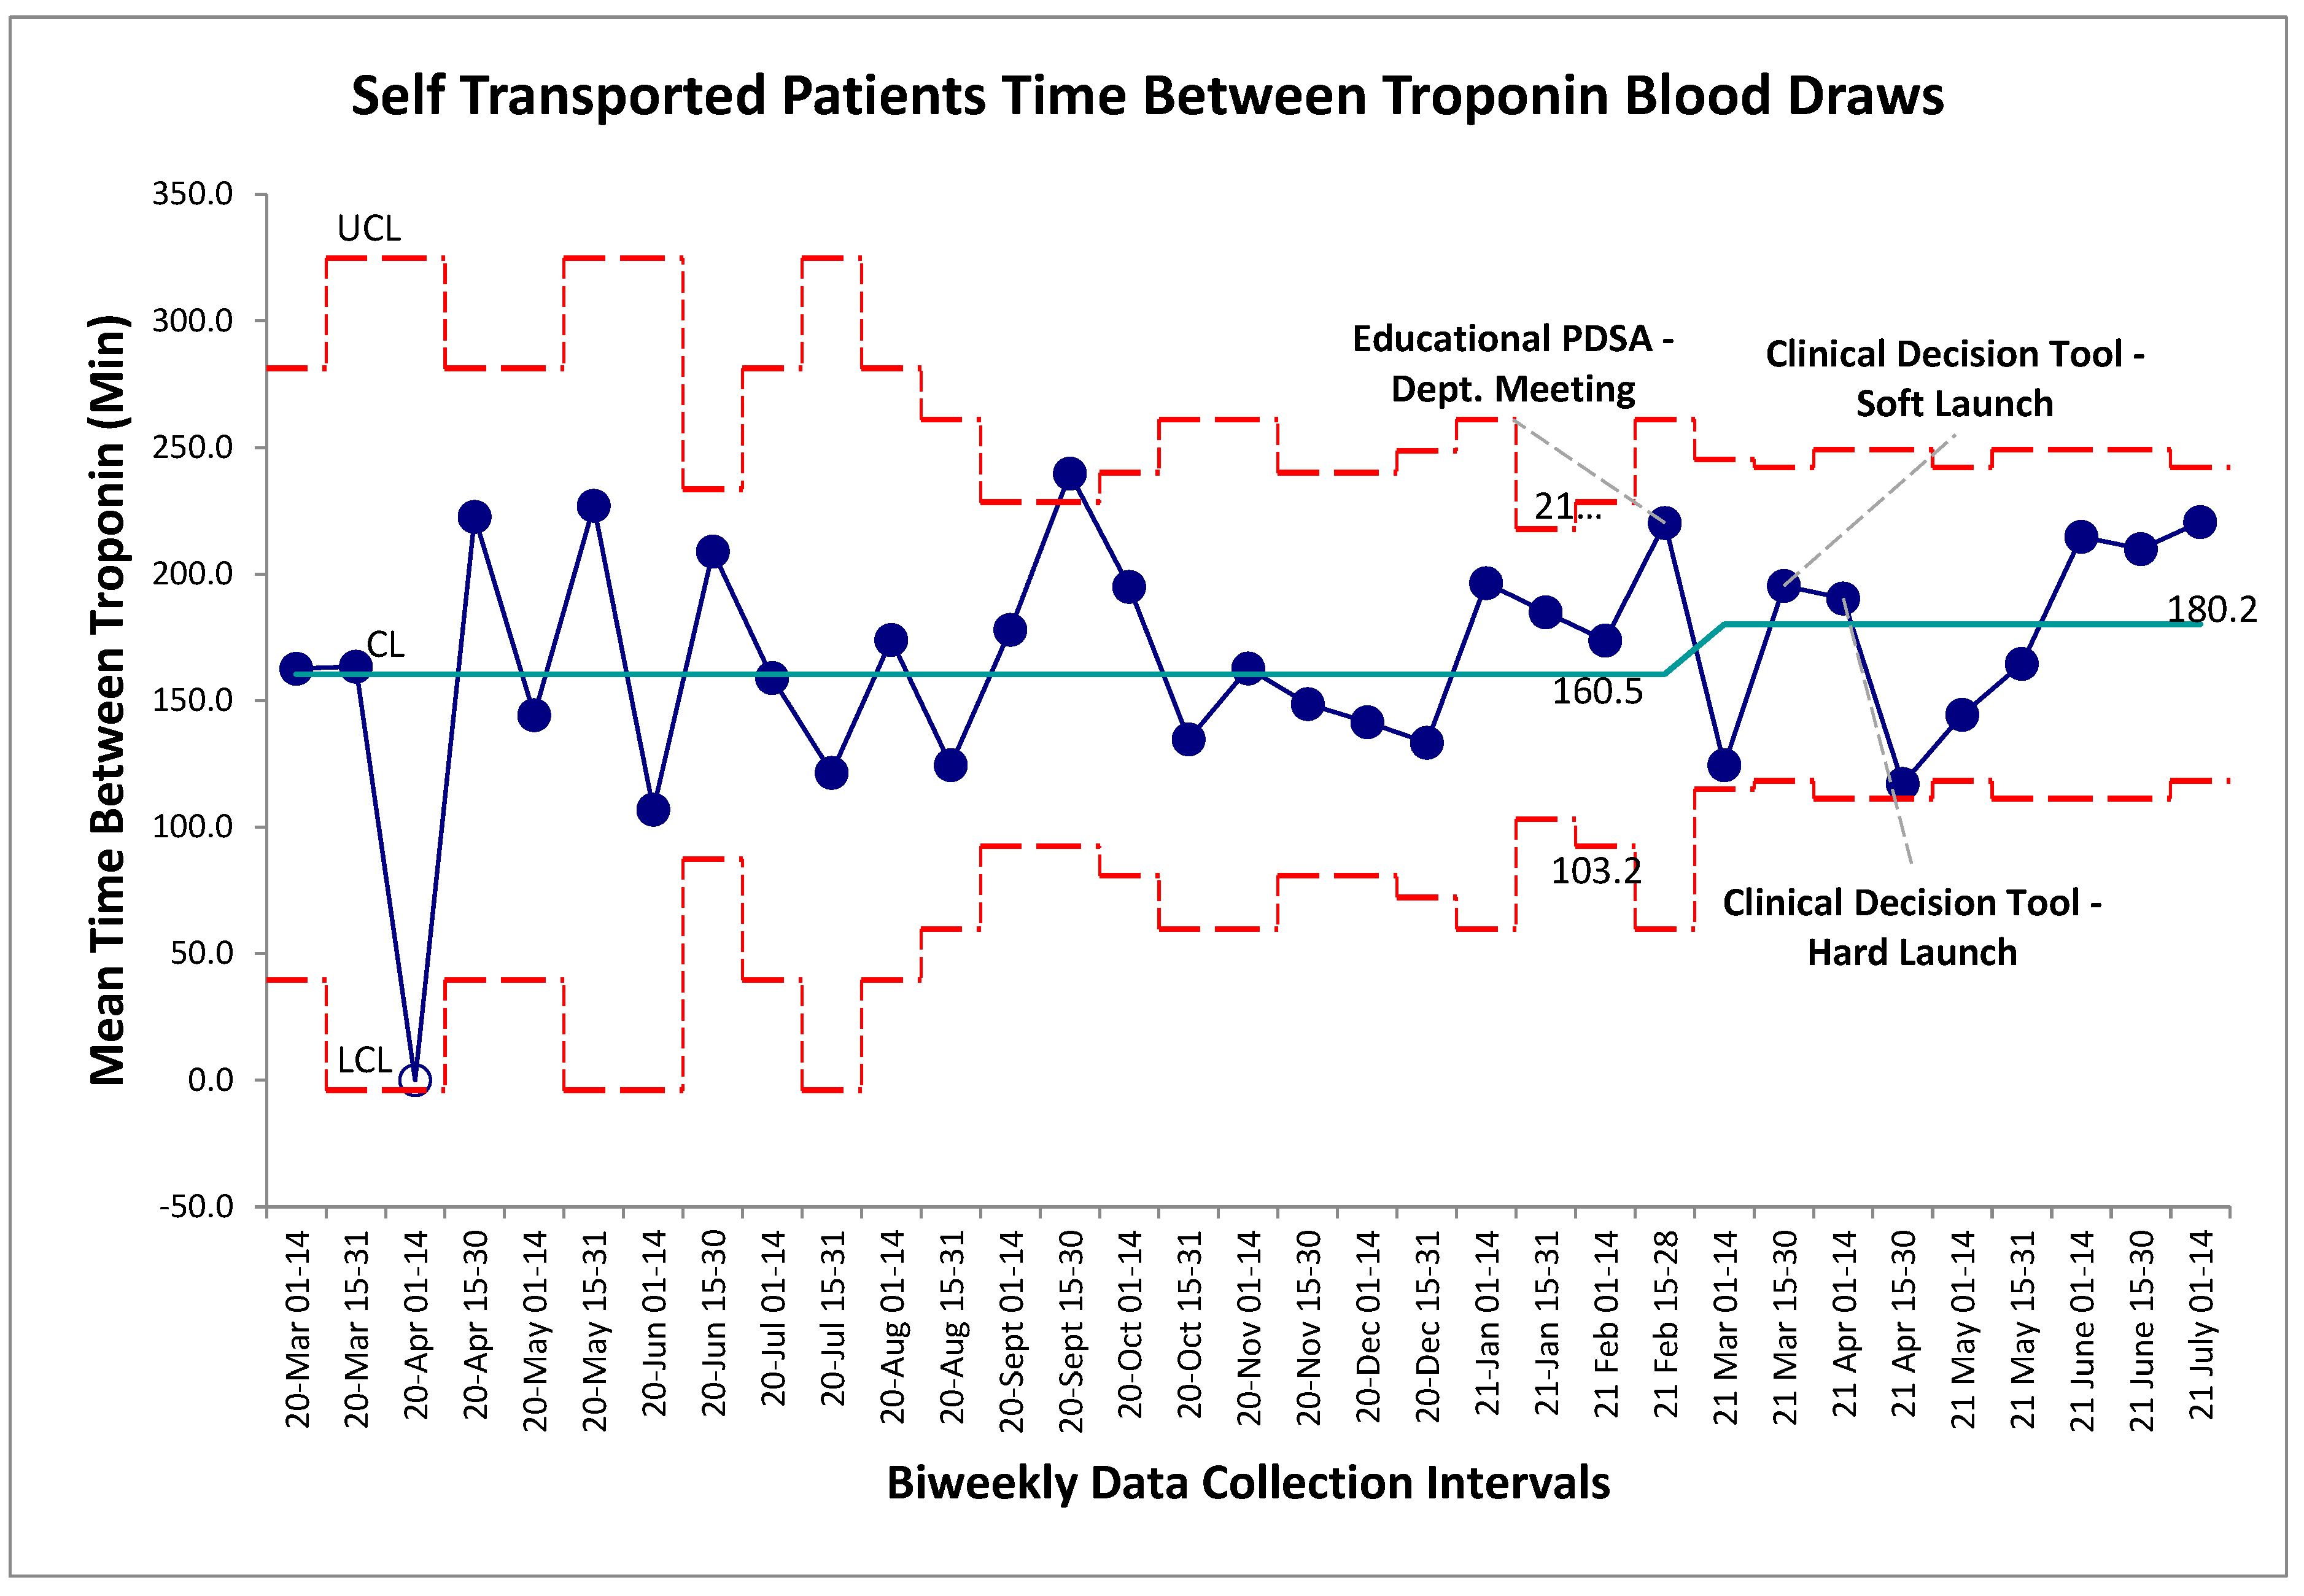
Figure 4.
EMS transported patient time between cardiac troponin biomarker bloodwork. SPC X-bar chart identifying continuous time interval data for the time between evaluation of cardiac biomarkers within the self-transported chest pain patients. No special cause variation identified.
Figure 4.
EMS transported patient time between cardiac troponin biomarker bloodwork. SPC X-bar chart identifying continuous time interval data for the time between evaluation of cardiac biomarkers within the self-transported chest pain patients. No special cause variation identified.
Change in CTAS scores were evaluated as a surrogate for changes to self-transported patient acuity level. The baseline change in CTAS scores from UCC to main hospital with a negative score indicated a more acute presentation upon arrival to the main hospital and a positive change meant the patient was scored as a less acute presentation (Figure 5). Special cause variation was identified post-intervention for an established period between April 1st and 31st, 2021 by the two-of-three rule. When evaluating these two data points at a patient level, this special cause variation was driven by a portion of the patients within these four weeks being scored as CTAS 4 and 5 (the lowest acuity) at UCC and scored as a 2 or 3 at the main hospital site. Had they been scored appropriately for an initial chest pain assessment; their score would have remained unchanged between the two sites and this variation would not have occurred. The overall mean change in CTAS score was similar pre/post intervention (Figure 5). Tradition pre/post aggregate statistical analysis showed no significant difference between the two groups (p>0.05, two-tailed t-test).
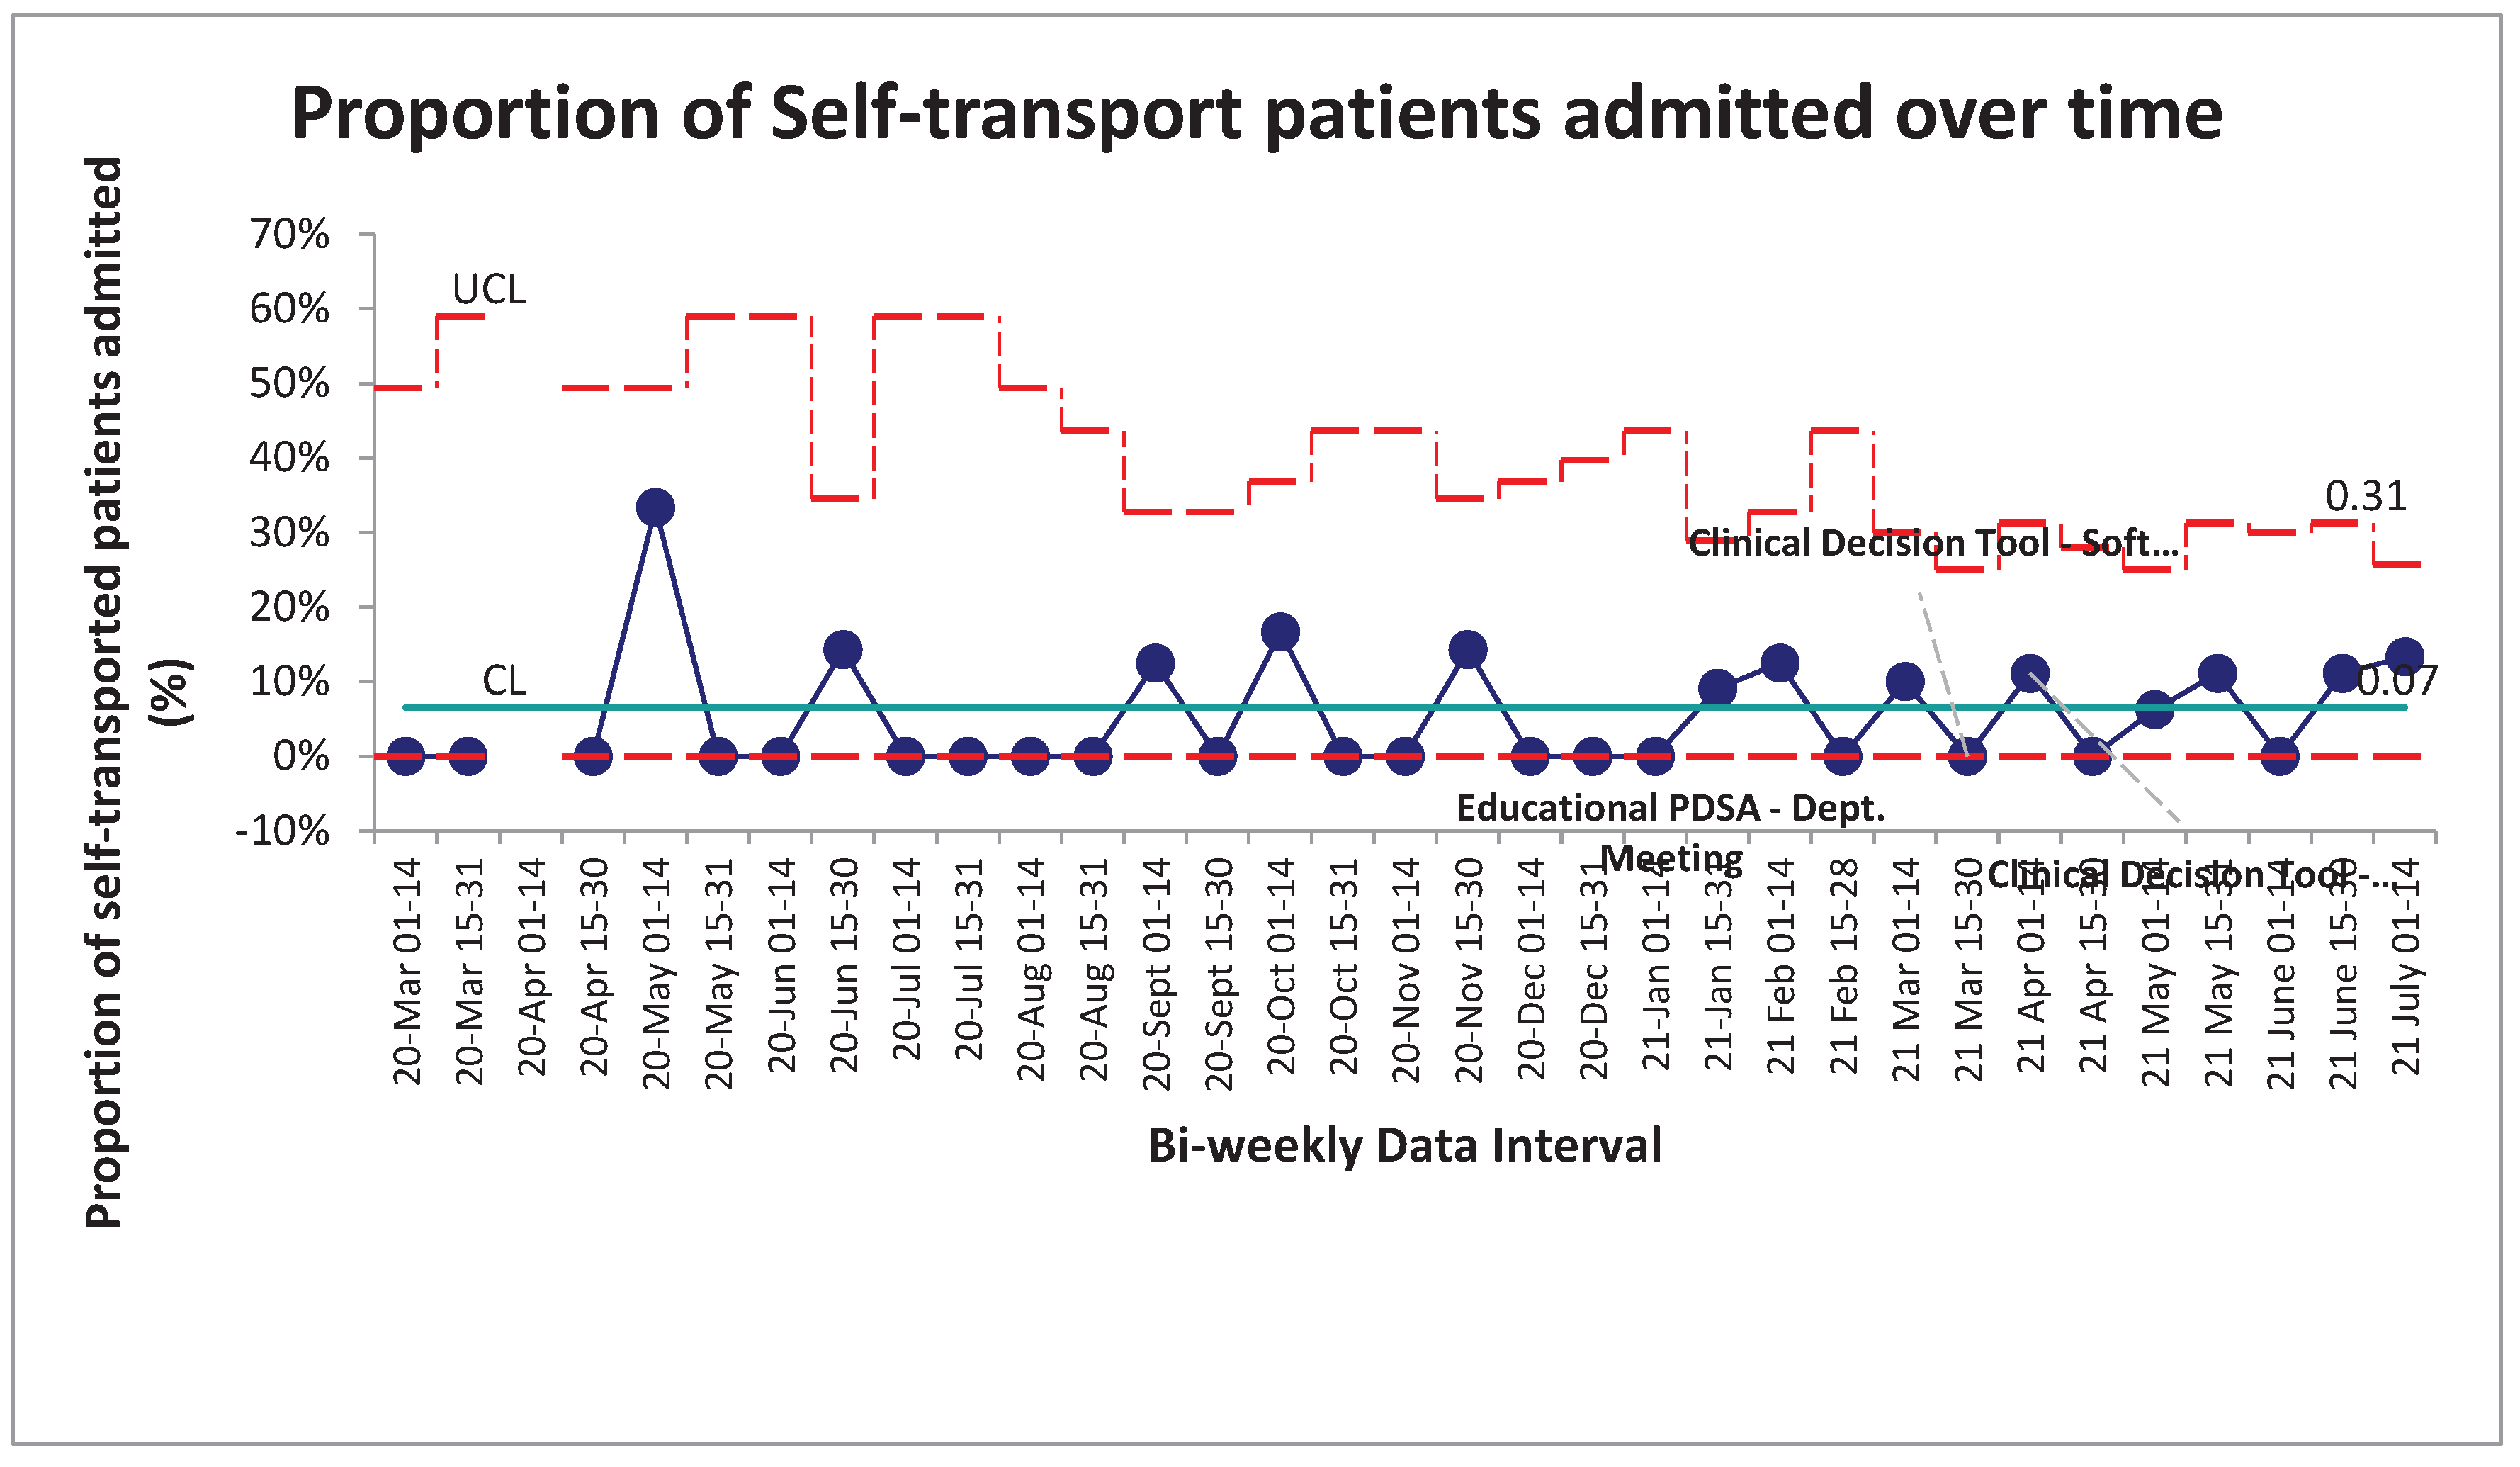
As the CDT and intervention package was intended to identify low-risk patients for transport, the admission rate of self-transported patients was tracked over the baseline and intervention timelines. This was used as a surrogate to ensure that as the proportion of self-transported patients increased, the overall illness characteristics of the self-transported population did not change and that the tool wasn’t inappropriately circumventing clinician gestalt of identifying sicker patients. The baseline admission rate of this self-transported chest pain population was established at 7% (Figure 6). In the post-intervention period, no special cause variation was identified, indicating no change in the overall system from the implementation of the CDT. In an aggregate pre/post analysis the post-intervention admission percentage of self-transported patients was 6%. No significant difference was found between the two groups (p>0.05, two-tailed t-test).
4. Discussion
Chest pain is a common presentation to the emergency department and the majority will require and undergo a cardiac work-up, ultimately to be discharged home with a negative result. Widespread uptake of CDTs such as the GRACE, TIMI and Heart Score aimed at early discharge within this population has been limited, owing to the varying degree of re-visit rates with potential for major adverse cardiac events above the 1% threshold that most clinicians feel is an acceptable risk rate6-9. While recent scores such as the Heart Pathway and Clinical Chemistry Score (CCS) show more promising risk profiles aimed at early discharge, they have not made their way into guideline-based practise as of yet10-15. This risk stratification dilemma is magnified in centres such as our urgent care facility, a 65,000 patient-visit facility that has no admission capacity and limited laboratory assessment for guideline recommended serial high-sensitivity troponin biomarkers; necessitating the completion of the cardiac work-up for these patients to be performed across the city at the main hospital site. Furthermore, the main mode of timely transportation relies on EMS, a finite resource that often faces significant patient off-load times – rendering them inoperable until the patient can be successfully delivered to a care area under the hospital responsibility. Given the low overall prevalence of disease in the transported population of chest pain patients, this interface represented a key area for adaptation of guidelines and literature to reduce transport burden for EMS, while still safely and effectively identify patients able to transfer by personal means.
The AHA has a COR 1 (level b) recommendation that anyone who is intermediate or high risk for ACS require ongoing CCM. The recommendation drops to CORIII (level c) evidence in patients with normal ECG and negative biomarker evaluation for arrhythmia and CORIII for low risk and noncardiac chest pain or patients that are fully awake and able to verbalize changes in symptoms16. This guideline resonated with a key factor of the decision for EMS usage of patient transport found within the data drill down – the perceived need of CCM. However, these guidelines are based largely on inpatient populations and older data and didn’t necessarily reflect the latest emergency medicine literature.
Focusing on the low-risk chest pain population, an absence of new ischemic changes on ECG and resolution of chest pain was validated as a safe and effective means to remove CCM in patients whose initial complaint to the ED was chest pain17-19. Given that these patients had no monitoring for their entire ED stay and work-up (multiple hours), we felt that this would be a safe and effective tool to adapt as a “safe-for-self-transport” CDT. Following a usability study with clinical scenarios for two versions of the tool that differed in appearance, we were able to implement a CDT that successfully reduced the proportion of patients transferred by EMS by 30%, achieving the initial goal of a 25% reduction in transfers.
The balancing measures were chosen largely to ensure patient safety was not compromised through the initiation of this CDT. Firstly, the research group needed to be sure that patients were still meeting appropriate gold-standard benchmarks for time-between-troponin within their chest pain evaluation. The goal was that with the increased proportion of self-transported patients, their second troponin biomarker needed to be drawn within historical limits. No change in the system on SPC charting or in pre-post analysis was detected in this measure, indicating that the tool did not alter this standard of care. Secondary to this was the need to identify any patient that was self-transported inappropriately. The combination of the change in individual CTAS scores of self-transported patients again revealed a safe system with no compromise to patient safety or misidentified patients.
A post-intervention admission rate of 6% within the self-transported population indicated a stable system despite the significant proportional increase in self-transported patients. This surrogate marker helped to alleviate staff physician concerns that the tool would be imperfect for identifying low-risk patients safe for transfer. Prior to the initiation of the CDT, transport via EMS was performed for several reasons, but ultimately with no formal process, it meant clinician gestalt was the only clinical factor for this type of transport. With the post-intervention baseline possessing no special cause variation and the post-intervention admission rate remaining stable, it helps to solidify that the CDT did not impact clinical gestalt for identifying patients that require higher levels of care and inpatient work-up.
4.1. Future Direction
With respect to ongoing evaluation of the CDT program and transfer rates, our group remains invested on optimizing this process. There does appear to be a significant issue with the actual tracking of tool use by the physicians, with limited uptake of the created EMR discharge function to be used in tandem with this tool. Further human factor evaluation of why this is the case will be undertaken.
The second main direction of this project focuses on another aspect of the tool’s intended use. Following literature and guideline review, the patient’s initial cardiac biomarker status (negative or positive) was added to the CDT as evidence suggests a negative initial troponin biomarker also renders a patient safe for off-monitor evaluation20,21. The UCC clinicians will not have this information prior to planning for transport, so this portion of the CDT did not apply to this study but is intended toward adaptation for the triage nurse at the receiving main hospital to fast-track offload of any EMS-transported patients should their troponin be negative. We hope to implement a process in which these patients can be offloaded from EMS responsibilities to the waiting room, thus improving these offload times based on the patient’s initial ECG, presence of chest pain or verification of a negative initial cardiac biomarker.
4.2. Limitations
There are a few limitations to the evaluation within this study. The first is that change in CTAS score and change in admission rates are both surrogates for understanding whether the self-transported patient was inappropriately selected for self-transport over EMS. However, because these are surrogate markers, they remain imperfect in identifying whether a self-transported patient could have significantly deteriorated on transfer. While there were no reported events throughout the duration of this study, data capture on this could be incomplete. Furthermore, the interrater reliability of CTAS score is imperfect and thus closer monitoring of any potential safety change should be explored on an individual patient level22. Secondly, logistical challenges for patient self-transport remain an issue. When a patient is transported by EMS, the hospital is not responsible for the cost of the transport. However, in the event of the hospital asking the patient to take a taxi or have a relative transport them, the hospital is either placing the cost back on the patient or absorbing that cost itself, which may create a barrier to care for some patients. From a physician standpoint, the mechanism of monitoring adherence to the implemented CDT remains an issue. The implementation of this discharge tracking tool did not undergo human factor design testing prior to its implementation and further evaluation with direct feedback from the physician stakeholder group will be required to improve use of this tracking system. Despite this low measured fidelity, we feel that actual fidelity and use of the CDT remains much higher.
5. Conclusions
EMS remains a finite resource within many Canadian health regions. By focusing on a cardinal emergency department presentation of chest pain, our team was able to identify the perceived need for cardiac monitoring as a main root-cause contributor to the excessive use of EMS for interfacility transport within this patient population. Through dedicated adaptation of a comprehensive literature review, we were able to reduce the proportion of chest pain patients being transferred using EMS by 30%, achieving our modest goal of 25% over the study period. The implementation of a safe-for-self-transport CDT has led to sustained system change with no increased evaluation time, acuity, or admission rate within the self-transported population. Given this tool’s components have been previously validated in other health regions, the generalizability of this intervention to other interfacility transport settings remains likely. Further optimization and ongoing evaluation of this CDT and the transport process of these patients has the potential to safely reduce both EMS transport and patient offload further, reducing overall offline time for EMS and improving EMS access.
Funding
There was no specific funding provided for this study.
Conflicts of Interest
There are no conflicts of interest identified across any authors.
Appendix A. Extended Methods; Figures and Tables
Figure A1.
Driver Diagram for Chest Pain Transport. Summation of root-cause and thematic analysis with probable etiology’s for transport by EMS.
Figure A1.
Driver Diagram for Chest Pain Transport. Summation of root-cause and thematic analysis with probable etiology’s for transport by EMS.
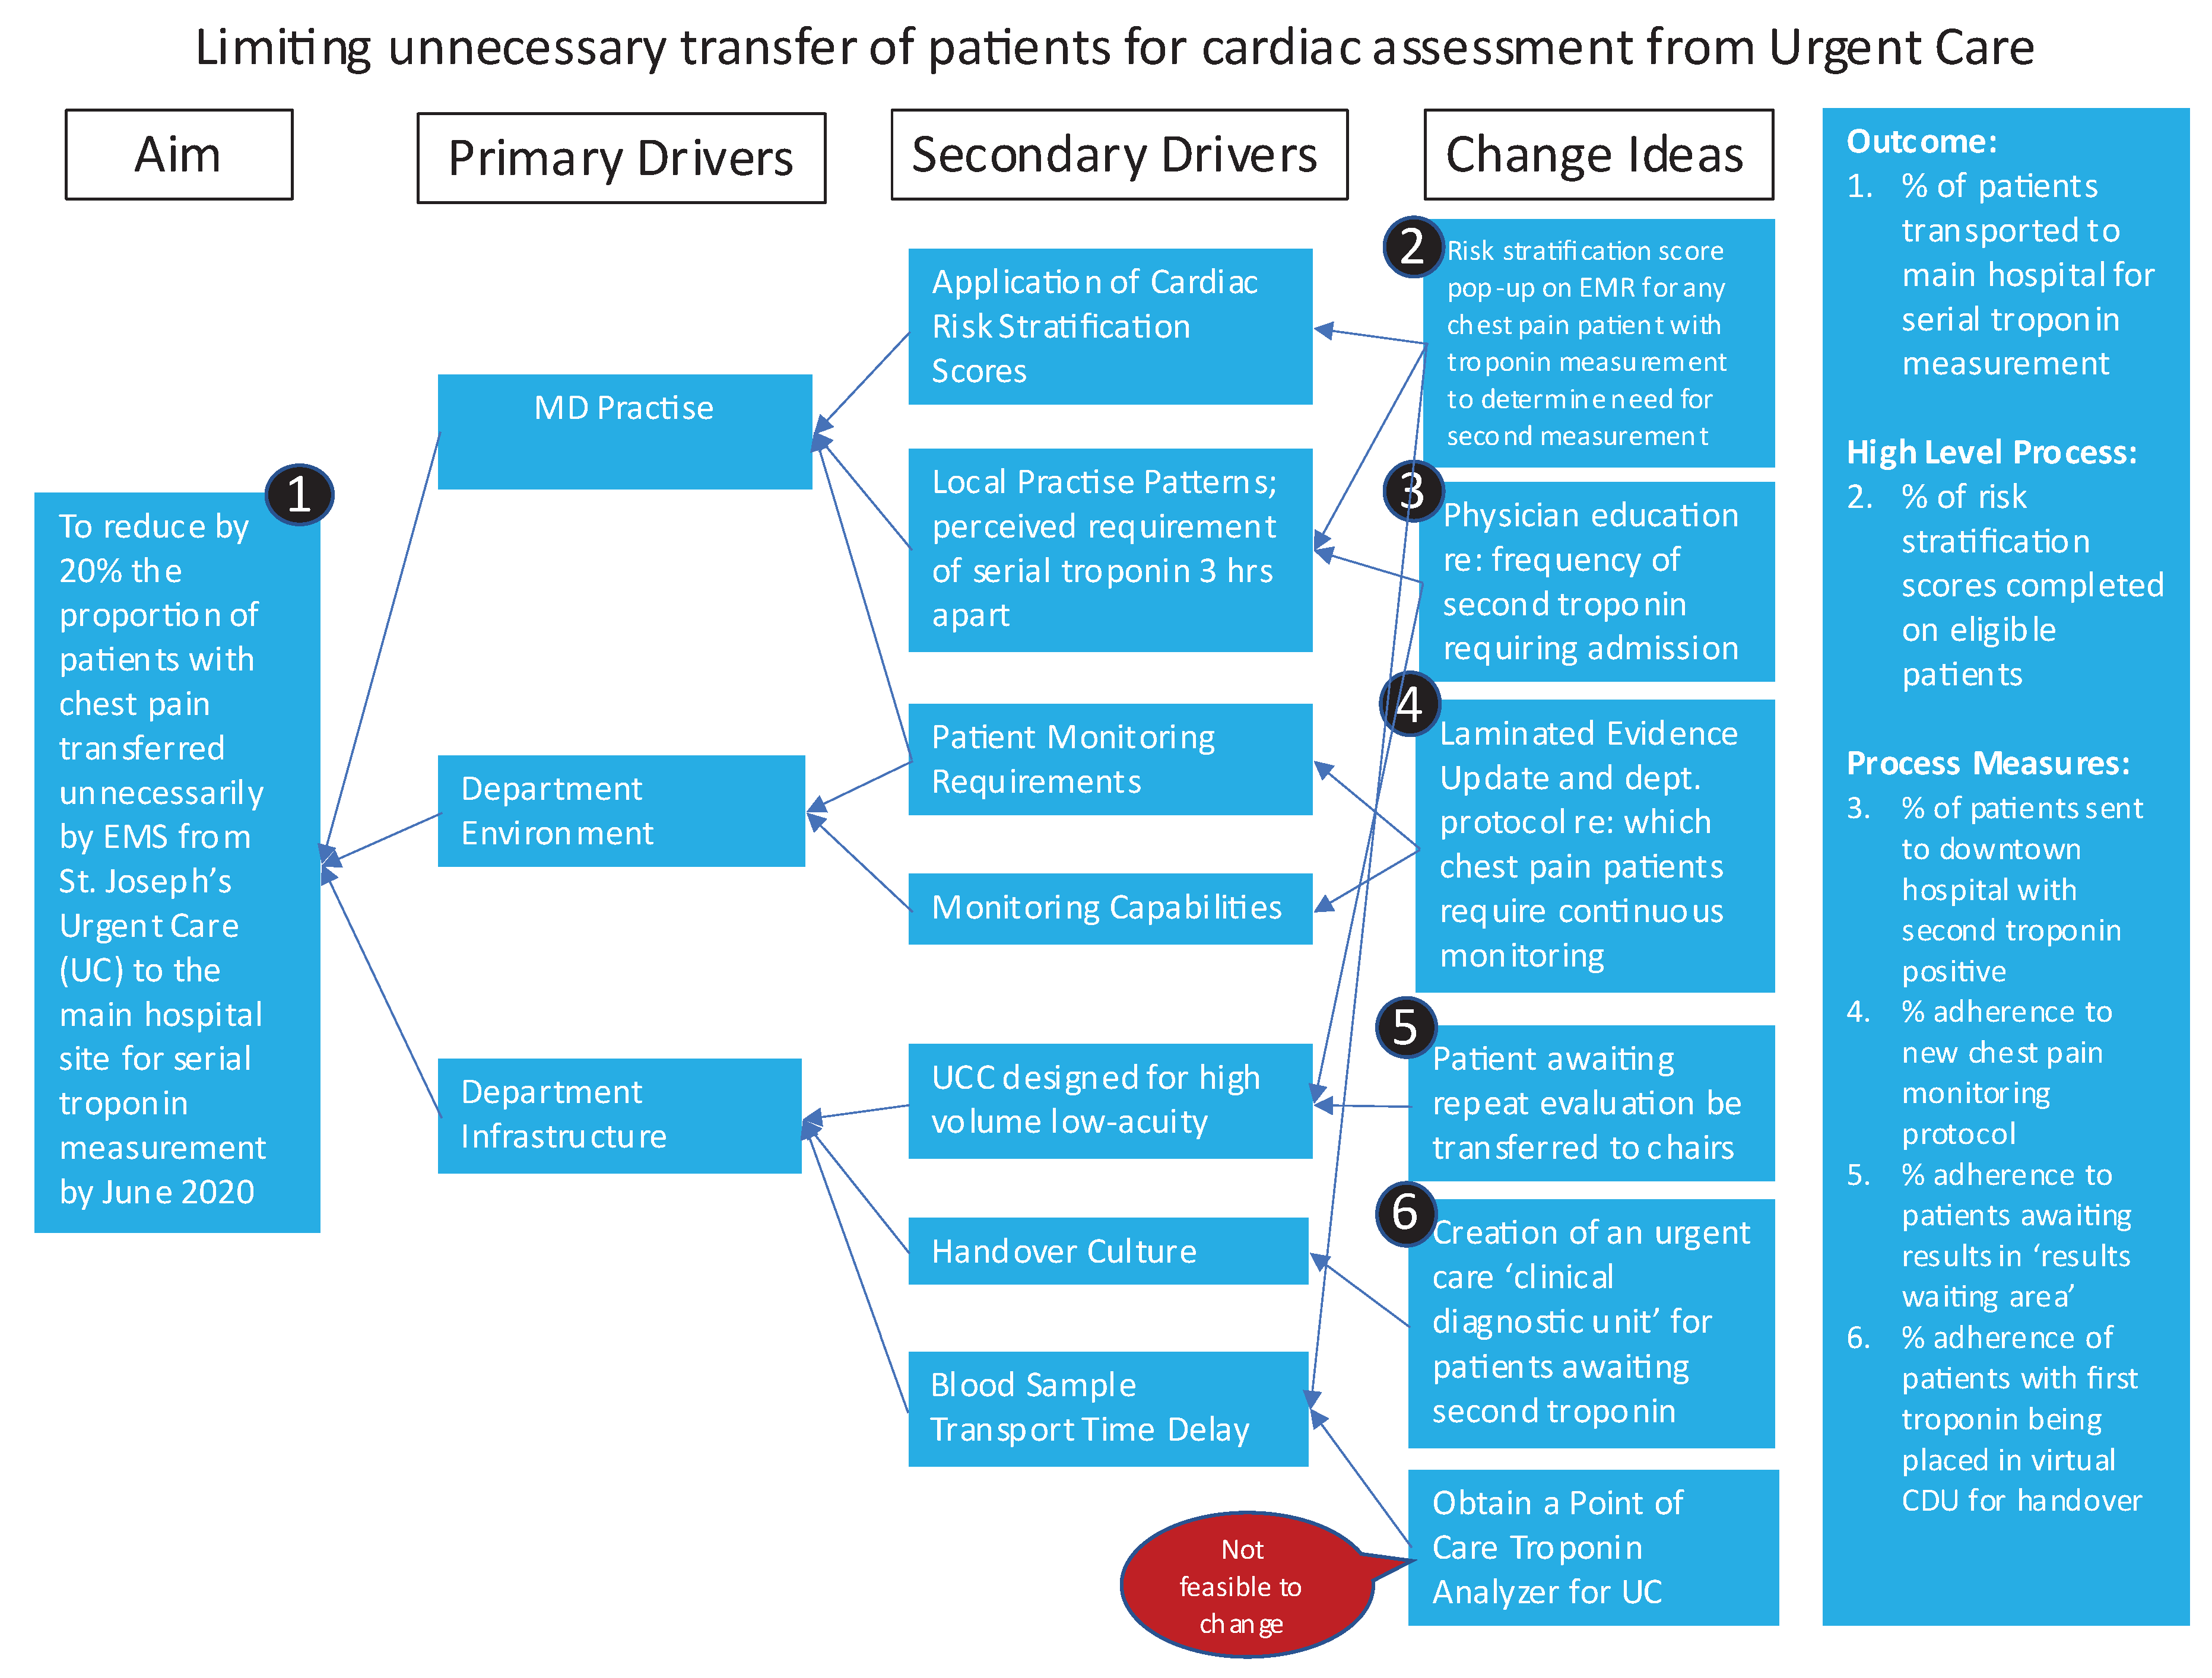
Figure A2.
Search strategy utilized for the OVID Medline 1946 – present with preprint database.
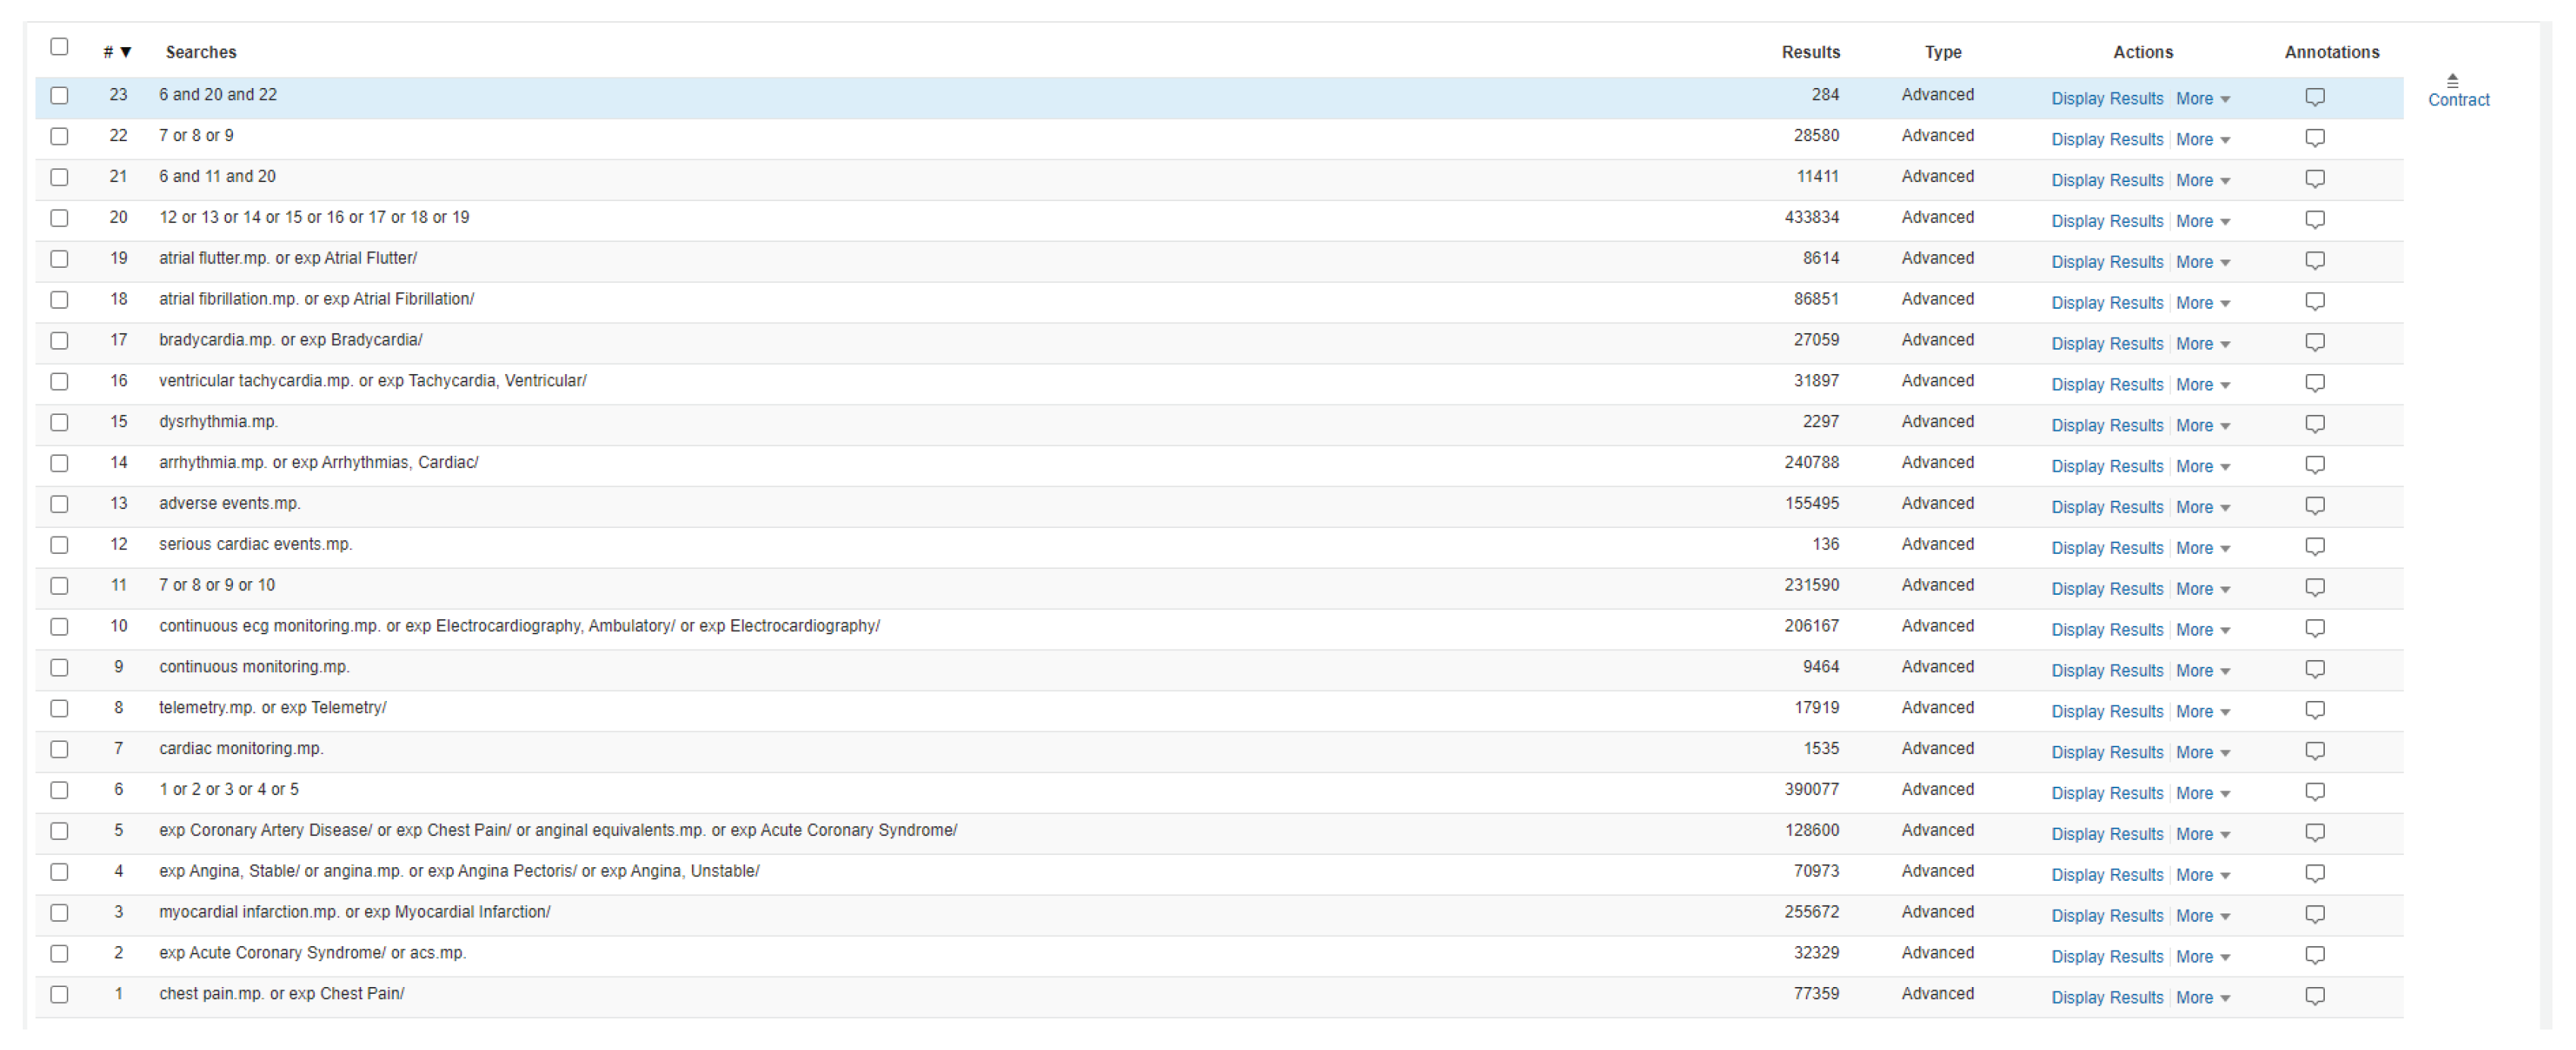
Figure A3.
Pictorial representation of clinical decision tool. This is one of two versions that will be piloted in a usability study for the project.
Figure A3.
Pictorial representation of clinical decision tool. This is one of two versions that will be piloted in a usability study for the project.
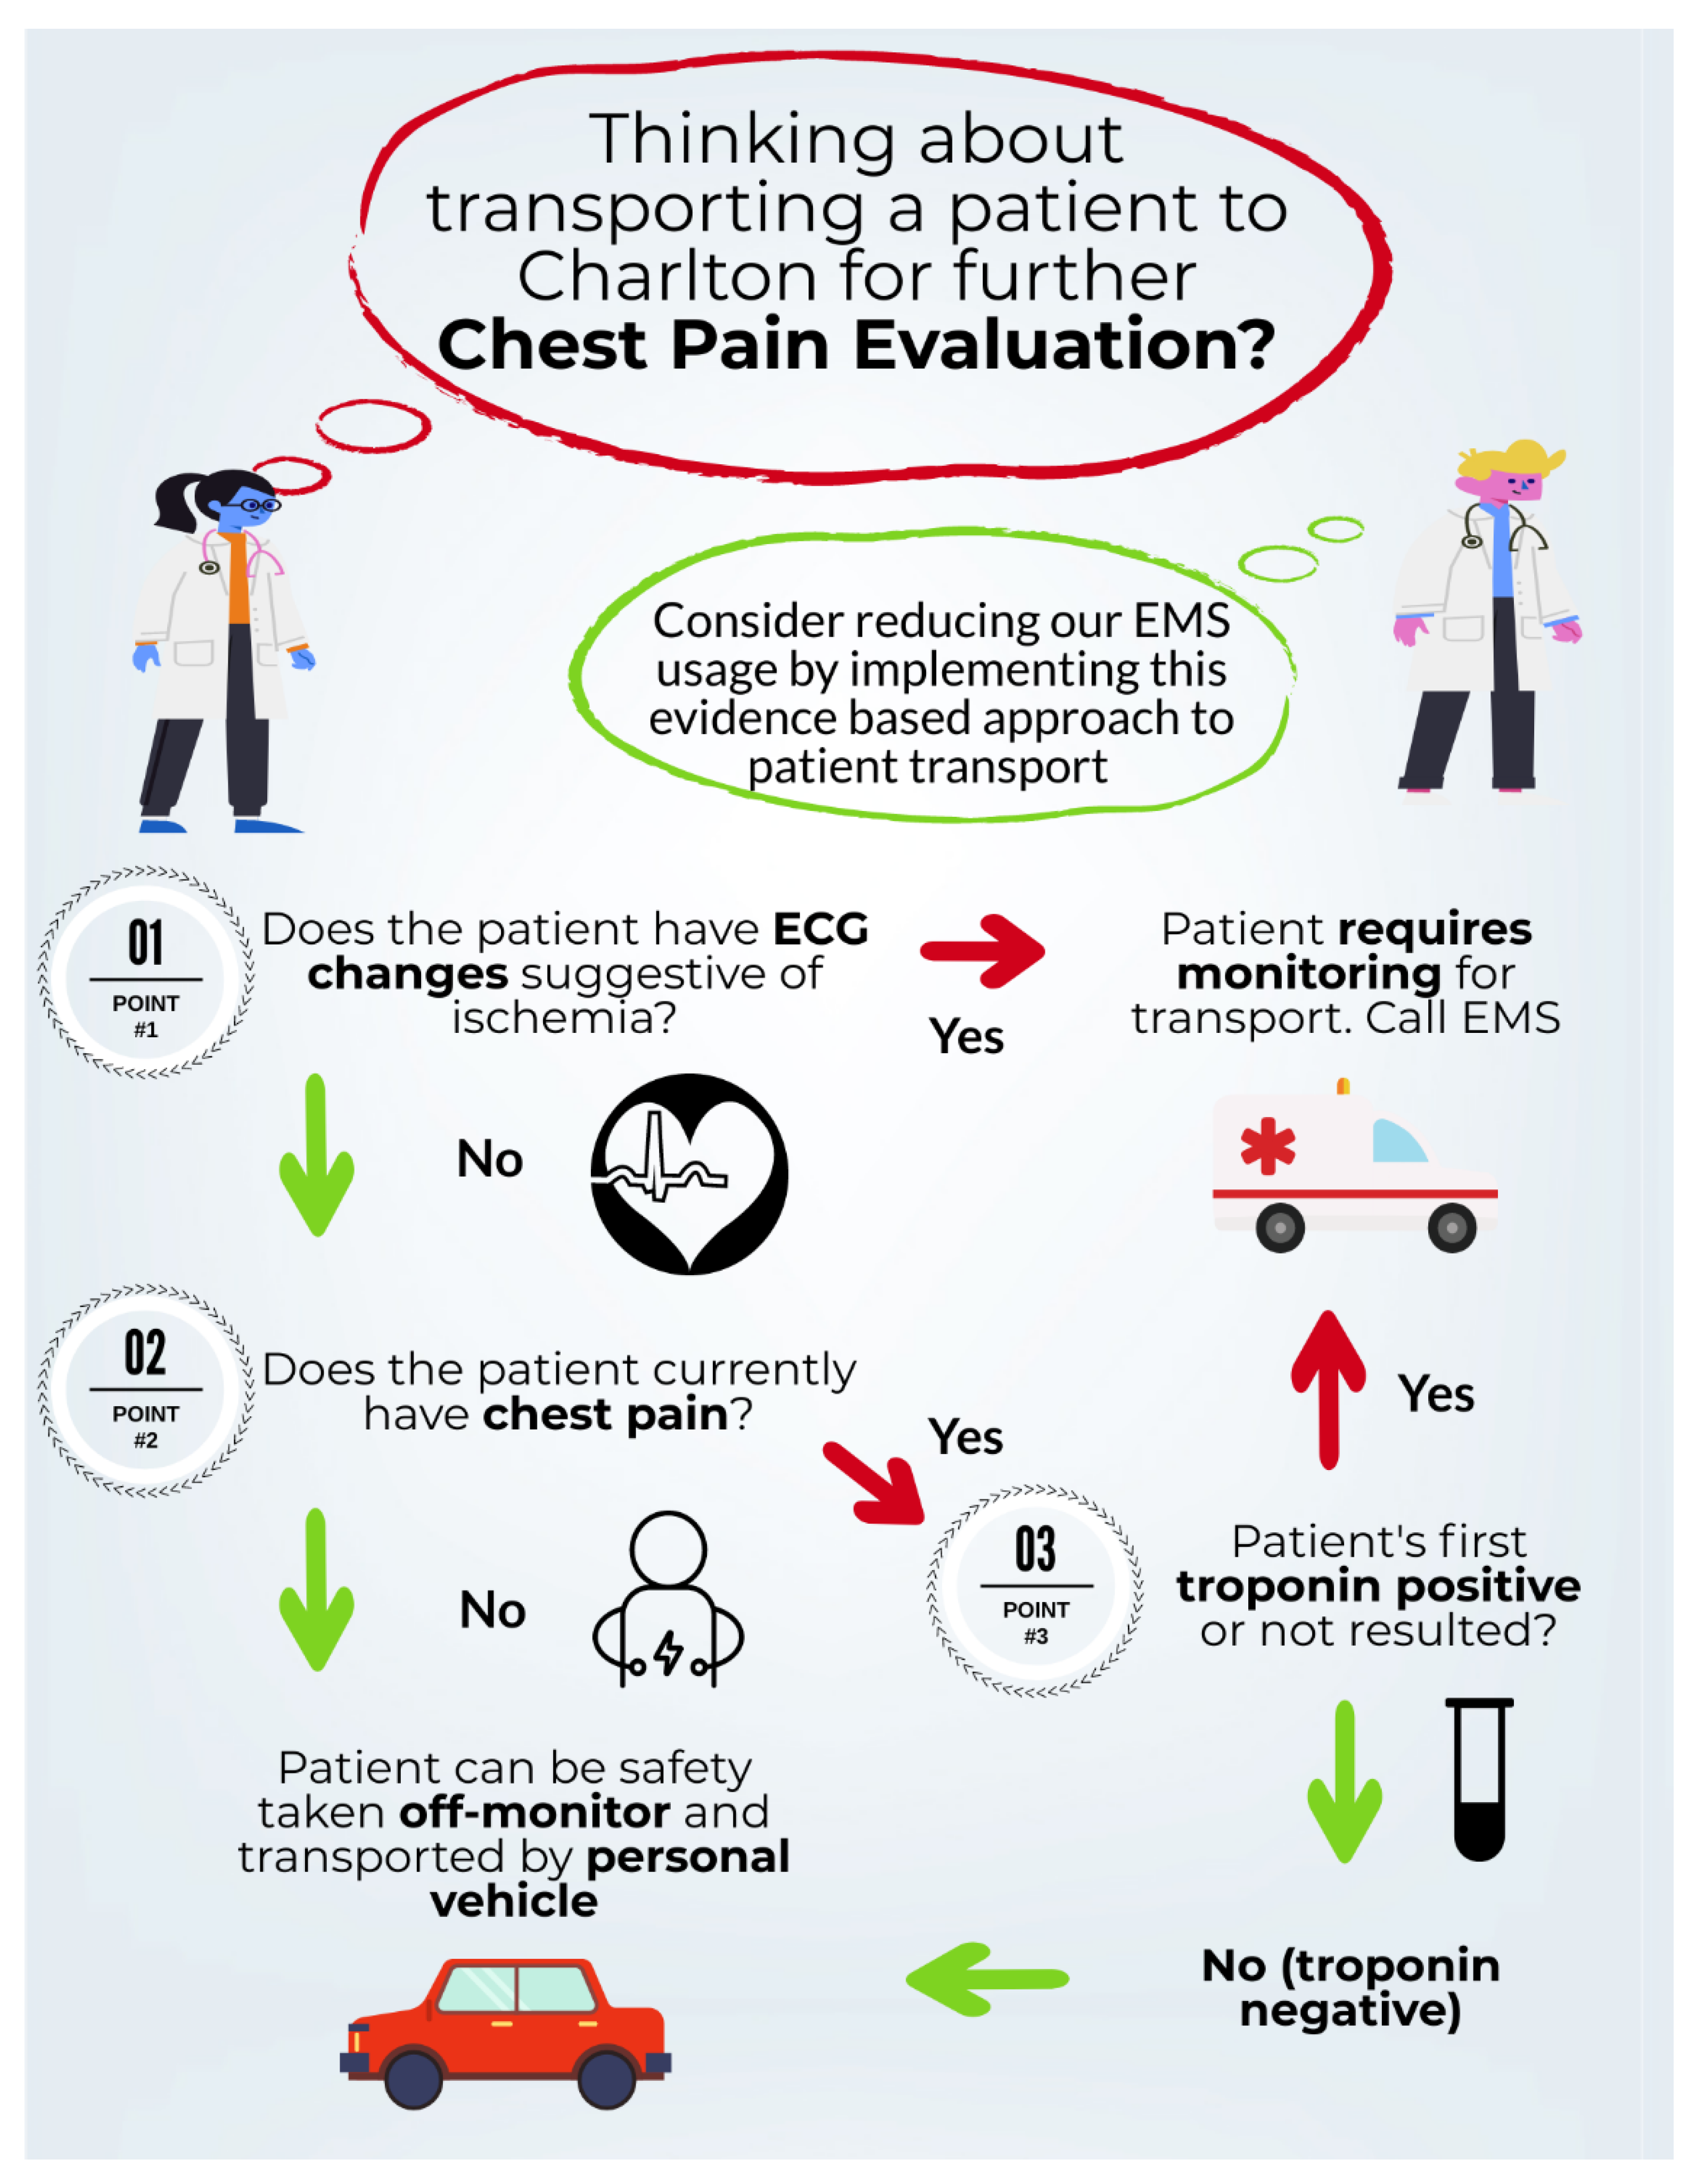
Figure A4.
Pictorial representation of clinical decision tool. This is the second of two versions that will be piloted in a usability study for the project.
Figure A4.
Pictorial representation of clinical decision tool. This is the second of two versions that will be piloted in a usability study for the project.
References
- Amsterdam, E. A.; et al. 2014 AHA/ACC guideline for the management of patients with non-st-elevation acute coronary syndromes: A report of the American college of cardiology/American heart association task force on practice guidelines. Circulation 2014, 130. [Google Scholar]
- Syed, S.; et al. Prospective validation of a clinical decision rule to identify patients presenting to the emergency department with chest pain who can safely be removed from cardiac monitoring. Cmaj 2017, 189, E139–E145. [Google Scholar] [CrossRef]
- Gatien, M.; Perry, J. J.; Stiell, I. G.; Wielgosz, A.; Lee, J. S. A Clinical Decision Rule to Identify Which Chest Pain Patients Can Safely Be Removed From Cardiac Monitoring in the Emergency Department. Ann. Emerg. Med. 2007, 50, 136–143. [Google Scholar] [CrossRef] [PubMed]
- Grossman, S. A.; et al. Is telemetry useful in evaluating chest pain patients in an observation unit? Intern. Emerg. Med. 2011, 6, 543–546. [Google Scholar] [CrossRef] [PubMed]
- Weaver, M. D.; Moore, C. G.; Patterson, P. D.; Yealy, D. M. Medical Necessity in Emergency Medical Services Transports. Am. J. Med. Qual. 2012, 27, 250–255. [Google Scholar] [CrossRef] [PubMed]
- Alley, W.; Mahler, S. A. Clinical decision aids for chest pain in the emergency department: Identifying low-risk patients. Open Access Emerg. Med. 2015, 7, 85–92. [Google Scholar] [CrossRef]
- Six, A. J.; Backus, B. E.; Kelder, J. C. Chest pain in the emergency room; value of the HEART score. Netherlands Hear. J. 2008, 16, 191–196. [Google Scholar] [CrossRef]
- Backus, B. E.; et al. Chest pain in the emergency room: A multicenter validation of the heart score. Crit. Pathw. Cardiol. 2010, 9, 164–169. [Google Scholar] [CrossRef]
- Backus, B. E.; et al. A prospective validation of the HEART score for chest pain patients at the emergency department. Int. J. Cardiol. 2013, 168, 2153–2158. [Google Scholar] [CrossRef]
- Mahler, S. a; et al. The HEART Pathway Randomized Trial: Identifying Emergency Department Patients With Acute Chest Pain for Early Discharge. Circ Cardiovasc Qual Outcomes 2015, 8, 195–203. [Google Scholar] [CrossRef]
- Mahler, S. A.; et al. Safely Identifying Emergency Department Patients with Acute Chest Pain for Early Discharge: The HEART Pathway Accelerated Diagnostic Protocol. Circulation 2018, 138, 2456–2468. [Google Scholar] [CrossRef] [PubMed]
- Poldervaart, J. M.; et al. Effect of using the HEART score in patients with chest pain in the emergency department: A Stepped-wedge, cluster randomized trial. Ann. Intern. Med. 2017, 166, 689–697. [Google Scholar] [CrossRef] [PubMed]
- Kavsak, P. A.; et al. Using the clinical chemistry score in the emergency department to detect adverse cardiac events: a diagnostic accuracy study. C. Open 2020, 8, E676–E684. [Google Scholar] [CrossRef] [PubMed]
- Kavsak, P. A.; et al. High-Sensitivity Cardiac Troponin I vs a Clinical Chemistry Score for Predicting All-Cause Mortality in an Emergency Department Population. CJC Open 2020, 2, 296–302. [Google Scholar] [CrossRef]
- Kavsak, P. A.; et al. Risk Stratification for Patients with Chest Pain Discharged Home from the Emergency Department. J. Clin. Med. 2020, 9, 2948. [Google Scholar] [CrossRef]
- Sandau, K. E.; et al. Update to Practice Standards for Electrocardiographic Monitoring in Hospital Settings: A Scientific Statement From the American Heart Association. Circulation 2017, 136. [Google Scholar] [CrossRef]
- Gatien, M.; Perry, J. J.; Stiell, I. G.; Wielgosz, A.; Lee, J. S. A Clinical Decision Rule to Identify Which Chest Pain Patients Can Safely Be Removed From Cardiac Monitoring in the Emergency Department. Ann. Emerg. Med. 2007, 50, 136–143. [Google Scholar] [CrossRef]
- Grossman, S. A.; et al. Is telemetry useful in evaluating chest pain patients in an observation unit? Intern. Emerg. Med. 2011, 6, 543–546. [Google Scholar] [CrossRef]
- Syed, S.; et al. Prospective validation of a clinical decision rule to identify patients presenting to the emergency department with chest pain who can safely be removed from cardiac monitoring. Cmaj 2017, 189, E139–E145. [Google Scholar] [CrossRef]
- Hollander, J. E.; Sites, F. D.; Pollack, C. V.; Shofer, F. S. Lack of Utility of Telemetry Monitoring for Identification of Cardiac Death and Life-Threatening Ventricular Dysrhythmias in Low-Risk Patients with Chest Pain. Ann. Emerg. Med. 2004, 43, 71–76. [Google Scholar] [CrossRef]
- Perkins, J.; et al. Is Telemetry Monitoring Useful in Patients Admitted With Suspected Acute Coronary Syndrome? Am. J. Med. Qual. 2017, 32, 638–643. [Google Scholar] [CrossRef]
- Dallaire, C; Poitras, J; Aubin, K; Lavoie, A; Moore, L. Emergency department triage: Do experienced nurses agree on triage scores? J Emerg Med. 2012, 42(6), 736–40. [Google Scholar] [CrossRef]
Figure 5.
Change in CTAS scores between UCC arrival and Main Hospital Arrival in Self-Transported Patients. SPC XBar chart illustrating trends over time to CTAS scores.
Figure 5.
Change in CTAS scores between UCC arrival and Main Hospital Arrival in Self-Transported Patients. SPC XBar chart illustrating trends over time to CTAS scores.
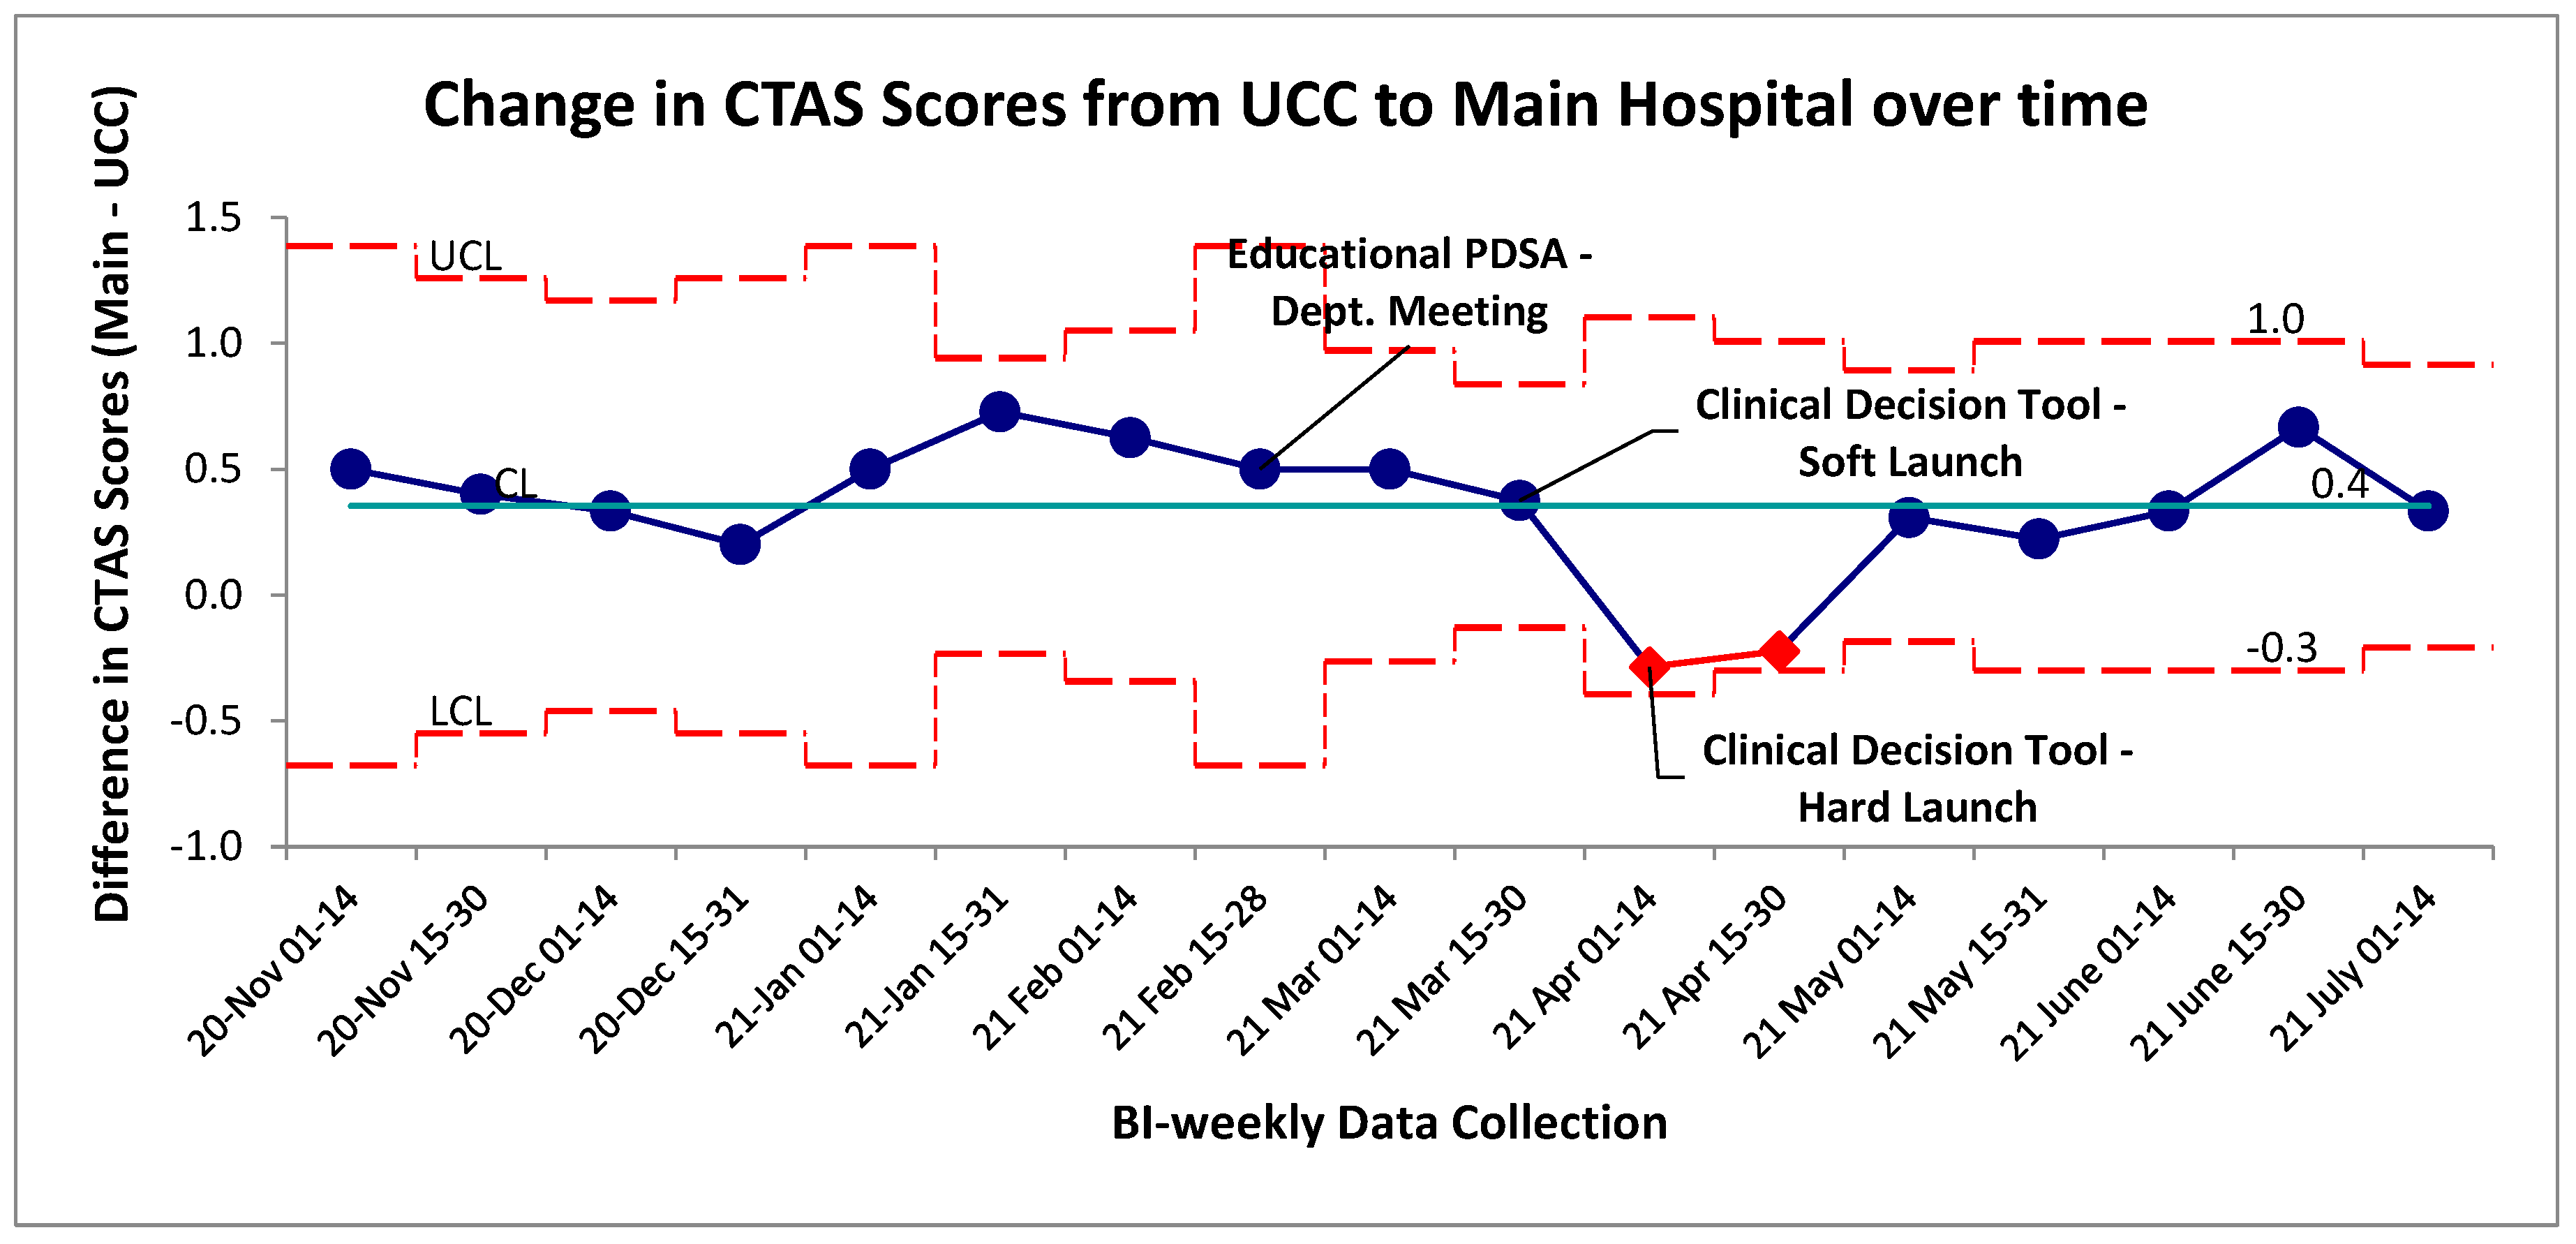
Figure 6.
Admission rates of self-transported patients over time. SPC-X chart illustrating trends to the % of patients admitted following troponin evaluation and transfer over the bi-weekly data collection period.
Figure 6.
Admission rates of self-transported patients over time. SPC-X chart illustrating trends to the % of patients admitted following troponin evaluation and transfer over the bi-weekly data collection period.
Disclaimer/Publisher’s Note: The statements, opinions and data contained in all publications are solely those of the individual author(s) and contributor(s) and not of MDPI and/or the editor(s). MDPI and/or the editor(s) disclaim responsibility for any injury to people or property resulting from any ideas, methods, instructions or products referred to in the content. |
© 2026 by the authors. Licensee MDPI, Basel, Switzerland. This article is an open access article distributed under the terms and conditions of the Creative Commons Attribution (CC BY) license (http://creativecommons.org/licenses/by/4.0/).
Copyright: This open access article is published under a Creative Commons CC BY 4.0 license, which permit the free download, distribution, and reuse, provided that the author and preprint are cited in any reuse.


