
Submitted:
19 January 2026
Posted:
19 January 2026
You are already at the latest version
Abstract
This study deals with the estimation of daily actual evapotranspiration (ETa) values above selected agricultural fields located in the semi-arid region of Albacete at the autonomous region of Castilla-La Mancha, Spain, for the growing season of 2020-21. ESA’s Sentinel free imagery was utilized for the satellite-based estimation of ETa values. A modification of Sen-ET SNAP graphical user interface by ESA was introduced, as well as meteorological data from the Weather Research and Forecast (WRF) model. The estimated values are compared against ETa values derived from lysimeter observations acquired in-situ from the study region (ET0). Initial results showed a high correlation (R²=0.75) between the proposed model and lysimeter measurements, but with systematic underestimation which was corrected by introducing an intercept in the proposed linear relationship, improving ETa estimations. Validation with 2022-2023 data confirmed the reliability of the corrected method, which, although is not as accurate as FAO Penman-Monteith (R²=0.99), it offers a significant advantage at the ET estimation used for local agricultural and hydrological applications.
Keywords:
actual evapotranspiration
; ESA
; SNAP
; WRF
; Castilla-La Mancha
; Spain
; Sentinel-2
; Sentinel-3
1. Introduction
Evaporation from land surfaces and water bodies and transpiration by the plants constitute one of the most important factors of the water cycle. Evapotranspiration (ET) as a unique element presents the main losses from a hydrological system. Several types of ET can be considered; however, the most used today is the actual evapotranspiration (ETa) [1,2] defined as the ET that occurs under actual environmental and management conditions, which is inclusive of both standard and nonstandard conditions [3]. ET estimations are necessary in many hydrological applications, as well as agricultural water management, or drought identification. Based on the above, ET has a very important influence on water management, especially in semi-arid climate conditions as the study area which is described in session 3. As a result, the estimation of ETa is generally very important, and it is based mainly on measurement procedures like Eddy Covariance system (EC), Lysimeters or Bowen ratio energy balance system [2]. Nevertheless, it is very common that all those procedures are not available in many parts of the world, and alternatives such as indirect methodologies are utilized [4]. Due to the difficulties of collecting good field observations, ET is generally calculated from weather data. A vast number of empirical or semi-empirical equations have been devised to estimate crop or reference crop evapotranspiration using meteorological data. Some approaches are limited to specific meteorological and agronomic conditions and cannot be applied under other conditions
On the other hand, with regards to cultivation, the crop evapotranspiration (ETc) parameter is imported, using either clipped grass (ETo) or alfalfa (ETr) as a reference evapotranspiration value. The methodology relates then the crop coefficient (Kc) depending on the crop type as well as the different vegetation phases [3],([4]). Crop water productivity as stated in ([5]) is a very important step to connect water management with water and food security, as well as economic growth.
Remote sensing (RS) techniques being already a powerful tool for land surface monitoring can provide a continuous coverage of land surfaces and have been used for many decades for the estimation of ETa worldwide [6,7] ([6])[5,7,8,9,10,11,12,13,14,15,16,17,18,19,20]. The most frequently used RS platforms are available mostly free of charge for every part of the world, where all the available spatial and temporal patterns of ET derived from remote sensing platforms. Most of these platforms suffer from the fact that they are not identical for use at the field level because of their spatial and/or temporal resolution [18,21]. The best practice is to use a more precise methodology, like that of the family of Energy balance models ([22]). There are several variations between energy balance models mainly due to the related spatiotemporal capabilities analyzing energy balance fluxes (EB) for different crop types. According to [23,24] land surface temperature-based energy balance models are the prevailed methodologies nowadays, and between them: (a) the Surface Energy Balance Algorithm for Land (SEBAL) [25,26]; (b) Surface Energy Balance System (SEBS) [27] and (c) Mapping EvapoTranspiration at high Resolution with Internalized Calibration (METRIC) [3], are the most common ones [28]. METRIC model is a modification of the SEBAL model. METRIC has been used worldwide in different crops and ETa is computed as a residual of the surface energy balance equation using meteorological data and data derived from satellite images [28]. One of the main advantages of METRIC model is that it is suitable for both plain and high elevated terrain ([29]). Results showed a good correlation between the METRIC model results and the Penman–Monteith model [29]. Likewise, [30] showed that results from METRIC model were also in accordance with the Eddy-Covariance methodology. The work of [31] demonstrates a sensitivity analysis according to the terrain of the study areas, while an alternative approach to model surface energy fluxes using Land Surface Temperature (LST) and radiometric heat fluxes radiometric surface temperature is described in [33,34]. The study of [35]well describes the history of TSEB and its extensions ALEXI and disALEXI which nowadays are considered among the most powerful methodologies for ET computations. In addition, a very recent study [36]evaluates the two remote sensing Energy Balance models, METRIC and TSEB in two ecosystems, estimating ETa and energy fluxes using the eddy covariance (EC) as a reference. The comparison showed a good agreement at both test sites located in central Europe, empowering the use of the specific methodologies for the estimation of ETa values for addressing various practical hypotheses and challenges associated with water balance.
Another common practice is using RS from vegetation indices (VI). Generally, the estimation of ET is made using the Kc ETo approach where the value for Kc is estimated from the VI, commonly is the NDVI, which is the NDVI_ET method [36,37]. Reyes-Gonzalez et al. [38]showed the appearance of a high correlation between NDVI and Kc reported by FAO-56.
Artificial Intelligence-based models are also considered an interesting alternative to the most common based surface energy balance models. Artificial Neural Networks (ANNs) have been successfully utilized in modelling reference evapotranspiration, i.e., ETo [37,38,39,41] A very recent study shows that [23] there are also significant results using METRIC model as the validation procedure.
After considering all the available methodologies, and authors’ capabilities, the Two Source Energy Balance (TSEB) based on the EB methodologies has been selected for further processing in this study for the final estimation of ET. The idea is to use the combination of Sentinel-2 and Sentinel-3 imagery for the computation of ET based on the studies of [35,42] and modify the well described methodology using meteorological data from Weather Research and Forecast (WRF) model instead of the initially proposed ERA-5 [42]. The objective of this study is to estimate ET based on high-resolution (10 by 10 m) Sentinel data and to evaluate the ET values using observations from a large weighing lysimeter available at the study region.
The paper is organized as follows: a brief description of the study is presented in the “Introduction”, the procedure for the computation of ET has been described in “Materials and Methods” section, the study area follows, and finally, the results are analyzed and validated at the “Results and Discussion” section.
2. Materials and Methods
2.1. SEN-ET (Copernicus)
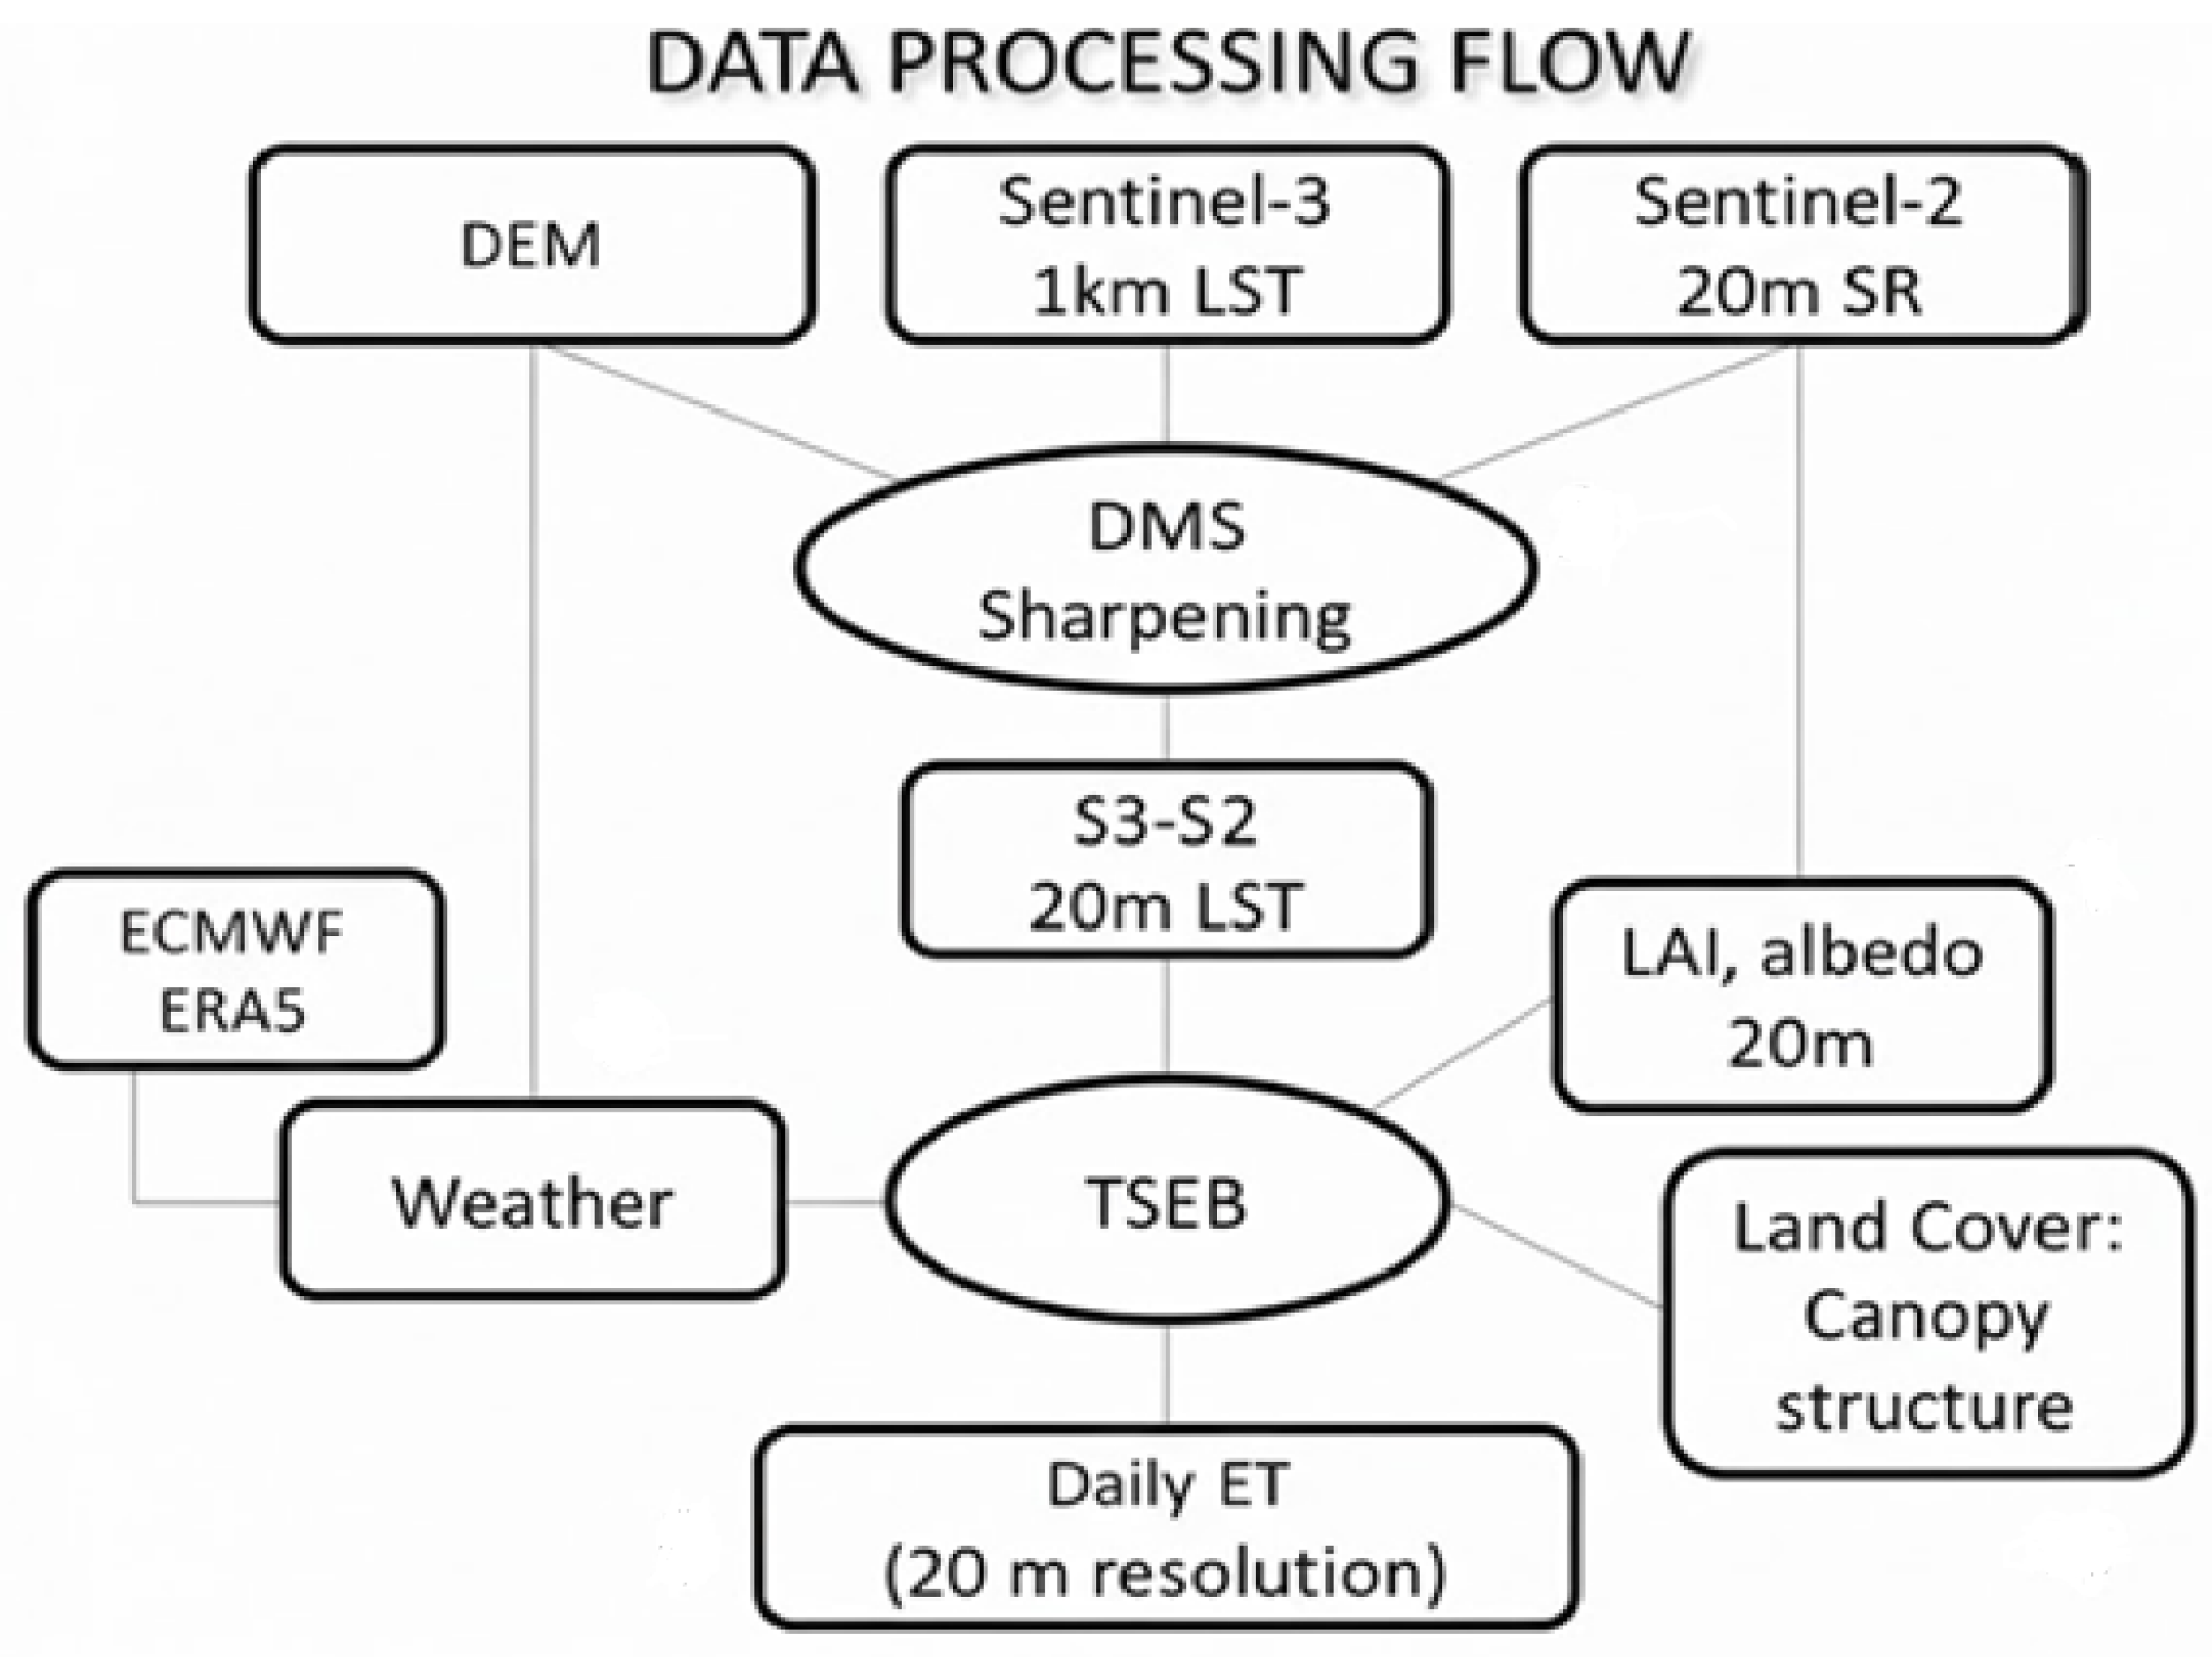
The basic idea used in this study is the utilization of Sentinel-2 and Sentinel-3 imagery for the computation of ET based on the studies of [35,43]. Specifically, TSEB is incorporated within the Sen-ET plug-in (https://www.esa-sen4et.org/) according to European Union’s Copernicus Earth Observation program [45]. Among relevant Copernicus platforms Sentinel-2 and Sentinel -3 satellites were utilized. Sentinel-2 mission is a pair of satellites [4][46]demonstrating multispectral shortwave observations with a spatial resolution of 10–60 m and a temporal resolution of 5 days. Sentinel-3 on the other hand contributes to the Thermal Infrared (TIR) wavebands, with a 1-km resolution and a 1-day temporal resolution [47]. Finally, the Data Mining Sharpener (DMS) tool is incorporated to improve the spatial resolution to a 20mx20m [48]. DMS methodology enhances spatial information from thermal bands using information retrieved from surface reflectance bands, which usually have a finer spatial resolution. The well described Copernicus’ methodology is modified at this study using meteorological data from Weather Research and Forecast (WRF) model instead of the initially proposed ERA-5 [42].
The reliability of the Sen-ET approach was initially validated with satisfactory results in Denmark, [43] leading to an open-source plugin for COPERNICUS’ SNAP Software under the name “Sen-ET approach” (https://www.esa-sen4et.org) [35,36,37,38,39,40,41,42]. Other studies using Sen-ET approach have been conducted in India [47] the Italian Alps [49], Spain and Tunisia [50,51]. The Sen-ET approach used in this study consists of thirteen steps presented in Table 1.
Figure 1.
ET computation flow chart (modified from [35]).
Figure 1.
ET computation flow chart (modified from [35]).
2.2. Use of WRF
In this study, WRF data are used instead of ERA5 (ECMWF Reanalysis 5) to improve local uncertainties of the model. Assuming that ERA5 has a fixed configuration, WRF can allow the user to select between various physics related themes (planetary boundary layer, radiation etc.) which can be adapted to the specific region of interest. The performance of the WRF model based on a large ensemble consisting of physics parameterizations and initial and boundary datasets for various events is already evaluated at a region like that of the study area [52].
2.3. Validation with the Use of Large Weighing Lysimeter ET Measurements
It is essential that even if remote sensing ET products can offer satisfactory spatial coverage, they need to be validated against more traditional computational methodologies. One of the most prevailing ground measurement methodologies is the use of weighing lysimeters, which have already been used for reference measurements in many studies around the world for measuring actual ET considering precipitation, irrigation and drainage [54,55]
Both data sets of ETa (observations and estimations) were compared by using the lineal regression analysis (the interception, slope, coefficient of determination (R2)). In addition, the Root Mean Square Error (RMSE) and the Mean Bias Error (MBE) are introduced as the appropriate metrics for the validation process. The validation process can be characterized as successful when a low RMSE is found and an MBE is close to zero, while R2 should be close to 1 [14,56]
3. Study Area
Albacete, Spain, is the study domain occupied 14,858 km2. The region is in the southern part of the autonomous community of Castile–La Mancha (Figure 2), located at the South-east part of the Iberian Peninsula. It is characterized by relatively flat surfaces averaging 510 to 700 meters in altitude. It has semi-arid climate with annual precipitation below 350 mm and evapotranspiration above 1200 mm. In the region there is a strong agriculture sector with annual crops, such as Wheat, Barley, Alfalfa, Onion, Garlic, and Legumes and trees like Almont, Olive, Pistachio and Vineyard. According to the Köppen-Geiger classification [56]the climate in the study area is cold semi-arid (steppe; type “BSk”).
The lysimeter used at his study is installed in the center of a 10,000 m2 plot of grass maintained in optimum growth conditions (Figure 3). There is an automated 15 × 12.5 m sprinkler irrigation system of total underground coverage used for overnight watering to avoid the high evaporative hours [57]. The entire plot is regularly irrigated and kept as near as possible to the reference standard conditions. In this way, the soil can be maintained close to field capacity between 0.10 and 0.15 m height. All the above conditions are according to FAO guidelines, and from this point all the related ET measurements can be assumed as ET0 [57]. The lysimeter has been also used for similar studies with successful results [58,59].
4. Results and Discussion
Table 1 summarizes the results of ETo using the proposed methodology for 2021 growing season where Sentinel images were available for the study region. ET values from lysimeters and FAO Penman-Monteith methodology are also presented at the table. From the simple linear relationship Equation 1 is derived:
ET0,model =0.8722* ET0,lysimeter
The next step of the study is the validation of the model. For that reason, available Sentinel scenes from 2022 and 2023 were considered, selected from all the available clear days of that period. Table 2 illustrates the results for the validation period consistently with Table 1, while Figure 5 illustrates the above relationship.
After examining the statistics from the model (Table 3), MBE and RMSE provide reasonable but not satisfactory results. Initial modeling using Sentinel data for the year 2021 showed a high correlation between ETo derived from satellite data and lysimeter measurements respectively, however, a direct 1:1 comparison showed a systematic underestimation of ETo values, as evidenced by the negative mean bias error (MBE) of -1.61 mm/d and the root mean square error (RMSE) of 2.64 mm/d. For that reason, an interception is incorporated into the model, to avoid the bias, which is usually generated in the 1:1 approach. The new result producing equation (2), describes the approach differently (Figure 6):
ET0,model = 0.6173*ET0,lysimeter +2.0178
The new statistics are shown inat Table 4:
The results after the modification seem to be more reliable than the previous approach. Incorporating the interception value significantly improved Mean Bias Error. The Mean Bias Error (MBE) was reduced from -1.61 mm/d to -0,52 mm/d representing a 67,7% improvement of the model’s overall accuracy, reducing also the related underestimation. Furthermore, the Root Mean Square Error (RMSE) decreased from 2.64 mm/d to 2.48 mm/d. This result suggests that, while the model effectively detects the temporal behavior of evapotranspiration, the result requires calibration to match the actual measurements provided by the well-established large weighing lysimeter.
As shown in Table 1 and Table 2, the ETo values derived from the FAO Penman-Monteith (FAO PM) method (following the guidelines in FAO56) correlate very well with the lysimeter data (R2=0.99). The proposed model, which uses high spatial resolution Sentinel images, cannot achieve the same level of accuracy as the FAO PM methodology. This is a very common situation in remote sensing models, where local environmental conditions (e.g., soil moisture conditions or temperature anomalies) may not be fully captured by the model parameters [50] The introduction of and interception in Equation 2 proved critical for the model’s validation, because the model was now able to account for the bias inherent in the firstly 1:1 proposed relationship. The statistical improvements were substantial: MBE was reduced to -0.52 mm/d, reducing systemic underestimation, while RMSE slightly decreased too. The modified model can be considered more physically represented by the relative data, considering atmospheric or sensor noise producing errors. The improved model increases the proposed methodology’s accuracy, bringing the estimating values closer to ground-based lysimeter data and/or the FAO Penmann-Monteith standard computations, but significant work has yet to be conducted for even better accuracy.
It was already stated [33] that one of the main disadvantages of using Sentinel-3 imagery is that LST sharpening from 1 km to 20 m causes larger deviations when extreme temperatures are evident. This is due to systematic overestimation over colder pixels and the relevant underestimation over the hottest pixels. This can be justified because LST downscaling approaches cannot describe the whole dynamic image captured under the finer resolution [61]. To minimize this issue, Landsat LST imagery has been utilized during the sharpening process [50]. With the advancement of technology, new Sentinel sensors and new WRF schemes will improve the existing anomalies, and the errors are expected to minimize improving the accuracy of the methodology.
5. Conclusions
This paper presents a new evapotranspiration (ET) estimation methodology based on high spatial resolution Sentinel-2/Sentinel-3 images for Albacete, central Spain area in 2021, validated with lysimeter measurements and the standard FAO Penman-Monteith ETo equation. Initial results showed a high correlation (R2=0.75) between the proposed model and lysimeter measurements, but with systematic underestimation (MBE=--1.61 mm/d, RMSE=2.64 mm/d), which was corrected by introducing an interception in the proposed equation, critically improving the measurements (MBE=-0,52 mm/d, while RMSE=2,48 mm/d). Initially, a multiplicative adjustment factor of 0.90 was observed, suggesting a 10% systematic underestimation by the model. This approach is consistent with the recent methodology of [60], who utilized empirical adjustments factors ranging from 0.59 to 0.63 to cotton, maize and hay. The goal was to calibrate satellite-based ET estimates against ground observation to Greece and France which are Mediterranean countries with a similar climate to Spain. [60] suggested the 1:1 line, and this is the reason for the first part of this study. However, the subsequent incorporation of an interception allowed a more refined calibration, reducing MBE to -0.52 mm/d and improving the model compared to a simple linear scaling. As a result, a model optimization has been achieved, integrating a non-zero interception which significantly improved the linear regression. Similarly, bias reduction also occurred eliminating systematic underestimation, as well as error minimization and predictive reliability with a strong coefficient of determination (R2=0.75). The model, although not as accurate as FAO Penman-Monteith (R2=0.99), offers a significant advantage on a spatial scale for agricultural and hydrological applications.
Author Contributions
Conceptualization, N.R.D., N.D., A.D, R.L.U.; project administration, I.F. and N.R.D.; methodology, A.N. ,A.P., K.G. and G.T.; software, R.L.U. and M.S..; validation, G.T., S.S. and P.S. ; formal analysis, G.K; investigation, F.M., G.K.; data curation, M.S.; writing—original draft preparation, M.S. and N.R.D.; writing—review and editing, I.F. and S.S..; visualization, N.R.D. ,N.D., R.L.U; supervision, N.R.D. N.D. and A.D.; funding acquisition. All authors have read and agreed to the published version of the manuscript.
Funding
This research was carried out within the European project SUPROMED “GA-1813” funded by PRIMA.
Acknowledgments
The authors acknowledge the European Space Agency for the supporting data and materials.
Conflicts of Interest
The authors declare no conflicts of interest.
References
- Calera, A.; Campos, I.; Osann, A.; D’Urso, G.; Menenti, M. Remote Sensing for Crop Water Management: From ET Modelling to Services for the End Users. Sensors (Switzerland) 2017, 17, 1–25. [Google Scholar] [CrossRef]
- Gowda, P.H.; Chavez, J.L.; Colaizzi, P.D.; Evett, S.R.; Howell, T.A.; Tolk, J.A. ET Mapping for Agricultural Water Management: Present Status and Challenges. Irrig. Sci. 2008, 26, 223–237. [Google Scholar] [CrossRef]
- Vázquez-Rodríguez, B.A.; Ontiveros-Capurata, R.E.; González-Sánchez, A.; Ruíz-Álvarez, O. Comparative Analysis of Actual Evapotranspiration Values Estimated by METRIC Model Using LOCAL Data and EEFlux for an Irrigated Area in Northern Sinaloa, Mexico. Heliyon 2024, e34767. [Google Scholar] [CrossRef]
- Gowda, P.H.; Chävez, J.; Howell, T.A.; Marek, T.H.; New, L.L. Surface Energy Balance Based Evapotranspiration Mapping in the Texas High Plains. Sensors 2008, 8, 5186–5201. [Google Scholar] [CrossRef] [PubMed]
- Allen, R.G.; Tasumi, M.; Morse, A.; Trezza, R.; Wright, J.L.; Bastiaanssen, W.; Kramber, W.; Lorite, I.; Robison, C.W. Satellite-Based Energy Balance for Mapping Evapotranspiration with Internalized Calibration (METRIC)—Applications. Journal of Irrigation and Drainage Engineering 2007, 133, 395–406. [Google Scholar] [CrossRef]
- Pereira, L.S.; Allen, R.G.; Smith, M.; Raes, D. Crop Evapotranspiration Estimation with FAO56: Past and Future. Agric. Water Manag. 2015, 147, 4–20. [Google Scholar] [CrossRef]
- Singh, P.; Sehgal, V.K.; Dhakar, R.; Neale, C.M.U.; Goncalves, I.Z.; Rani, A.; Jha, P.K.; Das, D.K.; Mukherjee, J.; Khanna, M.; et al. Estimation of ET and Crop Water Productivity in a Semi-Arid Region Using a Large Aperture Scintillometer and Remote Sensing-Based SETMI Model. Water (Switzerland) 2024, 16. [Google Scholar] [CrossRef]
- Woo, D.K. Estimating Actual Evapotranspiration from Widely Available Meteorological Data with a Hybrid CNN–LSTM. Agric. Water Manag. 2026, 323. [Google Scholar] [CrossRef]
- Fibbi, L.; Chiesi, M.; Pieri, M.; Bartolini, G.; Grifoni, D.; Gozzini, B.; Maselli, F. Assessment of Three Remote Sensing Methods for Estimating Actual Evapotranspiration in a Mediterranean Region. International Journal of Applied Earth Observation and Geoinformation 2026, 146. [Google Scholar] [CrossRef]
- Anderson, M.C.; Allen, R.G.; Morse, A.; Kustas, W.P. Use of Landsat Thermal Imagery in Monitoring Evapotranspiration and Managing Water Resources. Remote Sens. Environ. 2012, 122, 50–65. [Google Scholar] [CrossRef]
- dos Santos, R.A.; Mantovani, E.C.; Bufon, V.B.; Fernandes-Filho, E.I. Improving Actual Evapotranspiration Estimates through an Integrated Remote Sensing and Cutting-Edge Machine Learning Approach. Comput. Electron. Agric. 2024, 225. [Google Scholar] [CrossRef]
- Li, X.; Pang, Z.; Xue, F.; Ding, J.; Wang, J.; Xu, T.; Xu, Z.; Ma, Y.; Zhang, Y.; Shi, J. Analysis of Spatial and Temporal Variations in Evapotranspiration and Its Driving Factors Based on Multi-Source Remote Sensing Data: A Case Study of the Heihe River Basin. Remote Sens. (Basel). 2024, 16. [Google Scholar] [CrossRef]
- Xie, Z.; Yao, Y.; Li, Y.; Liu, L.; Ning, J.; Yu, R.; Fan, J.; Kan, Y.; Zhang, L.; Xu, J.; et al. Satellite-Based PT-SinRH Evapotranspiration Model: Development and Validation from AmeriFlux Data. Remote Sens. (Basel). 2024, 16. [Google Scholar] [CrossRef]
- Liang, T.; Li, C.; He, Y.; Tan, J.; Niu, W.; Cui, Y.; Yang, H. PML_30: A High Resolution (30 m) Estimates of Evapotranspiration Based on Remote Sensing Model with Application in an Arid Region. J. Hydrol. (Amst). 2024, 131862. [Google Scholar] [CrossRef]
- Almeida, W.S.; Paredes, P.; Basto, J.; Pôças, I.; Pacheco, C.A.; Paço, T.A. Estimating Evapotranspiration of Rainfed Winegrapes Combining Remote Sensing and the SIMDualKc Soil Water Balance Model. 2024. [Google Scholar] [CrossRef]
- Nagy, A.; Kiss, N.É.; Buday-Bódi, E.; Magyar, T.; Cavazza, F.; Gentile, S.L.; Abdullah, H.; Tamás, J.; Fehér, Z.Z. Precision Estimation of Crop Coefficient for Maize Cultivation Using High-Resolution Satellite Imagery to Enhance Evapotranspiration Assessment in Agriculture. Plants 2024, 13, 1212. [Google Scholar] [CrossRef]
- Nilsson, B.; Nielsen, K. Validation of Sentinel-6MF Based Lake Levels—An Assessment with in Situ Data and Other Satellite Altimetry Data. Advances in Space Research 2024. [Google Scholar] [CrossRef]
- Abid, N.; Bargaoui, Z.; Jaafar, A. Ben; Mannaerts, C.M. Comparison of Actual Evapotranspiration Assessment by Satellite-Based Model SEBS and Hydrological Model BBH in Northern Tunisia; 2024; pp. 471–476. [Google Scholar]
- Zipper, A.S.; Kastens, J.; Foster, T.; Wilson, B.; Melton, F. Estimating Irrigation Water Use from Remotely Sensed Evapotranspiration Data: Accuracy and Uncertainties across Spatial Scales 2024, 1–52.
- Saxena, D. Uncorrected Proof Spatiotemporal Trends and Evapotranspiration Estimation Using an Improvised SEBAL Convergence Method for the Semi-Arid Region of Western Rajasthan, India. 2024, 00, 1–17. [Google Scholar] [CrossRef]
- Tang, R.; Peng, Z.; Liu, M.; Li, Z.; Jiang, Y.; Hu, Y.; Huang, L.; Wang, Y.; Wang, J.; Jia, L.; et al. Remote Sensing of Environment Spatial-Temporal Patterns of Land Surface Evapotranspiration from Global Products. Remote Sens. Environ. 2024, 304, 114066. [Google Scholar] [CrossRef]
- Zhao, G.; Song, L.; Zhao, L.; Tao, S. A Comparison of Different Machine Learning Methods to Reconstruct Daily Evapotranspiration Time Series Estimated by Thermal–Infrared Remote Sensing. Remote Sens. (Basel). 2024, 16. [Google Scholar] [CrossRef]
- Karahan, H.; Alsenjar, O.; Scholar, G. Developing a New ANN Model to Estimate Daily Actual Evapotranspiration Using Limited Climatic Data and Remote Sensing Techniques. 2024. [Google Scholar] [CrossRef]
- Li, P.; Jia, L.; Lu, J.; Jiang, M. A New Evapotranspiration-Based Drought Index for Flash Drought Identification and Monitoring; 2024. [Google Scholar]
- Tasumi, M. Estimating Evapotranspiration Using METRIC Model and Landsat Data for Better Understandings of Regional Hydrology in the Western Urmia Lake Basin. Agric. Water Manag. 2019, 226, 105805. [Google Scholar] [CrossRef]
- Water Resources Research. JAWRA Journal of the American Water Resources Association 1969, 5, 2–2. [CrossRef]
- Zamani Losgedaragh, S.; Rahimzadegan, M. Evaluation of SEBS, SEBAL, and METRIC Models in Estimation of the Evaporation from the Freshwater Lakes (Case Study: Amirkabir Dam, Iran). J. Hydrol. (Amst). 2018, 561, 523–531. [Google Scholar] [CrossRef]
- Bastiaanssen, W.G.M.; Meneti, M.; Feddes, R.A.; Holtslag, a a M. A Remote Sensing Surface Energy Balance Algorithm for Land (SEBAL){{}{{}{}}{{}{$}{}}{{}{}}{}}\backslashbackslashbackslashbackslashbackslash{\{}\backslash{\{}{\}}\backslashbackslash{\{}\backslash{\{}{\}}{\{}\backslash{\}}{\}}\backslashbackslashbackslash{\{. J. Hydrol. 1998, 212–213, 198–212. [Google Scholar]
- Bastiaanssen, W.; Pelgrum, H.; Wang, J.; Ma, Y.; Moreno, J.F. A Remote Sensing Surface Energy Balance Algorithm for Land (SEBAL).: Part 2: Validation. J. Hydrol. (Amst). 1998, 212, 213–229. [Google Scholar] [CrossRef]
- Su, Z. The Surface Energy Balance System (SEBS) for Estimation of Turbulent Heat Fluxes. Hydrol. Earth Syst. Sci. 2002, 6, 85–99. [Google Scholar] [CrossRef]
- Spiliotopoulos, M.; Holden, N.M.; Loukas, A. Mapping Evapotranspiration Coefficients in a Temperate Maritime Climate Using the Metric Model and Landsat TM. Water (Switzerland) 2017, 9. [Google Scholar] [CrossRef]
- Allen, R.G.; Trezza, R.; Kilic, A.; Tasumi, M.; Li, H. Sensitivity of Landsat-Scale Energy Balance to Aerodynamic Variability in Mountains and Complex Terrain. J. Am. Water Resour. Assoc. 2013, 49, 592–604. [Google Scholar] [CrossRef]
- Madugundu, R.; Al-Gaadi, K.A.; Tola, E.K.; Hassaballa, A.A.; Patil, V.C. Performance of the METRIC Model in Estimating Evapotranspiration Fluxes over an Irrigated Field in Saudi Arabia Using Landsat-8 Images. Hydrol. Earth Syst. Sci. 2017, 21, 6135–6151. [Google Scholar] [CrossRef]
- Norman, J.M.; Kustas, W.P.; Humes, K.S. Source Approach for Estimating Soil and Vegetation Energy Fluxes in Observations of Directional Radiometric Surface Temperature. Agric. For. Meteorol. 1995, 77, 263–293. [Google Scholar] [CrossRef]
- Anderson, M.C.; Kustas, W.P.; Norman, J.M.; Diak, G.T.; Hain, C.R.; Gao, F.; Yang, Y.; Knipper, K.R.; Xue, J.; Yang, Y.; et al. A Brief History of the Thermal IR-Based Two-Source Energy Balance (TSEB) Model—Diagnosing Evapotranspiration from Plant to Global Scales. Agric. For. Meteorol. 2024, 350. [Google Scholar] [CrossRef]
- Ghisi, T.; Fischer, M.; Nieto, H.; Kowalska, N.; Jocher, G.; Homolová, L.; Burchard-Levine, V.; Žalud, Z.; Trnka, M. Evaluation of the METRIC and TSEB Remote Sensing Evapotranspiration Models in the Floodplain Area of the Thaya and Morava Rivers. J. Hydrol. Reg. Stud. 2024, 53. [Google Scholar] [CrossRef]
- Spiliotopoulos, M.; Loukas, A. Hybrid Methodology for the Estimation of Crop Coefficients Based on Satellite Imagery and Ground-Based Measurements. Water (Switzerland) 2019, 11. [Google Scholar] [CrossRef]
- Reyes-González, A.; Kjaersgaard, J.; Trooien, T.; Hay, C.; Ahiablame, L. Estimation of Crop Evapotranspiration Using Satellite Remote Sensing-Based Vegetation Index. Advances in Meteorology 2018. [Google Scholar] [CrossRef]
- ASCEE A RTIFICIAL NEURAL N ETWORKS IN HYDROLOGY. By the ASCE Task Committee on Application of Artificial Neural Networks in Hydrology. J. Hydrol. Eng. 2000, 5, 124–137. [CrossRef]
- ASCE Task Committee on Application of Artificial Neural Networks in Hydrology. Task Committee on Application of Artificial Neural Networks in Hydrology, Artificial Neural Networks in Hydrology. II:Hydrologic Application. J. Hydrol. Eng. 2000, 5, 124–136. [Google Scholar] [CrossRef]
- Kumar, M.; Raghuwanshi, N.S.; Singh, R. Artificial Neural Networks Approach in Evapotranspiration Modeling: A Review. Irrig. Sci. 2011, 29, 11–25. [Google Scholar] [CrossRef]
- Guzinski, R.; Nieto, H.; Sandholt, I.; Karamitilios, G. Modelling High-Resolution Actual Evapotranspiration through Sentinel-2 and Sentinel-3 Data Fusion. Remote Sens. (Basel). 2020, 12. [Google Scholar] [CrossRef]
- Ruescas, A.B.; Peters, M. SNAP-S3TBX Collocation Tutorial. 2022. [Google Scholar]
- Guzinski, R.; Nieto, H. Evaluating the Feasibility of Using Sentinel-2 and Sentinel-3 Satellites for High-Resolution Evapotranspiration Estimations. Remote Sens. Environ. 2019, 221, 157–172. [Google Scholar] [CrossRef]
- Drusch, M.; Del Bello, U.; Carlier, S.; Colin, O.; Fernandez, V.; Gascon, F.; Hoersch, B.; Isola, C.; Laberinti, P.; Martimort, P.; et al. Sentinel-2: ESA’s Optical High-Resolution Mission for GMES Operational Services. Remote Sens. Environ. 2012, 120, 25–36. [Google Scholar] [CrossRef]
- Donlon, C.; Berruti, B.; Buongiorno, A.; Ferreira, M.H.; Féménias, P.; Frerick, J.; Goryl, P.; Klein, U.; Laur, H.; Mavrocordatos, C.; et al. The Global Monitoring for Environment and Security (GMES) Sentinel-3 Mission. Remote Sens. Environ. 2012, 120, 37–57. [Google Scholar] [CrossRef]
- Chintala, S.; Harmya, T.S.; Kambhammettu, B.V.N.P.; Moharana, S.; Duvvuri, S. Modelling High-Resolution Evapotranspiration in Fragmented Croplands from the Constellation of Sentinels. Remote Sens. Appl. 2022, 26. [Google Scholar] [CrossRef]
- Gao, F.; Kustas, W.P.; Anderson, M.C. A Data Mining Approach for Sharpening Thermal Satellite Imagery over Land. Remote Sens. (Basel). 2012, 4, 3287–3319. [Google Scholar] [CrossRef]
- De Santis, D.; D’Amato, C.; Bartkowiak, P.; Azimi, S.; Castelli, M.; Rigon, R.; Massari, C. Evaluation of Remotely-Sensed Evapotranspiration Datasets at Different Spatial and Temporal Scales at Forest and Grassland Sites in Italy. In Proceedings of the 2022 IEEE Workshop on Metrology for Agriculture and Forestry, MetroAgriFor 2022—Proceedings, 2022; Institute of Electrical and Electronics Engineers Inc.; pp. 356–361. [Google Scholar]
- Guzinski, R.; Nieto, H.; Ramo Sánchez, R.; Sánchez, J.M.; Jomaa, I.; Zitouna-Chebbi, R.; Roupsard, O.; López-Urrea, R. Improving Field-Scale Crop Actual Evapotranspiration Monitoring with Sentinel-3, Sentinel-2, and Landsat Data Fusion. International Journal of Applied Earth Observation and Geoinformation 2023, 125. [Google Scholar] [CrossRef]
- Guzinski, R.; Nieto, H.; Sanchez, J.M.; Lopez-Urrea, R.; Boujnah, D.M.; Boulet, G. Utility of Copernicus-Based Inputs for Actual Evapotranspiration Modeling in Support of Sustainable Water Use in Agriculture. IEEE J. Sel. Top. Appl. Earth Obs. Remote Sens. 2021, 14, 11466–11484. [Google Scholar] [CrossRef]
- Duzenli, E.; Yucel, I.; Pilatin, H.; Yilmaz, M.T. Evaluating the Performance of a WRF Initial and Physics Ensemble over Eastern Black Sea and Mediterranean Regions in Turkey. Atmos. Res. 2021, 248. [Google Scholar] [CrossRef]
- Solbakken, K.; Birkelund, Y.; Samuelsen, E.M. Evaluation of Surface Wind Using WRF in Complex Terrain: Atmospheric Input Data and Grid Spacing. Environmental Modelling and Software 2021, 145. [Google Scholar] [CrossRef]
- Bian, J.; Hu, X.; Shi, L.; Min, L.; Zhang, Y.; Shen, Y. Evapotranspiration Partitioning by Integrating Eddy Covariance, Micro-Lysimeter and Unmanned Aerial Vehicle Observations: A Case Study in the North China Plain. Agric. Water Manag. 2024, 295, 108735. [Google Scholar] [CrossRef]
- French, A.N.; Hunsaker, D.J.; Sanchez, C.A.; Saber, M.; Gonzalez, J.R.; Anderson, R. Satellite-Based NDVI Crop Coefficients and Evapotranspiration with Eddy Covariance Validation for Multiple Durum Wheat Fields in the US Southwest. Agric. Water Manag. 2020, 239, 106266. [Google Scholar] [CrossRef]
- Kottek, M.; Grieser, J.; Beck, C.; Rudolf, B.; Rubel, F. World Map of the Köppen-Geiger Climate Classification Updated. Meteorologische Zeitschrift 2006, 15, 259–263. [Google Scholar] [CrossRef] [PubMed]
- Martí, P.; González-Altozano, P.; López-Urrea, R.; Mancha, L.A.; Shiri, J. Modeling Reference Evapotranspiration with Calculated Targets. Assessment and Implications. Agric. Water Manag. 2015, 149, 81–90. [Google Scholar] [CrossRef]
- López-Urrea, R.; Martínez-Molina, L.; de la Cruz, F.; Montoro, A.; González-Piqueras, J.; Odi-Lara, M.; Sánchez, J.M. Evapotranspiration and Crop Coefficients of Irrigated Biomass Sorghum for Energy Production. Irrig. Sci. 2016, 34, 287–296. [Google Scholar] [CrossRef]
- López-Urrea, R.; Sánchez, J.M.; de la Cruz, F.; González-Piqueras, J.; Chávez, J.L. Evapotranspiration and Crop Coefficients from Lysimeter Measurements for Sprinkler-Irrigated Canola. Agric. Water Manag. 2020, 239. [Google Scholar] [CrossRef]
- Dercas, N.; Tziatzios, G.A.; Sidiropoulos, P.; Sarchani, S.; Faraslis, I.; Belaud, G.; Daudin, K.; Spiliotopoulos, M.; Sakellariou, S.; Alpanakis, N.; et al. Monitoring Satellite-Based Crop Irrigation Water Requirements for Maize, Cotton and Hay in Distinct Mediterranean Regions. Agric. Water Manag. 2025, 319. [Google Scholar] [CrossRef]
- Sanchez, J.M.; Galve, J.M.; Nieto, H.; Guzinski, R. Assessment of High-Resolution LST Derived from the Synergy of Sentinel-2 and Sentinel-3 in Agricultural Areas. IEEE J. Sel. Top. Appl. Earth Obs. Remote Sens. 2024, 17, 916–928. [Google Scholar] [CrossRef]
Figure 2.
Study Area.
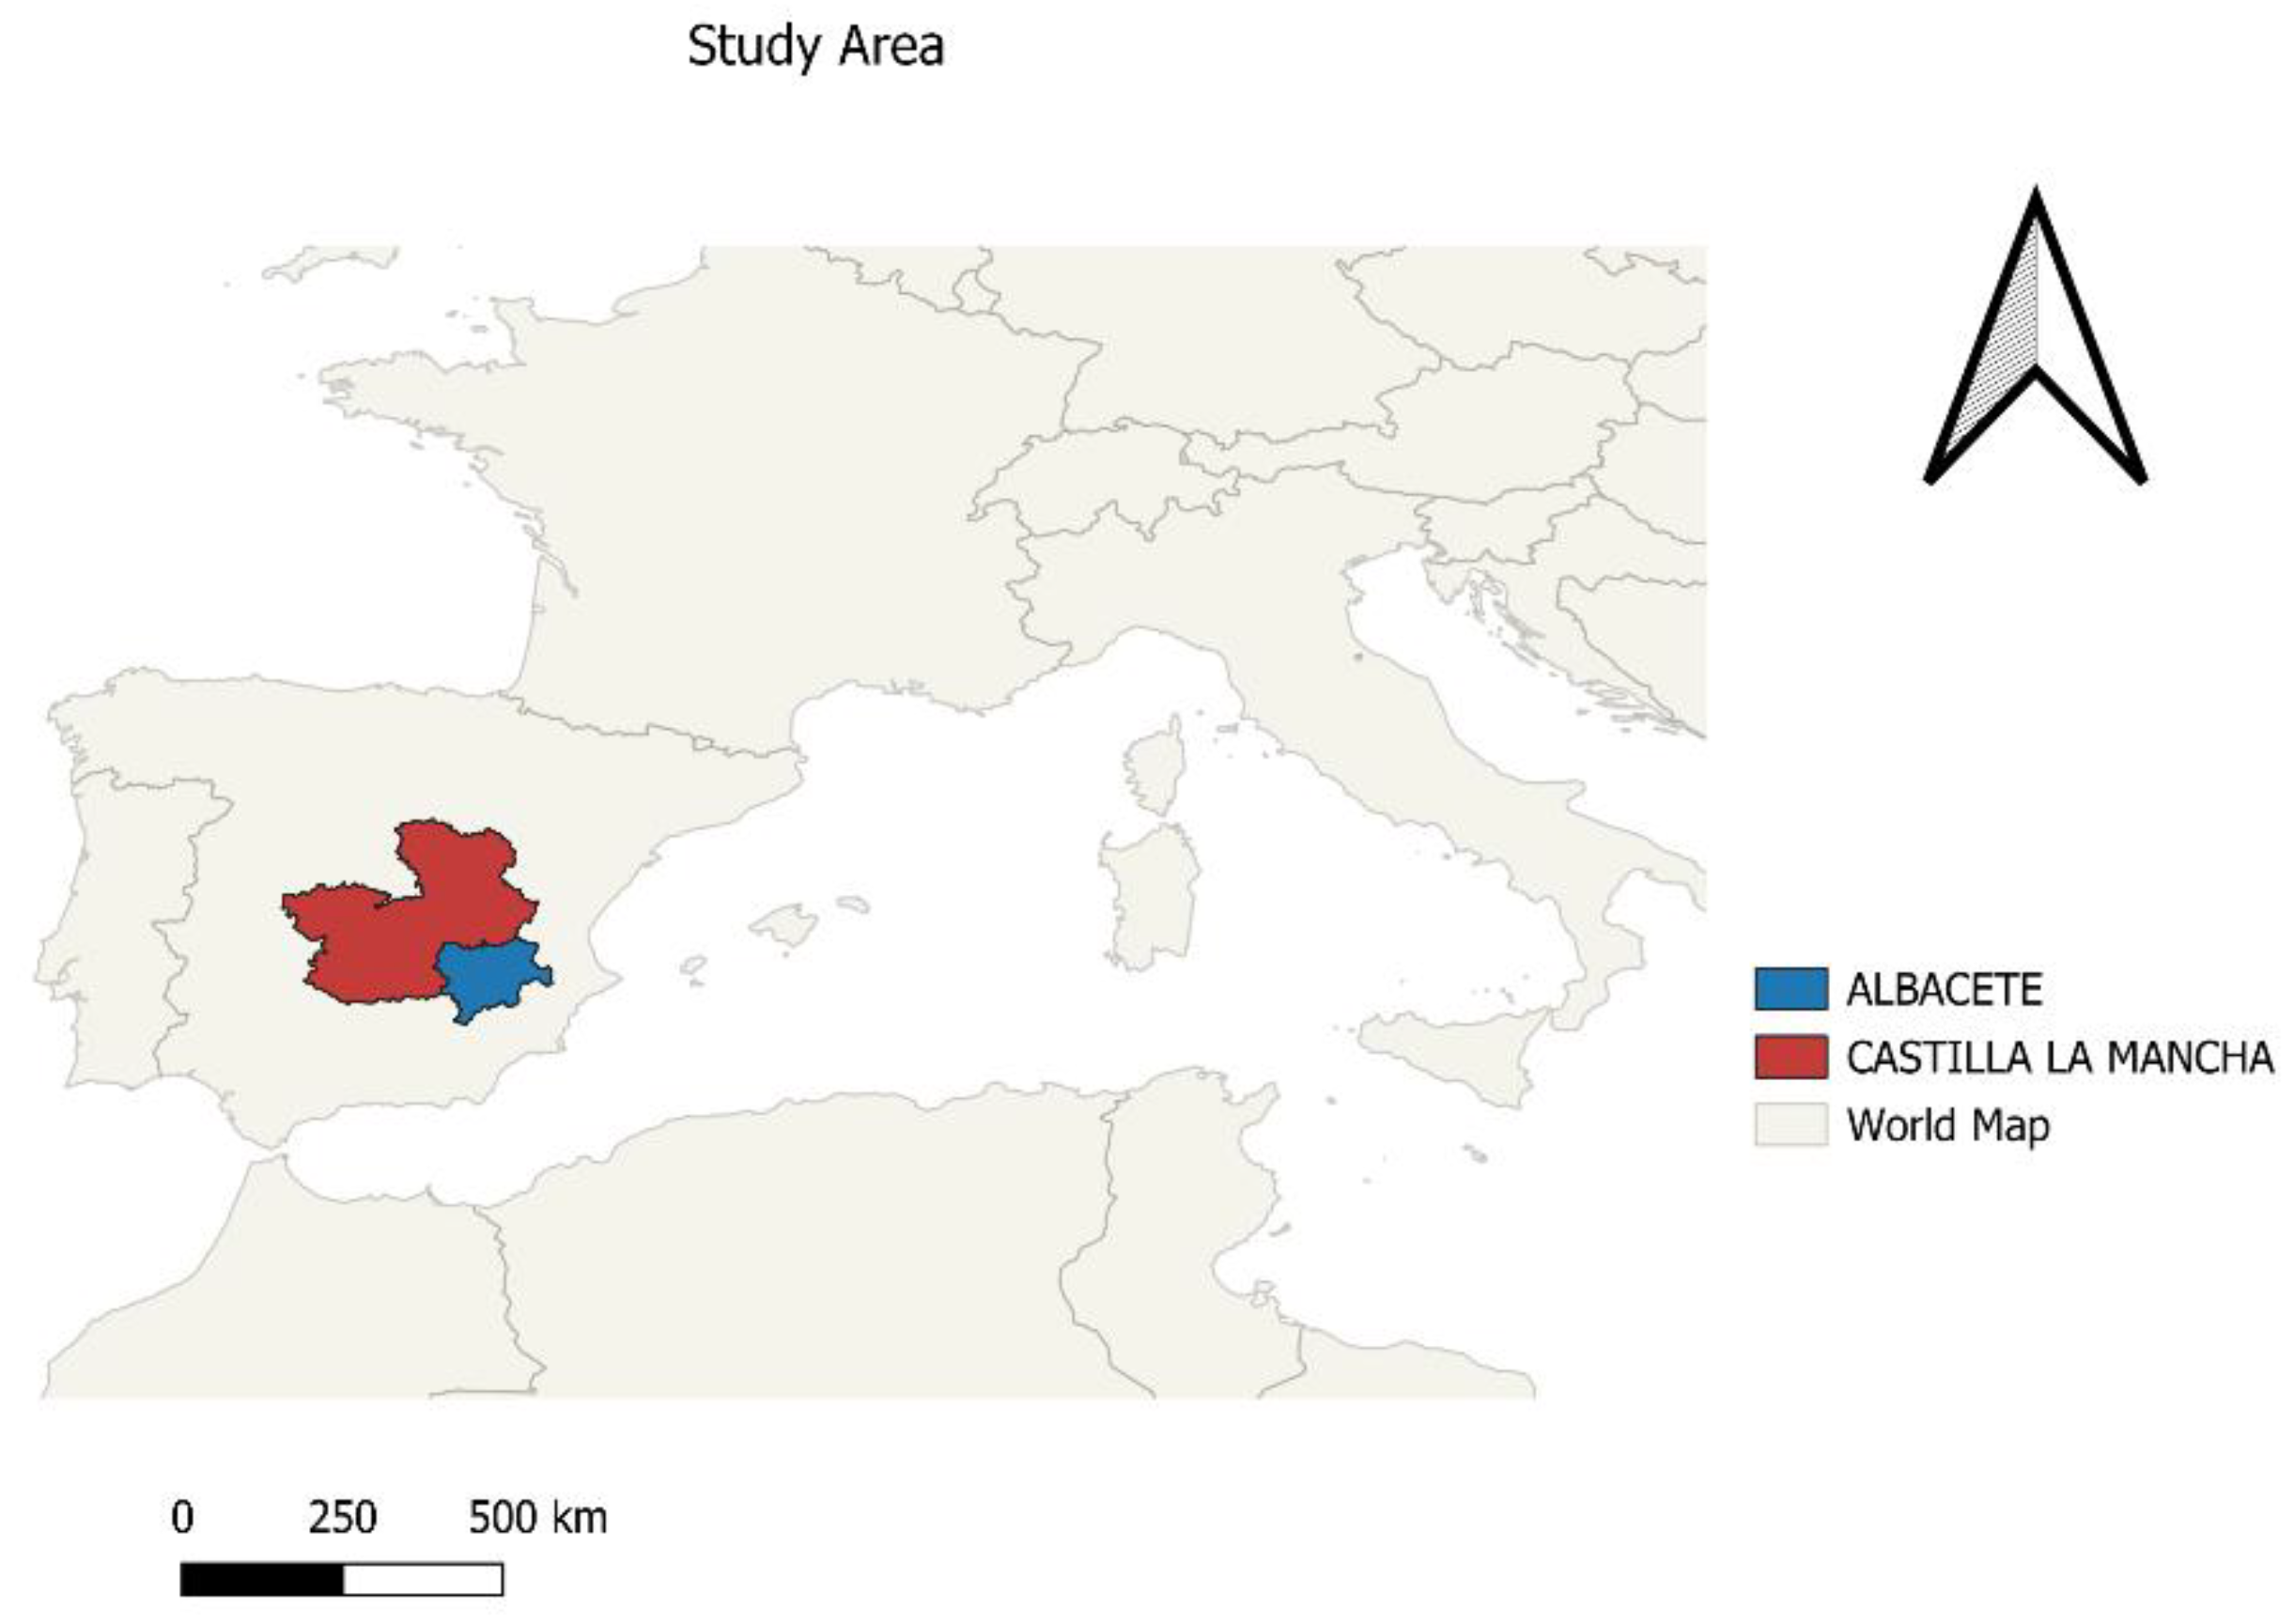
Figure 3.
Lysimeter location.
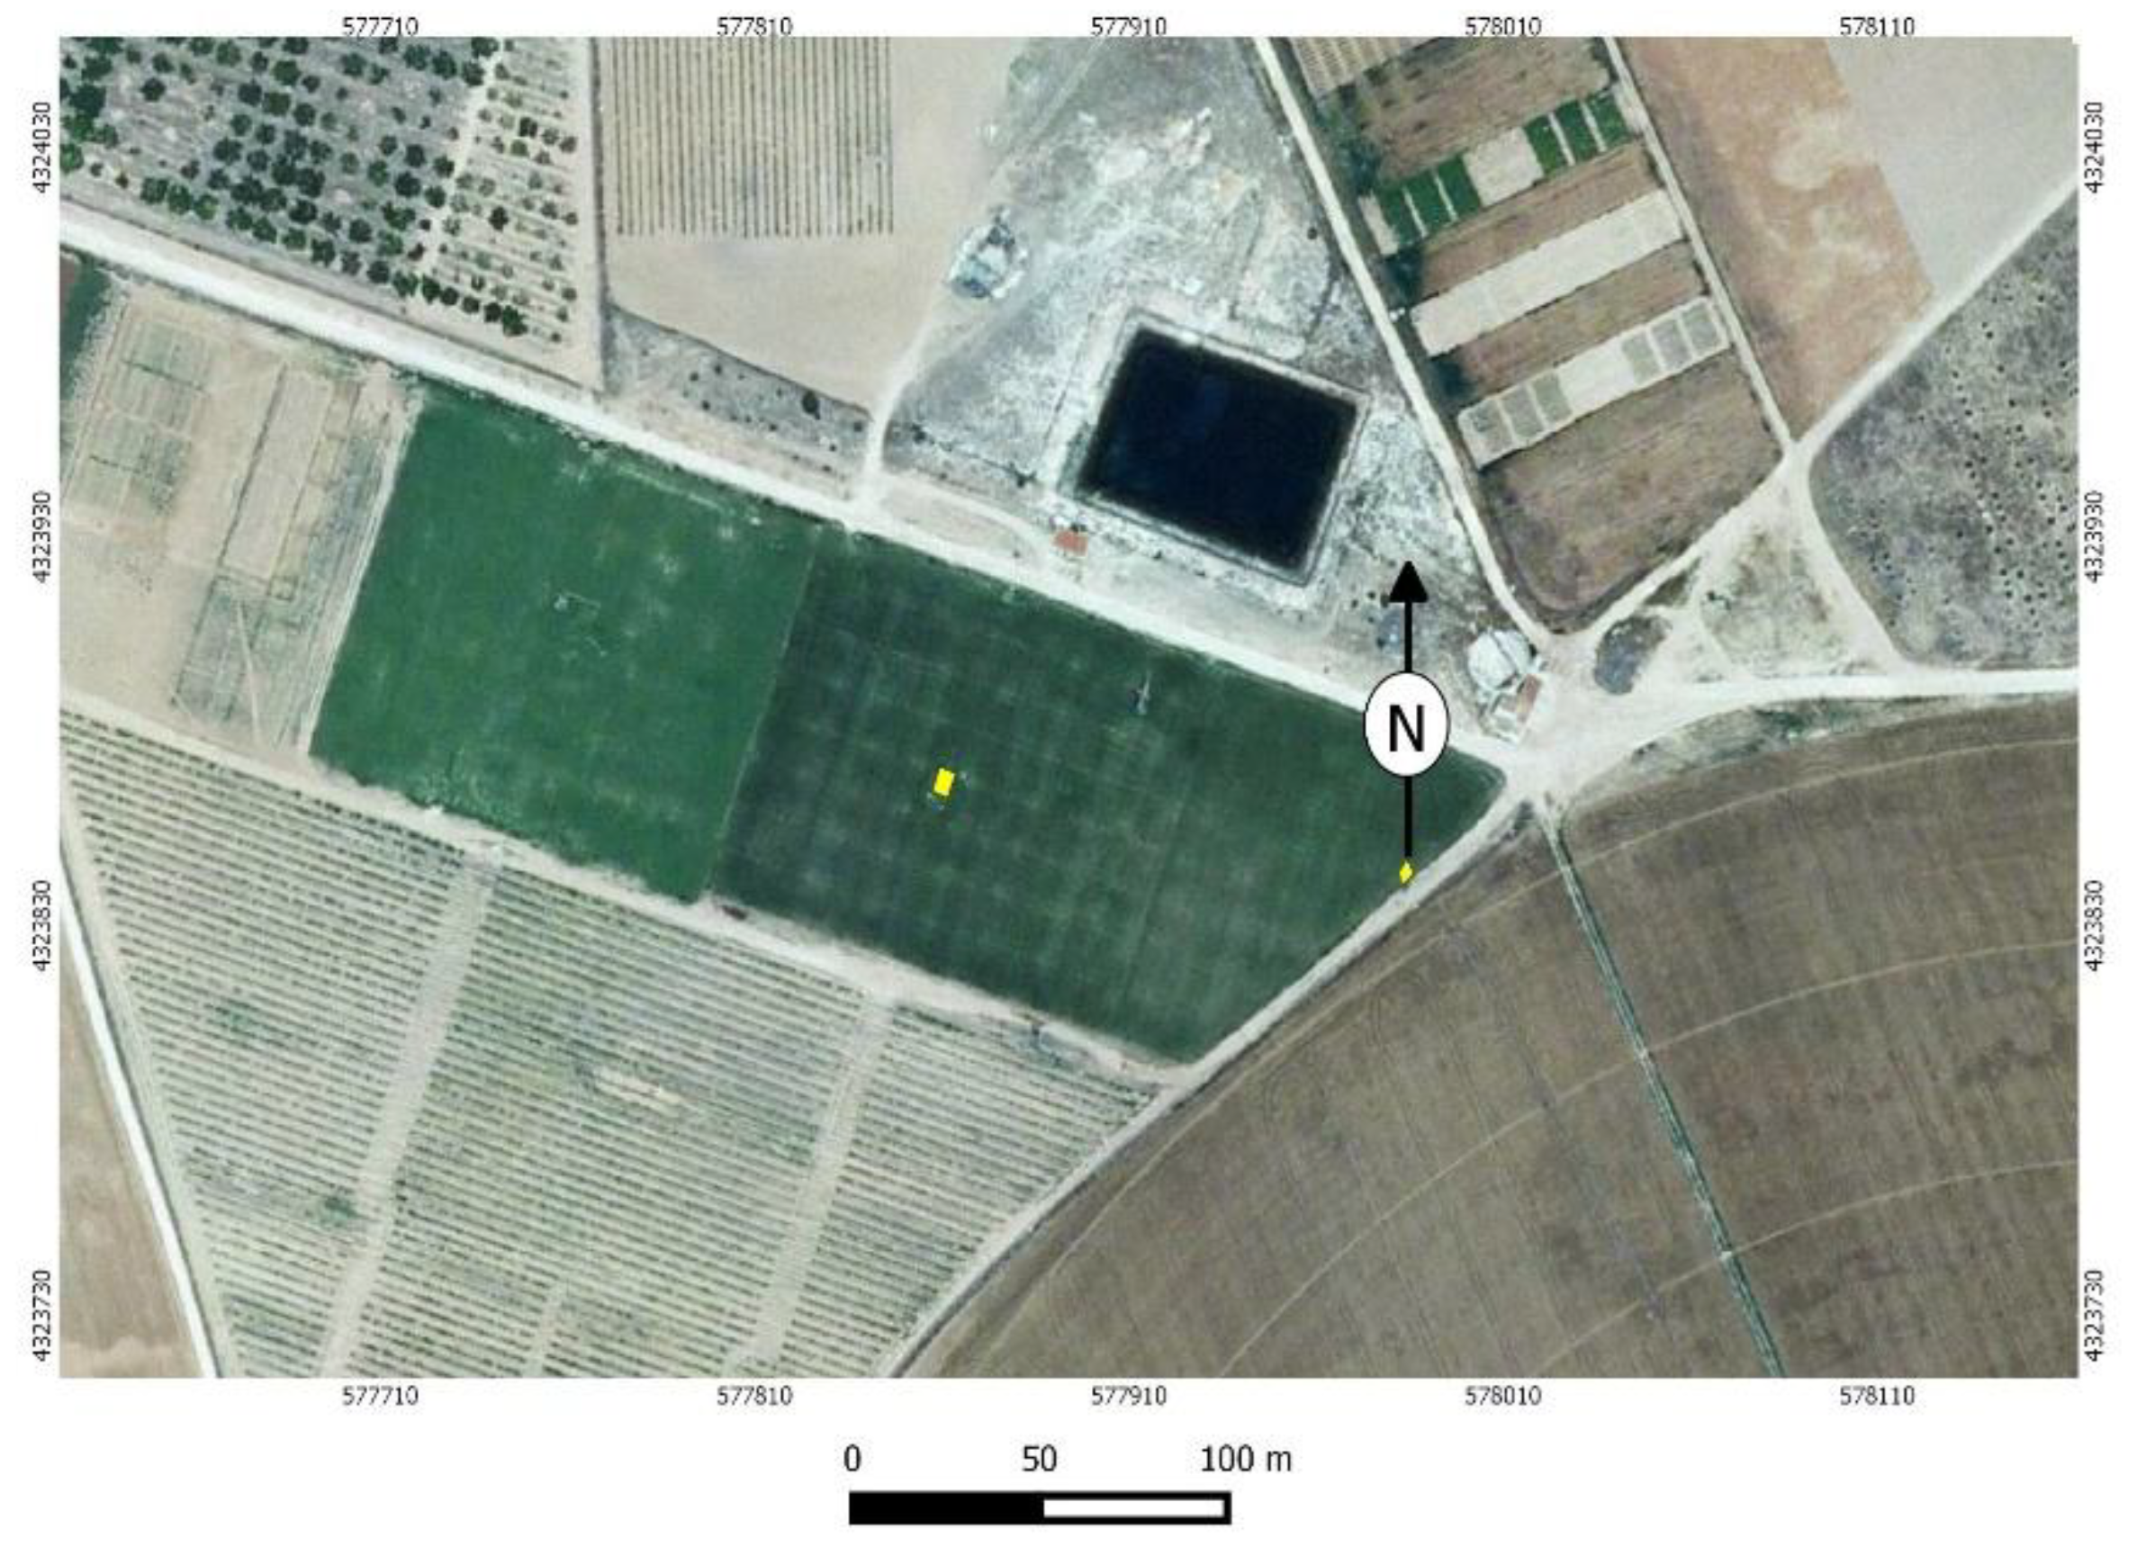
Figure 4.
Initial model (2021).
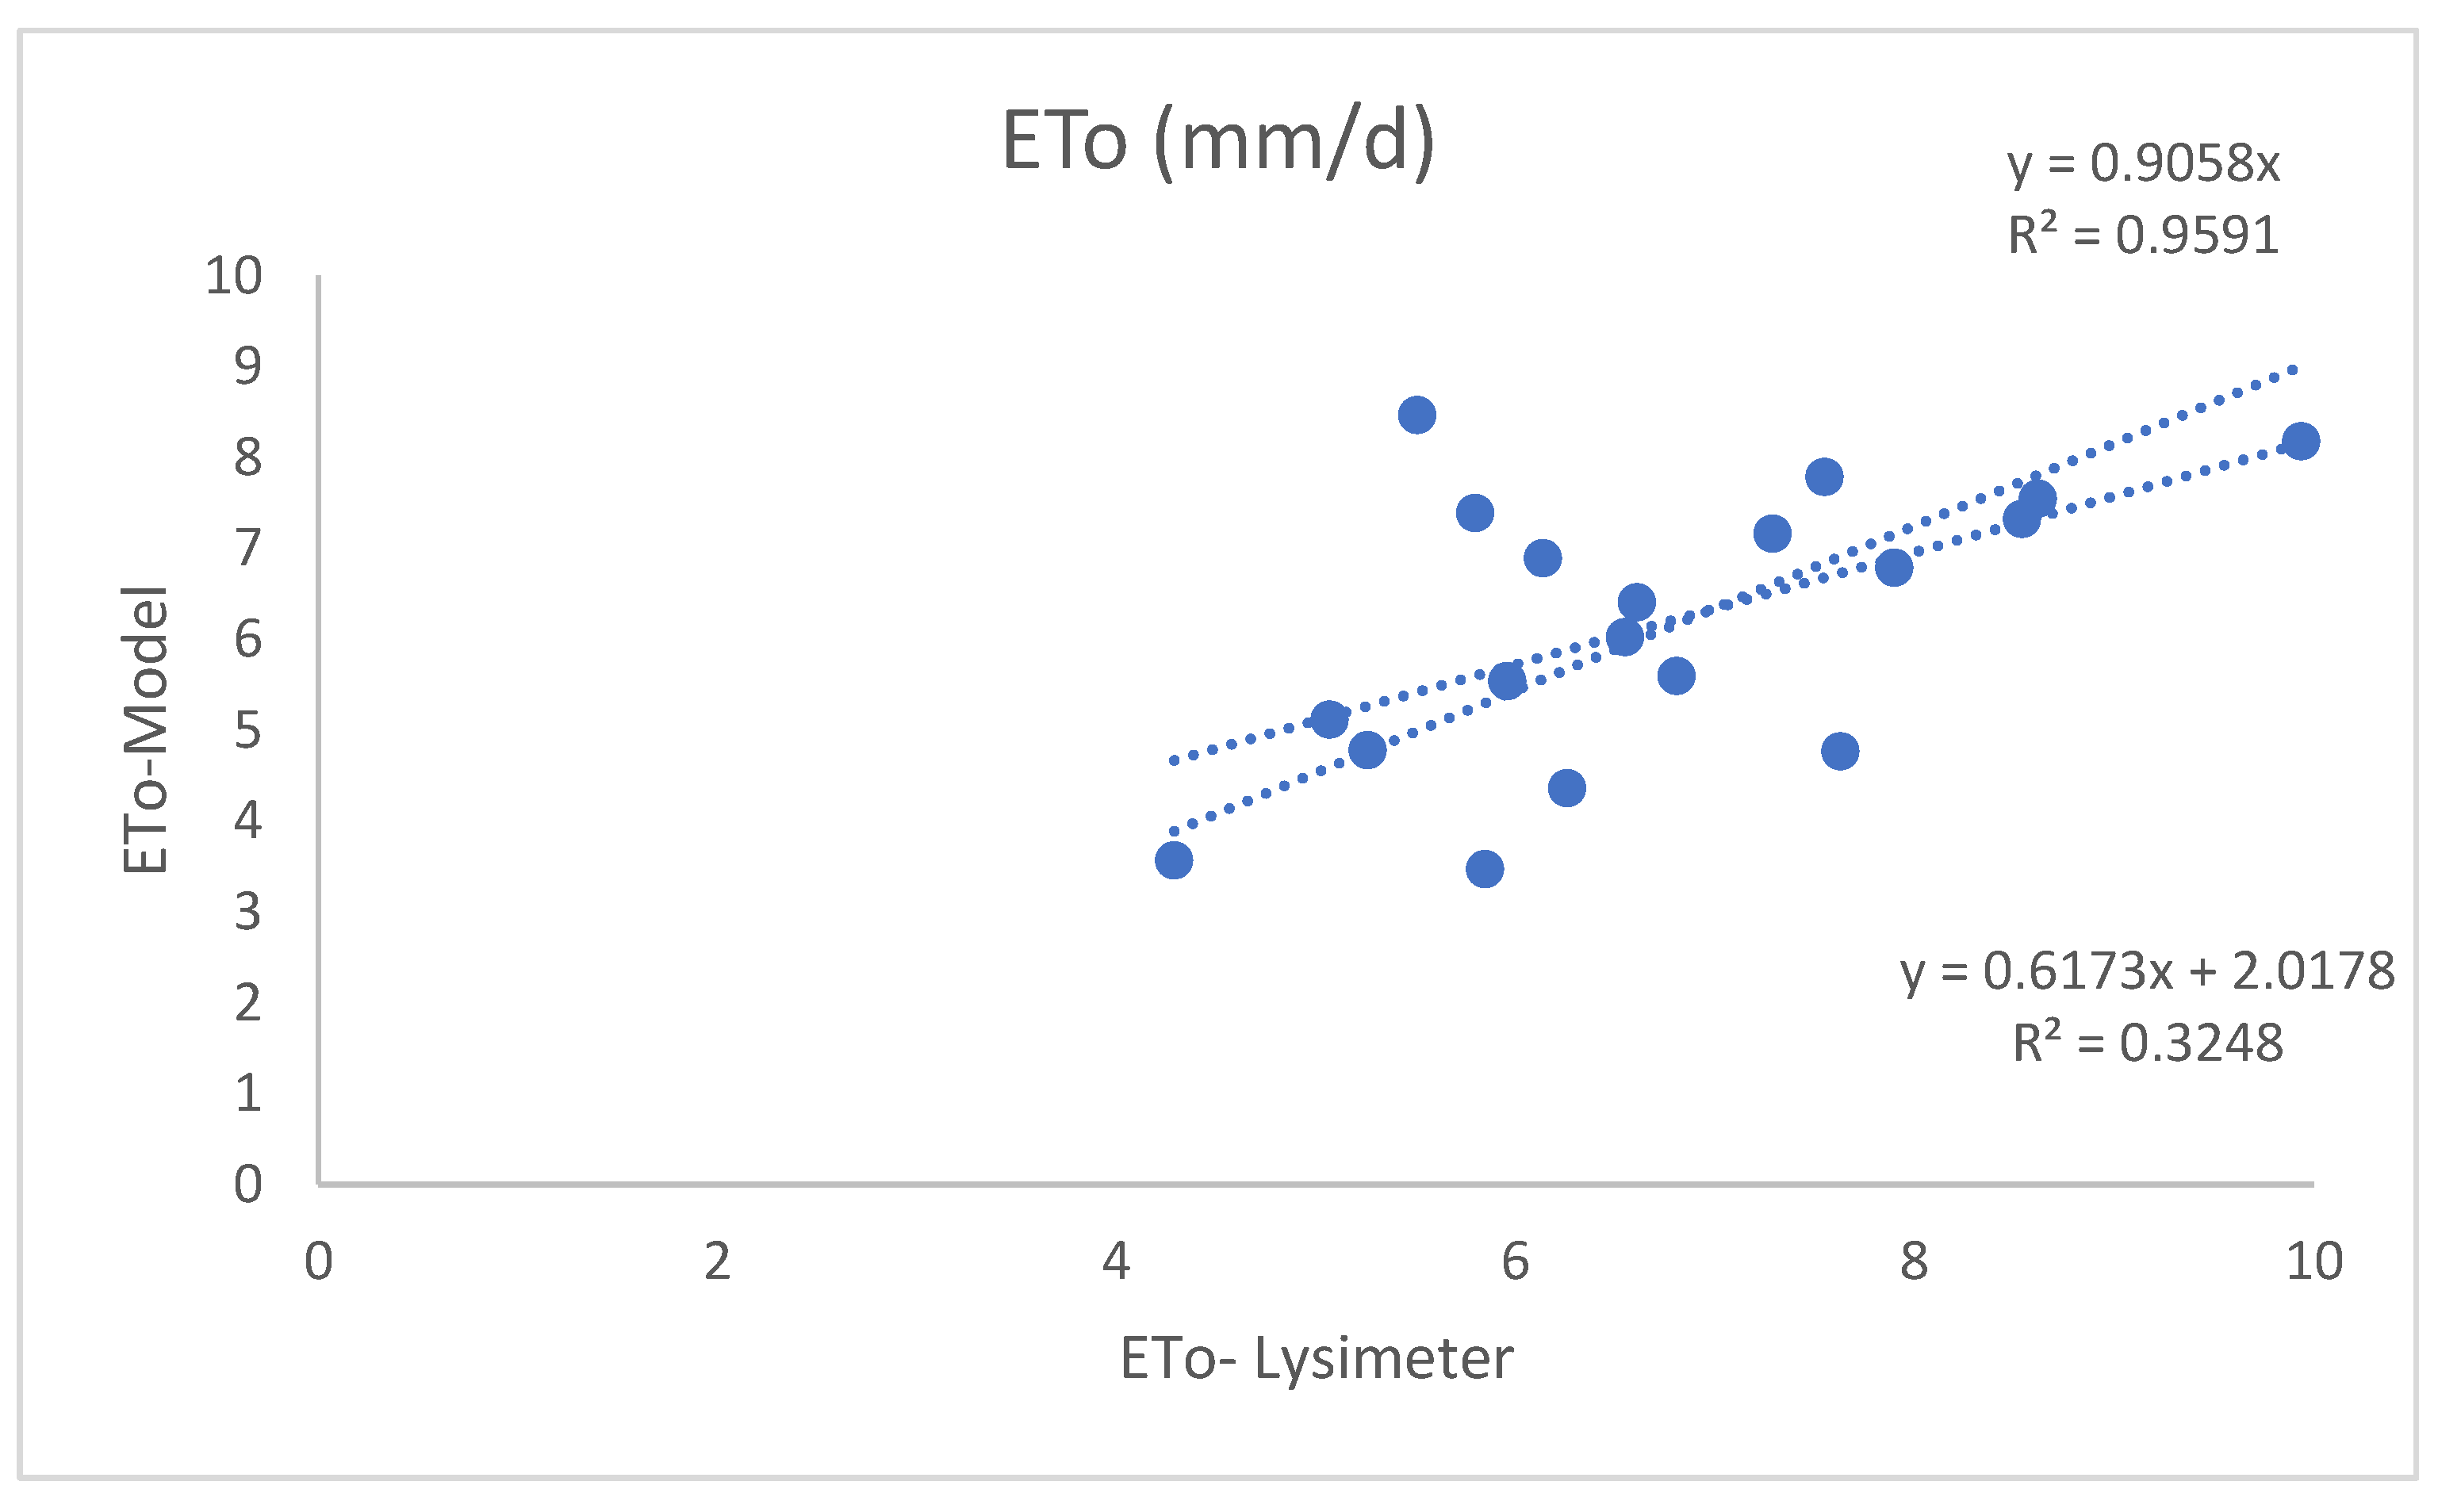
Figure 5.
Validation (2022-23).
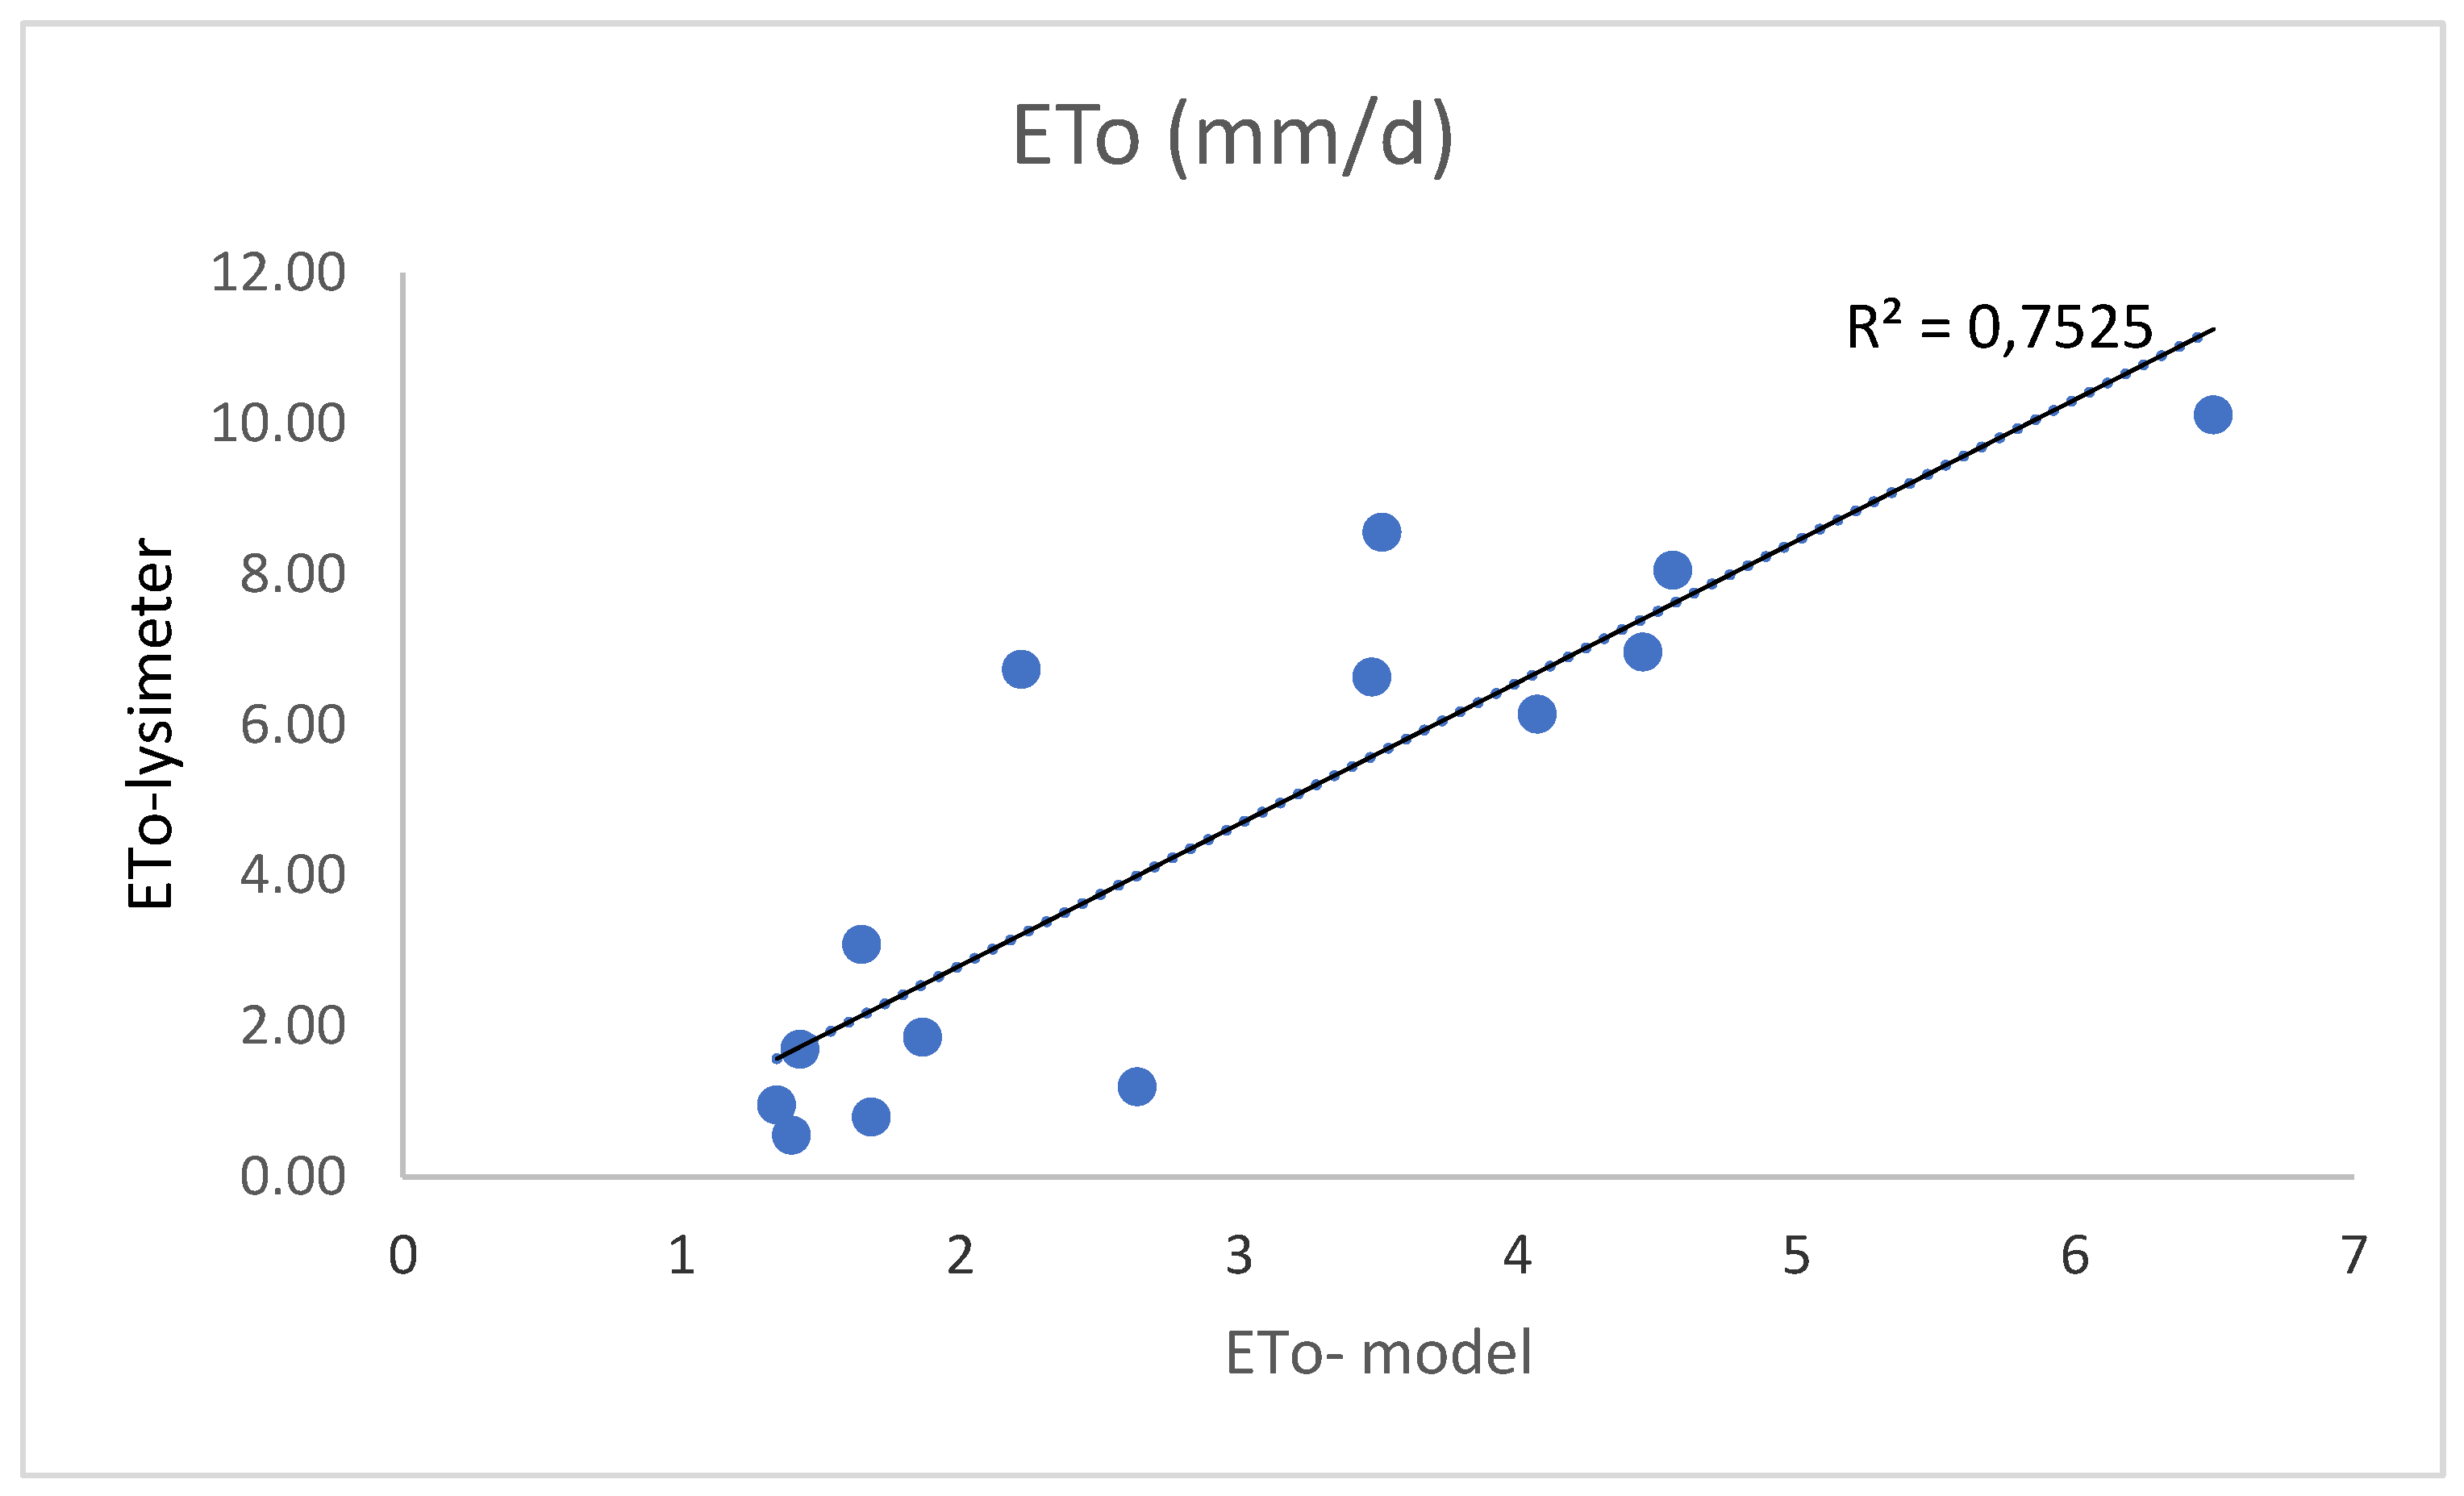
Figure 6.
Validation (2022-23) adding an interception.
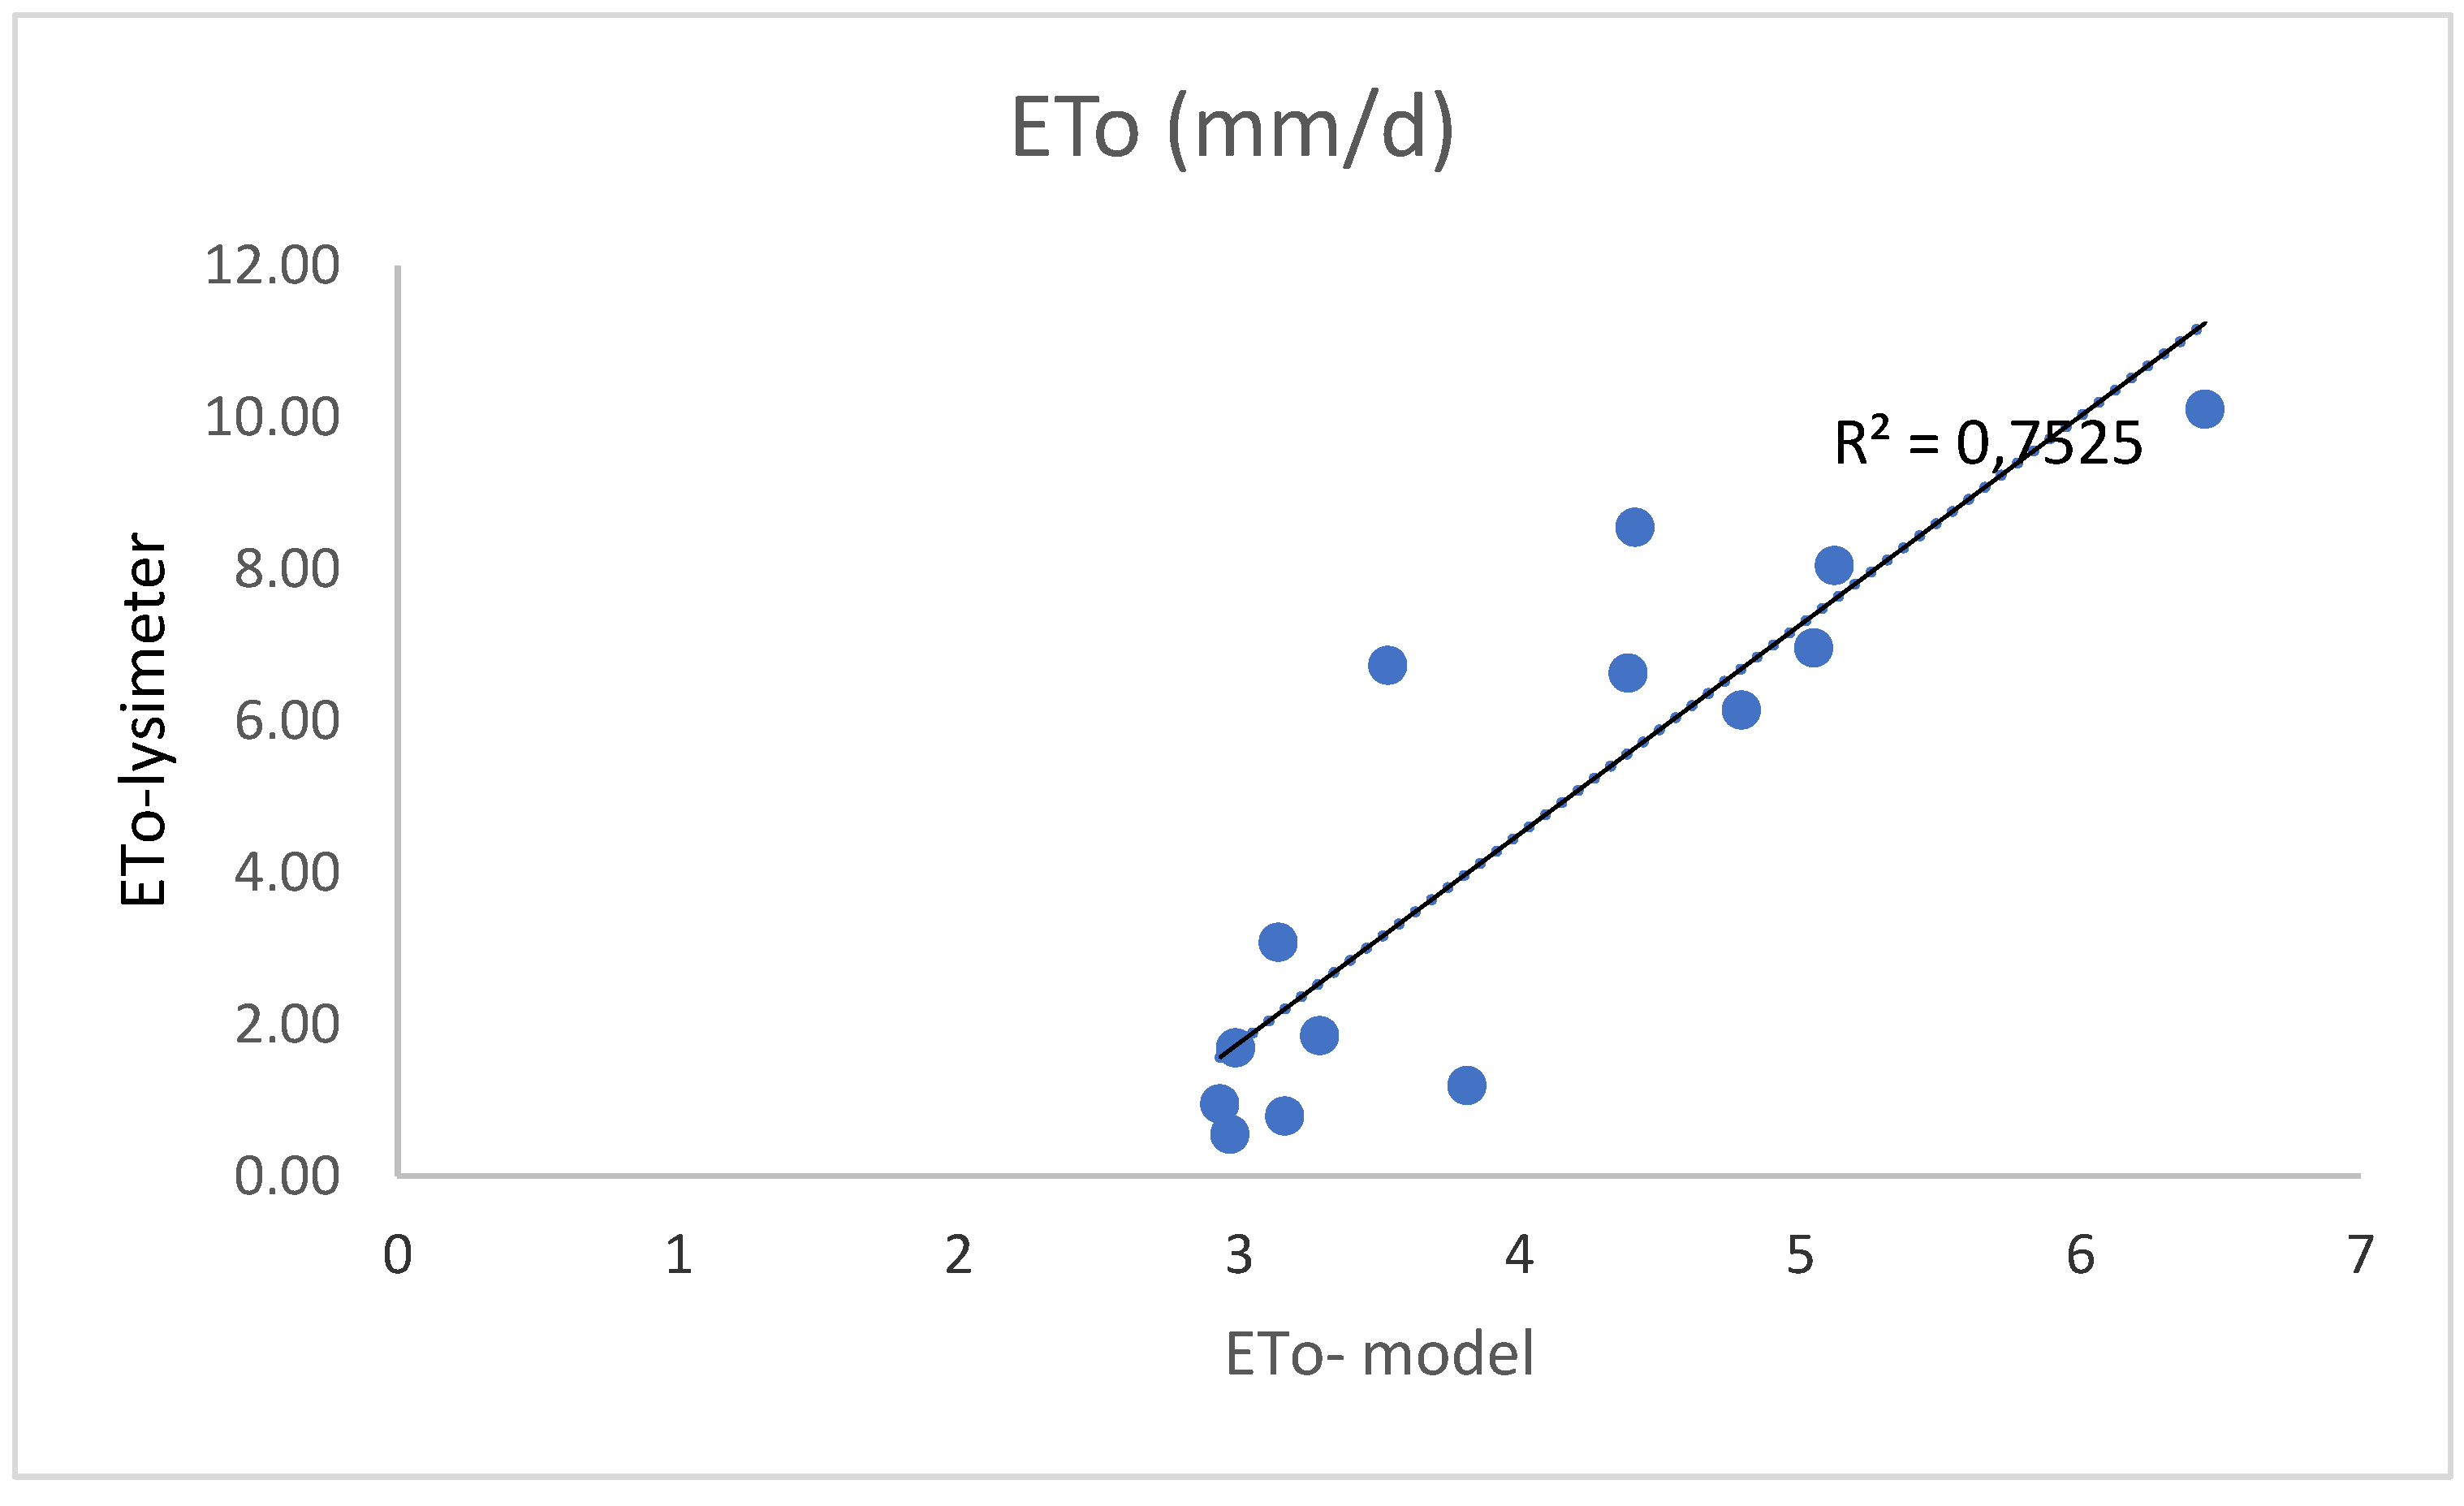

Table 1.
The 13 separate steps for ET computation.
| Steps | Description |
| 1 | Sentinel imagery Acquisition (Sentinel-2–Sentinel-3) |
| 2 | Image pre-processing—Sentinel-3 resampling |
| 3 | Retrieval of Digital Elevation Model (DEM) |
| 4 | Land use/land cover maps generation |
| 5 | Leaf reflection and green vegetation fraction estimation |
| 6 | Aerodynamic roughness assessment |
| 7 | Land Surface Temperature (LST) estimation |
| 8 | WRF meteorological data acquisition |
| 9 | WRF adaptation to the study area |
| 10 | Long-wave irradiance Estimation |
| 11 | Net shortwave radiation estimation using biophysical parameters and meteorological data |
| 12 | Land surface energy fluxes estimation |
| 13 | Final ET values computation |
Table 1.
ET0 values based on the proposed methodology, Lysimeter and Penman-Monteith -for the model.
Table 1.
ET0 values based on the proposed methodology, Lysimeter and Penman-Monteith -for the model.
| Date | Year |
ET0 proposed (mm/d) |
ET0 Lysimeter (mm/d) |
ET0 FAO PM (mm/d) |
| 13-05 | 2021 | 4,78 | 5,26 | 5,00 |
| 18-05 | 2021 | 5,54 | 5,96 | 5,75 |
| 02-06 | 2021 | 6,89 | 6,14 | 5,80 |
| 27-06 | 2021 | 7,39 | 5,80 | 5,61 |
| 02-07 | 2021 | 7,16 | 7,29 | 6,89 |
| 07-07 | 2021 | 7,78 | 7,55 | 7,70 |
| 12-07 | 2021 | 4,76 | 7,63 | 7,23 |
| 17-07 | 2021 | 6,40 | 6,61 | 6,73 |
| 22-07 | 2021 | 8,18 | 9,94 | 9,97 |
| 27-07 | 2021 | 6,02 | 6,55 | 6,82 |
| 01-08 | 2021 | 7,54 | 8,62 | 8,57 |
| 06-08 | 2021 | 3,47 | 5,85 | 6,25 |
| 16-08 | 2021 | 8,46 | 5,51 | 5,41 |
| 21-08 | 2021 | 7,32 | 8,54 | 8,32 |
| 31-08 | 2021 | 6,78 | 7,90 | 7,76 |
| 05-09 | 2021 | 5,59 | 6,81 | 6,94 |
| 20-09 | 2021 | 4,36 | 6,26 | 5,81 |
Table 2.
ET0 values based on the proposed methodology, Lysimeter and Penman-Monteith—for validation.
Table 2.
ET0 values based on the proposed methodology, Lysimeter and Penman-Monteith—for validation.
| Date | Year |
ET0 proposed (mm/d) |
ET0 Lysimeter (mm/d) |
ET0 FAO PM (mm/d) |
| 17-06 | 2022 | 7,17 | 10,11 | 9,39 |
| 07-07 | 2022 | 2,45 | 6,73 | 7,13 |
| 17-17 | 2022 | 5,03 | 8,05 | 8,16 |
| 22-07 | 2022 | 4,71 | 8,28 | 8,28 |
| 29-07 | 2022 | 4,50 | 6,14 | 6,33 |
| 30-09 | 2022 | 1,59 | 3,08 | 3,16 |
| 23-01 | 2023 | 1,48 | 0,95 | 1,37 |
| 28-01 | 2023 | 1,86 | 0,79 | 0,87 |
| 02-02 | 2023 | 1,54 | 0,55 | 0,93 |
| 17-02 | 2023 | 2,06 | 1,85 | 1,87 |
| 22-02 | 2023 | 2,91 | 1,19 | 1,64 |
| 04-03 | 2023 | 1,57 | 1,69 | 1,50 |
| 01-08 | 2023 | 3,88 | 8,55 | 8,14 |
| 03-08 | 2023 | 3,84 | 6,63 | 6,76 |
| 06-08 | 2023 | 4,91 | 6,96 | 6,84 |
Table 3.
Validation of the model: ET0,model-ET0,lysimeter.
| Statistical Indices | R2 | MBE (mm/d) |
RMSE (mm/d)2 |
| 0.75 | -1,61 | 2,64 |
Table 4.
Statistics of the model: ET0,model-ET0,lysimeter (incorporating an interception).
| Statistical Indices | R2 | MBE (mm/d) |
RMSE (mm/d)2 |
| 0.75 | -0,52 | 2,48 |
Disclaimer/Publisher’s Note: The statements, opinions and data contained in all publications are solely those of the individual author(s) and contributor(s) and not of MDPI and/or the editor(s). MDPI and/or the editor(s) disclaim responsibility for any injury to people or property resulting from any ideas, methods, instructions or products referred to in the content. |
© 2026 by the authors. Licensee MDPI, Basel, Switzerland. This article is an open access article distributed under the terms and conditions of the Creative Commons Attribution (CC BY) license (http://creativecommons.org/licenses/by/4.0/).
Copyright: This open access article is published under a Creative Commons CC BY 4.0 license, which permit the free download, distribution, and reuse, provided that the author and preprint are cited in any reuse.


