Submitted:
14 January 2026
Posted:
16 January 2026
You are already at the latest version
Abstract
This article presents a scalable IoT-based architecture for continuous and passive monitoring of patient behavior in home environments, designed as a technical founda-tion for future dementia risk assessment systems. The architecture integrates: (1) wearable BLE sensors with infrared room-level localization capability; (2) edge-computing gateways with local preprocessing and machine learning capability; (3) a three-channel data stream optimizing latency, bandwidth, and information com-pleteness; and (4) a federated learning framework enabling model development with-out data sharing between multiple institutions. Technical validation in two apartments (3 participants, 7 days) demonstrated: 97.6% room-level localization accuracy using infrared beacons; 41.2% network bandwidth reduction through intelligent compres-sion; less than 7 seconds end-to-end latency for 99.5% of critical events; and 98.5% deduplication accuracy in multi-gateway configurations. A proof-of-concept federated learning simulation confirms architectural feasibility of collaborative model training while preserving privacy, achieving convergence in five rounds with 1.4 MB commu-nication per institution. Cost analysis shows ~€490 for initial implementation and ~€55 monthly operation, representing 5-10 times lower costs than existing research systems (ORCATECH, SENDA). The development ensures the technical and economic feasibil-ity of continuous home monitoring for behavioral analysis. Clinical validation of di-agnostic capabilities through longitudinal studies with validated cognitive assess-ments remains a task for future work.
Keywords:
edge computing
; privacy-preserving architecture
; ambient assisted living
; wearable sensors
; Internet of Things
; federated learning
; infrared localization
; behavioral monitoring
1. Introduction
Dementia is a progressive neurological syndrome characterized by cognitive decline, memory loss, spatial disorientation, and behavioral changes that seriously impair quality of life. The World Health Organization [1] projects 152 million people with dementia by 2050. Alzheimer’s disease accounts for 60–70% of cases, followed by vascular dementia (15–20%), Lewy body dementia (10–15%), and frontotemporal dementia (5–10%) [2].
Disease progression advances from mild cognitive impairment (MCI) through mild, moderate, and severe dementia. Critically, MCI represents a transitional phase with maximum therapeutic efficacy before irreversible neurodegeneration occurs. Recent studies demonstrate that tau protein fibrillation—a characteristic pathological process in Alzheimer’s disease—proceeds through mandatory intermediate clustering stages that are potentially reversible through targeted intervention [3]. This discovery establishes clear neurobiological rationale for early detection: a therapeutic window exists before irreversible fibrils form, but only if cognitive decline is identified during the preclinical phase.
Current diagnostic approaches face limitations hindering effective early detection at the population level. Traditional neuropsychological assessments such as Mini-Mental State Examination (MMSE) and Montreal Cognitive Assessment (MoCA) rely on episodic clinical testing with subjectivity and sensitivity to educational and cultural factors [4]. Although biomarker-based methods—including amyloid positron emission tomography (PET), cerebrospinal fluid (CSF) analysis, and structural magnetic resonance imaging (MRI)—provide objective measurements, their invasiveness, prohibitive cost, and limited availability preclude mass screening [5]. In most cases, dementia is diagnosed only after significant irreversible neurodegeneration has occurred, when therapeutic interventions demonstrate limited efficacy [6].
Research shows that behavioral and physiological changes occur months to years before clinical symptoms become apparent. Minor changes in gait patterns, reduced physical activity, deficits in spatial navigation, and circadian rhythm disturbances are measurable digital biomarkers of early cognitive decline [7]. Wearable sensor technologies enable continuous, objective, and unobtrusive detection of these behavioral patterns in natural home environments.
Despite significant technological advances, several critical factors hinder translation of sensor-based monitoring into clinical practice. Existing systems operate in controlled laboratory environments rather than real home settings, limiting validity and scalability [8]. Most approaches require active patient participation through periodic cognitive testing or device interaction, creating adherence challenges [9]. Spatial localization methods based on Wi-Fi or Bluetooth Low Energy (BLE) triangulation achieve only zone-level accuracy (typically 3–5 meters), insufficient for detecting room-specific disorientation patterns. Continuous sensor data transmission generates significant network traffic and cloud storage costs, hindering economic viability of large-scale deployment. Regulatory restrictions under General Data Protection Regulation (GDPR) prohibit centralized aggregation of personal health data across institutions, hindering collaborative model development from diverse populations.
Modern architectural solutions in edge computing and federated learning offer potential solutions to these challenges. Edge computing enables local data preprocessing and machine learning on resource-limited devices, reducing latency, bandwidth requirements, and privacy risks [10]. Federated learning frameworks enable collaborative model training across multiple institutions without sharing raw data, enabling GDPR-compliant multi-center research [11,12]. However, these technologies are not integrated into a comprehensive architecture specifically designed for long-term home behavioral monitoring.
This article presents the design and technical validation of scalable Internet of Things (IoT) architecture for continuous, passive behavioral monitoring in home environments. The architecture integrates wearable sensors, room-level infrared localization, dual peripheral gateways with local preprocessing, intelligent multi-threaded data compression, and a federated learning framework. Development focuses exclusively on architectural design and validation of technical feasibility. Clinical validation of diagnostic or prognostic capabilities requires longitudinal studies with validated cognitive assessments and remains future work beyond this article’s scope.
The main objective is to design and technically validate a cost-effective architecture for continuous home monitoring that preserves privacy and serves as foundation for future dementia risk assessment systems. Specific technical objectives include:
- Designing sensor infrastructure providing room-level localization accuracy above 95% using infrared technology.
- Developing a three-stream data architecture with end-to-end latency below 10 seconds for critical events, bandwidth efficiency (over 70% reduction), and maintaining full time resolution (1-second granularity).
- Implementing edge computing with local machine learning on specialized hardware for real-time anomaly detection without cloud dependency.
- Analyzing architectural feasibility of federated learning for joint model development across multiple institutions.
- Validating technical performance through real-world residential deployment and analyzing economic viability through cost modeling.
Technical validation involves three volunteers continuously monitored for seven days in two residential apartments. This is a technology assessment study, not a clinical trial.
The remainder of the paper is organized as follows. Section 2 reviews related work in sensor-based health monitoring, localization technologies, edge computing architectures, and federated learning. Section 3 presents the system architecture, including hardware components, software, and the three-way data channel. Section 4 describes federated learning design. Section 5 describes technical validation, experimental setup, and results. Section 6 discusses architectural advantages, current limitations, and the path to future clinical implementation. Section 7 concludes with contributions and directions for future research.
2. Related Work
2.1. Clinical Context and Sensor-Based Approaches
Sensor monitoring for early diagnosis of dementia has been widely documented. Addae et al. [13] analyze IoT systems, wearable sensors, and ML approaches, with the most effective ML models achieving 96% accuracy but with serious limitations: small samples (average 30-37 participants), generalization problems, and ethical challenges. Thaliath and Pillai [14] demonstrate that non-cognitive sleep disturbances, circadian rhythm disturbances, and motor changes—contribute significantly to quality-of-life deterioration in Alzheimer’s disease, with behavioral and psychological symptoms affecting up to 90% of dementia patients.
Ghayvat and Gope [15] evaluated the SAMEDR system in 12 dementia patient homes and 20 healthy adult homes over 43 weeks with heterogeneous sensor networks, achieving specificity 0.93, F1-score = 0.93, and Matthews correlation coefficient = 0.88. Dementia patients showed significantly great variability in daily activity patterns (especially sleep, agitation, cooking, and hygiene). Deters et al. [16] highlight methodological fragmentation in agitation prediction systems, with personalized models using multimodal sensor networks achieving AUC 0.90 for motor agitation and 87-91% accuracy for verbal agitation.
These findings underscore the need for stable, validated architecture rather than isolated proof-of-concept systems.
2.2. Sensor Modalities and Architectures
Anikwe et al. [17] systematically reviewed eighty-five studies (2014-2021) demonstrating that heterogeneous sensor systems are most effective combinations of ECG, PPG, accelerometers, SpO₂, and temperature sensors achieve over 99% accuracy in activity recognition and 91-99.9% accuracy in detecting cardiac abnormalities based on ECG. Challenges remain high energy consumption, privacy and security issues, and limited model interpretability.
Gabrielli et al. [18] developed the Pulse AI system, combining wearable and ambient sensors for personalized real-time health anomaly detection. Using a finely tuned UniTS model, they achieve mean F1 = 0.821 ± 0.049—approximately 22% improvement over the second-best method. In real-world application with 6 adult patients over 3 months, 93.75% of 32 detected anomalies were confirmed as clinically significant.
Assaad et al. [19] present the first multimodal biosensor device integrating 14 sensors for simultaneous real-time monitoring of eighteen health parameters. Through sensor fusion with ESP32 microcontrollers and edge computing (Jetson Xavier NX), they achieve over 90% accuracy for some parameters and over 85% for all, with total power consumption ~3.8 W. Teoh et al. [20] analyze 69 studies demonstrating multimodal models outperform unimodal approaches—in Alzheimer’s detection, accuracy and AUC exceed 90% when combining imaging and clinical data.
Johnson [21] demonstrated that approaches using only environmental sensors achieve 89% sensitivity for fall detection without wearable devices. The system identifies falls by analyzing body height changes within 10 frames (~0.5 s), achieving 91% sensitivity for forward/backward falls, 92% for side falls, and 75% for collapse falls. Bijlani et al. [22] propose Graph Barlow Twins for detecting adverse events in dementia care, achieving 81% recall and 88% generalizability across three independent cohorts with low computational costs.
2.3. Indoor Localization Technologies
Obeidat et al. [23] present a comprehensive comparison of spatial localization technologies critical for detecting disorientation in early dementia. Ultra-Wideband (UWB) achieves highest accuracy of 0.01-0.2 m. Visible Light Communication (VLC) provides similar accuracy ~0.1 m but requires line of sight. Ultrasonic systems achieve 0.01-1 m but are sensitive to reflected signals. Wi-Fi RSS fingerprinting reaches 1-5 m, while Bluetooth/BLE solutions reach 2-5 m.
Leitch et al. [24] provide critical comparison of localization technologies: UWB systems achieve 0.03-0.30 m accuracy, often below 10 cm. Wi-Fi accuracy varies significantly—~2.4 m for RSS-based analysis, 0.17–7.6 m for RSS fingerprinting, up to 0.09 m for CSI fingerprinting (requires expensive calibration), and 0.5–2.1 m for Wi-Fi RTT (IEEE 802.11 FTM, sensitive to NLoS). BLE methods show 0.6-4.9 m for RSS, 0.1-3.7 m for RSS fingerprinting, with newer BLE AoA techniques promising 0.7 m. Machine learning reduces errors by 30-95% across all technologies: Wi-Fi CSI from 4.8 m to 2.39 m, BLE RSS from 16.6 m to 5.5 m.
Casha [25] confirms these conclusions in a comprehensive review. Hybrid systems combining UWB, Wi-Fi/BLE, and IMU achieve the best balance between accuracy, reliability, and cost, which is particularly important for applications requiring sub-1 m accuracy with low latency.
Room-Level Localization
Biehl et al. [26] demonstrate that Wi-Fi RTT significantly outperforms BLE RSSI for room-level localization: with 11 RTT beacons, they achieve RMSE = 1.275 m and room-level accuracy Precision 97.99%, F1 = 93.86%. With 22 BLE beacons, results are weaker (F1 = 89.17%, RMSE ≈ 1.53 m). At equal beacon density (11), RTT outperforms BLE by 11.59%. García-Paterna et al. [27] evaluate BLE room-level localization with kNN classification (k=5) in two real scenarios. In residential environment (10 rooms, 160 m², 6 beacons), they achieve 97.6% accuracy (laptop) and 87.7% (Raspberry Pi) with all beacons; even with 3 beacons, accuracy remains 85-88% (laptop) and 74-76% (Raspberry Pi). In university environment (16 zones, 970 m², up to 10 beacons), they achieve 92-93% accuracy (laptop) and 88% (Raspberry Pi). Errors concentrate between adjacent rooms.
Chen et al. [28] propose solar-powered BLE tags. Using the Dempster-Shafer + fingerprinting (DSFP) algorithm, they achieve over 99% localization accuracy in a real-world environment (7 rooms, ~2000 m²) – one anchor and 10 tags per room. The analysis shows that DSFP corrects errors in "unclear" border areas where DS alone fails.
Karabey Aksakalli and Bayındır [29] introduce contextual feature—room-to-room transition time—integrated with Wi-Fi fingerprinting for room-level prediction. Testing in three residential environments (130–195 m², ~3000 samples each) shows that increasing transition time leads to statistically significant improvements: with Wide Neural Network, accuracy increases from ~82% to 94.7%, and with Ensemble Bagged Trees reaches 93.1%, with +10-12% improvements in most favorable scenario. Transition time is a strong feature significantly improving room-level accuracy, especially for models capturing nonlinear spatiotemporal dependencies.
Tegou et al. [30] present a low-cost BLE system for medical applications with extremely easy installation requiring no floor plans or technical skills. In residential environment (80.4 m², five rooms) with 5 BLE beacons, they achieve 93.75% room identification accuracy (12 errors between adjacent rooms). Increasing beacons from 5 to 8 improves accuracy to 95.31% (9 errors). Despite NLOS conditions, human body attenuation, and Wi-Fi/Bluetooth interference, the system maintains over 93% accuracy.
Localization using infrared light remains understudied in the latest health monitoring literature, despite its potential for perfect room differentiation due to the inability of infrared signals to penetrate walls and doors.
2.4. Edge Computing for Health Monitoring
Alzu’Bi et al. [31] provide comprehensive review of 1609 publications (2015-2022) showing that edge computing achieves significantly lower latency (milliseconds versus seconds/minutes in cloud computing) and meets critical requirements for latency, throughput, and privacy for real-time health monitoring. Edge computing introduces new risks related to limited device resources and physical attacks.
Islam et al. [32] quantify latency in hybrid fog-edge architecture for IoMT systems. Experiments with 250,000 IoMT records (2020-2023) show up to 70% latency reduction (20-50 ms hybrid vs. ~100 ms cloud-only), 30% lower power consumption (~50 mW vs. 100 mW cloud), 60% traffic savings (2 MB/s vs. 10 MB/s to cloud), and 84% faster threat detection with mean time ~30 ms vs. ~100 ms for cloud models.
Rancea et al. [33] conducted systematic review of 72 publications (2020-2024), classifying applications into privacy and security (39%), AI-based optimization (35%), and edge offloading and load balancing (26%). Edge computing significantly reduces latency and network load while improving security through local processing—some solutions demonstrate response times under 2 seconds (e.g., fall detection) and up to 99% accuracy for AI-based diagnostics. Critical challenges remain: device heterogeneity, resource constraints, lack of standards, and need for effective coordination.
Although edge computing calculations demonstrate clear advantages for latency-sensitive applications, most health monitoring systems still transmit raw sensor data to the cloud, missing opportunities for intelligent compression and local inference. The integration of lightweight ML models on edge computing for real-time anomaly detection remains under-explored in the context of dementia monitoring.
2.5. Federated Learning for Privacy-Preserving Healthcare
Federated learning (FL) is emerging as a promising technique for collaborative model training without centralized processing of sensitive health data. Ali et al. [34] systematically review 100 publications (2020-2024) showing rapid growth from 722 publications (2020) to 5975 (2023). FL use in healthcare systems remains low (~2% vs. 47% for computer science). Quantitative results show 94.36% accuracy for Independent and Identically Distributed (IID) data and 78.4% for non-IID data in cervical cancer diagnosis. AUROC ranges 0.679-0.818 for acute kidney injury (AKI) and 0.659-0.861 for sepsis in scenarios with electronic health records from multiple hospitals. Risks remain: data leakage, model theft and bias, plus technical limitations—non-IID data, communication costs, and computational complexity.
Pati et al. [35] and Dhade and Shirke [36] present in-depth quantitative comparison of privacy-preserving aggregation algorithms. Standard FedAvg achieves 82.74% server accuracy but significantly lower overall client accuracy (71.22%). FedMA improves local accuracy to 93.80% but performs poorly globally with only 60.77% accuracy. Best compromise between local and global accuracy is demonstrated by homomorphic encryption approach—97.6% local accuracy, 94.3% server accuracy, albeit at higher computational costs.
Most FL research focuses on medical images and electronic health record data. FL application for continuous behavioral monitoring with heterogeneous sensor streams remains unexplored. Real-world implementation studies across institutions are scarce, with most developments limited to simulations. Processing of non-independent and non-identically distributed (non-IID) data and communication efficiency for high-frequency sensor data represent unresolved challenges.
2.6. Existing Home Monitoring Systems
Several research systems specialize in dementia detection through comprehensive home monitoring. Each has different architectural solutions and limitations.
The ORCATECH platform [37] transforms traditional clinical assessment of cognitive decline through continuous, unobtrusive home monitoring. Through sensor networks and software tools, ORCATECH collects long-term data on key daily behaviors—walking, sleeping, computer use, medication intake, and social engagement—related to cognitive functioning. The main advantage is transition from episodic clinical "snapshots" to rich longitudinal profiles of individual changes, enabling earlier detection of mild cognitive impairment. Gothard et al. [38] studied participant self-installation of ORCATECH. Analysis of seven participants (average age 73.9 ± 7.1 years; 5 with MCI) demonstrated feasibility: all successfully self-installed devices with average installation time 20.0 ± 13.7 minutes for MCI and 23.7 ± 10.9 minutes for cognitively healthy individuals, showing MCI is not a significant obstacle. However, architectural details, accuracy, and cost structure are not fully disclosed in available literature. Studies using ORCATECH data [39] show that algorithms for predicting transition to mild cognitive impairment can achieve approximately 84% classification accuracy using LSTM models trained with long-term daily activity data.
SENDA [8] describes a comprehensive protocol for a cohort study with 240 participants followed up to four times at 8-month intervals over three years. The system combines multimodal assessments covering cognitive (MoCA, CERAD-Plus), motor (gait, balance, fine motor skills), sensory (vibratory sensitivity, vision, hearing), and neurophysiological (EEG) indicators. Despite this complexity, SENDA requires active participant involvement in periodic tests and cognitive assessments conducted via tablets, creating significant adherence challenges particularly pronounced in populations with cognitive impairment. As a study protocol, no published quantitative results currently evaluate system effectiveness.
Critical gaps in existing systems are: (1) most require active participation (cognitive tests, device interaction); (2) episodic data collection misses subtle daily behavioral changes; (3) no system implements federated learning for multi-institutional model development preserving privacy; (4) exact costs remain undisclosed, hindering economic feasibility assessment.
2.7. Gap Analysis
Table 1 positions the present work relative to existing systems in terms of critical architectural and validation dimensions.
This work implements state-of-the-art achievements through:
- 6.
- Three-stream data architecture – a new pipeline system simultaneously meets requirements for real-time visualization (1-minute aggregates), machine learning model training (lossless event logs with 1-second resolution), and low latency for critical events (under 7 seconds end-to-end). The architecture achieves 41.2% bandwidth reduction while preserving complete temporal information.
- 7.
- Edge ML on standard hardware – local inference on ESP32-S3 microcontrollers with latency under 50 ms is demonstrated, enabling critical event detection (falls) without cloud infrastructure dependency. This provides real-time response and represents significant advantage over existing systems.
- 8.
- Federated training architecture – a monitoring system designed for inter-institutional collaboration while strictly maintaining confidentiality is presented. The approach addresses GDPR-imposed restrictions. Although validated only in simulated environment, it establishes conceptual and technical foundations for future real-world implementation.
- 9.
- Economic feasibility – estimated costs of €490 for initial implementation and €55 monthly operation are 5–10 times lower than existing research systems, making the solution suitable for large-scale implementation in real clinical and social settings.
Unlike ORCATECH and SENDA, which have demonstrated clinical value through long-term studies with large cohorts, the present work focuses on technical and architectural foundation. The main contribution is architectural design and demonstration of technical feasibility, rather than validation of diagnostic or prognostic capabilities.
3. System Architecture
3.1. Architectural Requirements
The design of a continuous home monitoring system requires balancing technical, economic, and regulatory constraints. Six categories of requirements have been defined to guide architectural decisions.
3.1.1. Functional Requirements
The system must provide continuous monitoring without interruptions throughout the 24-hour cycle, with latency from detection to notification in critical events (falls) not exceeding 10 seconds. Spatial localization must achieve room-level accuracy (over 95%) for reliable detection of disorientation patterns. Biomarker extraction should cover at least motor activity, spatial behavior, and circadian rhythms.
3.1.2. Technical Performance Requirements
Wearable devices must provide minimum three years of autonomy with infrared scanning enabled, eliminating need for periodic charging or battery replacement. Data compression at peripheral gateway must achieve at least 70% reduction without loss of clinically relevant information, and in multi-gateway configurations, deduplication accuracy must exceed 98%.
3.1.3. Confidentiality and Security Requirements
All data must be encrypted using Transport Layer Security (TLS) 1.3. Federated learning must ensure that raw patient data does not leave institutional boundaries.
3.1.4. Regulatory Requirements
The system must comply with GDPR requirements for processing personal health data, including rights of access, erasure, and portability. Participant consent must be informed, specific, and freely given. Detailed audit logs must be maintained for all data operations. For future certification, the system must be compatible with the European Union’s Medical Device Regulation (MDR).
3.1.5. Economic Viability Requirements
Initial installation costs should not exceed €500 per household, including all hardware components and configuration. Monthly operating costs (cloud infrastructure, storage, computing) must remain below €60 per patient to ensure economic sustainability at scale.
3.1.6. Clinical Applicability Requirements
The system must function completely passively after initial installation, without requiring active patient participation for data collection. Installation must be possible by non-professional users or family members in under 20 minutes. All alarm events must contain rich context (pre-event, during event, post-event) to aid clinical interpretation and decision-making.
3.2. Hardware Components
The architecture uses hybrid sensor infrastructure combining wearable devices (Smart Badges or Asset Tag 2), stationary infrared beacons (Beam Mini 2), and peripheral computing gateways (ESP32-S3-BOX-3). The necessary hardware is shown in Figure 1.
3.2.1. Wearable Sensor Devices
Industrial wearable devices from Kontakt.io have been selected and validated for patient tracking in hospital environments. Devices are available in two form factors: Smart Badge (65 × 107 × 7.5 mm, 28-32 g) for clothing clip and Asset Tag 2 (49 × 49 × 15 mm, 40 g) for wrist. Both provide IP65 protection against dust and water, operating at 0-55°C and 10-90% relative humidity.
The built-in lithium-ion battery provides 3-4 years autonomy depending on operating mode. With infrared receiver and BLE transmission active at 0.1 s (telemetry) and 1 s (location), typical autonomy is ~3 years. The battery is non-replaceable, eliminating risk of incorrect replacement and preserving housing hermeticity.
Sensor equipment includes three-axis accelerometer for motor activity and gait analysis, digital temperature sensor with ±0.25°C accuracy for monitoring temperature and circadian rhythms, infrared photodiode, and two programmable buttons (blue and red) for emergency alarms. Bluetooth Low Energy 5.0 module provides communication up to 70 m in open space and 15-20 m in typical home environments.
Room-level localization is achieved through Beam Mini 2 infrared beacons emitting modulated signal containing unique room identifier every 1 s. The wearable device decodes the identifier and includes it in location packet transmitted over BLE channel. A critical advantage is that infrared light does not penetrate walls and doors, ensuring unambiguous room identification.
3.2.2. Edge Computing Gateways
The edge-computing gateway is implemented using Espressif Systems’ ESP32-S3-BOX-3, a multifunctional device based on ESP32-S3 microcontroller designed for home automation systems and sensor networks.
The main module includes dual-core Tensilica Xtensa LX7 processor with clock speed up to 240 MHz, vector instructions for accelerating machine learning operations, Wi-Fi 4 (802.11 b/g/n) with WPA3 support, and Bluetooth 5.0. External 16 MB SPI flash memory is used for program code and temporary data, and 8 MB PSRAM for buffering sensor measurements and machine learning model parameters. The device features 4-inch IPS LCD touchscreen display (320 × 240 pixels) for status visualization, local alarms, and configuration. Typical power consumption is 0.5-1 W depending on load and modules used.
A significant advantage is support for machine learning through ESP-IDF and TensorFlow Lite Micro, allowing neural networks up to 50 KB to execute directly on the microcontroller for anomaly detection with latency ~50-80 ms. Local inference eliminates need to send all raw data to cloud during critical events such as falls.
The gateway operates on mains power via USB-C (5V/2A) and built-in 18650 Li-ion battery (3 Ah, 3.7V) serving as backup power during outages. With consumption of 0.5-0.7 W, the battery provides 13-18 hours autonomous operation, sufficient during power outages.
The architecture provides two peripheral gateways in configurations with large living spaces or multi-story dwellings. This provides (1) better coverage through overlapping BLE zones, eliminating dead spots; (2) continued operation when replacing battery of one gateway; and (3) higher reliability through redundancy. The two-gateway configuration results in partial data duplication in overlapping zones, requiring intelligent deduplication discussed in Section 3.5.
3.3. Software Architecture
The software architecture follows an edge-to-cloud processing model, providing local processing for latency-critical tasks, and using cloud infrastructure for long-term data storage and model training.
3.3.1. Edge Gateway Software
The edge-computing gateway runs specialized software developed on ESP-IDF (version 5.x) using FreeRTOS for real-time multitasking. The software organizes five main tasks coordinated through event groups mechanism, ensuring atomic synchronization and reliable communication between individual system components.
The BLE scanning task actively scans BLE channels at 100 ms intervals with 75 ms window, achieving ~75% duty cycle providing optimal balance between packet detection reliability and energy efficiency. Scan lifecycle events are processed via callbacks on Generic Access Profile (GAP) with minimal latency. The parser extracts device identifiers for GAP AD types 0x08 (abbreviated local name) and 0x09 (full local name), applying buffer overflow protection through explicit length checking. Filtering restricts processing to devices with identifier "DEMENTIA" only.
The feature extraction task accumulates raw measurements in 60-second windows and calculates descriptive statistics. For accelerometer: mean, standard deviation, minimum, maximum, median, number of zero crossings, number of peaks, and total signal energy. Orientation is assessed by analyzing gravity vector, determining percentage of time in upright, lying, and transitional states. Temperature data is aggregated by mean, standard deviation, range, and linear regression slope. Spatial characteristics include dominant room, entry time, cumulative stay duration, number of room transitions, and list of rooms visited.
A local machine learning task implements fall detection using an LSTM model. Input data comes from accelerometer at 10 Hz sampling rate. With configuration of 3 s time window (30-time steps) and single-layer LSTM with 16 hidden units, followed by dense layer with 8 neurons and output sigmoid neuron, the model requires ~1.4 KB Flash memory at INT8 quantization and ~50 KB SRAM, including TensorFlow Lite Micro runtime and working tensor arena. Inference time is under 40 ms enabling real-time execution, with average power consumption ~2 mW at 3.3 V. Although lower frequency results in limited sensitivity to very fast transient movements, the configuration is sufficient for reliable classic fall scenario detection and represents good compromise between accuracy, memory, and energy efficiency for embedded applications.
The data publishing task serializes processed data in JSON format compatible with RFC 7159 specification and publishes to MQTT message broker with hierarchical topic structure in format
institution_id/patient_id/stream_type.
Different Quality of Service (QoS) levels are used: QoS 1 (at least once) for aggregates and events, and QoS 2 (exactly once) for critical alarms to prevent duplicate emergency notifications.
The connectivity management task implements finite state machine that automatically restores Wi-Fi connection when interrupted, using exponential backoff to optimize retries. When connection is lost, gateway buffers data locally in flash memory for up to two hours and transmits immediately after connectivity restoration, ensuring data collection continuity.
Total gateway software size is ~2.5 MB, leaving 13.5 MB free for future extensions and functionalities.
3.3.2. Cloud Infrastructure
The cloud infrastructure is built as isolated instances at institutional level, where each hospital or research center operates its own environment without sharing computing resources or data (see Figure 2). This isolation model ensures compliance with GDPR requirements regarding cross-border transfer of health data.
The MQTT broker is implemented with RabbitMQ (MQTT plugin), provided as managed service through CloudAMQP. The broker uses virtual hosts for logical isolation between institutions, access control lists (ACLs) for enforcing permissions, and mutual authentication with TLS 1.3. Message queues ensure reliability and data preservation during temporary connection interruptions.
The cloud service is implemented as Python microservice using asyncio for concurrent MQTT stream processing, utilizing paho-mqtt (MQTT client), influxdb-client (SDK for InfluxDB), pymongo (MongoDB driver), redis-py (Redis client), and pydantic libraries for data validation. The service is containerized with Docker and orchestrated through Kubernetes providing automatic scaling. During processing, timestamps are normalized to compensate for gateway discrepancies (typically ±5–10 seconds), JSON structure validation and deduplication are performed for multiple gateways.
InfluxDB time series database records and processes aggregated descriptors with 1-minute resolution, stored for seven days for monitoring with time tag indexing ensuring request latency below 50 ms. InfluxQL automatically lowers data resolution for aggregated or historical metric requests.
MongoDB document database stores compressed event logs, critical alarms, hourly aggregates, and daily summaries. Sensitive attributes are protected by field-level encryption (MongoDB CSFLE).
Redis serves as in-memory cache for keys, supporting TTL mechanism for automatic deletion of stale records. Atomic check-and-set operations ensure reliable critical alarm deduplication, preventing duplication even during parallel event processing.
The real-time visualization module is accessible via REST interface (FastAPI) and WebSocket endpoint, providing real-time data updates. The clinical dashboard displays current and short-term trends in aggregated metrics, current location of monitored objects, and critical event history.
3.4. Three-Tier Data Architecture
A key architectural decision is to split the information flow into three specialized channels, optimized for different purposes. This approach avoids unnecessary storage duplication while preserving the necessary information for each specific use case.
3.4.1. Stream 1: Aggregated Statistical Descriptors
The first stream transforms 180 individual measurements (120 telemetry + 60 location packets) for 60-second window into single JSON object containing statistical descriptors. The resulting size of ~2000 bytes represent compression ratio of 38.8% (61.2% reduction) compared to raw data (5160 bytes/minute). Wearable devices send accelerometer data at 10 Hz frequency, used by local fall detector. Telemetry data transmitted to cloud has 5 times lower frequency—2 Hz.
Importantly, this compression is lossy in terms of time resolution: individual 1-second measurements are stored in 1-minute descriptors with no possibility of recovering raw data. Such compromise is justified for applications requiring trend analysis and real-time visualization but unsuitable for machine learning requiring complete time sequence of signals.
Stream 1 data is stored in InfluxDB for seven days, with configuration optimized for clinical dashboards requiring latency below 50 ms when visualizing current and short-term trends. After this period, data is automatically deleted as no longer needed.
3.4.2. Stream 2: Compressed Event Logs
The second stream stores complete time sequence of discrete measurements with 1-second resolution using differential encoding and gzip compression. Differential encoding exploits temporal correlation between successive measurements: first event in window is recorded with all fields, while subsequent ones contain only fields changed from previous state, reducing stored data without information loss.
After applying differential encoding, which reduces size from 5160 bytes to ~3345 bytes, the event array is compressed with gzip, achieving 70–75% reduction through repetitiveness in JSON syntax. Final size of ~1036 bytes (including 200 bytes metadata) represent compression ratio of 20.1-79.9% reduction. Critically, this compression is lossless—the original 1-second time sequence can be fully restored through decompression and reverse differential encoding.
Compressed logs are decoded upon cloud arrival and stored in MongoDB with indexing by patient and time interval. This stream provides full temporal resolution needed to train deep recurrent neural networks requiring sequential input data to capture long-term dependencies. When anomalies are detected through aggregated metrics, clinicians can request detailed logs for specific time window to obtain precise event visualization.
3.4.3. Stream 3: Critical Real-Time Alerts
The third stream is a high-priority channel for events requiring immediate response. It bypasses 60-second buffering and provides immediate MQTT publication with QoS level 2, ensuring exactly-once delivery. Critical events include pressing either button (blue or red), fall detection, and prolonged inactivity exceeding two hours during daytime. Each alert contains contextual data about state immediately before and after incident, including 10-second pre-event window and 60-second post-event window.
Alert package structure includes unique identifier, timestamp with millisecond precision, severity level (low, medium, high, critical), event type (button_press, fall_detected, prolonged_inactivity), and confidence score from machine learning model. Contextual information covers event location (room_id, room_name, stay duration), pre-event indicators (average and maximum activity, orientation, movement presence), event parameters (impact magnitude, duration, peak accelerations along three axes), and post-event indicators (average activity, immobility duration, orientation, and temperature change).
Alert packet size varies between 400-600 bytes, with event frequency typically under 5 per patient per day. Latency from detection at peripheral gateway to notification delivery is under 7 seconds in 99.5% of cases, ensuring timely response in emergency situations.
3.4.4. Derivative Aggregates
Hourly aggregates are generated by an automated task running every hour at :05 minutes, extracting 60-minute event records from MongoDB (Stream 2) for previous hour. The task decompresses gzip payload, parses JSON structures, and calculates statistical moments directly from raw 1-second sequences, including average motor activity values, dominant room, total transitions, and temperature trends. Result is serialized as BSON document in hourly_aggregates collection in MongoDB with 90-day retention period. Aggregate size is 2.5–3 KB per hour.
This process transforms detailed event logs into compact intermediate representation optimized for computational efficiency in model training. Hourly aggregates contain 2,160 documents per patient for 90 days, compared to 129,600 minute-level event records, providing pre-computed features directly applicable to classical algorithms such as Random Forest and Gradient Boosting without additional decompression and feature extraction operations.
Daily summaries are generated by automated nightly task running at 00:05, extracting previous 24 one-hour aggregates from hourly_aggregates collection and calculating daily statistics, including total activity, room occupancy distribution, sleep parameters, and circadian rhythm amplitude. Result is stored as single BSON document of 2–3 KB in daily_summaries collection with unlimited storage duration.
Daily summaries perform three key functions: (1) provide data for building personalized baseline models for each patient requiring minimum 30 days reference history; (2) enable creation of clinical reports and visualization of longitudinal trends over months and years; and (3) provide training data for long-term predictive models analyzing cognitive decline trajectories over multi-month or multi-year periods.
Table 2 summarizes all data flows and their characteristics.
Total storage used for one patient over 90 days is approximately 5.7 GB. Of this, InfluxDB stores 288 MB "hot" data for last 7 days, while MongoDB persistent storage amounts to 5.4 GB, with event logs dominating, hourly aggregates taking 6.5 MB, and critical alerts and daily summaries under 1 MB.
3.5. Deduplication with Multiple Gateways
The architecture uses pair of edge-computing gateways to ensure normal operation in large apartments or multi-story houses. Dual-gateway configuration results in systematic data redundancy with 15-20% spatial overlap of BLE coverage areas, typical for stairwells and open spaces.
3.5.1. Deduplication of Aggregated Descriptors (Stream 1)
In configurations with multiple gateways in overlapping areas, the two gateways receive different subsets of BLE packets due to variations in radio frequency propagation. Therefore, cloud deduplication cannot rely on content identity but must determine which gateway provides better coverage for that minute.
The algorithm uses average received signal strength (RSSI mean) as primary quality indicator, combined with number of packets received and summary assessment of data completeness. The deduplication key is formed from wearable device MAC address and minute-level timestamp
{badge_mac}_agg_{timestamp_minute}.
Upon first entry, aggregate is recorded in InfluxDB and record is created in Redis with 120-second TTL, containing average RSSI value, gateway ID, and number of packets received. Upon second arrival with same key, system retrieves cached RSSI value and compares with current one. If current value is higher, old record in InfluxDB is replaced with new aggregate and cache is updated. If lower, aggregate is discarded. After TTL expires, Redis automatically deletes key and frees memory for next minute interval.
This approach ensures exactly one aggregate record per minute is written to InfluxDB for each patient, always with best coverage quality.
3.5.2. Merging Event Logs (Stream 2)
Unlike aggregates, event logs from different gateways are complementary rather than redundant. For example, gateway A may receive 172 out of 180 packets with gaps in certain seconds, while gateway B receives 176 out of 180 packets with different losses. Neither log is better; combining them provides maximum time coverage. The system uses "store and merge on demand" model. During reception phase, logs from all gateways are stored without deduplication, each marked with gateway ID and RSSI statistics and recorded as separate document in MongoDB, indexed by
{badge_mac, timestamp_minute, gateway_id}.
Upon request, all logs for relevant time window are retrieved and unified timeline is constructed by combining them by timestamp. For each second [0,59], if data exists from only one gateway, it is used directly. When data comes from two gateways, merging is performed at field level: non-zero values are preferred, and in case of conflict, value with higher RSSI is selected. Final result is sorted, consolidated event sequence, with typical improvement from 170–175 measurements per minute to 178–180, recovering partially lost data.
3.5.3. Deduplication of Critical Alarms (Stream 3)
Critical alarm events require guarantee of single delivery to avoid duplicate notification accumulation. Deduplication key is defined as combination of wearable device hardware address, timestamp with second resolution, and alarm type
{badge_mac}_alert_{timestamp_sec}_{alert_type}.
The algorithm uses atomic check-and-set operation in Redis. Upon first arrival, alarm is recorded in database, notification chain is triggered, and key is set with 120-second validity period. All subsequent messages with same key are rejected as duplicates. Choosing 120-second timeout instead of 60-second aggregation interval ensures resilience to network delays and temporary clock desynchronization between gateways. Combination of QoS 2 in MQTT protocol with cloud infrastructure deduplication provides double protection and high reliability when processing critical alarm events.
4. Federated Learning Design
4.1. Motivation and Requirements
Traditional centralized approaches to machine learning in healthcare require aggregating data from multiple institutions into single repository, raising three fundamental problems. First, GDPR regulatory barriers prohibit cross-border transfer of personal health data without explicit guarantees of strong protection. Second, institutional policies often restrict sharing of raw patient data due to concerns about confidentiality, competitive advantage, and legal liability. Third, centralized repositories represent single point of failure and attractive target for cyberattacks.
Federated Learning (FL) offers solution where, instead of data moving to model, model moves to data [34]. Each institution trains model locally on its own data and shares only abstract parametric updates with central orchestrator, which aggregates them into global model. Raw data never leaves institutional boundaries, ensuring compliance with GDPR and institutional policies.
Despite promising results, significant challenges remain. \ Non-IID distributions, data noise, and lack of standard benchmark datasets pose challenges in medical applications.
4.2. Architecture of the Federated Learning System
The architecture follows the classic client-server model for federated learning, where a central orchestrator coordinates the learning process without access to raw data, and local training servers (one per institution) perform the calculations on their own data.
4.2.1. Federated Learning Orchestrator
The central orchestrator is coordination component responsible for three main functions: (1) distributing global model to participating institutions at beginning of each training round; (2) aggregating parametric updates received from institutions; and (3) managing lifecycle of federated process, including client selection, hyperparameter configuration, and convergence criteria.
Orchestrators never have access to raw data, only to weighted parameters of trained models. This ensures that even if orchestrator is compromised, individual patient records cannot be obtained. Orchestrator is located on virtual cloud machine, accessible via HTTPS endpoint with two-way TLS authentication. All communications use gRPC protocol over HTTP/2 transport with TLS 1.3 encryption and mutual certificate authentication.
4.2.2. Local Training Servers
Each participating institution maintains local training server performing three basic operations for each federated training round:
- Feature extraction from MongoDB hourly_aggregates or event logs collections for training set. Features include statistical moments of motor activity, spatial indicators, circadian parameters, and behavioral anomalies (episodes of long-term immobility, nocturnal activity).
- Local model training on institutional dataset for fixed number of epochs (typically 5-10). Deep recurrent neural network (LSTM) architecture with two layers of 64 and 32 units, dropout layers with probability 0.3 for regularization, and dense output layer for risk classification is used. Model is trained with Adam optimizer (learning rate = 0.001) and binary cross-entropy loss.
- Parametric update calculation: After local training, server calculates difference between local weights
- and global weights
- 4.
- This parametric update (typically ~200 KB for LSTM model) is serialized and sent to orchestrator via secure gRPC channel.
4.2.3. Federated Averaging Algorithm
The orchestrator aggregates parametric updates using the classic Federated Averaging (FedAvg) algorithm. The global model is updated according to the formula:
where is the
number of participating institutions, is the
number of training examples in institution , is the
total number of examples.
Weighted averaging ensures institutions with larger datasets have proportionally greater influence on global model, ensuring fair representation. However, this approach can be vulnerable to highly unbalanced distributions or presence of malicious actors. To protect against Byzantine attacks (malicious or compromised clients sending invalid updates), architecture provides for extension with robust aggregation methods such as Krum or Trimmed Mean, which exclude statistical outliers before averaging. However, these methods are not implemented in current proof-of-concept implementation.
Process is repeated for fixed number of rounds or until convergence is achieved, defined as relative change in validation loss below 2%.
4.3. Implementation with the Flower framework
For practical implementation of federated learning, Federated Learning over Wireless (Flower) is used—a modular, open framework that abstracts FL coordination without being tied to specific machine learning library [41].
4.3.1. Architectural Advantages of Flower
Flower offers four key advantages for current architecture. First, independent design allows models implemented using TensorFlow, PyTorch, scikit-learn, or other libraries through unified client-server interface. Second, strict separation between coordination and training—server component manages only orchestration, while each institution retains full control over local data, training, and evaluation. Third, efficient communication through high-performance gRPC protocol compatible with standard hospital network constraints. Fourth, built-in fault tolerance—temporarily unavailable clients are excluded from current round without compromising global processes.
4.3.2. Client Implementation
Each institution implements a client component by extending base class fl.client.NumPyClient, which defines three mandatory methods:
- 5.
- get_parameters() retrieves current parameters of local model as list of NumPy arrays. This operation is called at beginning of each round when orchestrator wants to obtain current state of local model.
- 6.
- fit(parameters, config) accepts global parameters from orchestrator, updates local model, performs local training for configured number of epochs, and returns updated parameters along with metadata (number of examples used, local loss). Only parameter updates leave institution—raw data and gradients remain local.
- 7.
- evaluate(parameters, config) evaluates global model on local validation set and returns quality metrics (accuracy, loss). This allows orchestrator to track global performance without accessing data.
4.3.3. Server Configuration
Orchestrator is configured via fl.server.start_server() with parameters for aggregation strategy, minimum number of clients, number of rounds, and convergence criteria. For current architecture, FedAvg strategy is used, implementing standard federated averaging described in Section 4.2.3. Flower also supports alternative strategies such as FedProx (for heterogeneous clients), FedOpt (with adaptive optimizers), and customized strategies for specific applications.
4.3.4. Communication Efficiency
A critical aspect for practical applicability is minimization of communication costs. For LSTM model with approximately 35,000 parameters, each parameter update is ~200 KB (float32 representation). With 5 training rounds and three institutions, total communication exchange is:
- Downlink (orchestrator → institutions): 5 rounds × 3 institutions × 200 KB = 3 MB;
- Uplink (institutions → orchestrator): 5 rounds × 3 institutions × 200 KB = 3 MB;
- Total: 6 MB for complete federated process.
By comparison, transferring raw data for seven days continuous monitoring would require approximately 70-80 MB per institution, representing more than 35-fold reduction in communication volume through FL.
4.4. Confidentiality Guarantees
Federated learning provides multi-layered confidentiality protection through combination of architectural, cryptographic, and algorithmic mechanisms.
4.4.1. Communication Efficiency
Raw patient data never leaves institutional boundaries. All training data remains in institution’s local MongoDB instance, with network isolation (firewall rules allowing only outbound gRPC connections to orchestrator) and role-based access control (RBAC). Even orchestrator administrators lack technical means to access raw data.
4.4.2. Transport Level Encryption
All communications between institutions and orchestrator use TLS 1.3 with mutual certificate authentication. Each institution has unique X.509 certificate issued by trusted certification authority (CA), which orchestrator validates before accepting data. This prevents man-in-the-middle attacks and ensures participant authenticity. Parametric updates are transmitted as serialized tensors over TLS-encrypted channel, ensuring confidentiality and integrity during transport.
4.4.3. Protection Against Byzantine Attacks
Malicious or compromised clients may send invalid parametric updates to sabotage global model. Architecture provides three levels of protection:
- Statistical filtering excludes updates that are statistical outliers by calculating Euclidean distance between each pair of updates and rejecting updates with median distance above certain threshold.
- Robust aggregation uses algorithms such as Krum (selects update with smallest sum of distances to nearest neighbors) or Trimmed Mean (excludes most extreme α% updates before averaging) instead of direct averaging.
- Reputation system tracks historical client performance and reduces weights of institutions whose updates consistently worsen global validation accuracy.
These mechanisms are not implemented in current proof-of-concept but are planned for future expansion in multi-institutional deployment.
5. Technical Validation
5.1. Scope and Objectives of Validation
Technical validation of proposed system called Monitoring INtelligence for Dementia Guarded by Ubiquitous Ambient RecorDing (MINDGUARD) aims to demonstrate the technical feasibility of architecture and evaluate key system metrics determining practical applicability. Clinical validation is explicitly outside scope of this work and remains important future task.
Technical validation focuses on six evaluation dimensions:
- Localization accuracy - verification of infrared system to achieve room-level localization accuracy.
- BLE communication characteristics - measurement of packet delivery reliability, RSSI, and coverage.
- Compression efficiency - validation of network traffic reduction while maintaining information completeness.
- Deduplication performance - assessment of accuracy in multi-gateway configurations.
- End-to-end latency - verification of requirement for under 10 seconds for critical event delivery.
- Architectural feasibility of federated learning - demonstration of federated learning in simulated environment.
System is considered successful if it achieves project goals in all six dimensions in real home environments.
5.2. Experimental Setup
5.2.1. Test environment
System was installed and evaluated in two apartments with different layouts and sizes. First apartment (95 m²) includes kitchen, living room, two bedrooms, bathroom, and hallway. Second apartment (52 m²) has more compact layout with living room combined with kitchen, bedroom, and bathroom. Both apartments have Wi-Fi access.
5.2.2. Hardware Implementation
Each participant carries one Smart Badge 3 (Kontakt.io), configured to transmit telemetry data every 0.1 s and location data every 1 s at TxPower = -4 dBm. Logical name of all devices is "DEMENTIA".
Six Beam Mini 2 beacons are installed in first apartment (one each for kitchen, living room, both bedrooms, bathroom, and two for L-shaped corridor). Four beacons are installed in second apartment (living room-kitchen, bedroom, bathroom, corridor). Each beacon is configured to transmit unique room identifier every 1 s (minimum possible interval) with transmission angle 110°.
Two ESP32-S3-BOX-3 gateways are installed in both apartments, located in various places with 15-20% overlap in BLE coverage areas. Gateways are initially configured by institution’s IT department via web interface. Information to be entered includes institution ID, patient ID, wearable device ID, address and authentication for MQTT broker access for respective institution, and room IDs and names.
Gateways are connected to home Wi-Fi router and communicate with cloud infrastructure via TLS 1.3 encrypted MQTT channel. When gateway starts in home environments without stored Wi-Fi access data, software activates Soft Access Point (SoftAP) mode. In this mode, gateway creates its own wireless network with program-defined name and password. Information on how to connect to gateway’s wireless network is shown on display—network name, IP address, and access password. Patient (or family member) must connect to this temporary network from phone, tablet, or computer and access gateway’s access point via browser. Web server at this address displays a page with form for entering SSID and password for home network (Supplementary Materials/Figure S1). Once user enters and confirms data, device saves it in non-volatile memory (NVS), terminates SoftAP mode, switches to Station mode, and connects to home Wi-Fi network.
5.2.3. Participants
Three healthy volunteers (aged 28, 58, and 89) participated in technical validation. Participants were selected to represent different age groups and activity patterns to test system robustness across variety of user behaviors. Each participant wore Smart Badge continuously for 7 days, including at night, and was instructed to maintain normal daily routines. All participants provided written informed consent to participate in this technology assessment study. 7-day period was chosen to validate: (1) hardware reliability, and (2) variability in sensor data.
5.3. Technical Results
5.3.1. Accuracy of Infrared Localization
Theoretical model
Geometric and probabilistic model of IR system was developed for quantitative assessment of localization accuracy. We assume room is rectangular with width W and length L, and IR beacon is mounted in center of ceiling at height H. Beam formed by beacon is cone with angle θ and radius of coverage on floor.
A point () on the floor is in the IR coverage if:
For each point, probability of successful detection during single beacon transmission in line-of-sight (LOS) scenario ∈ [0,1] is defined. This is followed by simulation of discrete time process with transmission interval Δt. Probability that point will be validly detected is obtained by:
where represents temporal consistency mechanism requiring N consecutive IR detections to validate localization. In single-room configuration, = 1 is optimal as it maximizes sensitivity and minimizes false negatives. Use of > 1 is justified in multi-room configurations where probability of infrared signal overlap is higher.
It is assumed that probability of direct visibility = 0.85. This value corresponds to typical conditions for propagation of infrared rays in enclosed spaces, considering partial signal obstacles—user’s body, furniture, and others.
Simulation includes Time-to-Live (TTL) logic to retain position estimate within certain period after valid detection. For each step , following can be recorded:
The evaluation of the localization at a given time step is:
Monte Carlo analysis
To assess room-level localization accuracy, Monte Carlo simulation is used, which approximates multidimensional expectation by statistically averaging system response to randomly selected user positions, dwell times, and stochastic infrared detection events.
Assessment is performed in following sequence:
- Generate
- random initial positions uniformly in room.
- For each position, simulate exponentially distributed stay time
- 3.
- Discretize time with Δt and apply logic for and TTL.
- 4.
- Accuracy is estimated as fraction of time during which coincides with actual visitor position.
The accuracy for correct localization is the mathematical expectation:
where the indicator function takes the value 1 when the estimated room corresponds to the actual one, and 0 otherwise. The following formula is used for program calculation:
Simulation analysis for Kontakt.io’s IR beacons Beam Mini 2 ( = 110°, N_min = 2) shows that with minimum possible transmission interval of 1 second, probability of correct localization is approximately 94% (see Figure 3a). With = 1, accuracy increases to 99.3%. Dependence of accuracy on radiation angle is shown in Figure 3b.
Maximum accuracy is achieved with beacons θ > 100° and rooms up to 25 m². For larger rooms, two beacons need installation. Simulations show average localization accuracy for adjacent rooms connected by door of 91% for = 2 and 96% for = 1. Accuracy decrease at boundary zones is ~3%.
Experimental validation
Infrared localization system was validated by comparing automatically detected locations with reference data collected via mobile application. Participants were instructed to record entry and exit times from each room in mobile application, creating reference timeline.
Under optimal conditions (badge worn openly, direct or reflected visibility to IR beacon), system achieved 97.6% room identification accuracy, corresponding to model. Problems arise during room transitions—badge’s proprietary software detects new room after ~1.5 seconds.
When device is partially covered (thick outer clothing or placed in pocket), proprietary software may detect lack of room identifier (-1). In real home environments, this occurs 4-8% of time. In these cases, software assumes patients are in last recognized room, ensuring location data continuity.
Infrared technology exceeds typical accuracy of ~85% for BLE-only approaches [24] due to inability of IR light to penetrate walls and doors, eliminating main limitation of radio frequency methods.
5.3.2. BLE Communication
BLE communication channel was analyzed by measuring Received Signal Strength Indicator (RSSI) at different distances and frequency of successfully delivered packets (Supplementary Materials/Figure S2). Measurements were performed in brick apartment with area of 95 m² (4 rooms, bathroom, hallway). Edge gateway was placed in apartment center. Smart badges were programmed to transmit with power TxPower = -4 dBm.
The results obtained are presented in Table 3.
RSSI values show expected inverse relationship with distance. Path loss exponent is close to theoretical value for free space ( ≈ 2.0) in direct line of sight, while in obstructed conditions reaches ≈ 3.5-4.0, typical for home environments with brick walls and furniture.
Effective range of BLE communication in home environments is approximately 15 meters through one wall, after which packet loss increases dramatically above 20%. If badge can be more than 15 meters from gateway in home, or signal passes through two or more brick walls, use of second gateway is mandatory.
With configured transmission interval of 100 ms for telemetry packets and 1000 ms for location packets, measured Packet Delivery Rate (PDR) is 92.8% (7.2% loss). Lost packets are evenly distributed over time, facilitating interpolation and confirming channel stability.
5.3.3. Effectiveness of the Three-Channel Architecture
The proposed three-channel architecture achieves a significant reduction in network traffic while maintaining information integrity (see Table 4).
The baseline for comparison is the raw BLE data for a 60-second window: 120 telemetry packets (average 29 bytes) and 60 location packets (average 28 bytes), generating a total of 5,160 bytes/minute of uncompressed information.
Stream 1 transforms 180 individual measurements into single JSON object containing statistical descriptors (Supplementary Materials/Figure S3) with compression ratio of 38.8% (61.2% reduction). Critically, this compression is lossy with respect to temporal resolution—individual 1-second measurements are irreversibly aggregated into minute-level descriptors.
Stream 2 implements two-stage compression strategy: differential encoding reduces size from 5,160 bytes to average 3,345 bytes, after which gzip achieves 70-75% additional compression (Supplementary Materials/Figure S4). Final size of 1,036 bytes represents compression ratio of 20.1% (79.9% reduction). This compression is lossless—original 1-second sequence is fully recoverable.
Stream 3 does not implement compression but enriches BLE packet (29 bytes) with rich context (~600 bytes). Increase is justified by low frequency (typically under 10 events/day) and criticality of detailed information for clinical interpretation (Supplementary Materials/Figure S5).
Total network traffic reduction is 41.2% (Streams 1+2 combined: 3,036 bytes vs. 5,160 bytes baseline).
5.3.4. Deduplication Performance
Deduplication algorithms were tested in apartment 1 (95 m²), where two peripheral gateways were positioned with approximately 20% overlap in BLE coverage areas. Each gateway independently receives BLE packets from wearable device and generates three streams, leading to duplication when participant moves within overlap zone.
Aggregate deduplication (Stream 1): Quality-based selection algorithm using average RSSI value achieves 98.5% accuracy in selecting higher quality aggregate. False positive errors (valid aggregate incorrectly marked as duplicate) observed in 1.5% of cases, typically when two gateways have very close RSSI values (difference below 3 dBm). False negative errors (duplicate not recognized) are not detected.
Merging event logs (Stream 2): When moving in overlap zone, gateway A receives average 96.7% of packets, while gateway B receives average 97.2%, with uncorrelated losses. After merging two logs on demand, completeness increases to 99.9%, representing 3.2% improvement. Additional latency of 60-second window request is 15 ms.
Alarm deduplication (Stream 3): Exactly-once delivery mechanism tested by simulating critical events (pressing SOS button) when participant positioned in overlap zone. Both gateways detect event and generate alert packets with 90 ms difference. Redis atomic check-and-set operation ensures only first alert arriving is processed, with second discarded as duplicate. Accuracy is 100%.
5.3.5. End-to-End Latency
The total end-to-end latency from sensor to cloud notification was analyzed for two scenarios: non-critical aggregated data and critical alarm events.
Non-critical data (Stream 1, Stream 2): Latency consists of: BLE scan cycle (96 ± 12 ms), buffering and feature extraction (60,000 ms fixed), MQTT publishing (15-25 ms), network propagation (50-110 ms depending on internet connectivity), MQTT broker processing (5-10 ms), and cloud ingestion service (10-20 ms). Overall latency is dominated by 60-second buffering, which is architectural decision rather than limitation.
Critical data (Stream 3): Latency for critical events bypasses buffering: local ML detection at edge-computing gateway (60-90 ms), immediate MQTT publication with QoS 2 (15-25 ms), network propagation (50-110 ms), MQTT broker (5-10 ms), and cloud alarm service (10-20 ms). Measured latency from detection at edge-computing gateway to notification delivery is under 7 seconds in 99.5% of cases (95th percentile: 6.8 s), with average latency 4.2 seconds. This ensures timely response in emergency situations such as falls or SOS button pressing.
Edge ML inference: Local anomaly detection (falls) using TensorFlow Lite Micro model on ESP32-S3 demonstrates inference latency below 50 ms, enabling real-time classification without cloud dependency.
5.3.6. Architectural Proof-of-Concept for Federated Learning
The experiment aims to validate the technical feasibility of FL orchestration, not to demonstrate clinical effectiveness.
Simulation setup
It is critical to emphasize that current FL implementation represents architectural proof-of-concept in simulated environment, rather than real multi-institutional implementation. Experiments were conducted on laptop simulating three independent institutions through separate MongoDB instances and Python processes. Dell Precision 3581 laptop (Intel Core i7-13700H, 14 cores; 32 GB DDR5; 512 GB SSD) was used.
For technical validation, fall detection task is used, which has real accelerometer data for 7 days and represents clearly defined event suitable for demonstrating federated model convergence with limited data. Architecture and FL protocol used are directly applicable to dementia tasks with appropriate longitudinal data.
To simulate federated environment, data from 10 participants is divided between three institutions (4 in Institution 1, 3 each in Institutions 2 and 3) and augmented using specific techniques to increase diversity: Institution 1 applies time shifting and Gaussian noise; Institution 2 uses coordinate system rotations and amplitude scaling; Institution 3 applies time warping and jittering.
Continuous accelerometer signals (10 Hz) are divided into overlapping 3-second time windows (30 consecutive measurements). Each institution has approximately 620-680 windows, balanced between positive (fall) and negative (normal activity) examples. Data is divided into training (70%), validation (15%), and test (15%) sets within each institution.
Model used is simplified LSTM with two layers (64 and 32 units), dropout (0.3), and output sigmoid layer for binary classification. Model trained with Adam optimizer (learning rate = 0.001) and binary cross-entropy loss.
Results
Federated learning is orchestrated through Flower framework (flwr package, version 1.23.0) in 5 rounds, with global model distributed to institutions each round for 10 local training epochs. Global federated model demonstrates stable convergence, with validation loss decreasing from 0.68 to 0.31 (Figure 4).
Model achieves accuracy of 84.2% and F1-score of 0.81, representing 7.1% improvement over best local model trained in isolation (77.1%). Federated models also show better generalization across institutions, with significantly lower accuracy variability (σ = 2.3%) compared to local models (σ = 8.7%).
Proof-of-concept limitations
This experiment validates only architectural feasibility of federated learning in controlled simulated environment, not production-ready system. Actual multi-institutional implementation in hospital networks, dealing with network constraints and firewall configurations, resilience to Byzantine attacks, and training on longitudinal dementia data remain unexplored and require significant additional work before clinical application.
5.3.7. Real-Time Visualization of Data from Wearable Devices
To validate communication channels between wearable devices and MQTT message broker, and evaluate functional capabilities of edge computing gateway, real-time data visualization service has been developed. Service provides continuous monitoring of key sensor biomarkers extracted from location and telemetry packets generated by wearable devices.
Figure 5 shows results of real-time visualization service for key behavioral and physiological indicators.
Figure shows that in absence of data from infrared localization beacon, edge-computing gateway transmits zero value for room_id parameter. In example shown, patient’s transition from living room (room_id = 9) to kitchen (room_id = 1) is recorded, occurring in corridor where IR beacon was deliberately turned off. During this interval, system detects room_id = 0, interpreted as lack of localization coverage. Ingestion software analyzes such cases of interrupted IR coverage and applies logic for contextual interpretation of spatial data, in most cases replacing missing room_id value with last valid measured value.
6. Discussion
6.1. Key Technical Contributions
Experimental validation demonstrates that the proposed architecture successfully achieves all six project objectives in a real home environment, establishing a technical foundation for future clinical applications.
Infrared localization at room level achieves 97.6% experimental accuracy, exceeding design goal of 95%. This represents significant improvement over typical accuracy of ~85% for BLE-only approaches [24,27]. This precision is critical for detecting spatial disorientation, an early and specific sign of dementia.
Three-channel data architecture achieves 41.2% overall network traffic reduction while maintaining full 1-second temporal resolution for model training and minute-level resolution for real-time visualization. Hybrid approach balances competing requirements: Stream 1 provides aggregated descriptors for clinical dashboards with latency below 50 ms; Stream 2 stores lossless compressed sequences for ML; Stream 3 delivers critical alarms with end-to-end latency below 7 s for 99.5% of events. This design avoids trade-off between completeness and efficiency characteristic of single-channel architecture.
Edge computing with local ML demonstrates inference latency below 50 ms for fall detection, eliminating cloud dependency for critical events. This represents qualitative change from systems sending all raw data for cloud processing, where aggregation cycles lead to 30-60 second delays.
Deduplication across multiple gateways achieves 98.5% accuracy for aggregates, 99.9% completeness after log merging, and 100% reliability for critical alarms, ensuring continuous coverage in large homes without unnecessary network traffic or storage.
Federated learning, although validated only in simulated environment, demonstrates architectural feasibility with convergence in 5 rounds and communication overhead of 1.4 MB per institution—more than 50-fold reduction compared to raw data transfer.
Economic viability (approximately €490 for hardware and installation and approximately €55 monthly for cloud infrastructure) represents 5-10-fold reduction compared to existing research systems, making large-scale deployment economically feasible for healthcare systems with limited budgets.
6.2. Positioning Relative to the Current State
The proposed architecture differs from existing systems through three critical innovations that address fundamental limitations in the field.
Spatial precision. ORCATECH [37,38] uses passive IR sensors with zone-level accuracy (~3–5 m). SENDA [8] does not apply spatial tracking, relying instead on episodic motor and cognitive assessments over 8 months. Kim et al. [40] achieved AUC of 0.99 for predicting dementia, but also with zone-level PIR sensors. Current system provides 97.6% room-level accuracy through IR beacons, enabling detection of specific disorientation patterns.
Continuous passive monitoring: SENDA requires active patient participation (periodic testing with tablet and wearing multiple devices), leading to significant compliance issues, especially with cognitive impairment. After initial installation, current system operates completely passively with 24/7 monitoring without interruption; participant wears only one device requiring no charging (battery lasts over 3 years) and no interaction. This eliminates compliance constraints critical for target population.
Protection of personal data across multiple institutions: None of systems under consideration apply federated learning. ORCATECH and SENDA function as single-center or limited multi-center studies with centralized data storage, creating GDPR barriers in international research. Current architecture is first to demonstrate technical feasibility of FL for home dementia monitoring (in simulated environment), overcoming fundamental limitation—joint model development on diverse populations without violating regulatory requirements.
6.3. Limitations and Guidelines for Future Development
6.3.1. Current Technical Limitations
Experiment with 3 participants, 7 days, and 2 apartments is technological assessment, not clinical study. Generalizability is limited by small sample size, short duration, and homogeneous demographics (all cognitively healthy; similar housing infrastructure). Extended testing (over 3 months), diverse environments (over 10 homes), and larger cohorts are needed to assess long-term reliability, seasonal variations, and edge cases.
System does not measure heart rate, blood pressure, oxygen saturation, or heart rate variability—indicators associated with vascular dementia and cardiovascular health. Minimalist sensor set was chosen for balance between simplicity, long battery life, and continuous wearability. Future integration of PPG sensor would add significant information with minimal energy increase.
System does not track patient behavior outside home. Frequency of leaving, duration of absence, and visits to social spaces are established indicators of cognitive health. Monitoring entrance area distinguishes leaving home but cannot assess social interactions.
Federated learning validation was conducted in local environment. Three institutions were simulated rather than real hospital networks. Network constraints (firewall rules, NAT traversal, institutional proxy servers), heterogeneous computing resources, Byzantine attacks, and operational challenges were not investigated. Transition from proof-of-concept to production implementation requires significant engineering work and coordination with institutional IT departments.
6.3.2. Guidelines for Clinical Implementation
Transforming architectural prototype into clinically validated system requires multi-stage approach with clear intermediate goals:
- Phase 1: Extended technical validation (6–12 months) – testing with 50–100 participants in real, diverse home environments for minimum three months continuous operation, covering different home types and demographic profiles (ages 65 to over 85, different education levels and technological literacy). Includes systematic failure analysis with targeted provocation of edge cases (battery depletion, connectivity loss, extreme usage patterns) and assessment of long-term hardware component reliability.
- Phase 2: Clinical pilot study (12–18 months) – ethics committee-approved protocol with ~150 participants in three groups: 50 individuals with MCI, 50 with mild dementia, 50 healthy controls. Includes baseline and quarterly neuropsychological assessments (MMSE, MoCA, CERAD-Plus) and reference clinical diagnosis. Effectiveness assessment covers diagnostic indicators (sensitivity, specificity, positive and negative predictive value) for MCI classification versus healthy controls and analysis of predictive ability for MCI to dementia within 12 months.
- Phase 3: Multicenter federated deployment (18–24 months) – real federated training between ≥5 institutions, each with cohort of 50–100 patients. Objectives are technical integration in heterogeneous institutional IT environments, demonstration that federated learning model achieves equal or higher accuracy versus single-institution models, official confidentiality audit confirming GDPR compliance, and proof of operational stability with continuous operation over six months without critical incidents.
- Phase 4: Priority technical improvements – integration of PPG sensor for cardiovascular monitoring, optional GPS module for outdoor tracking (periodic mode for energy efficiency), and implementation of Byzantine-fault-tolerant aggregation methods (Krum, Trimmed Mean) with differential privacy mechanisms providing formal guarantees for data protection.
6.3.3. Open Research Questions
Optimal temporal resolution for different behavioral biomarkers is still not clearly defined: one-second measurement frequency may be excessive for analyzing circadian rhythms but insufficient for capturing fine motor abnormalities. Similarly, minimum baseline period duration required to build reliable personalized models remains open question—30-day period is reasonable working hypothesis but may prove insufficient in rapidly progressing cases or excessive in clinically stable populations. Generalizability of developed models across different cultural and social contexts, for example between Mediterranean and Scandinavian lifestyles, requires multinational validation with heterogeneous cohorts. Finally, ethical aspects of continuous monitoring, especially in patients with advanced dementia unable to give informed consent, necessitate careful development of adequate ethical and regulatory frameworks.
6.4. Broader Impact and Applicability
Proposed architecture is disease-independent and can be directly applied to other neurodegenerative and chronic conditions requiring long-term monitoring. In Parkinson’s disease, accelerometer data enables detection of tremor and bradykinesia, while spatial patterns reveal freezing of gait episodes. In multiple sclerosis, system can track progression of motor deficits and fatigue patterns. In post-stroke rehabilitation, continuous monitoring allows assessment of quantity and quality of physical therapy protocol compliance. This generalizability significantly increases potential impact beyond dementia.
Ethical considerations require careful balance between clinical benefit and protection of patients’ personal rights. Continuous monitoring raises important questions related to autonomy, personal dignity, and risk of excessive or invasive surveillance. Therefore, system should be implemented within clearly defined data management policies specifying who has data access, how it’s used in clinical decision-making, and what procedures exist for data deletion upon request. Although technological approaches such as differential privacy and federated learning address key aspects of data protection, they are insufficient alone. Adequate ethical frameworks for informed consent need development, especially in context of progressive cognitive decline, requiring close multidisciplinary collaboration between clinicians, ethicists, and patient advocacy organizations.
7. Conclusions
Development establishes technical feasibility and economic viability of continuous, privacy-preserving home monitoring for behavioral pattern analysis through integrated architecture combining wearable sensors, infrared localization, edge computing, and federated learning.
Experimental validation in real home environments confirms multi-threaded compression successfully balances requirements for low latency and high information completeness without significant compromises, and quality-based deduplication provides reliable coverage in multi-gateway configurations. Economic model demonstrates five- to ten-fold cost reduction compared to existing research platforms, making large-scale deployment financially feasible. Federated learning architecture, although validated in simulated environment, shows privacy-preserving multi-institutional collaboration is technically feasible while complying with GDPR requirements.
Critical difference between present work and existing systems such as ORCATECH and SENDA is that it is complementary rather than competitive. These platforms have demonstrated clinical value through decades of longitudinal studies with thousands of participants. Present work does not claim clinical validation—experiment is technological assessment, not clinical trial. Contribution is creating next-generation technical foundation requiring same rigorous clinical evaluation to prove diagnostic and prognostic effectiveness.
If future clinical validation confirms effectiveness, proposed architecture has potential to transform early dementia detection by shifting focus from episodic clinical visits to continuous, home-based monitoring. Present work shows technical and economic constraints are no longer major barriers; what remains is need for clinical validation through longitudinal studies with established cognitive assessments, reference neuropsychological diagnosis, and proven diagnostic value in real clinical settings.
Immediate next step is conducting IRB-approved pilot study with 50–100 participants (MCI and healthy controls) over 6–12 months, followed by clinical validation at multiple institutions and relevant regulatory process for implementation.
Supplementary Materials
The following supporting information can be downloaded at the website of this paper posted on Preprints.org, Figure S1: Access to the home Wi-Fi network; Figure S2: BLE packets sent by wearable devices; Figure S3: Example data from Stream 1; Figure S4: Example data from Stream 2; Figure S5: Example data from Stream 3.
References
- World Health Organization. Dementia. Retrieved from https://www.who.int/news-room/fact-sheets/detail/dementia, 2023.
- McKhann, G.M.; Knopman, D.S.; Chertkow, H.; Hyman, B.T.; Jack, C.R.; Kawas, C.H.; Klunk, W.E.; Koroshetz, W.J.; Manly, J.J.; Mayeux, R.; et al. The Diagnosis of Dementia Due to Alzheimer’s Disease: Recommendations from the National Institute on Aging-Alzheimer’s Association Workgroups on Diagnostic Guidelines for Alzheimer’s Disease. Alzheimer’s and Dementia 2011, 7, 263–269. [CrossRef]
- Takahashi, T.; Nonaka, T.; Ohtani, R.; Hasegawa, M.; Hori, Y.; Tomita, T.; Kurita, R. Hindering Tau Fibrillization by Disrupting Transient Precursor Clusters. Neuroscience Research 2025, 220. [CrossRef]
- Nasreddine, Z.S.; Phillips, N.A.; Bédirian, V.; Charbonneau, S.; Whitehead, V.; Collin, I.; Cummings, J.L.; Chertkow, H. The Montreal Cognitive Assessment, MoCA: A Brief Screening Tool for Mild Cognitive Impairment. Journal of the American Geriatrics Society 2005, 53, 695–699. [CrossRef]
- Jack, C.R.; Bennett, D.A.; Blennow, K.; Carrillo, M.C.; Dunn, B.; Haeberlein, S.B.; Holtzman, D.M.; Jagust, W.; Jessen, F.; Karlawish, J.; et al. NIA-AA Research Framework: Toward a Biological Definition of Alzheimer’s Disease. Alzheimer’s and Dementia 2018, 14, 535–562.
- Dubois, B.; Hampel, H.; Feldman, H.H.; Scheltens, P.; Aisen, P.; Andrieu, S.; Bakardjian, H.; Benali, H.; Bertram, L.; Blennow, K.; et al. Preclinical Alzheimer’s Disease: Definition, Natural History, and Diagnostic Criteria. Alzheimer’s and Dementia 2016, 12, 292–323.
- Kaye, J.; Mattek, N.; Dodge, H.H.; Campbell, I.; Hayes, T.; Austin, D.; Hatt, W.; Wild, K.; Jimison, H.; Pavel, M. Unobtrusive Measurement of Daily Computer Use to Detect Mild Cognitive Impairment. Alzheimer’s and Dementia 2014, 10, 10–17. [CrossRef]
- Müller, K.; Fröhlich, S.; Germano, A.M.C.; Kondragunta, J.; Agoitia Hurtado, M.F.D.C.; Rudisch, J.; Schmidt, D.; Hirtz, G.; Stollmann, P.; Voelcker-Rehage, C. Sensor-Based Systems for Early Detection of Dementia (SENDA): A Study Protocol for a Prospective Cohort Sequential Study. BMC Neurology 2020, 20. [CrossRef]
- Jonell, P.; Moëll, B.; Håkansson, K.; Henter, G.E.; Kuchurenko, T.; Mikheeva, O.; Hagman, G.; Holleman, J.; Kivipelto, M.; Kjellström, H.; et al. Multimodal Capture of Patient Behaviour for Improved Detection of Early Dementia: Clinical Feasibility and Preliminary Results. Frontiers in Computer Science 2021, 3. [CrossRef]
- Yurdem, B.; Kuzlu, M.; Gullu, M.K.; Catak, F.O.; Tabassum, M. Federated Learning: Overview, Strategies, Applications, Tools and Future Directions. Heliyon 2024, 10.
- Li, H.; Li, C.; Wang, J.; Yang, A.; Ma, Z.; Zhang, Z.; Hua, D. Review on Security of Federated Learning and Its Application in Healthcare. Future Generation Computer Systems 2023, 144, 271–290. [CrossRef]
- Hasan, M.M. Federated Learning Models for Privacy-Preserving Ai in Enterprise Decision Systems. International Journal of Business and Economics Insights 2025, 05, 238–269. [CrossRef]
- Addae, S.; Kim, J.; Smith, A.; Rajana, P.; Kang, M. Smart Solutions for Detecting, Predicting, Monitoring, and Managing Dementia in the Elderly: A Survey. IEEE Access 2024, 12, 100026–100056. [CrossRef]
- Thaliath, A.; Pillai, J.A. Non-Cognitive Symptoms in Alzheimer’s Disease and Their Likely Impact on Patient Outcomes. A Scoping Review. Current Treatment Options in Neurology 2025, 27.
- Ghayvat, H.; Gope, P. Smart Aging Monitoring and Early Dementia Recognition (SAMEDR): Uncovering the Hidden Wellness Parameter for Preventive Well-Being Monitoring to Categorize Cognitive Impairment and Dementia in Community-Dwelling Elderly Subjects through AI. Neural Computing and Applications 2023, 35, 23739–23751.
- Deters, J. K.; Janus, S.; Silva, J.A.L.; Wörtche, H.J.; Zuidema, S.U. Sensor-Based Agitation Prediction in Institutionalized People with Dementia A Systematic Review. Pervasive and Mobile Computing 2024, 98.
- Anikwe, C. V.; Friday Nweke, H.; Chukwu Ikegwu, A.; Adolphus Egwuonwu, C.; Uchenna Onu, F.; Rita Alo, U.; Wah Teh, Y. Mobile and Wearable Sensors for Data-Driven Health Monitoring System: State-of-the-Art and Future Prospect. Expert Systems with Applications 2022, 202.
- Gabrielli, D.; Prenkaj, B.; Velardi, P.; Faralli, S. AI on the Pulse: Real-Time Health Anomaly Detection with Wearable and Ambient Intelligence. In Proceedings of the CIKM 2025 - Proceedings of the 34th ACM International Conference on Information and Knowledge Management; 2025; pp. 4717–4721.
- Assaad, R.H.; Mohammadi, M.; Poudel, O. Developing an Intelligent IoT-Enabled Wearable Multimodal Biosensing Device and Cloud-Based Digital Dashboard for Real-Time and Comprehensive Health, Physiological, Emotional, and Cognitive Monitoring Using Multi-Sensor Fusion Technologies. Sensors and Actuators A: Physical 2025, 381. [CrossRef]
- Teoh, J.R.; Dong, J.; Zuo, X.; Lai, K.W.; Hasikin, K.; Wu, X. Advancing Healthcare through Multimodal Data Fusion: A Comprehensive Review of Techniques and Applications. PeerJ Computer Science 2024, 10.
- Johnson, B.B. Noninvasive Patient Monitoring With Ambient Sensors To Monitor Physical and Cognitive Health for Individuals Living With Alzheimer’S Disease. In Proceedings of the Proceedings of the 2024 Design of Medical Devices Conference, DMD 2024; 2024.
- Bijlani, N.; Maldonado, O.M.; Nilforooshan, R.; Barnaghi, P.; Kouchaki, S. Utilizing Graph Neural Networks for Adverse Health Detection and Personalized Decision Making in Sensor-Based Remote Monitoring for Dementia Care. Computers in Biology and Medicine 2024, 183. [CrossRef]
- Obeidat, H.; Shuaieb, W.; Obeidat, O.; Abd-Alhameed, R. A Review of Indoor Localization Techniques and Wireless Technologies. Wireless Personal Communications 2021, 119, 289–327.
- Leitch, S.G.; Ahmed, Q.Z.; Abbas, W. Bin; Hafeez, M.; Laziridis, P.I.; Sureephong, P.; Alade, T. On Indoor Localization Using WiFi, BLE, UWB, and IMU Technologies. Sensors (Basel, Switzerland) 2023, 23. [CrossRef]
- Casha, O. A Comparative Analysis and Review of Indoor Positioning Systems and Technologies. In Innovations in Indoor Positioning Systems (IPS); 2024.
- Biehl, J.T.; Girgensohn, A.; Patel, M. Achieving Accurate Room-Level Indoor Location Estimation with Emerging IoT Networks. In Proceedings of the ACM International Conference Proceeding Series; 2019.
- García-Paterna, P.J.; Martínez-Sala, A.S.; Sánchez-Aarnoutse, J.C. Empirical Study of a Room-Level Localization System Based on Bluetooth Low Energy Beacons. Sensors 2021, 21. [CrossRef]
- Chen, Y.; Wang, Y.; Zhao, Y. A Room-Level Indoor Localization Using an Energy-Harvesting BLE Tag. Electronics (Switzerland) 2024, 13. [CrossRef]
- Karabey Aksakalli, I.; Bayındır, L. Enhancing Indoor Localization with Room-to-Room Transition Time: A Multi-Dataset Study. Applied Sciences (Switzerland) 2025, 15. [CrossRef]
- Tegou, T.; Kalamaras, I.; Votis, K.; Tzovaras, D. A Low-Cost Room-Level Indoor Localization System with Easy Setup for Medical Applications. In Proceedings of the Proceedings of the 2018 11th IFIP Wireless and Mobile Networking Conference, WMNC 2018; 2018.
- Alzu’Bi, A.; Alomar, A.; Alkhaza’Leh, S.; Abuarqoub, A.; Hammoudeh, M. A Review of Privacy and Security of Edge Computing in Smart Healthcare Systems: Issues, Challenges, and Research Directions. Tsinghua Science and Technology 2024, 29, 1152–1180. [CrossRef]
- Islam, U.; Alatawi, M.N.; Alqazzaz, A.; Alamro, S.; Shah, B.; Moreira, F. A Hybrid Fog-Edge Computing Architecture for Real-Time Health Monitoring in IoMT Systems with Optimized Latency and Threat Resilience. Scientific Reports 2025, 15. [CrossRef]
- Rancea, A.; Anghel, I.; Cioara, T. Edge Computing in Healthcare: Innovations, Opportunities, and Challenges. Future Internet 2024, 16.
- Ali, M. S., Ahsan, M. M., Tasnim, L., Afrin, S., Biswas, K., Hossain, M. M., ... & Raman, S. Federated Learning in Healthcare: Model Misconducts, Security, Challenges, Applications, and Future Research Directions--A Systematic Review. arXiv preprint arXiv:2405.13832 2024.
- Pati, S.; Kumar, S.; Varma, A.; Edwards, B.; Lu, C.; Qu, L.; Wang, J.J.; Lakshminarayanan, A.; Wang, S. han; Sheller, M.J.; et al. Privacy Preservation for Federated Learning in Health Care. Patterns 2024, 5.
- Dhade, P.; Shirke, P. Federated Learning for Healthcare: A Comprehensive Review. Engineering Proceedings 2023, 59. [CrossRef]
- Lyons, B.E.; Austin, D.; Seelye, A.; Petersen, J.; Yeargers, J.; Riley, T.; Sharma, N.; Mattek, N.; Wild, K.; Dodge, H.; et al. Pervasive Computing Technologies to Continuously Assess Alzheimer’s Disease Progression and Intervention Efficacy. Frontiers in Aging Neuroscience 2015, 7. [CrossRef]
- Gothard, S.; Nunnerley, M.; Rodrigues, N.; Wu, C.Y.; Mattek, N.; Hughes, A.M.; Kaye, J.A.; Beattie, Z. Study Participant Self-Installed Deployment of a Home-Based Digital Assessment Platform for Dementia Research. Alzheimer’s & dementia: the journal of the Alzheimer’s Association 2021, 17, e055724. [CrossRef]
- Narasimhan, R.; Gopalan, M.; Sikkandar, M.Y.; Alassaf, A.; AlMohimeed, I.; Alhussaini, K.; Aleid, A.; Sheik, S.B. Employing Deep-Learning Approach for the Early Detection of Mild Cognitive Impairment Transitions through the Analysis of Digital Biomarkers. Sensors (Basel, Switzerland) 2023, 23. [CrossRef]
- Kim, J.; Cheon, S.; Lim, J. IoT-Based Unobtrusive Physical Activity Monitoring System for Predicting Dementia. IEEE Access 2022, 10, 26078–26089. [CrossRef]
- Beutel, D.J.; Topal, T.; Mathur, A.; Qiu, X.; Fernandez-Marques, J.; Gao, Y.; Sani, L.; Li, K.H.; Parcollet, T.; de Gusmão, P.P.B.; et al. Flower: A Friendly Federated Learning Research Framework. arXiv preprint arXiv:2007.14390 2022.
Figure 1.
Hardware components.
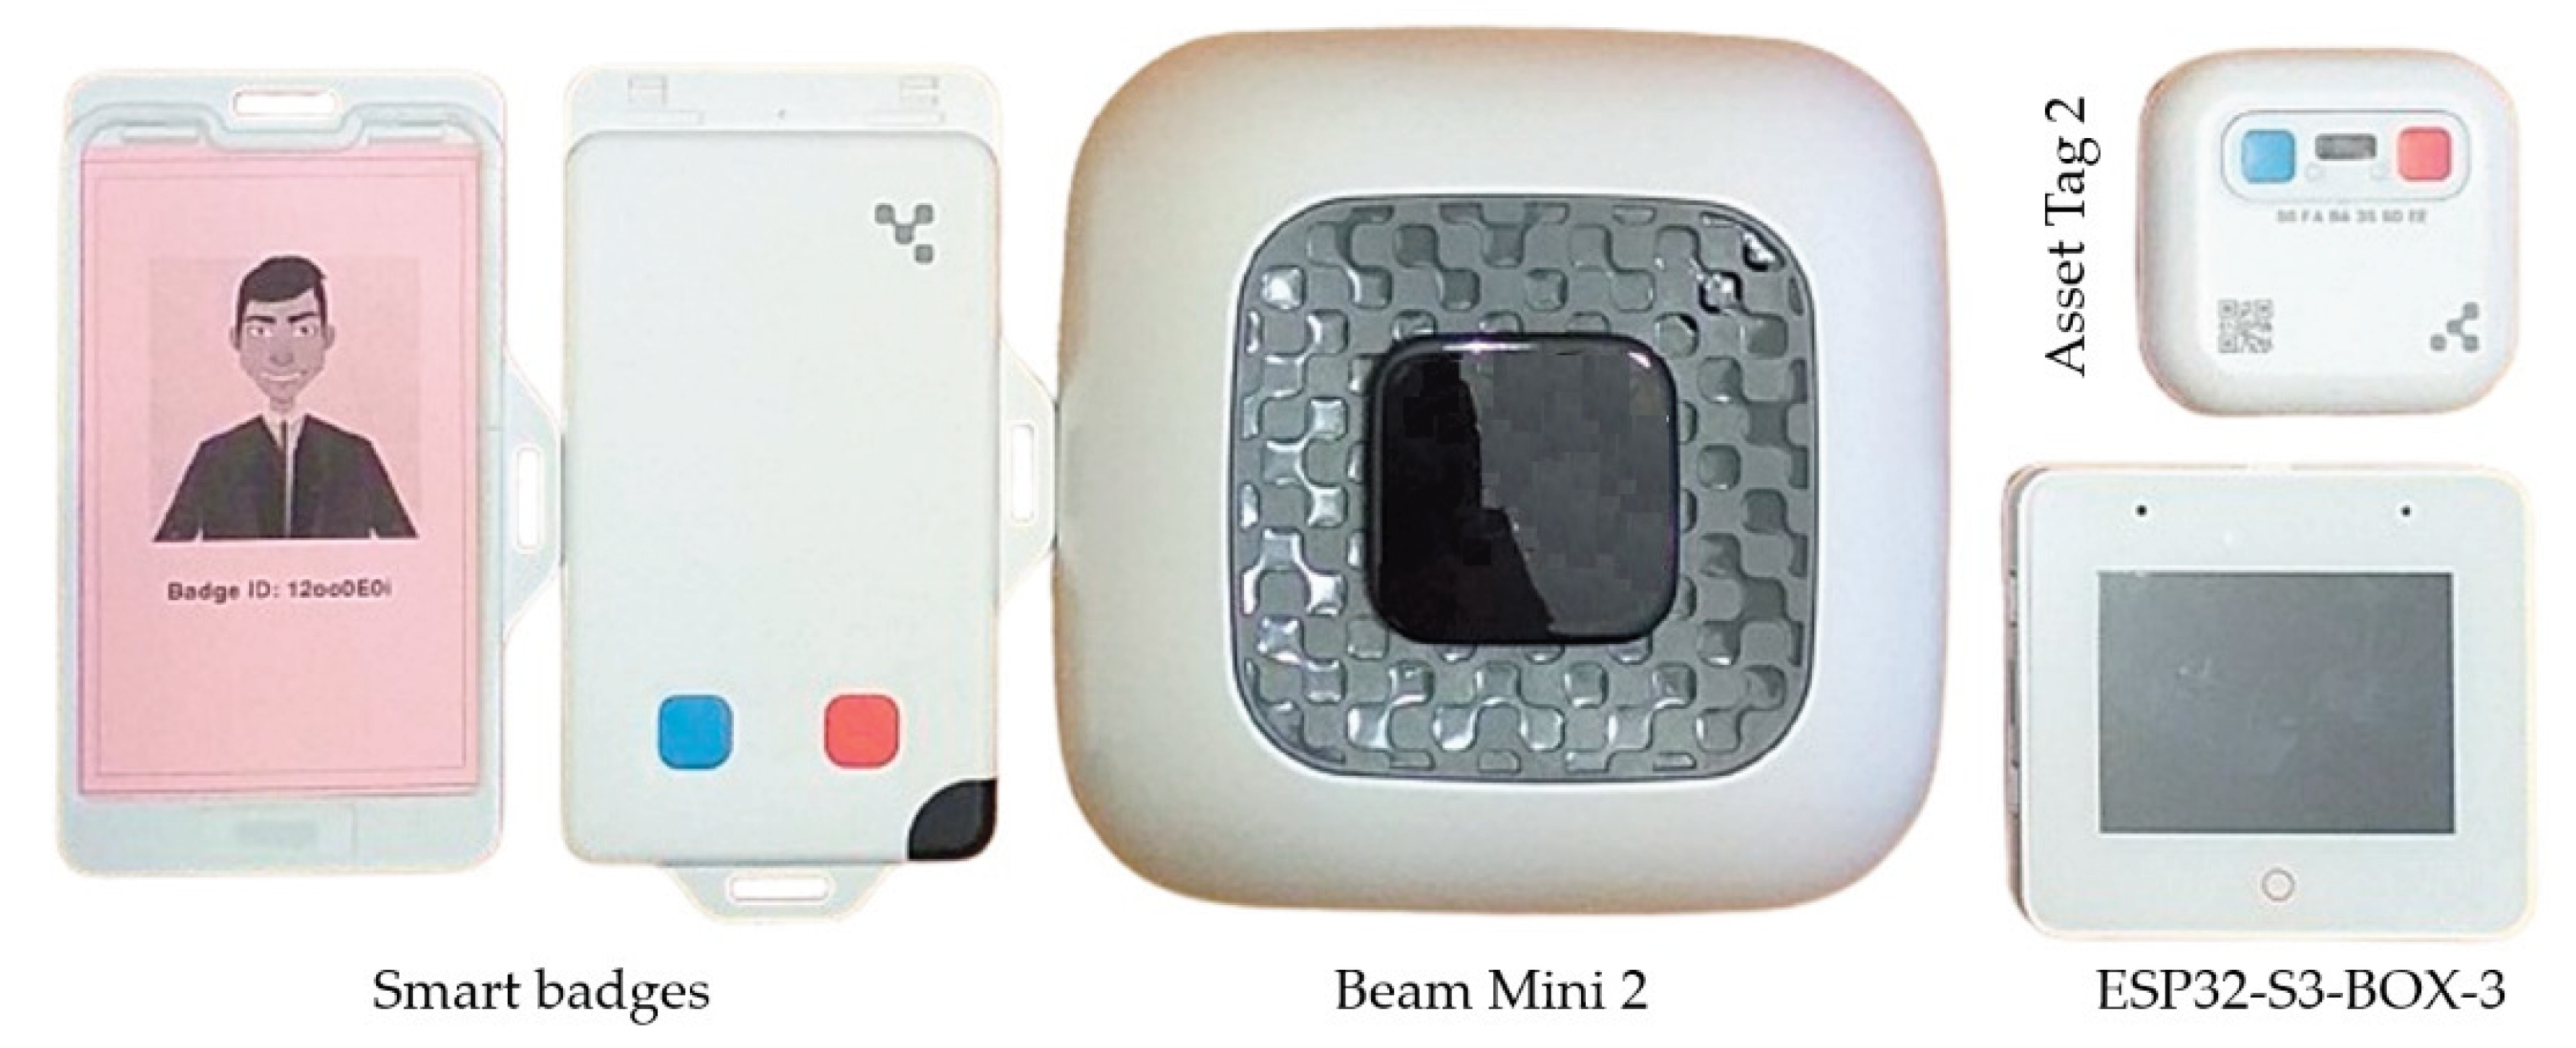
Figure 2.
Summary block diagram of the data flow architecture.
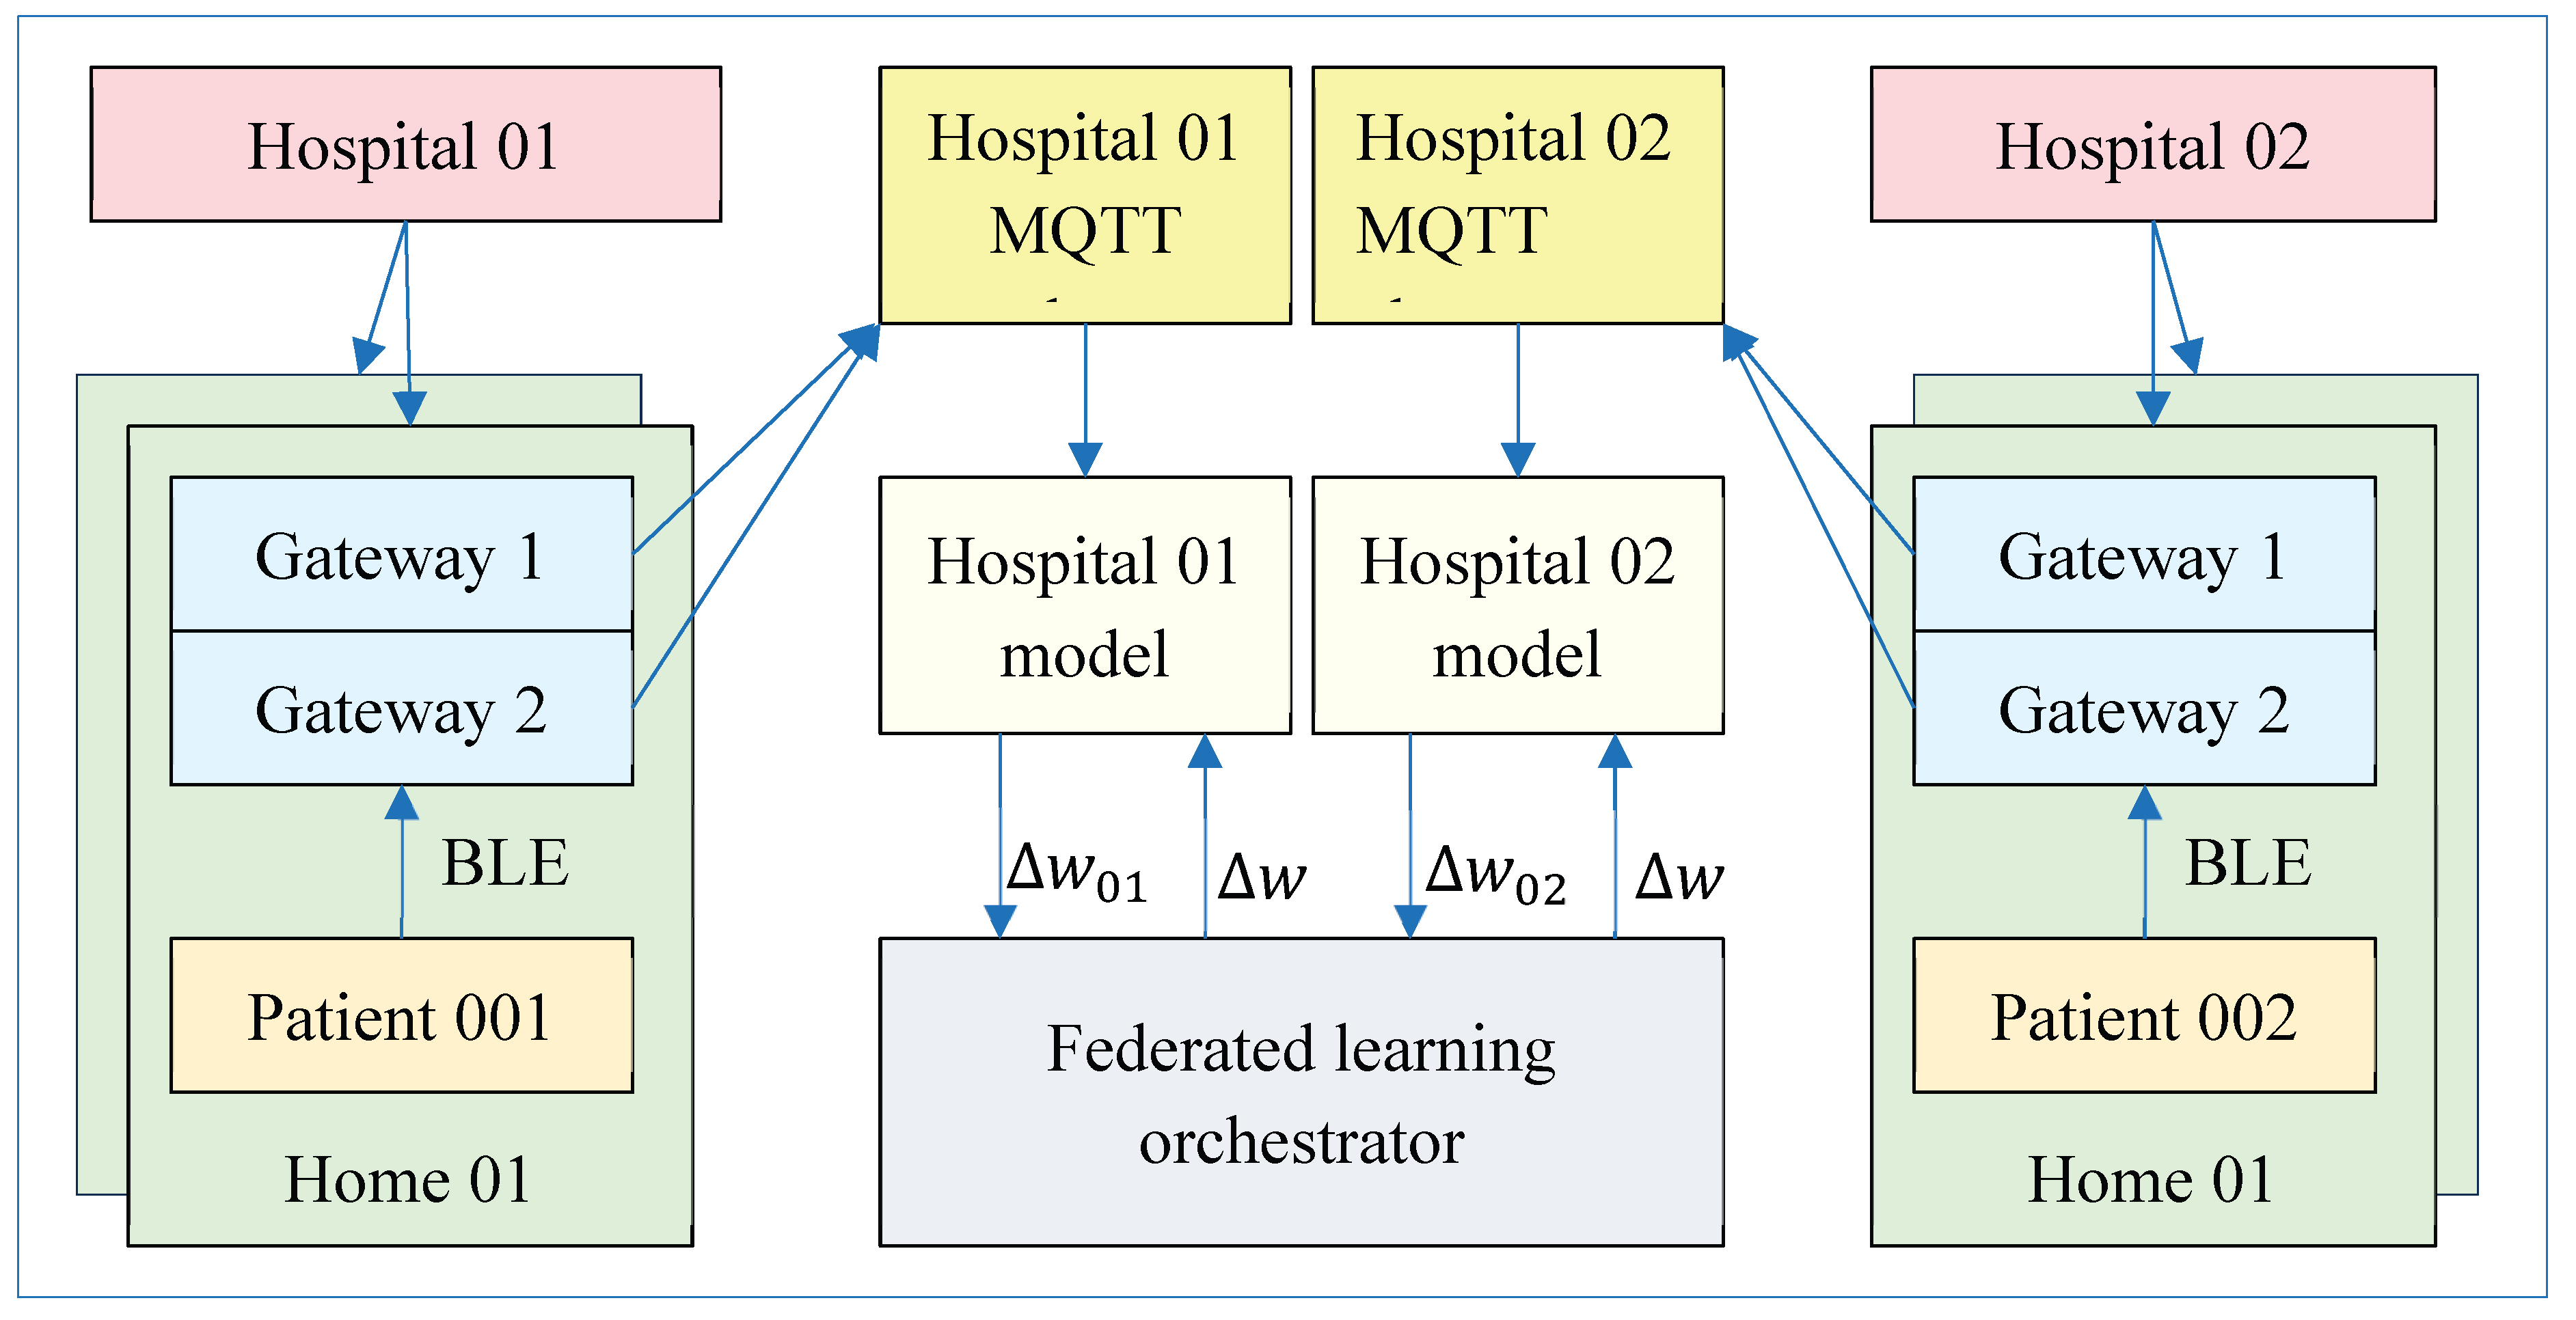
Figure 3.
Theoretical analysis of IR localization: a) dependence of accuracy on the emission interval; b) dependence on the emission angle of the beacon.
Figure 3.
Theoretical analysis of IR localization: a) dependence of accuracy on the emission interval; b) dependence on the emission angle of the beacon.
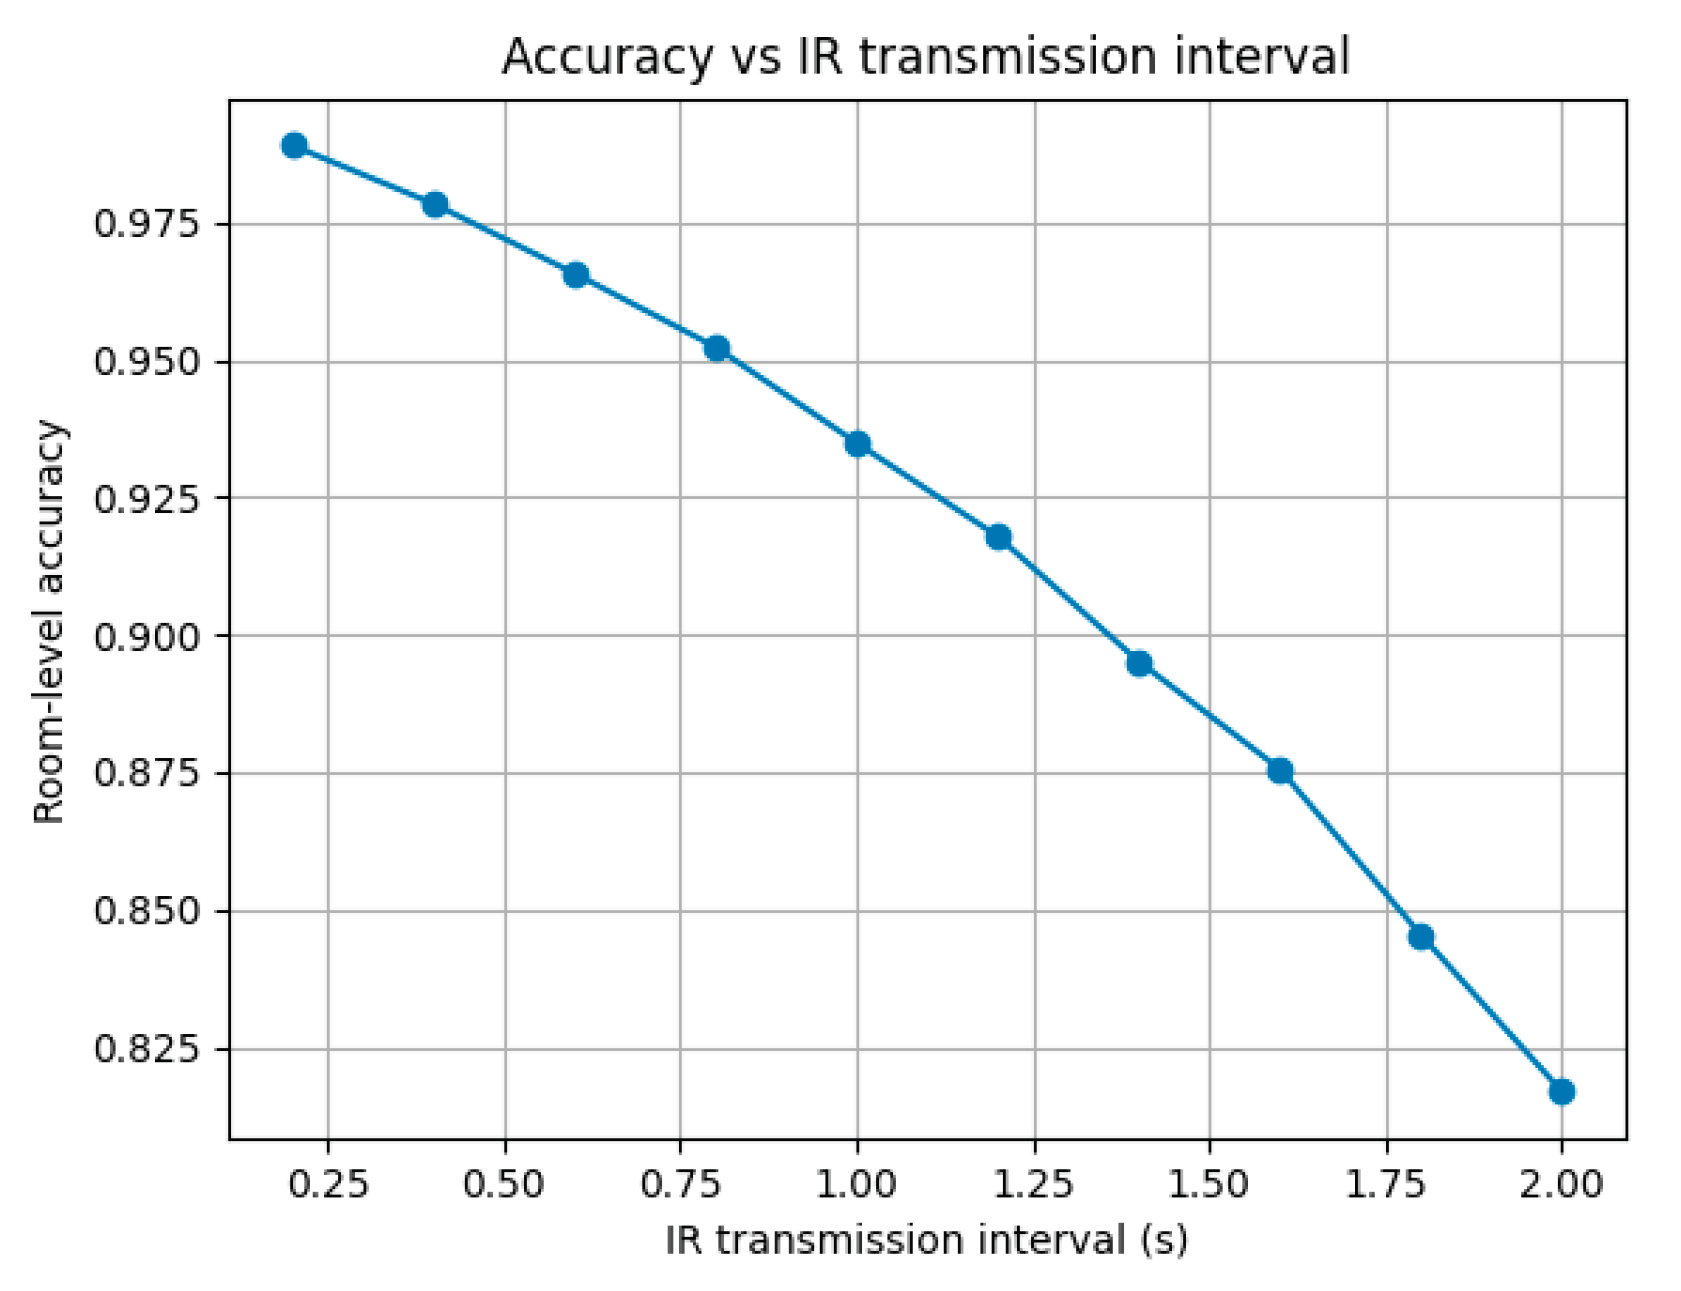
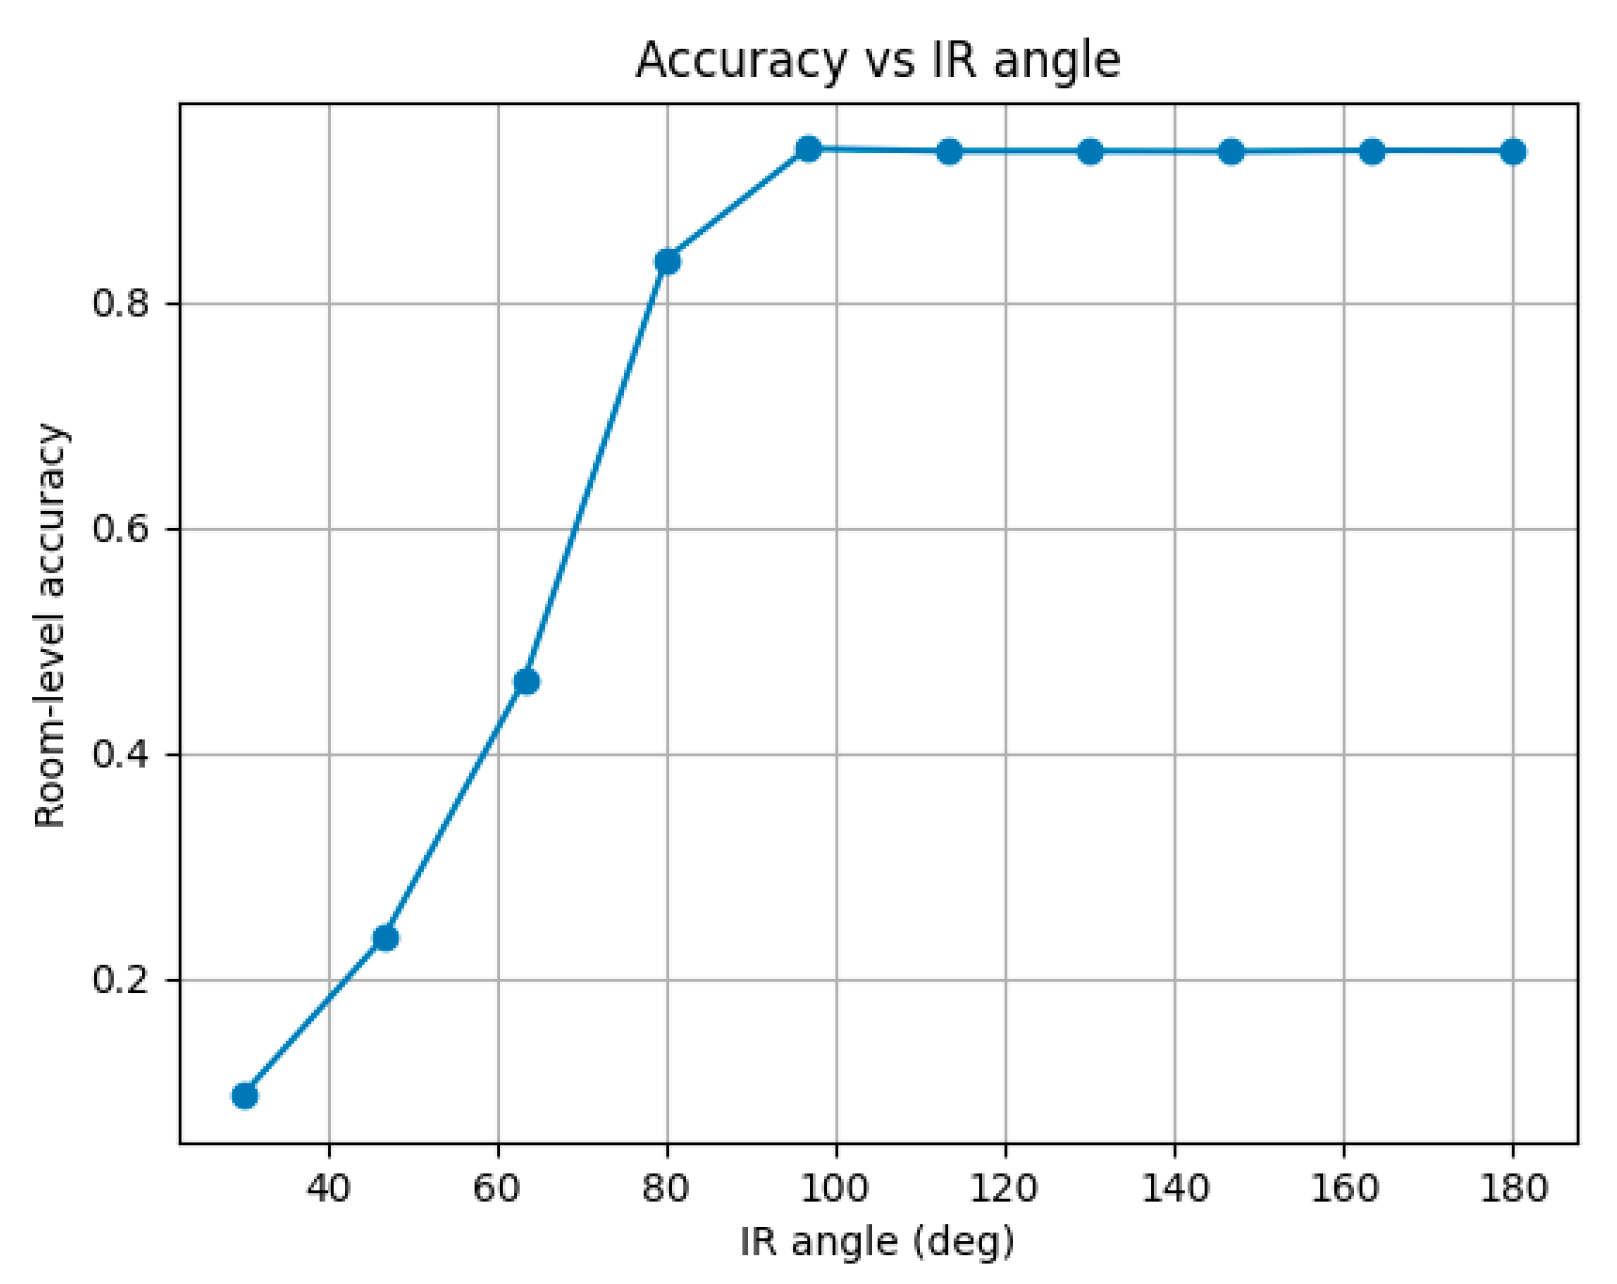
Figure 4.
Federated training in a simulated environment: a) orchestrator console; b) institution console (Hospital-2).
Figure 4.
Federated training in a simulated environment: a) orchestrator console; b) institution console (Hospital-2).
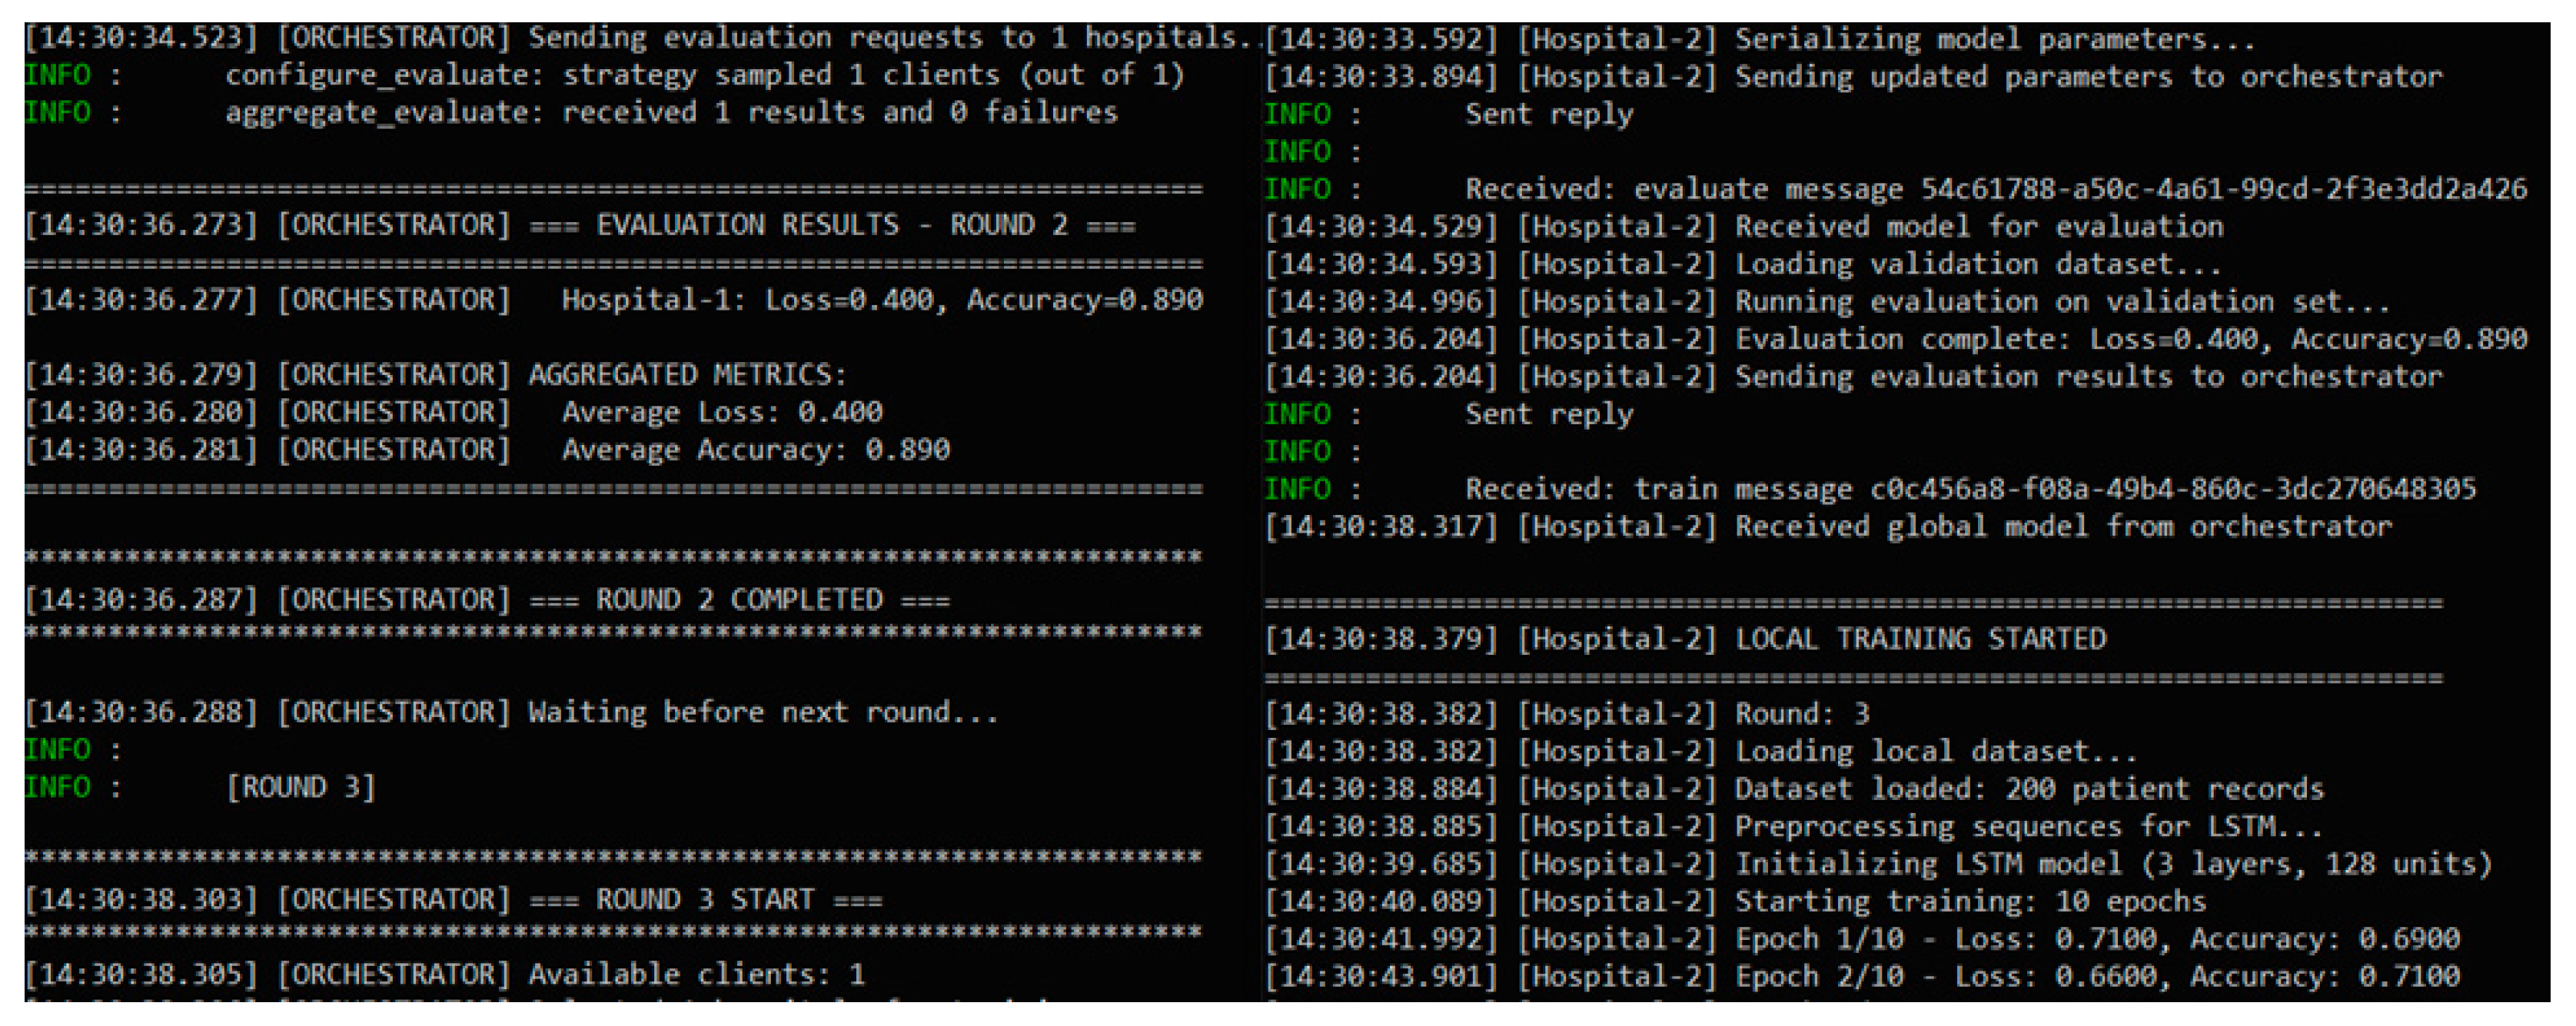
Figure 5.
Real-time visualization of data from wearable sensors.
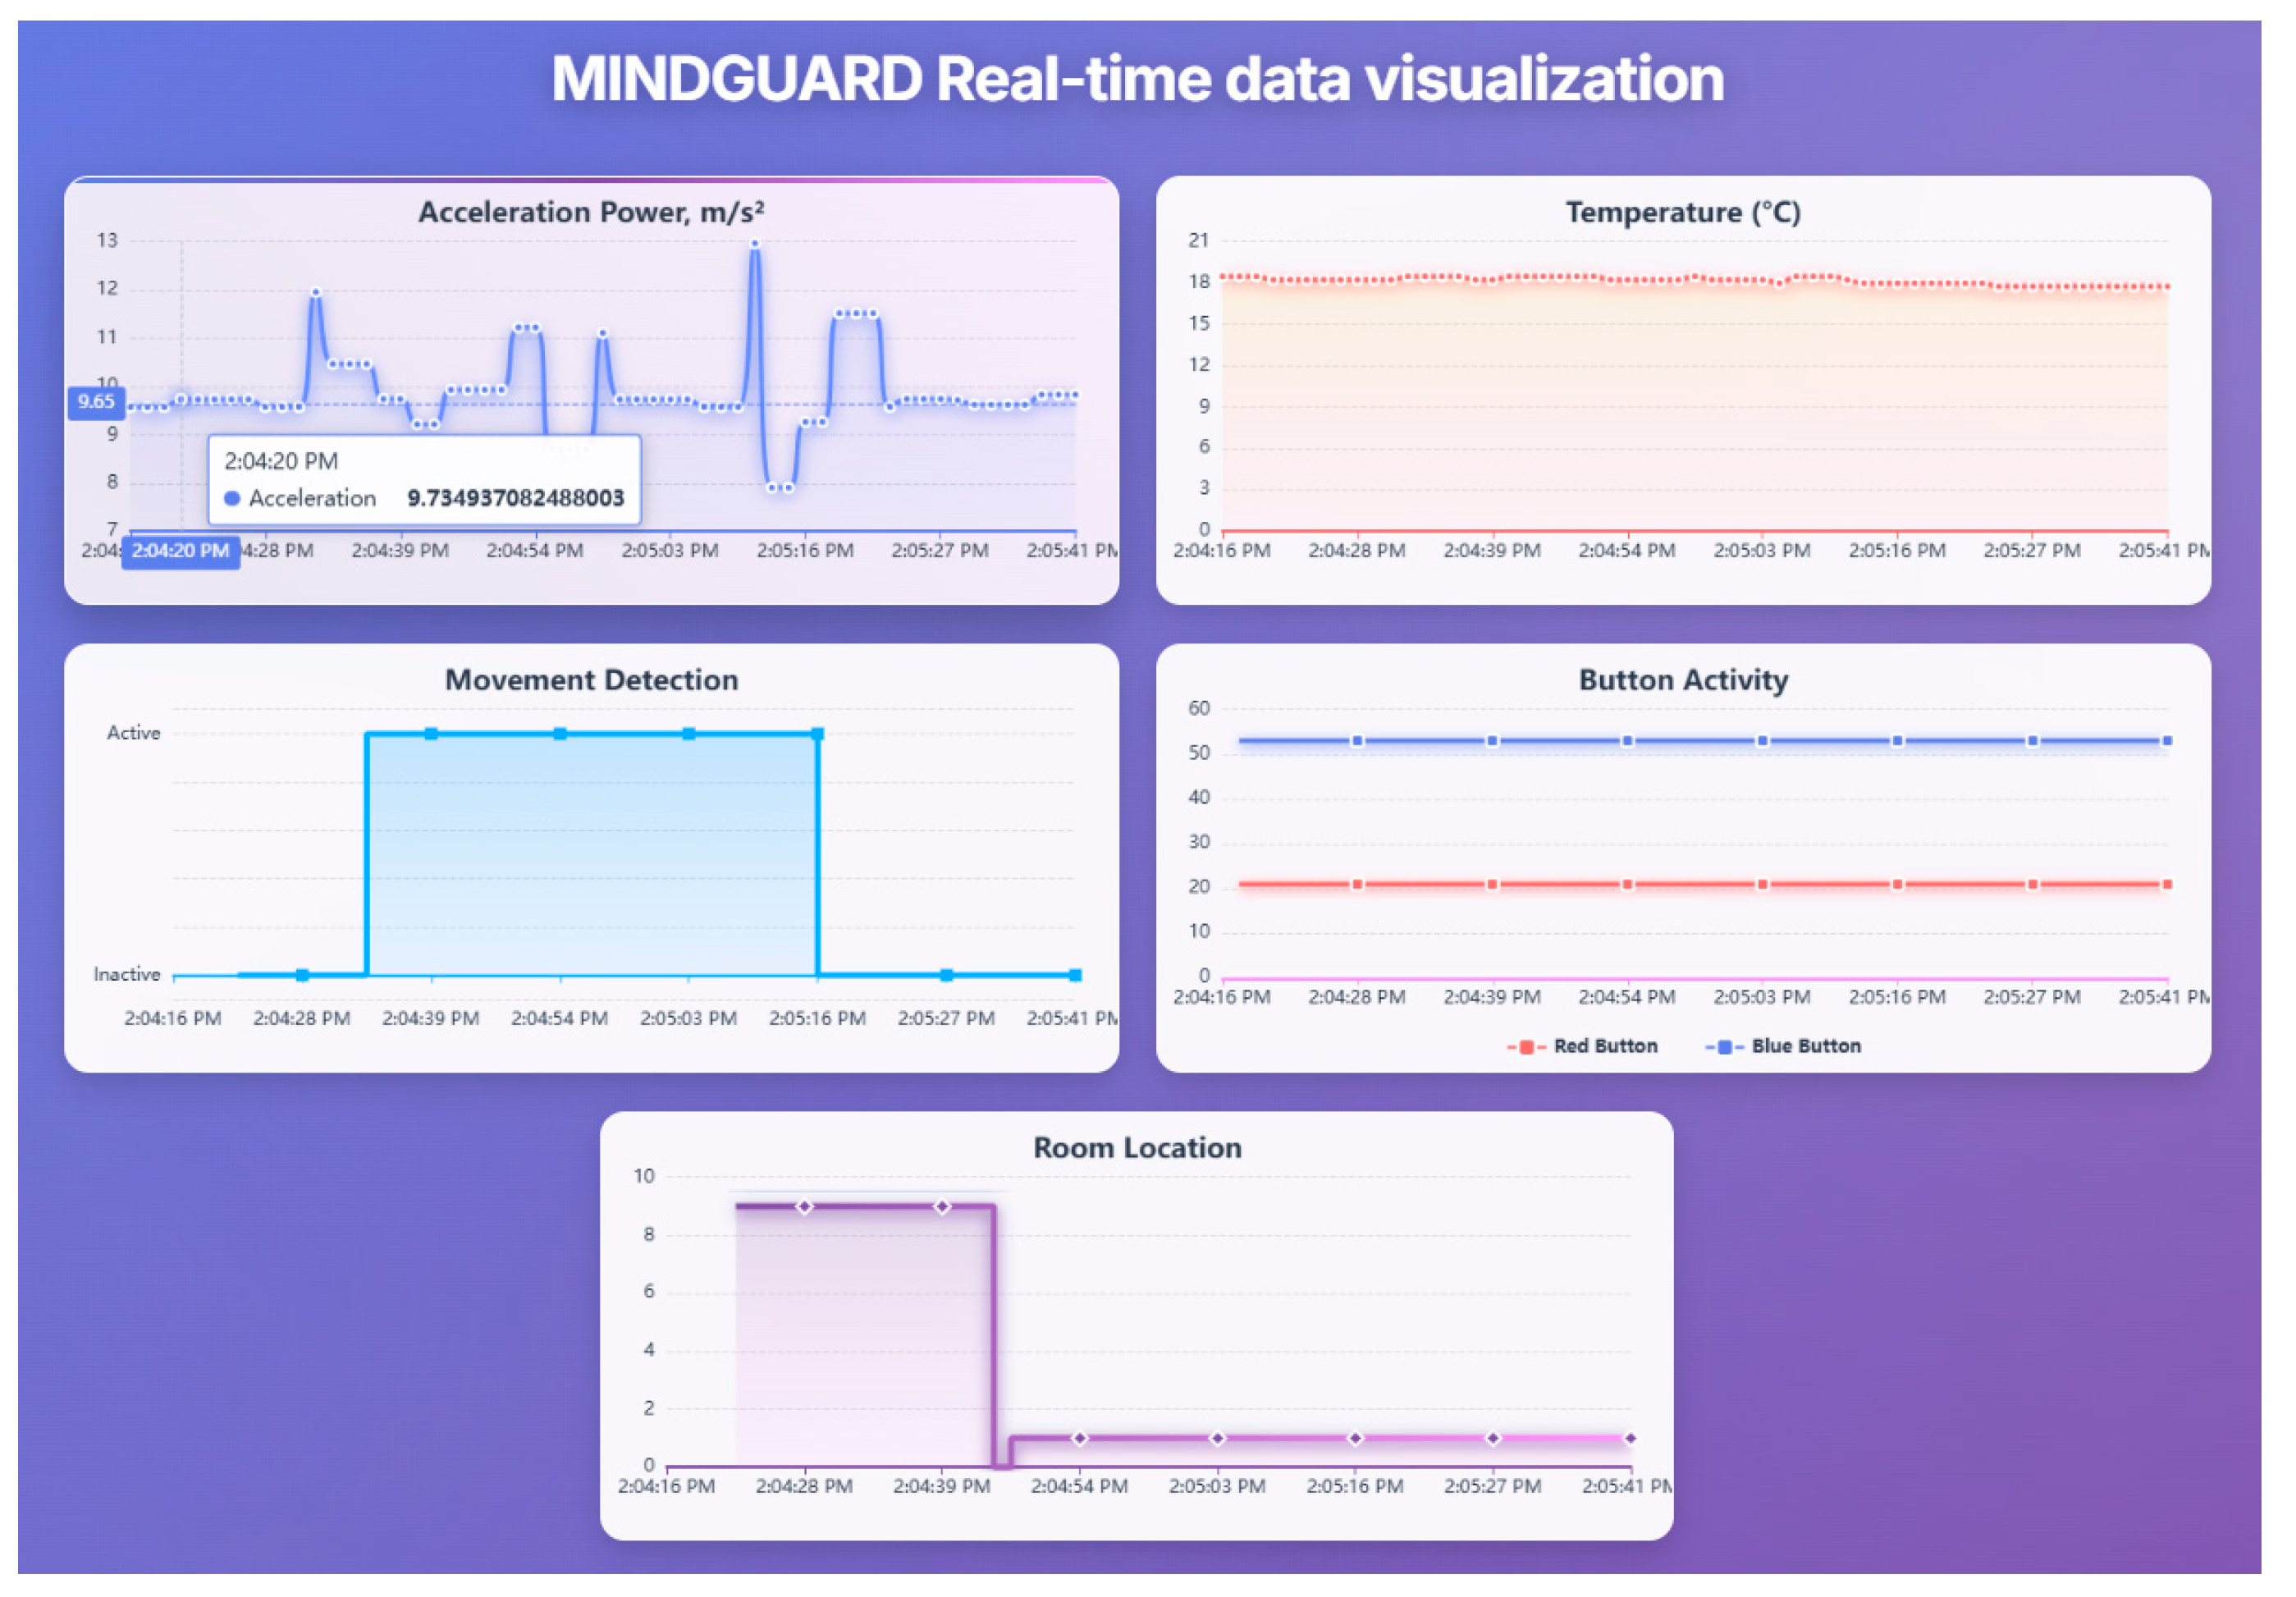

Table 1.
Comparison of Home Monitoring Systems for Dementia Assessment.
| System | Localization | Monitoring Type | Edge ML | Fed. Learning | Clinical Validation | Est. Cost | Key Limitation |
|---|---|---|---|---|---|---|---|
| ORCATECH [37,38] | Zone-level (PIR) | Passive + episodic digital | No | No | Extensive (10+ years) | Hight | Zone-level localization insufficient for disorientation |
| SENDA [8] | None | Active (periodic testing) | No | No | Ongoing protocol | Hight | Requires active participation; episodic (8-month) |
| Kim et al. [40] | Zone-level (PIR) | Passive IR only | No | No | Limited (AUC 0.99) | Medium | No wearables; zone-level only |
| Ghayvat & Gope [15] | None | Passive sensors + transfer learning | No | No | Real-world (43 weeks) | Medium | No spatial tracking |
| Bijlani et al. [22] | Ambient only | Passive graph-based | Yes | No | Real deployment (227 participant) | Medium | No wearables; no room-level |
| This work | Room-level (IR) | Passive 24/7 | Yes (ESP32-S3) | Yes (simulated) | Technical only | 490€ + 55€/month | No clinical validation yet |
Table 2.
Summary of formats and data streams.
| Stage | Format | Frequency | Size | Retention | Purpose |
|---|---|---|---|---|---|
| BLE packets (raw) | Manufacturer-specific binary | 2 Hz (telemetry), 1 Hz (location) | 20-30 bytes/packet | Transient | - |
| Stream 1 | JSON (aggregates) | 1/minute | 1.8-2.2 KB | Transient | Statistical descriptors |
| Stream 2 | JSON + gzip | 1/ minute | 1.3-1.7 KB (compressed) | Transient | Compressed event sequences |
| Stream 3 | JSON (alerts) | On-demand (~10/day) | 0.4-0.6 KB | Transient | Critical events |
| InfluxDB (hot data) | Line Protocol | 1 record/ minute | 200-300 bytes | 7 days | Real-time dashboards |
| MongoDB (event logs) | BSON (gzip blob) | 1 doc/ minute | 1.5-2 KB | 90 days | ML |
| MongoDB (critical alerts) | BSON | On-demand (~10/day) | 0.5-0.8 KB | Unlimited period | Audit trail |
| MongoDB (hourly aggregates) | BSON | 1 doc/hour | 2.5-3 KB | 90 days | Fast ML |
| MongoDB (daily summaries) | BSON | 1 doc/day | 2-3 KB | Unlimited period | Baseline models, reports |
Table 3.
RSSI characteristics under different propagation conditions.
| Distance | Condition | Average RSSI (dBm) | σ (dBm) | Attenuation |
|---|---|---|---|---|
| 1 m | Reference | -69 | 2 | - |
| 5 m | Line-of-sight | -70 | 3 | ~1 dB |
| 5 m | One wall | -76 | 4-5 | 6-8 dB |
| 5 m | One wall | -76 | 4-5 | 6-8 dB |
| 15 m | One wall | -91 | 7 | ~22 dB |
Table 4.
Characteristics of compressed data streams.
| Stream | Compression | Size | Reduction | Temporal Resolution | Lossless |
|---|---|---|---|---|---|
| Baseline (raw BLE) | None | 5,160 B | - | 1 s | yes |
| Stream 1 (aggregates) | Statistical | 2,000 B | 61.2% | 60 s | no |
| Stream 3 (aggregates) | Diff + gzip | 1,036 B | 79.9% | 1 s | yes |
| Stream 1 (alarms) | Contextual enrichment | 500 B | On-demand | Event | yes |
| Combined (Stream1+Stream2) | Hybrid | 3,036 B | 41.2% | Hybrid | Partial |
Disclaimer/Publisher’s Note: The statements, opinions and data contained in all publications are solely those of the individual author(s) and contributor(s) and not of MDPI and/or the editor(s). MDPI and/or the editor(s) disclaim responsibility for any injury to people or property resulting from any ideas, methods, instructions or products referred to in the content. |
© 2026 by the authors. Licensee MDPI, Basel, Switzerland. This article is an open access article distributed under the terms and conditions of the Creative Commons Attribution (CC BY) license (http://creativecommons.org/licenses/by/4.0/).
Copyright: This open access article is published under a Creative Commons CC BY 4.0 license, which permit the free download, distribution, and reuse, provided that the author and preprint are cited in any reuse.


