Submitted:
14 January 2026
Posted:
16 January 2026
You are already at the latest version
Abstract
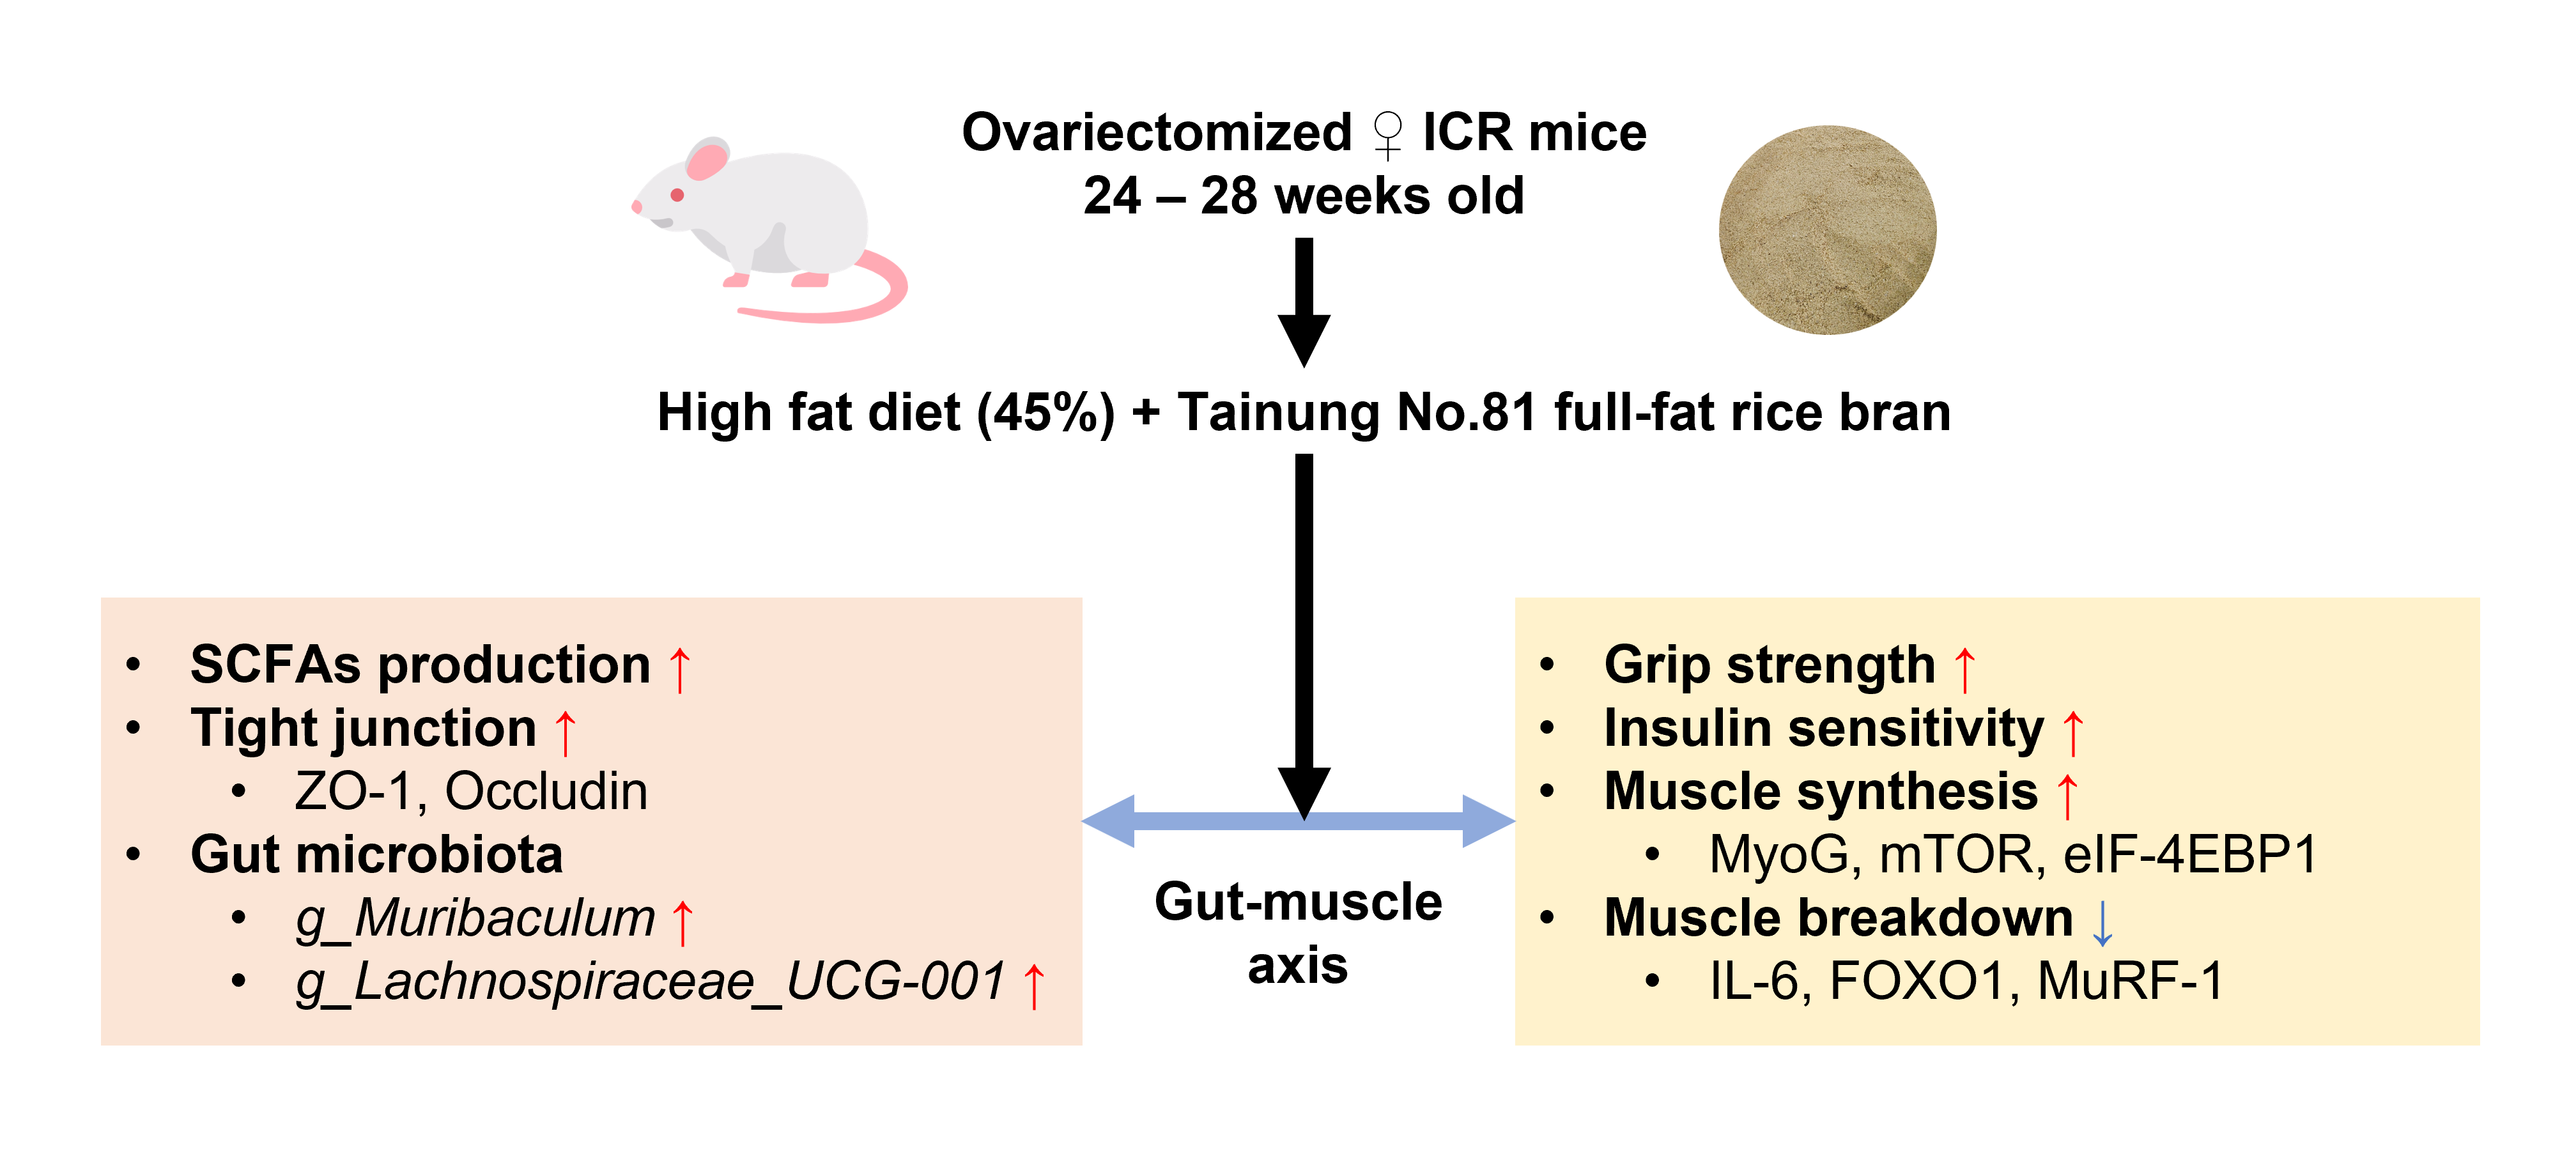
The study aims to investigate the effect of full-fat rice bran (FFRB; Tainung No. 81, Taiwan) at various doses on insulin resistance, muscle atrophy, and gut microbiome in ovariectomized (OVX) mice fed a high-fat diet (HFD). Thirty-six female ICR mice were grouped into six: young sham-operated mice fed an AIN-93M diet, OVX mice fed an AIN-93M diet, OVX mice fed a HFD, and OVX mice fed a HFD with 5%, 10%, and 20% FFRB. FFRB intervention attenuated HFD-induced weight gain and visceral fat accumulation, improved insulin resistance, and enhanced grip strength in OVX mice. Notably, 20% FFRB significantly upregulated muscle protein synthesis genes (MyoG, mTOR, eIF-4EBP1) and downregulated muscle atrophy markers (FOXO1, MuRF-1), while reducing the inflammatory cytokine IL-6. 20% FFRB also improved gut barrier integrity by upregulating colonic tight junction genes (Occludin and ZO-1) and increased the abundance of SCFAs-producing bacteria Muribaculum genus. 10% FFRB significantly downregulated FOXO1 and increased the abundance of Lachnospiraceae_UCG-001 genus. In conclusion, FFRB intervention, particularly at 20%, effectively mitigated HFD-induced insulin resistance and muscle atrophy, potentially through modulation of gut microbiota and enhancement of gut barrier function.
Keywords:
full-fat rice bran
; insulin resistance
; muscle atrophy
; gut microbiome
; ovariectomized mice
; high-fat diet
1. Introduction
Postmenopausal occurs when menstruation has ceased for over a year. Women normally experience menopause between the ages of 45 and 55 due to estrogen deficiency [1]. The decline in estrogen levels promotes visceral fat accumulation, leading to obesity, glucose intolerance, and dyslipidemia, collectively known as metabolic syndrome [2]. In women, muscle mass and function gradually decline beginning around the age of 50, with an estimated loss of about 0.6% per year after menopause, and exacerbating after the age of 60 [3]. Muscle strength also decreases by approximately 15% every decade [4]. Menopausal women are particularly prone to muscle loss compared to men of the same age due to reduced estrogen levels [5], particularly estradiol, which plays an important role in maintaining muscle mass and limiting inflammation-induced damage to skeletal muscle [6]. Estradiol receptors have been identified in skeletal muscle fibers [7], and thus, a decline in estrogen levels further accelerates the progression of muscle atrophy in postmenopausal women [8].
Aging is another factor contributing to metabolic disturbances and muscle atrophy, as it is associated with chronic low-grade inflammation and elevated circulating pro-inflammatory cytokines, such as interleukin-6 (IL-6) and tumor necrosis factor-α (TNF-α) [9]. High-fat diet (HFD)-induced obesity promotes insulin resistance and further worsens systemic inflammation, which has been shown to disrupt intestinal permeability [10], resulting in reduced gut microbial diversity and richness [11]. This gut dysbiosis exacerbates metabolic dysfunction and may impair protein turnover, thereby contributing to muscle atrophy in the elderly through mechanisms involving inflammation, oxidative stress, and altered short-chain fatty acid (SCFA) production [12,13,14]. Acetate, propionate, and butyrate are the three major SCFAs produced by gut microbiota, predominantly in cecum and proximal colon [15]. Besides maintaining colonic health and microbial balance, SCFAs also influence glucose and energy homeostasis. Recent evidence has highlighted their protective effects against muscle atrophy via mitochondrial activity, glucose homeostasis and insulin sensitivity, and modulation of inflammation and oxidative stress [16].
Muscle mass is tightly regulated by a balance between anabolic and catabolic signaling pathways, which control protein synthesis and degradation. Insulin and insulin-like growth factor 1 (IGF-1) support muscle growth through the IGF-1/Akt /protein kinase B and mechanistic target of rapamycin (mTOR) pathways, which regulate muscle mass and protein synthesis [17,18]. In contrast, muscle atrophy is driven by interleukins activating the nuclear factor kappa B (NF-κB) pathway and by the upregulation of key ubiquitin E3 ligases, such as MAFbx/atrogin-1 and muscle RING-finger protein-1 (MuRF-1) [17,18,19]. Other pathways, including p38 mitogen-activated protein kinases (p38MAPK), NF-κB, forkhead box protein O (FOXO), and Janus kinase-signal transducer and activator of transcription (JAK-STAT), are also implicated in promoting muscle degradation [17]. These findings suggest that promoting anabolic activity while suppressing inflammation may serve as an effective intervention to mitigate muscle atrophy.
Rice is an important staple food consumed worldwide, especially in Asia [20]. Rice bran, a brown outer layer of rice kernel, is a by-product of rice milling [20], with global production reaching nearly 23.80 million tons in 2014−2015 [21]. Although rice bran is often utilized as compost or animal feed [22] due to its rapid rancidification induced by the lipase enzymes [21,22], rice bran is nutritionally dense and rich in dietary fiber, phytosterols, tocotrienols and γ-oryzanol, which have been shown to lower blood pressure, improve blood lipid and insulin sensitivity, reduce inflammation and oxidative stress [22,23], regulate gut microbiota by fostering the growth of fiber-degrading, SCFAs-producing bacteria [24,25], and protect against muscle atrophy [25,26,27,28]. Our previous study demonstrated that a 12-week intervention with 10% semi-defatted mixture of Koshihikari and Hitomebore rice bran effectively maintained muscle mass in HFD-fed ovariectomized (OVX) mice by downregulating atrogin-1 and MuRF-1 expressions [26]. However, the effects of local Taiwan rice bran on skeletal muscle health during postmenopausal conditions remained unexplored. Therefore, this study aimed to investigate the effects of different doses of Tainung No.81 (TNG81) full-fat rice bran (FFRB) on insulin resistance, muscle atrophy, and gut microbiota in HFD-fed OVX mice.
2. Materials and Methods
2.1. Rice Bran Preparation
TNG81 FFRB was provided by Professor Suh-Ching Yang’s lab. The FFRB was stabilized by heating at 120 °C for 10 minutes to inactivate the lipase and lipoxygenase enzymes, thereby preventing it from becoming rancid [29,30]. The heated FFRB was cooled to room temperature and then stored at −80 °C. The nutrient contents were analyzed by SGS Taiwan (New Taipei City, Taiwan).
2.2. Animals and Study Design
Six 10-week-old young sham female ICR mice and thirty aged female ICR ovariectomized (OVX) mice (24–28 weeks old) were purchased from BioLASCO (Yilan, Taiwan). All mice were housed in Taipei Medical University Animal Centre under controlled conditions (23 ± 2 °C, 50% ± 10% humidity) with a 12/12-h light-dark cycle and had ad libitum to food (Cat. No. 5001, Laboratory Diet, USA) and water for one week of acclimation. All the experimental protocols and ethical use of animals were approved by the Institutional Animal Care and Use Committee (IACUC) of Taipei Medical University (initial protocol LAC2021-0580 was subsequently transferred to LAC2024-0031 for a study involving different dosages of full-fat rice bran intervention).
The mice were divided randomly into six groups: (1) young sham mice fed a control diet (YC), (2) OVX mice fed a control diet (OC), (3) OVX mice fed a high fat diet (OH), (4) OVX mice fed a HFD with 5% rice bran (OHR5), (5) OVX mice fed a HFD with 10% rice bran (OHR10), and (6) OVX mice fed a HFD with 20% rice bran (OHR20). The diet compositions were shown in Table 1. The fat content was 9.5% in the control diet and 45% in the HFD. Body weight was measured weekly and food intake was measured every two days. At week 11, fecal samples were collected continuously for one week and stored at −80 °C until analysis. At week 12, all mice were anesthetized and euthanized by cardiac puncture. Liver, visceral fat (perirenal and uterus adipose tissue), cecum, colon, uterus, gastrocnemius (GAS) muscle and cecal luminal contents were collected, weighed and stored at −80 °C until further analysis.
2.3. Grip Strength Measurement
The grip strength of the forelimb and four-limbs of the mice was assessed using a BIOSEB’s grip strength meter (Cat. No. BIO-GS4, Pinellas Park, FL, USA) at weeks 0 and 11. The mean of the grip strength was calculated.
2.4. Intraperitoneal Glucose Tolerance Test
IPGTT was conducted at week 11. The mice were administered 1 g/kg BW of 20% glucose (Sigma-Aldrich, Cas No. 50-99-7, St. Louis, Missouri, U.S.) via i.p. injection after a 12-hour fast. Blood was collected from the tail vein at 0, 30, 60, 90, and 120 minutes and quantified using an Easi-Check blood glucose meter and strips (Cat. No. TD-4207, New Taipei City, Taiwan).
2.5. Plasma Biochemical Analysis
Plasma samples were analyzed for fasting glucose (GLU), triglycerides (TG), and total cholesterol (TC) using an automated chemistry analyzer AU5800 (LEZEN Reference Lab, Taipei Taiwan). The plasma insulin concentration was measured using an insulin ELISA kit (Mercodia Ultrasensitive Mouse, Cat. No.10-1249-01, Uppsala, Sweden). Insulin resistance was estimated using indexes of homeostasis model assessment of insulin resistance (HOMA-IR = [fasting glucose (mmol/L) × fasting insulin (μU/mL)] / 22.5).
2.6. Histological Analysis
The GAS muscle tissues were cut and fixed in 10% formalin at room temperature for 48 hours, embedded in paraffin, sectioned (5 μm), deparaffined with xylene, rehydrated through a decreasing series of ethanol (100%, 95%, 80%, 70%) and then washed in water. The tissues were stained with hematoxylin and eosin and examined using a light microscope equipped with a CCD camera (BX-51, Olympus, Tokyo). The muscle tissue was captured at 400X. The cross-sectional area of skeletal muscle fiber was analyzed using Image J software (https://imagej.nih.gov/ij/download.html, National Institutes of Health, USA).
2.7. RT-qPCR Gene Expression Analysis
Total RNA from the gastrocnemius muscle and colon were extracted using TRIzol reagent (Thermo Fisher Scientific, Cat. No. 15596018, Waltham, Massachusetts, U.S.) and reverse-transcribed with RevertAid First Strand cDNA Synthesis Kit (Thermo Fisher Scientific, Cat. No. K1621, Waltham, Massachusetts, U.S.). RT-PCR of target genes was performed using Maxima SYBR Green/ROX qPCR Master Mix (2X) (Thermo Fisher Scientific, Cat. No. K0221, Waltham, Massachusetts, U.S.) with the QuantStudio 1 Real-Time PCR System (Applied Biosystems, Ref No. A40425). The target mRNA expression levels were normalized to the reference glyceraldehyde-3-phosphate dehydrogenase (GAPDH) mRNA and the fold change of expression (YC/OH/OHR vs. OC) was calculated using the 2−ΔΔCT method. The target mRNA primer sequences were stated in Table 2.
2.8. Short-Chain Fatty Acids Analysis
Referring to the previously described methods with minor modifications [26,31], fecal short-chain fatty acids (SCFAs) were extracted with ethyl acetate (Cas No. 141-78-6, Macron Fine Chemicals, PA, USA) after acidification with 0.5% phosphoric acid (Cas No. 7664-38-2, Honeywell Specialty Chemicals Seelze, Seelze, Germany) and analyzed by gas chromatography–mass spectrometry (GC–MS, 7820A/5977B, Agilent, CA, USA) equipped with a Nukol™ capillary column 30 m × 0.25 mm, df 0.25 μm (24107, Supelco, Bellefonte, PA, USA). The conditions set in the GC program were shown in Table 3. Data acquisition and quantification were performed using Agilent MassHunter Workstation software (Agilent, CA, USA). Peaks were identified and quantified by comparison with standard (Volatile Free Acid Mix, Lot No. LRAC0113, Sigma-Aldrich, St. Louis, MO, USA).
2.9. Cecum Microbiota Analysis
Extracted bacterial species in the cecal luminal contents were sequenced on Illumina MiSeq 300PE at 16S ribosomal (r)DNA V3-V4 (the data were performed by Genomics, New Taipei, Taiwan). The linear discriminant analysis (LDA) effect size (LEfSe) with score greater than 3 was used to determine the significant difference in the abundance of taxa among groups.
2.10. Statistical Analysis
All data were expressed as mean ± standard error of the mean (SEM). Differences between means of normally distributed data were analyzed using the student’s t-test (YC vs OC group), or one-way analysis of variance (ANOVA) followed by Tukey’s post-hoc test (OH vs OHR treatment groups). Non-parametric tests including the Mann-Whitney U test and Kruskal-Wallis test were used. Associations between SCFA concentrations, blood parameters, skeletal muscle indices, and gut microbiota were evaluated using Spearman’s correlation analysis. A p-value < 0.05 was considered statistically significant. All statistical analyses and graphical representations were performed using GraphPad Prism 9 software.
3. Results
3.1. Nutrient Composition of Full-Fat Rice Bran
3.2. Effect of Full-Fat Rice Bran on Obesity-Related Indices
3.2.1. Body Weight Gain and Visceral Fat Mass
As shown in Figure 1A, the OC group demonstrated significantly higher weight gain compared to the YC group and the OH group showed greater weight gain than the OC group. All OHR groups showed a trend of reduction in weight gain compared to the OH group, especially the OHR20 group. The relative visceral fat mass was significantly higher in the OC group than in the YC group, higher in the OH group than in the OC group, and significantly lower in all OHR groups than in the OH group (Figure 1B).
3.2.2. Energy Intake and Food Efficiency Ratio
The energy intake was significantly lower in the OC group than in the YC group and lower in the OH group than in the OC group (Figure 1C). The food efficiency ratio (FER) was significantly higher in the OC group than in the YC group and higher in the OH group than in the OC group (Figure 1D). No significant differences in energy intake and FER were observed between the OH and all OHR groups (Figure 1C and 1D).
3.3. Effect of Full-Fat Rice Bran on Lipid and Glucose Homeostasis
3.3.1. Plasma Lipid Profile
As shown in Figure 2A and 2B, the OC group exhibited significantly higher plasma TC levels than the YC group, and the OH group had higher plasma TC levels than the OC group. Both the OHR10 and OHR20 groups showed significantly lower plasma TG and TC levels compared to the OH group, while the OHR20 group demonstrated significantly lower plasma TG levels than the OHR5 group.
3.3.2. Glucose Profile
The OHR20 group demonstrated significantly lower plasma glucose level than the OH, OHR5 and OHR10 groups (Figure 2C). The intraperitoneal glucose tolerance test (IPGTT) showed that glucose concentrations in all groups peaked at 30 minutes and then decreased gradually. The OH group showed higher glucose level and slower glucose clearance compared to the OC group, whereas all OHR groups displayed glucose spikes similar to the YC group (Figure 2D). The area under the curve (AUC) of IPGTT was significantly higher in the OC group than in the YC group, higher in the OH group than in the OC group, lower in all OHR groups than in the OH group, and lower in the OHR20 group than the OHR5 group (Figure 2E). The homeostasis model assessment of insulin resistance (HOMA-IR) level was significantly higher in the OC group than in the YC group, higher in the OH group than in the OC group, and lower in the OHR20 group than in the OH group (Figure 2F).
3.4. Effect of Full-Fat Rice Bran on Muscle
3.4.1. Muscle Mass
The relative GAS muscle mass was significantly lower in the OC group than in the YC group. The OHR20 group exhibited a higher relative GAS muscle mass than the OH group (Figure 3A).
3.4.2. Grip Strength
The OC group showed significantly lower relative forelimb and four-limb grip strength than the YC group, while the OHR10 and OHR20 groups exhibited significantly higher values than the OH (Figure 3B and 3C). The OHR20 group demonstrated significantly higher relative four-limb grip strength than the OHR10 group (Figure 3C).
3.4.3. Muscle Morphology
As shown by the histological appearance of GAS muscle fibers, the OC group displayed reduced fiber density with increased extracellular space compared to the YC group, suggesting early signs of muscle atrophy (Figure 3D). The OC group also showed significantly reduced cross-sectional area of the GAS muscle compared to the YC group (Figure 3E). The OH group exhibited a higher proportion of smaller and irregularly shaped muscle fibers, accompanied by enlarged extracellular spaces, compared with the OC group—features that are characteristic of muscle atrophy. In contrast, the OHR intervention groups demonstrated improved muscle morphology, with increased fiber density and reduced extracellular space compared to the OH group (Figure 3D).
3.4.4. Muscle Protein Synthesis Gene Expressions
Figure 4A-I showed the gene expression related to muscle protein synthesis. The OC group showed significantly downregulated mRNA expressions of GLUT4, MyoG, IRS-1, mTOR, and eIF-4EBP1 compared to the YC group. The OH group exhibited significantly lower mRNA expression of IRS-1 compared to the OC group. In contrast, the OHR20 group significantly upregulated the mRNA expressions of MyoG, mTOR, and eIF-4EBP1 compared to the OH group, and also showed significantly higher eIF-4EBP1 expression compared to the OHR5 group.
3.4.5. Muscle Protein Degradation and Inflammatory Gene Expression Levels
Figure 4 J-M showed the gene expression of muscle proteins related to degradation and inflammation. Although no significant differences in muscle protein degradation- and inflammation-related mRNA expression were observed between the OC and YC groups, as well as between the OC and OH groups, there was an increasing trend in the expression of FOXO1, MuRF-1, and IL-6. The OHR10 and OHR20 groups demonstrated significantly downregulated mRNA expression of FOXO1 and IL-6, while the OHR20 group also significantly downregulated MuRF-1 expression.
3.5. Effect of Full-Fat Rice Bran on Large Intestinal Barrier Function and Gut Microbiota
3.5.1. Short-Chain Fatty Acids Production
The OH group showed significantly lower concentration of acetate compared to the OC group. Compared to the OH group, the OHR10 group showed a significant increase in acetate levels, while the OHR20 group significantly elevated the concentrations of acetate, propionate, and butyrate. Moreover, acetate production in the OHR20 group was significantly higher than in the OHR10 group (Figure 5).
3.5.2. Intestinal Tight Junction
Figure 6 showed the relative mRNA expression levels of colonic tight junction. The OC group demonstrated significantly downregulated relative mRNA expressions of ZO-1 and Occludin compared to the YC group. The OHR20 group showed significantly upregulated ZO-1 expression than the OH group, and significantly elevated Occludin expression compared to OH, OHR5 and OHR10 groups.
3.5.3. Gut microbiota Composition
Figure 7 illustrates the taxonomic differences in gut microbiota composition among the groups using linear discriminant analysis (LDA) effect size (LEfSe) analysis. The cladogram revealed distinct bacterial taxa enriched in each group and the LDA score plot consistently confirmed these bacterial groups contributed significantly to the differences in microbial composition across groups. The result showed that Verrucomicrobiota (notably Akkermansiaceae) predominantly enriched in the YC group, the OC group was characterized by a higher abundance of [Eubacterium]_branchy_group, while the OH group was enriched with Rikenellaceae, Alistipes, and Oscillospiraceae. In contrast, the OHR groups demonstrated enrichment of Clostridia_UCG_014, Lachnospiraceae, Ruminococcus, Muribaculum and Saccharimonadales. The relative abundance of genus Muribaculum was significantly lower in the OH group than the OC group while OHR20 group significantly increased these bacteria compared to the OH group. The OHR10 group significantly lowered the relative abundance of genus [Eubacterium]_branchy_group compared to the OH group. The relative abundance of genus Lachnospiraceae_UGC_001 was found elevated in the OHR groups.
3.6. Correlation Between Short-Chain Fatty Acids, Blood Parameters, Muscle-Related Markers, and Gut Microbiota
Figure 8 depicted the heatmap of the correlation analysis among SCFA concentrations, blood parameters, muscle-related markers, and gut microbiota composition. The three major SCFAs, the acetate, propionate and butyrate, were significantly, positively correlated with relative grip strength (forelimb and four-limb), and muscle synthesis-related gene expressions (GLUT4, MyoG, IGF-1, PI3K, Akt, mTOR, S6K1, and eIF-4EBP1), while showing negative correlation with the AUC of glucose concentration, and muscle atrophy- and inflammation-related gene expressions (FOXO1, MuRF-1, Atrogin-1, and IL-6). Acetate and propionate were positively correlated with muscle synthesis gene IRS-1, while acetate alone was negatively correlated with plasma TG level.
Correlating between SCFAs and gut microbiota, acetate, butyrate and propionate were significantly, positively correlated with phylum Actinobacteriota and genus Lachnospiraceae_UCG_001, while negatively correlated with genus [Eubacterium]_branchy_group. Acetate and propionate were negatively correlated with family Rikenellaceae and genus Alistipes. Acetate and butyrate were positively correlated with genus Muribaculum. Propionate was positively correlated with phylum Verrucomicrobiota.
4. Discussion
Aging and estrogen deficiency accelerate visceral fat accumulation, while HFD intake further promotes obesity, contributing to the development of metabolic syndromes [32]. In the present study, aged OVX female mice fed either a normal diet or HFD exhibited increased body weight, augmented adipose tissue mass, and elevated cholesterol, fasting glucose and HOMA-IR levels compared to young female mice. These findings were aligned with previous reports that female mice developed severe obesity and impaired glucose metabolism with aging and exposure to obesogenic diets [32,33]. Substituting part of the diet with FFRB attenuated obesity- and glucose intolerance-related indices. Our data demonstrated that 10−20% FFRB reduced body weight gain, visceral fat mass, triglycerides, cholesterol, fasting blood glucose and HOMA-IR levels in HFD-fed aged OVX mice. Consistent with our results, previous studies had reported that rice bran or its extract could suppress weight gain and improve plasma lipid and glucose profiles in HFD-fed mice [33,34,35]. The high insoluble fiber content of rice bran was associated with improved glycemic regulation [36]. Skeletal muscle is the primary site of insulin-stimulated glucose disposal [37]. Accordingly, increased muscle mass may enhance glucose uptake, thereby establishing a positive feedback loop that limits glucose diversion toward de novo lipogenesis and contributes to reduced fat mass. Thus, these findings suggest that FFRB, rich in indigestible dietary fiber, exerts anti-obesity and antihyperglycemic effects by modulating body weight, adiposity, lipid metabolism, and glucose homeostasis.
Menopause during aging exacerbated muscle degradation, leading to atrophy [6]. In the present study, aged OVX female mice fed either a control diet or HFD exhibited a lower muscle mass-to-body weight ratio and reduced muscle grip strength compared to the young female mice. Skeletal muscle is highly responsive to insulin, facilitating glucose uptake from bloodstream via GLUT4 transporters, and storing it as glycogen, so playing a crucial role in maintaining glucose homeostasis [37]. Insulin signaling in skeletal muscle is also crucial for regulating the balance between protein synthesis and degradation to preserve muscle mass. Our findings revealed a downregulation of muscle synthesis-related genes (GLUT4, MyoG, IRS-1, mTOR, and eIF-4EBP1), while upregulation of muscle breakdown-related genes (FOXO1 and MuRF-1), and inflammatory cytokine IL-6 in HFD-fed aged OVX female mice. These results were consistent with previous reports showing that HFD decreased IRS-1, mTOR, p4EBP1, and S6K expressions in rodents [38,39], reduced MyoG expression in aged obese female mice [40], and increases muscle atrophy markers (atrogin-1, MuRF-1) while enhancing proinflammatory responses [26,41,42]. Such changes promote protein degradation and contribute to muscle loss. Previously published data demonstrated that semi-defatted rice bran and whole grain cereals mitigate muscle atrophy in HFD-fed mice by enhancing muscle protein synthesis and reducing proteolytic activity [26,43]. In line with these studies, our findings showed that 20% FFRB significantly improved the myogenesis gene MyoG and the mTOR/eIF-4EBP1 pathway, while downregulating IL-6, FOXO1, and MuRF-1. Therefore, the current study suggests that FFRB protects against muscle atrophy, potentially through modulation of inflammation, inhibition of FOXO1-mediated proteolysis, and improvement of muscle proteostasis.
Aging and HFD are well-established modulators of the gut microbiome. The gut microbiota, particularly in the large intestine, is a key source of lipopolysaccharides contributing to metabolic endotoxemia [44]. In the present study, HFD-fed aged OVX mice showed increased abundance of Alistipes and Rikenellaceae, consistent with earlier study [45]. These alterations were sufficient to promote inflammation, as demonstrated by elevated NF-κB activation following fecal microbiota transplantation from HFD-fed mice to germ-free mice [46]. Inflammation, driven by cytokines like TNF-α, can disrupt this barrier by activating NF-κB and reducing ZO-1 expression [47]. SCFAs are critical for maintaining intestinal barrier integrity. Tight junction proteins such as claudin-1, ZO-1, and Occludin regulate gut permeability and protect against inflammation-induced barrier disruption [48,49]. Aging and HFD have been shown to reduce colonic ZO-1 and Occludin expression [50,51], consistent with our observation that aged HFD-fed OVX mice had compromised barrier function, while 20% FFRB significantly upregulated ZO-1 and Occludin expressions, restoring gut integrity. This finding aligns with previous studies showing that rice bran improved barrier function [26,52]. In addition to barrier restoration, our findings demonstrated that FFRB shifted the gut microbial composition toward a healthier profile, increasing the relative abundance of SCFA-producing taxa such as Lachnospiraceae_UCG-001 and Muribaculum, particularly in mice receiving 10% and 20% FFRB, respectively. Published studies indicated that dietary fiber intake was positively correlated with SCFA levels, especially butyric and propionic acid [53,54]. The gut microbiota is closely linked to SCFAs production through fermentation of dietary fibers [15], with families such as Lactobacillaceae, Ruminococcaceae, and Lachnospiraceae being key contributors [55]. In line with this, our study observed that Lachnospiraceae and Muribaculum were strongly associated with acetate and butyrate production, while Lactobacillaceae and Ruminococcaceae contributed less prominently. Notably, the 20% FFRB diet significantly increased acetate, propionate, and butyrate levels, highlighting the prebiotic role of rice bran in enriching SCFA-producing bacteria.
These microbiota–SCFA interactions have systemic consequences for both metabolic health and skeletal muscle. Butyrate and propionate exert anti-inflammatory effects and promote glucose regulation, while SCFAs in general are linked to muscle protein synthesis and strength [56]. In our study, SCFAs showed strong positive correlations with grip strength (forelimb and four-limb) and with the expression of muscle anabolic genes (GLUT4, MyoG, IRS-1, PI3K, Akt, mTOR, S6K1, eIF-4EBP1), while negatively correlating with glucose intolerance indices (AUC of IPGTT) and muscle atrophy/inflammatory markers (FOXO1, MuRF-1, Atrogin-1, IL-6). Specifically, Lachnospiraceae_UCG-001 abundance was enriched in 10% FFRB-fed mice, while Muribaculum was most abundant in the 20% FFRB group, supporting a dose-dependent effect of FFRB on SCFA-mediated muscle strength preservation via the Akt/mTOR/eIF-4EBP1 pathway. Together, these results indicate that FFRB reshapes the gut microbiota toward SCFA-producing taxa, enhances SCFA production, and restores intestinal barrier function. Through these mechanisms, FFRB contributes to reduced inflammation, improved glucose tolerance, and attenuation of muscle atrophy in aged, estrogen-deficient mice.
The present study emphasizes the value of using whole FFRB, rather than defatted rice bran or isolated extracts, which may overlook the synergistic effects of its diverse bioactive components. Besides optimizing the functional potential of whole FFRB, it also contributes to sustainability by reducing food waste and carbon emissions. This study suggests that FFRB could serve as a functional food for regulating the gut-muscle axis in postmenopausal women. As a dietary fiber-rich food, FFRB can be a non-pharmacological approach to mitigate muscle loss, insulin resistance, and inflammation associated with aging and menopause. These results provide preclinical evidence supporting FFRB as a sustainable, low-cost nutritional strategy to counteract obesity, glucose intolerance, and sarcopenia under HFD condition.
There are several limitations in this present study. First, we did not measure circulating SCFA levels, however we assessed the fecal SCFAs which are considered a more direct reflection of gut microbial fermentation and activity in the large intestine [57]. Second, we did not characterize the bioactive compounds of FFRB, such as γ-oryzanol or phenolic acids, which are recommended for inclusion in future studies to provide a more comprehensive understanding of its functional properties. Third, we assessed muscle strength and gene expression markers, but did not examine on the mitochondrial energy metabolism. Given its central role in muscle function and insulin sensitivity, future studies should investigate whether FFRB or its derived SCFAs influence mitochondrial bioenergetics to further clarify the underlying mechanisms [16,39].
5. Conclusions
FFRB (TNG81) given to the HFD-fed bilateral OVX mice, imitating postmenopausal condition, had proved to enhance intestinal barrier function by upregulating colonic tight junction gene expressions. Improved gut integrity reshaped the microbial environment, particularly increasing the abundance of SCFA-producing taxa such as Muribaculum (20% FFRB) and Lachnospiraceae_UCG-001 (10% FFRB). The resulting elevation in SCFAs was associated with enhanced insulin sensitivity, greater skeletal muscle strength, reduced inflammation, and attenuated proteolysis. Collectively, these findings suggested that 20% FFRB could have a beneficial effect on the gut-muscle axis via the improvement of gut barrier integrity and microbiome composition, which potentially diminishing some of the adverse effects of a HFD and menopause on muscle health and metabolic function.
Author Contributions
Conceptualization, W.-C.C. and Y.S.C.; formal analysis, P.Y.L.; data curation, P.Y.L. and W.-C.C; writing—original draft preparation, P.Y.L.; writing—review and editing, W.-C.C. and Y.O.; supervision, W.-C.C, Y.O. and H.S.; project administration, P.Y.L. and W.-C.C; funding acquisition, W.-C.C. All authors have read and agreed to the published version of the manuscript.
Funding
This research was funded by the National Science and Technology Council (NSTC), Taiwan (MOST111-2320-B-038-028 and NSTC112-2320-B-038-035), and supported by Taipei Medical University (Grant No. DP3-112-52322-17).
Data Availability Statement
The data used to support the findings of this study are included within the article.
Acknowledgments
The authors acknowledge technical support provided by Taipei Medical University Core Facility.
Conflicts of Interest
The authors declare no conflicts of interest.
Abbreviations
The following abbreviations are used in this manuscript:
| Akt | Alpha serine/threonine-protein kinase |
| AUC | Area under curve |
| eIF-4EBP1 | Eukaryotic translation initiation factor 4E binding protein 1 |
| FER | Food efficiency ratio |
| FFRB | Full-fat rice bran |
| FOXO1 | Forkhead box protein O1 |
| GAS | Gastrocnemius |
| GLU | Glucose |
| GLUT4 | Glucose transporter type 4 |
| HFD | High-fat diet |
| HOMA-IR | Homeostasis model assessment of insulin resistance |
| IGF-1 | Insulin-like growth factor 1 |
| IL-6 | Interleukin 6 |
| IPGTT | Intraperitoneal glucose tolerance test |
| IRS-1 | Insulin receptor substrate 1 |
| LDA | Linear discriminant analysis |
| LEfSe | Linear discriminant analysis effect size |
| mTOR | Mammalian target of rapamycin |
| MuRF-1 | Muscle RING-finger protein-1 |
| MyoG | Myogenin |
| OVX | Ovariectomized |
| PI3K | Phosphatidylinositol3-kinase |
| RT-qPCR | Real-time quantitative polymerase chain reaction |
| S6K1 | Ribosomal protein S6 kinase beta-1 |
| SCFAs | Short-chain fatty acids |
| SEM | Standard error mean |
| TC | Total cholesterol |
| TG | Triglycerides |
| TNG81 | Tainung No. 81 |
| ZO-1 | Zonula occludens-1 |
References
- Landgren, B.M.; Collins, A.; Csemiczky, G.; Burger, H.G.; Baksheev, L.; Robertson, D.M. Menopause transition: Annual changes in serum hormonal patterns over the menstrual cycle in women during a nine-year period prior to menopause. J Clin Endocrinol Metab 2004, 89, 2763–2769. [Google Scholar] [CrossRef]
- Ko, S.H.; Kim, H.S. Menopause-Associated Lipid Metabolic Disorders and Foods Beneficial for Postmenopausal Women. Nutrients 2020, 12. [Google Scholar] [CrossRef]
- Maltais, M.L.; Desroches, J.; Dionne, I.J. Changes in muscle mass and strength after menopause. J Musculoskelet Neuronal Interact 2009, 9, 186–197. [Google Scholar] [PubMed]
- Deschenes, M.R. Effects of aging on muscle fibre type and size. Sports Med 2004, 34, 809–824. [Google Scholar] [CrossRef] [PubMed]
- Romanick, M.; Thompson, L.V.; Brown-Borg, H.M. Murine models of atrophy, cachexia, and sarcopenia in skeletal muscle. Biochim Biophys Acta 2013, 1832, 1410–1420. [Google Scholar] [CrossRef] [PubMed]
- Geraci, A.; Calvani, R.; Ferri, E.; Marzetti, E.; Arosio, B.; Cesari, M. Sarcopenia and Menopause: The Role of Estradiol. Front Endocrinol (Lausanne) 2021, 12, 682012. [Google Scholar] [CrossRef]
- Roth, S.M.; Metter, E.J.; Ling, S.; Ferrucci, L. Inflammatory factors in age-related muscle wasting. Curr Opin Rheumatol 2006, 18, 625–630. [Google Scholar] [CrossRef]
- La Colla, A.; Pronsato, L.; Milanesi, L.; Vasconsuelo, A. 17beta-Estradiol and testosterone in sarcopenia: Role of satellite cells. Ageing Res Rev 2015, 24, 166–177. [Google Scholar] [CrossRef]
- Arthur, S.T.; Cooley, I.D. The effect of physiological stimuli on sarcopenia; impact of Notch and Wnt signaling on impaired aged skeletal muscle repair. Int J Biol Sci 2012, 8, 731–760. [Google Scholar] [CrossRef]
- Gomez, A.; Luckey, D.; Taneja, V. The gut microbiome in autoimmunity: Sex matters. Clin Immunol 2015, 159, 154–162. [Google Scholar] [CrossRef]
- Huang, F.L.; Cao, Y.; Liang, J.H.; Tang, R.Y.; Wu, S.; Zhang, P.; Chen, R. The influence of the gut microbiome on ovarian aging. Gut Microbes 2024, 16, 2295394. [Google Scholar] [CrossRef] [PubMed]
- Chen, S.; Zhang, P.; Duan, H.; Wang, J.; Qiu, Y.; Cui, Z.; Yin, Y.; Wan, D.; Xie, L. Gut microbiota in muscular atrophy development, progression, and treatment: New therapeutic targets and opportunities. Innovation (Camb) 2023, 4, 100479. [Google Scholar] [CrossRef] [PubMed]
- Mostafavi Abdolmaleky, H.; Zhou, J.R. Gut Microbiota Dysbiosis, Oxidative Stress, Inflammation, and Epigenetic Alterations in Metabolic Diseases. Antioxidants (Basel) 2024, 13. [Google Scholar] [CrossRef] [PubMed]
- Pedersen, M.; Bruunsgaard, H.; Weis, N.; Hendel, H.W.; Andreassen, B.U.; Eldrup, E.; Dela, F.; Pedersen, B.K. Circulating levels of TNF-alpha and IL-6-relation to truncal fat mass and muscle mass in healthy elderly individuals and in patients with type-2 diabetes. Mech Ageing Dev 2003, 124, 495–502. [Google Scholar] [CrossRef]
- van der Beek, C.M.; Dejong, C.H.C.; Troost, F.J.; Masclee, A.A.M.; Lenaerts, K. Role of short-chain fatty acids in colonic inflammation, carcinogenesis, and mucosal protection and healing. Nutr Rev 2017, 75, 286–305. [Google Scholar] [CrossRef]
- Liu, X.; Xu, M.; Wang, H.; Zhu, L. Role and Mechanism of Short-Chain Fatty Acids in Skeletal Muscle Homeostasis and Exercise Performance. Nutrients 2025, 17. [Google Scholar] [CrossRef]
- Sartori, R.; Romanello, V.; Sandri, M. Mechanisms of muscle atrophy and hypertrophy: implications in health and disease. Nat Commun 2021, 12, 330. [Google Scholar] [CrossRef]
- Schiaffino, S.; Mammucari, C. Regulation of skeletal muscle growth by the IGF1-Akt/PKB pathway: insights from genetic models. Skelet Muscle 2011, 1, 4. [Google Scholar] [CrossRef]
- Sandri, M.; Barberi, L.; Bijlsma, A.Y.; Blaauw, B.; Dyar, K.A.; Milan, G.; Mammucari, C.; Meskers, C.G.; Pallafacchina, G.; Paoli, A.; et al. Signalling pathways regulating muscle mass in ageing skeletal muscle: the role of the IGF1-Akt-mTOR-FoxO pathway. Biogerontology 2013, 14, 303–323. [Google Scholar] [CrossRef]
- Tan, B.L.; Norhaizan, M.E.; Chan, L.C. Rice Bran: From Waste to Nutritious Food Ingredients. Nutrients 2023, 15. [Google Scholar] [CrossRef]
- Mn, L.; Venkatachalapathy, N.; Manickavasagan, A. Physicochemical Characteristics of Rice Bran; 2017; pp. 79–90. [Google Scholar] [CrossRef]
- Bodie, A.R.; Micciche, A.C.; Atungulu, G.G.; Rothrock, M.J.; Ricke, S.C. Current Trends of Rice Milling Byproducts for Agricultural Applications and Alternative Food Production Systems. Front Sustain Food S 2019, 3, 47. [Google Scholar] [CrossRef]
- Gul, M.Z.; Das, P.P.; Babu, K.R.; Juarez-Colunga, S.; Weber, A.M.; Yoosuf, B.; Alex, A.S.; Srivastava, R.K.; Marathi, B.; Patel, S.; et al. Rice Bran: A Comprehensive Review of Phytochemicals and Bioactive Components With Therapeutic Potential and Health Benefits. Nutr Rev 2025. [Google Scholar] [CrossRef] [PubMed]
- Tajasuwan, L.; Kettawan, A.; Rungruang, T.; Wunjuntuk, K.; Prombutara, P. Role of Dietary Defatted Rice Bran in the Modulation of Gut Microbiota in AOM/DSS-Induced Colitis-Associated Colorectal Cancer Rat Model. Nutrients 2023, 15. [Google Scholar] [CrossRef] [PubMed]
- Zhang, X.; Dong, L.; Jia, X.; Liu, L.; Chi, J.; Huang, F.; Ma, Q.; Zhang, M.; Zhang, R. Bound Phenolics Ensure the Antihyperglycemic Effect of Rice Bran Dietary Fiber in db/db Mice via Activating the Insulin Signaling Pathway in Skeletal Muscle and Altering Gut Microbiota. J Agric Food Chem 2020, 68, 4387–4398. [Google Scholar] [CrossRef]
- Huang, P.X.; Yeh, C.L.; Yang, S.C.; Shirakawa, H.; Chang, C.L.; Chen, L.H.; Chiu, Y.S.; Chiu, W.C. Rice Bran Supplementation Ameliorates Gut Dysbiosis and Muscle Atrophy in Ovariectomized Mice Fed with a High-Fat Diet. Nutrients 2023, 15. [Google Scholar] [CrossRef]
- Li, Q.; Yang, H.; Song, S.; Liu, J.; Wang, Z.; Wang, J. Bioactive Components in Whole Grains for the Regulation of Skeletal Muscle Function. Foods 2022, 11. [Google Scholar] [CrossRef]
- Rusbana, T.B.; Agista, A.Z.; Saputra, W.D.; Ohsaki, Y.; Watanabe, K.; Ardiansyah, A.; Budijanto, S.; Koseki, T.; Aso, H.; Komai, M.; Shirakawa, H. Supplementation with Fermented Rice Bran Attenuates Muscle Atrophy in a Diabetic Rat Model. Nutrients 2020, 12. [Google Scholar] [CrossRef]
- Kim, S.M.; Chung, H.J.; Lim, S.T. Effect of various heat treatments on rancidity and some bioactive compounds of rice bran. J Cereal Sci 2014, 60, 243–248. [Google Scholar] [CrossRef]
- Sari, M.; Ridla, M.; Sukria, H. The Optimal Condition of Dry-Heat Stabilization using Oven on Phenolic Content and Antioxidant Activity of Rice Bran: A Meta-Analysis. Buletin Peternakan 2023, 47, 248. [Google Scholar] [CrossRef]
- Zhang, C.; Liu, A.; Zhang, T.; Li, Y.; Zhao, H. Gas Chromatography Detection Protocol of Short-chain Fatty Acids in Mice Feces. Bio Protoc 2020, 10, e3672. [Google Scholar] [CrossRef]
- Moreno-Fernandez, M.E.; Sharma, V.; Stankiewicz, T.E.; Oates, J.R.; Doll, J.R.; Damen, M.; Almanan, M.; Chougnet, C.A.; Hildeman, D.A.; Divanovic, S. Aging mitigates the severity of obesity-associated metabolic sequelae in a gender independent manner. Nutr Diabetes 2021, 11, 15. [Google Scholar] [CrossRef]
- Zou, Y.; Ju, X.; Chen, W.; Yuan, J.; Wang, Z.; Aluko, R.E.; He, R. Rice bran attenuated obesity via alleviating dyslipidemia, browning of white adipocytes and modulating gut microbiota in high-fat diet-induced obese mice. Food Funct 2020, 11, 2406–2417. [Google Scholar] [CrossRef] [PubMed]
- Son, J.E.; Jo, J.Y.; Kim, S.; Park, M.J.; Lee, Y.R.; Park, S.S.; Park, S.Y.; Jung, S.M.; Jung, S.K.; Kim, J.Y.; Byun, S. Rice Bran Extract Suppresses High-Fat Diet-Induced Hyperlipidemia and Hepatosteatosis through Targeting AMPK and STAT3 Signaling. Nutrients 2023, 15, 3630. [Google Scholar] [CrossRef] [PubMed]
- Yang, S.C.; Huang, W.C.; Ng, X.E.; Lee, M.C.; Hsu, Y.J.; Huang, C.C.; Wu, H.H.; Yeh, C.L.; Shirakawa, H.; Budijanto, S.; et al. Rice Bran Reduces Weight Gain and Modulates Lipid Metabolism in Rats with High-Energy-Diet-Induced Obesity. Nutrients 2019, 11. [Google Scholar] [CrossRef] [PubMed]
- Samra, R.A.; Anderson, G.H. Insoluble cereal fiber reduces appetite and short-term food intake and glycemic response to food consumed 75 min later by healthy men. Am J Clin Nutr 2007, 86, 972–979. [Google Scholar] [CrossRef]
- Turcotte, L.P.; Fisher, J.S. Skeletal muscle insulin resistance: roles of fatty acid metabolism and exercise. Phys Ther 2008, 88, 1279–1296. [Google Scholar] [CrossRef]
- Bae, J.Y.; Shin, K.O.; Woo, J.; Woo, S.H.; Jang, K.S.; Lee, Y.H.; Kang, S. Exercise and dietary change ameliorate high fat diet induced obesity and insulin resistance via mTOR signaling pathway. J Exerc Nutrition Biochem 2016, 20, 28–33. [Google Scholar] [CrossRef]
- Kim, J.S.; Lee, H.; Yoo, A.; Jeong, H.Y.; Jung, C.H.; Ahn, J.; Ha, T.Y. Gromwell (Lithospermum erythrorhizon) Attenuates High-Fat-Induced Skeletal Muscle Wasting by Increasing Protein Synthesis and Mitochondrial Biogenesis. J Microbiol Biotechnol 2024, 34, 495–505. [Google Scholar] [CrossRef]
- Martinez-Gayo, A.; Felix-Soriano, E.; Sainz, N.; Gonzalez-Muniesa, P.; Moreno-Aliaga, M.J. Changes Induced by Aging and Long-Term Exercise and/or DHA Supplementation in Muscle of Obese Female Mice. Nutrients 2022, 14. [Google Scholar] [CrossRef]
- Adhikary, S.; Kothari, P.; Choudhary, D.; Tripathi, A.K.; Trivedi, R. Glucocorticoid aggravates bone micro-architecture deterioration and skeletal muscle atrophy in mice fed on high-fat diet. Steroids 2019, 149, 108416. [Google Scholar] [CrossRef]
- Le, N.H.; Kim, C.S.; Park, T.; Park, J.H.; Sung, M.K.; Lee, D.G.; Hong, S.M.; Choe, S.Y.; Goto, T.; Kawada, T.; Yu, R. Quercetin protects against obesity-induced skeletal muscle inflammation and atrophy. Mediators Inflamm 2014, 2014, 834294. [Google Scholar] [CrossRef] [PubMed]
- Lee, S.; Kim, M.B.; Kim, C.; Hwang, J.K. Whole grain cereal attenuates obesity-induced muscle atrophy by activating the PI3K/Akt pathway in obese C57BL/6N mice. Food Sci Biotechnol 2018, 27, 159–168. [Google Scholar] [CrossRef] [PubMed]
- Mohammad, S.; Thiemermann, C. Role of Metabolic Endotoxemia in Systemic Inflammation and Potential Interventions. Front Immunol 2020, 11, 594150. [Google Scholar] [CrossRef]
- Daniel, H.; Gholami, A.M.; Berry, D.; Desmarchelier, C.; Hahne, H.; Loh, G.; Mondot, S.; Lepage, P.; Rothballer, M.; Walker, A.; et al. High-fat diet alters gut microbiota physiology in mice. ISME J 2014, 8, 295–308. [Google Scholar] [CrossRef]
- Ding, S.L.; Chi, M.M.; Scull, B.P.; Rigby, R.; Schwerbrock, N.M.J.; Magness, S.; Jobin, C.; Lund, P.K. High-Fat Diet: Bacteria Interactions Promote Intestinal Inflammation Which Precedes and Correlates with Obesity and Insulin Resistance in Mouse. Plos One 2010, 5, e12191. [Google Scholar] [CrossRef]
- Ram, A.K.; Vairappan, B. Role of zonula occludens in gastrointestinal and liver cancers. World J Clin Cases 2022, 10, 3647–3661. [Google Scholar] [CrossRef] [PubMed]
- Balda, M.S.; Matter, K. Tight junctions at a glance. J Cell Sci 2008, 121, 3677–3682. [Google Scholar] [CrossRef]
- Kuo, W.T.; Odenwald, M.A.; Turner, J.R.; Zuo, L. Tight junction proteins occludin and ZO-1 as regulators of epithelial proliferation and survival. Ann N Y Acad Sci 2022, 1514, 21–33. [Google Scholar] [CrossRef]
- Hua, Y.A.; Shen, J.Y.; Fan, R.; Xiao, R.; Ma, W.W. High-fat diets containing different types of fatty acids modulate gut-brain axis in obese mice. Nutr Metab (Lond) 2022, 19, 40. [Google Scholar] [CrossRef]
- Mujawdiya, P.K.; Sharma, P.; Sharad, S.; Kapur, S. Reversal of Increase in Intestinal Permeability by Seed Kernel Extract in High-Fat Diet-Induced Obese Mice. Pharmaceuticals-Base 2020, 13, 190. [Google Scholar] [CrossRef]
- Duansak, N.; Schmid-Schonbein, G.W.; Srisawat, U. Anti-Obesity Effect of Rice Bran Extract on High-Fat Diet-Induced Obese Mice. Prev Nutr Food Sci 2022, 27, 172–179. [Google Scholar] [CrossRef]
- Ilyes, T.; Silaghi, C.N.; Craciun, A.M. Diet-Related Changes of Short-Chain Fatty Acids in Blood and Feces in Obesity and Metabolic Syndrome. Biology (Basel) 2022, 11. [Google Scholar] [CrossRef]
- Salazar, N.; Arboleya, S.; Fernandez-Navarro, T.; de Los Reyes-Gavilan, C.G.; Gonzalez, S.; Gueimonde, M. Age-Associated Changes in Gut Microbiota and Dietary Components Related with the Immune System in Adulthood and Old Age: A Cross-Sectional Study. Nutrients 2019, 11. [Google Scholar] [CrossRef]
- Fusco, W.; Lorenzo, M.B.; Cintoni, M.; Porcari, S.; Rinninella, E.; Kaitsas, F.; Lener, E.; Mele, M.C.; Gasbarrini, A.; Collado, M.C.; et al. Short-Chain Fatty-Acid-Producing Bacteria: Key Components of the Human Gut Microbiota. Nutrients 2023, 15. [Google Scholar] [CrossRef]
- Morrison, D.J.; Preston, T. Formation of short chain fatty acids by the gut microbiota and their impact on human metabolism. Gut Microbes 2016, 7, 189–200. [Google Scholar] [CrossRef]
- Deng, K.; Xu, J.J.; Shen, L.; Zhao, H.; Gou, W.; Xu, F.; Fu, Y.; Jiang, Z.; Shuai, M.; Li, B.Y.; et al. Comparison of fecal and blood metabolome reveals inconsistent associations of the gut microbiota with cardiometabolic diseases. Nat Commun 2023, 14, 571. [Google Scholar] [CrossRef]
Figure 1.
Effect of full-fat rice bran on obesity-related indices. (A) body weight gain, (B) relative visceral fat mass, (C) energy intake, (D) food efficiency ratio (FER). Data were expressed as the mean ± SEM (n = 6). The asterisk (*) indicated a significant mean difference between the YC and OC groups or OC and OH groups (p < 0.05*, p < 0.01**, p < 0.001***). The superscript letters (a, b) indicated a significant mean difference among the OH, OHR5, OHR10, and OHR20 (p < 0.05). Weight gain (g) = final body weight (g) − initial body weight (g). Relative organ weight (%) = [organ weight (g)/body weight (g)] *100%. FER (%) = [average weight gain (g)/average food intake (g)] *100%.
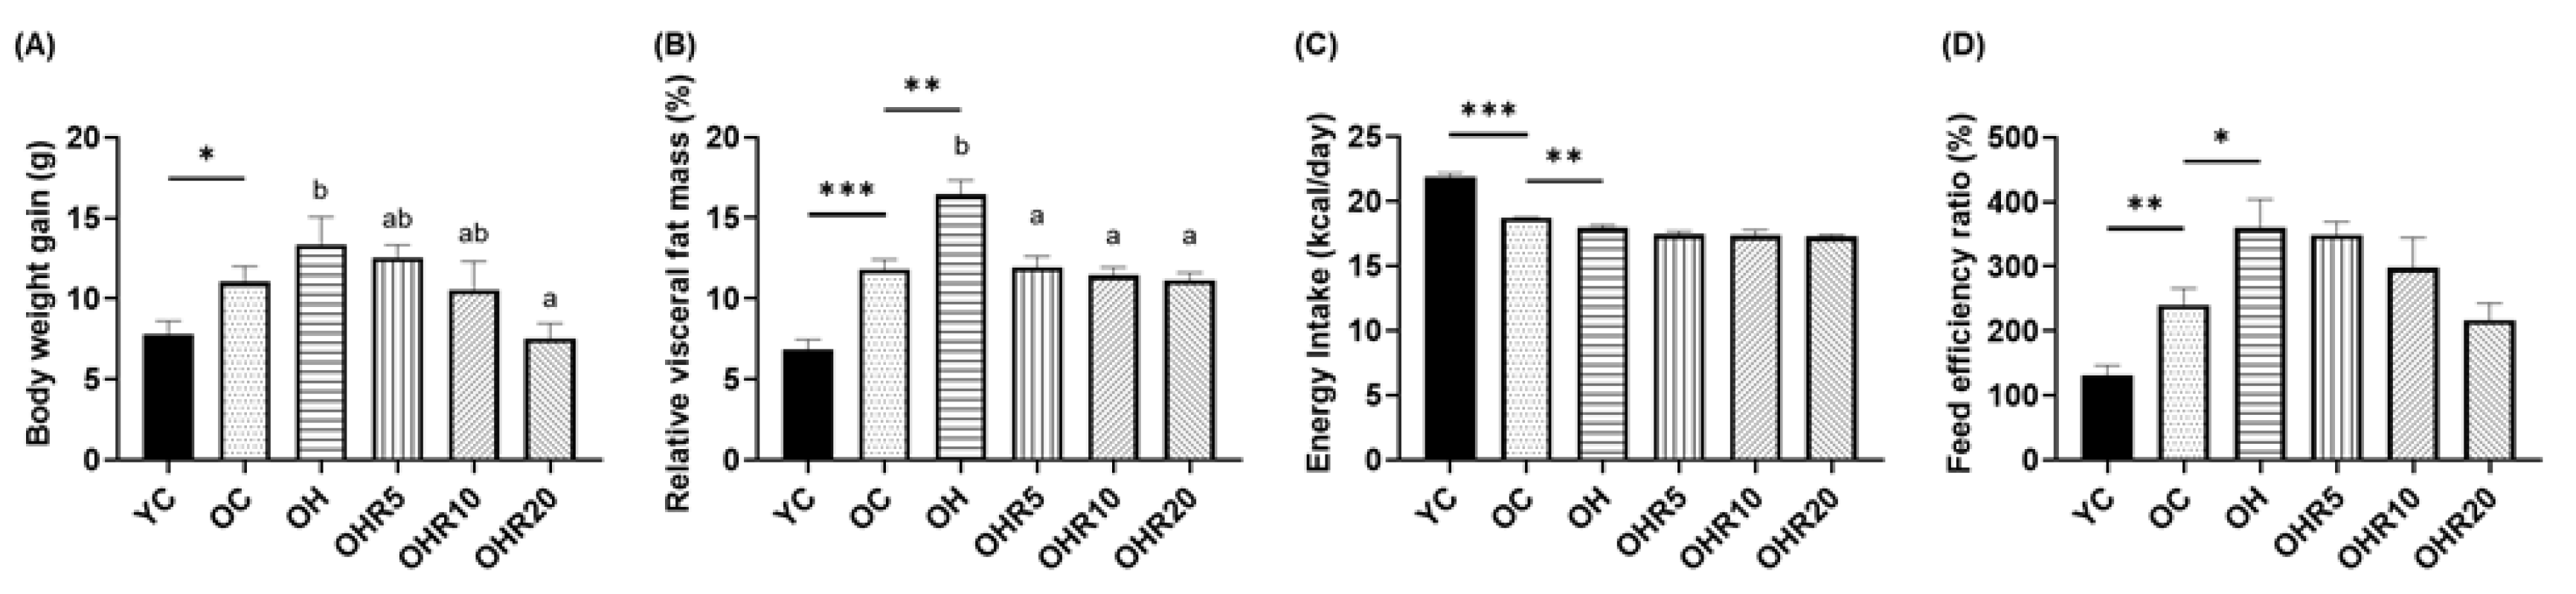
Figure 2.
Effect of full-fat rice bran on lipid and glucose homeostasis. Lipid metabolism: (A) plasma TG, and (B) TC levels. Glucose metabolism: (C) plasma GLU level, (D) IPGTT, (E) AUC of glucose concentration, (F) HOMA-IR index. Data were expressed as the mean ± SEM (n = 6). The asterisk (*) indicated a significant mean difference between the YC and OC groups or OC and OH groups (p < 0.05*, p < 0.01**). The superscript letters (a, b, c) indicated a significant mean difference among the OH, OHR5, OHR10, and OHR20 (p < 0.05).
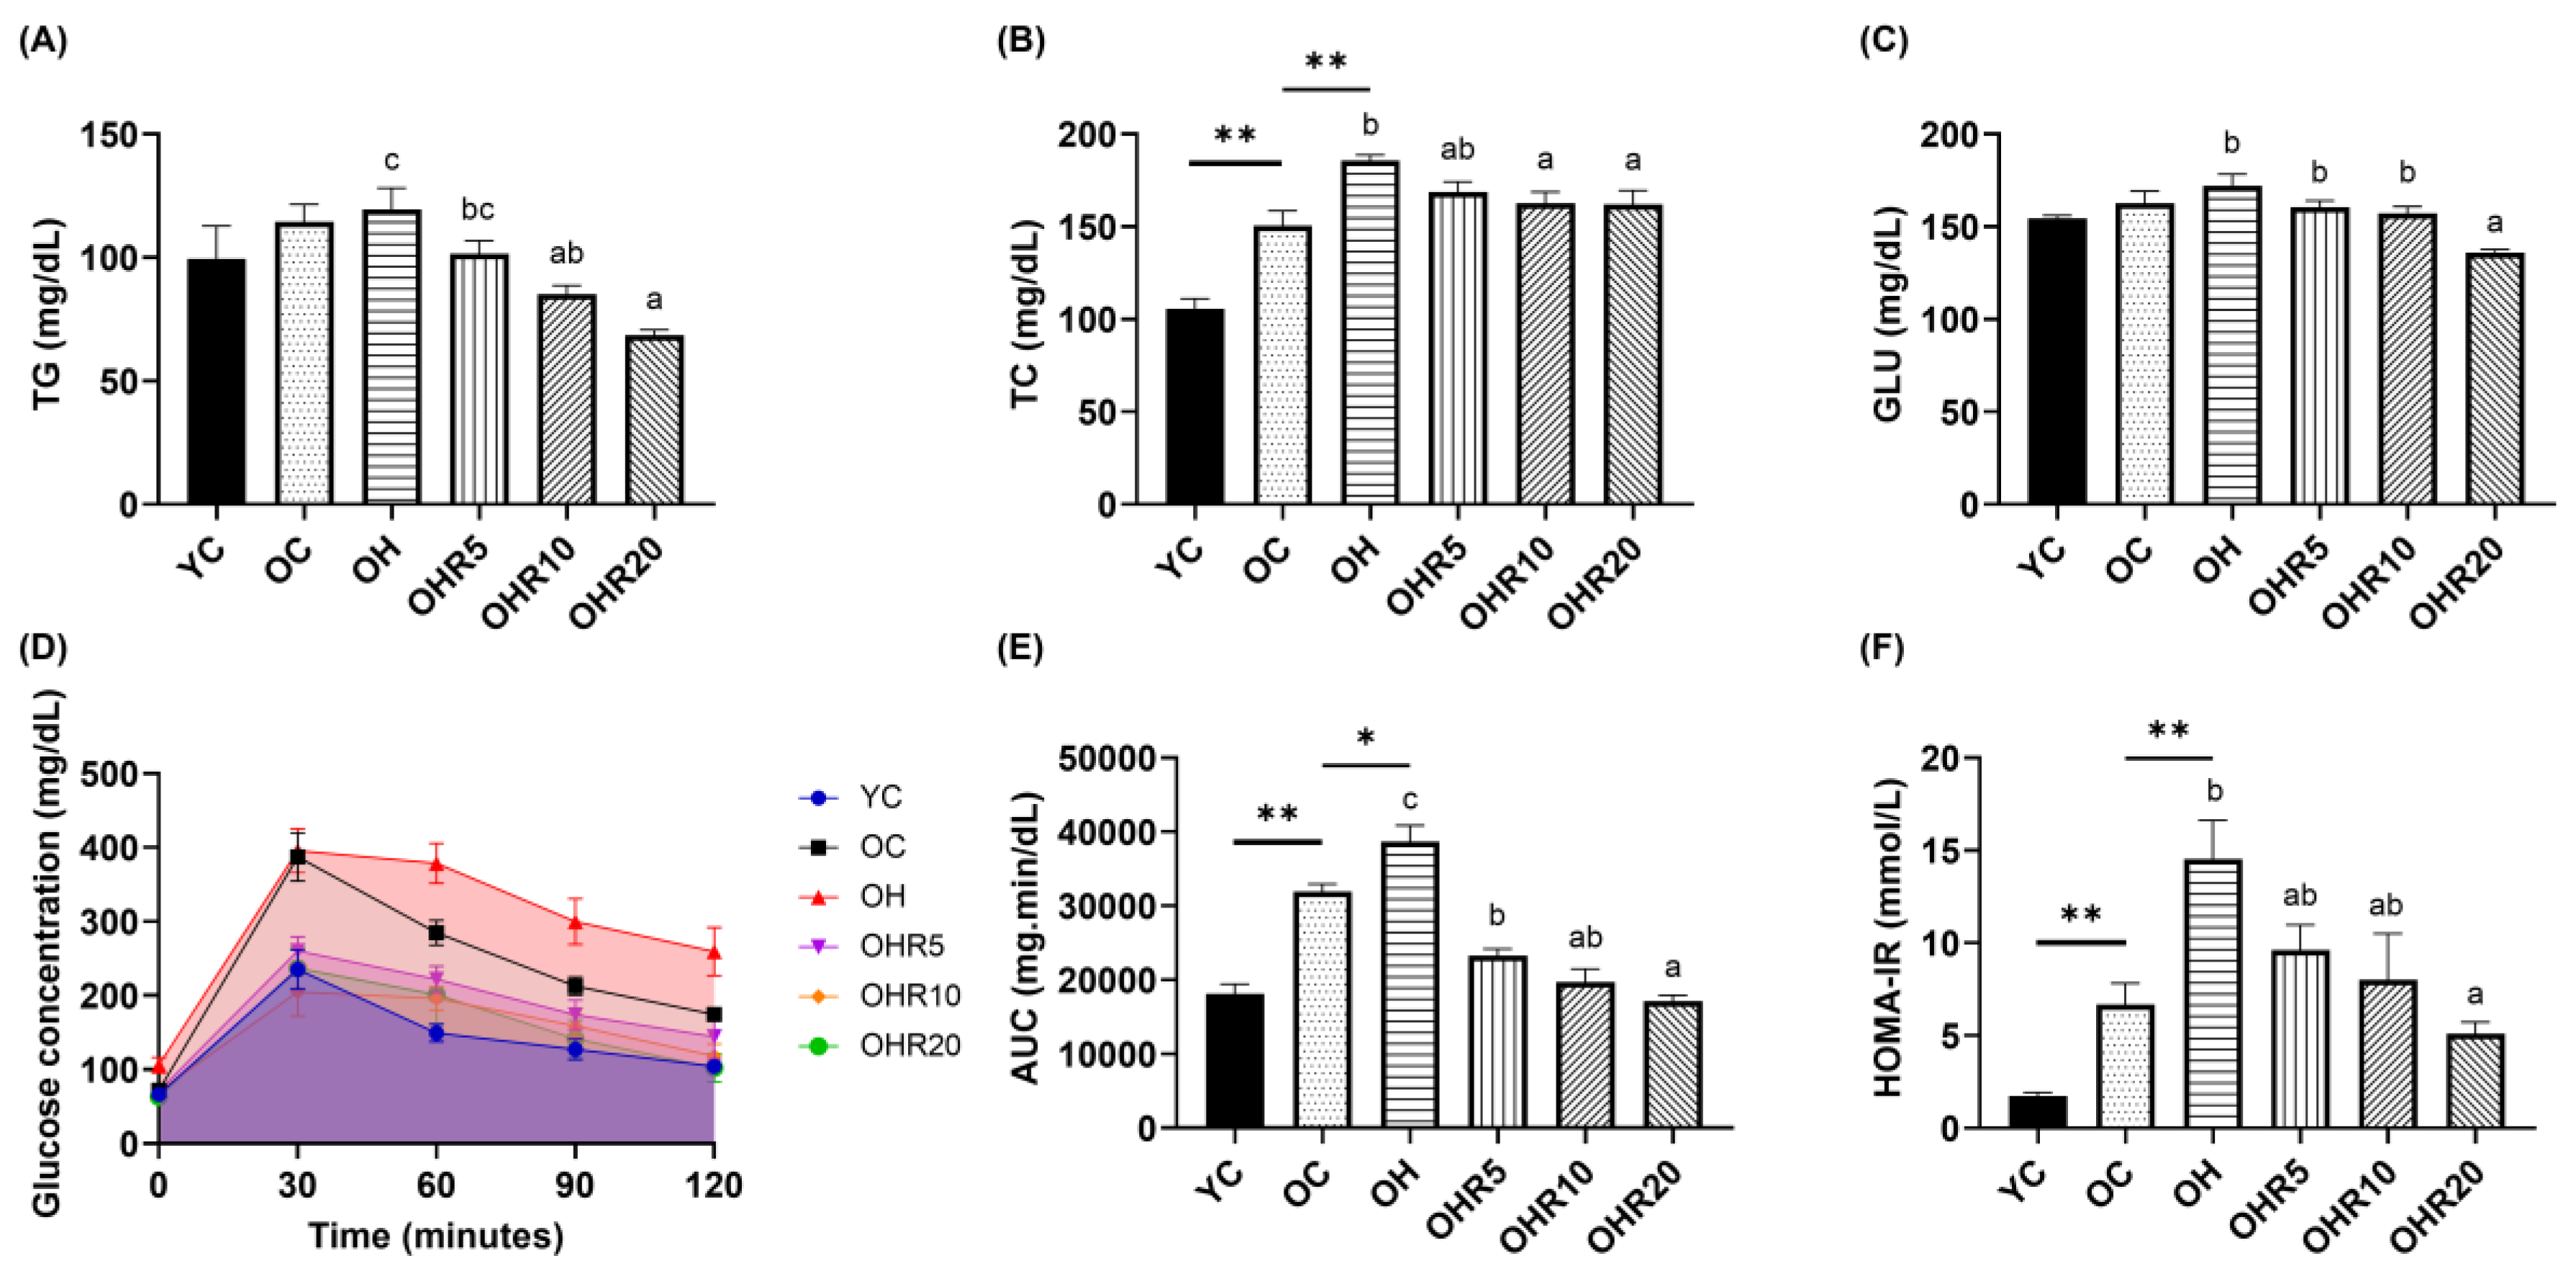
Figure 3.
Effect of full-fat rice bran on muscle. (A) Relative GAS muscle mass. Relative grip strength of (B) forelimb and (C) four-limb. (D) Histological analysis of GAS muscle fibers by hematoxylin and eosin (H&E) staining (400X). Scale bars, 50μm. (E) Cross-sectional area of GAS muscle. Data were expressed as the mean ± SEM (n = 6). The asterisk (*) indicated a significant mean difference between the YC and OC groups or OC and OH groups (p < 0.01**, p < 0.001***). The superscript letters (a, b, c) indicated a significant mean difference among the OH, OHR5, OHR10, and OHR20 (p < 0.05). Relative organ weight (%) = [organ weight (g)/body weight (g)] *100%.
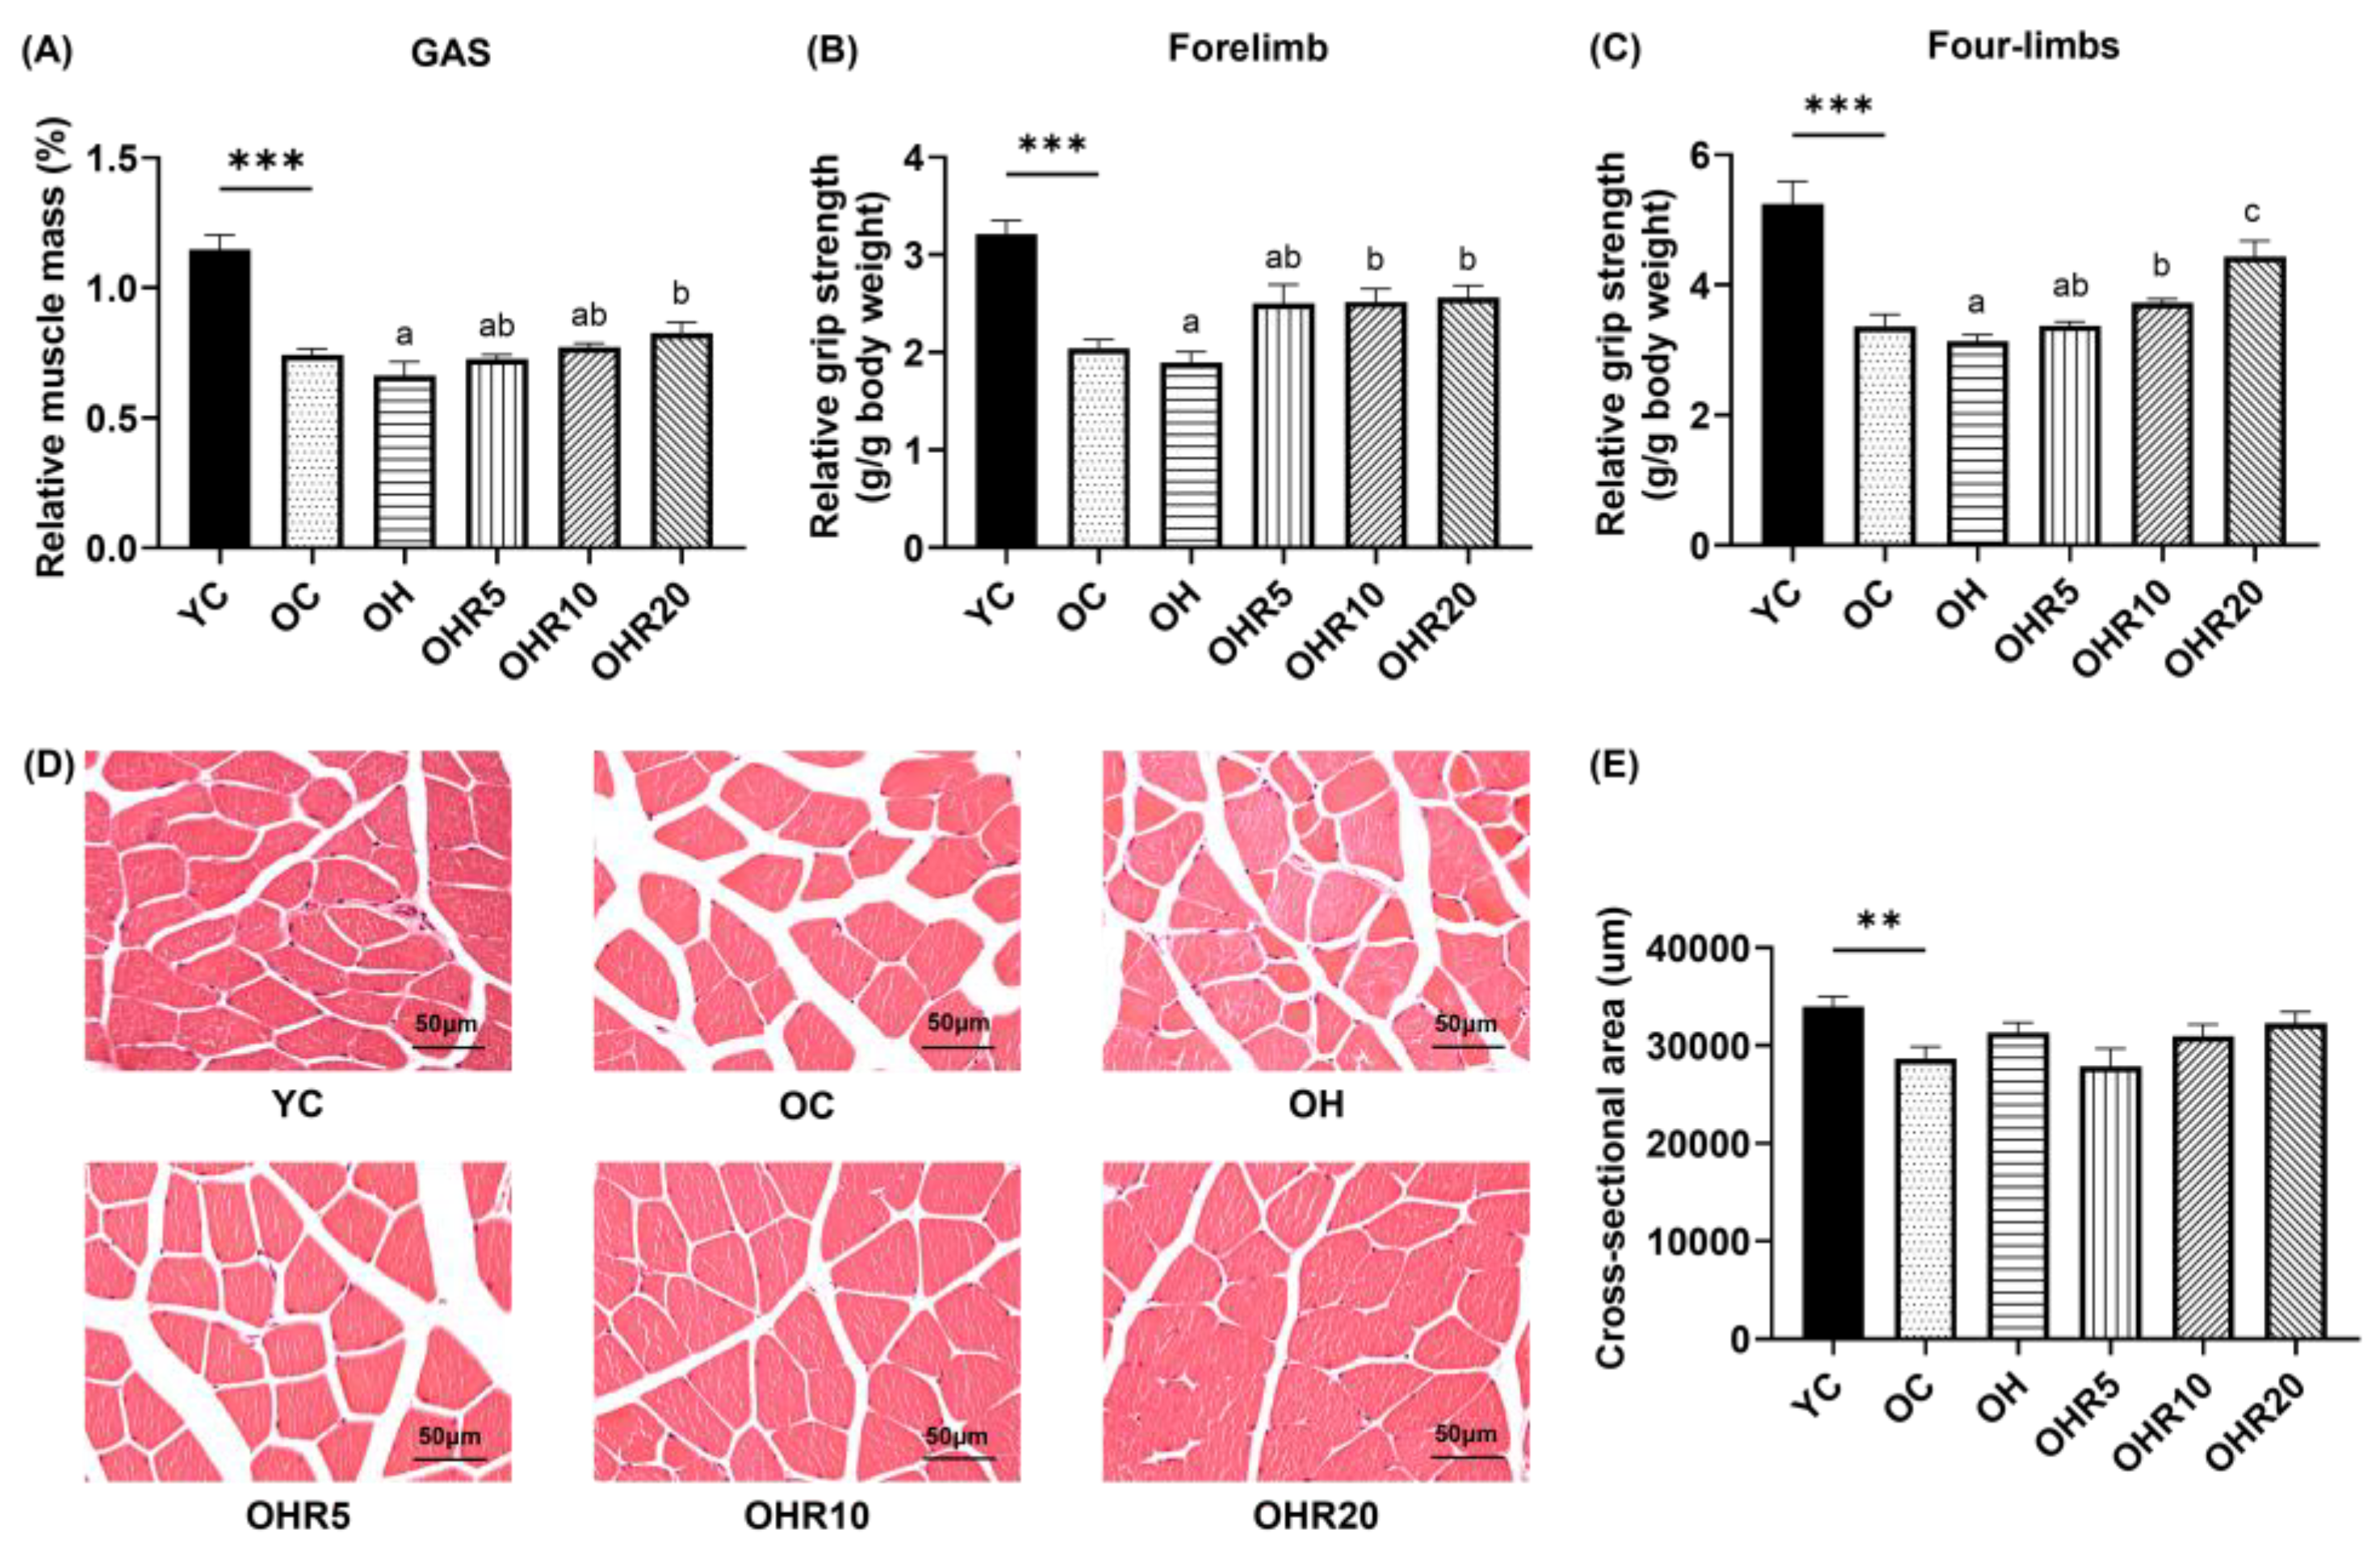
Figure 4.
Effect of full-fat rice bran on muscle mRNA expressions related to protein synthesis (A-I), degradation (J-L), and inflammation (M) in HFD-induced OVX mice. Data were expressed as the mean ± SEM (n = 6). The asterisk (*) indicated a significant mean difference between the YC and OC groups or OC and OH groups (p < 0.05*, p < 0.01**, p < 0.001***). The superscript letters (a, b, c) indicated a significant mean difference among the OH, OHR5, OHR10, and OHR20 (p < 0.05).
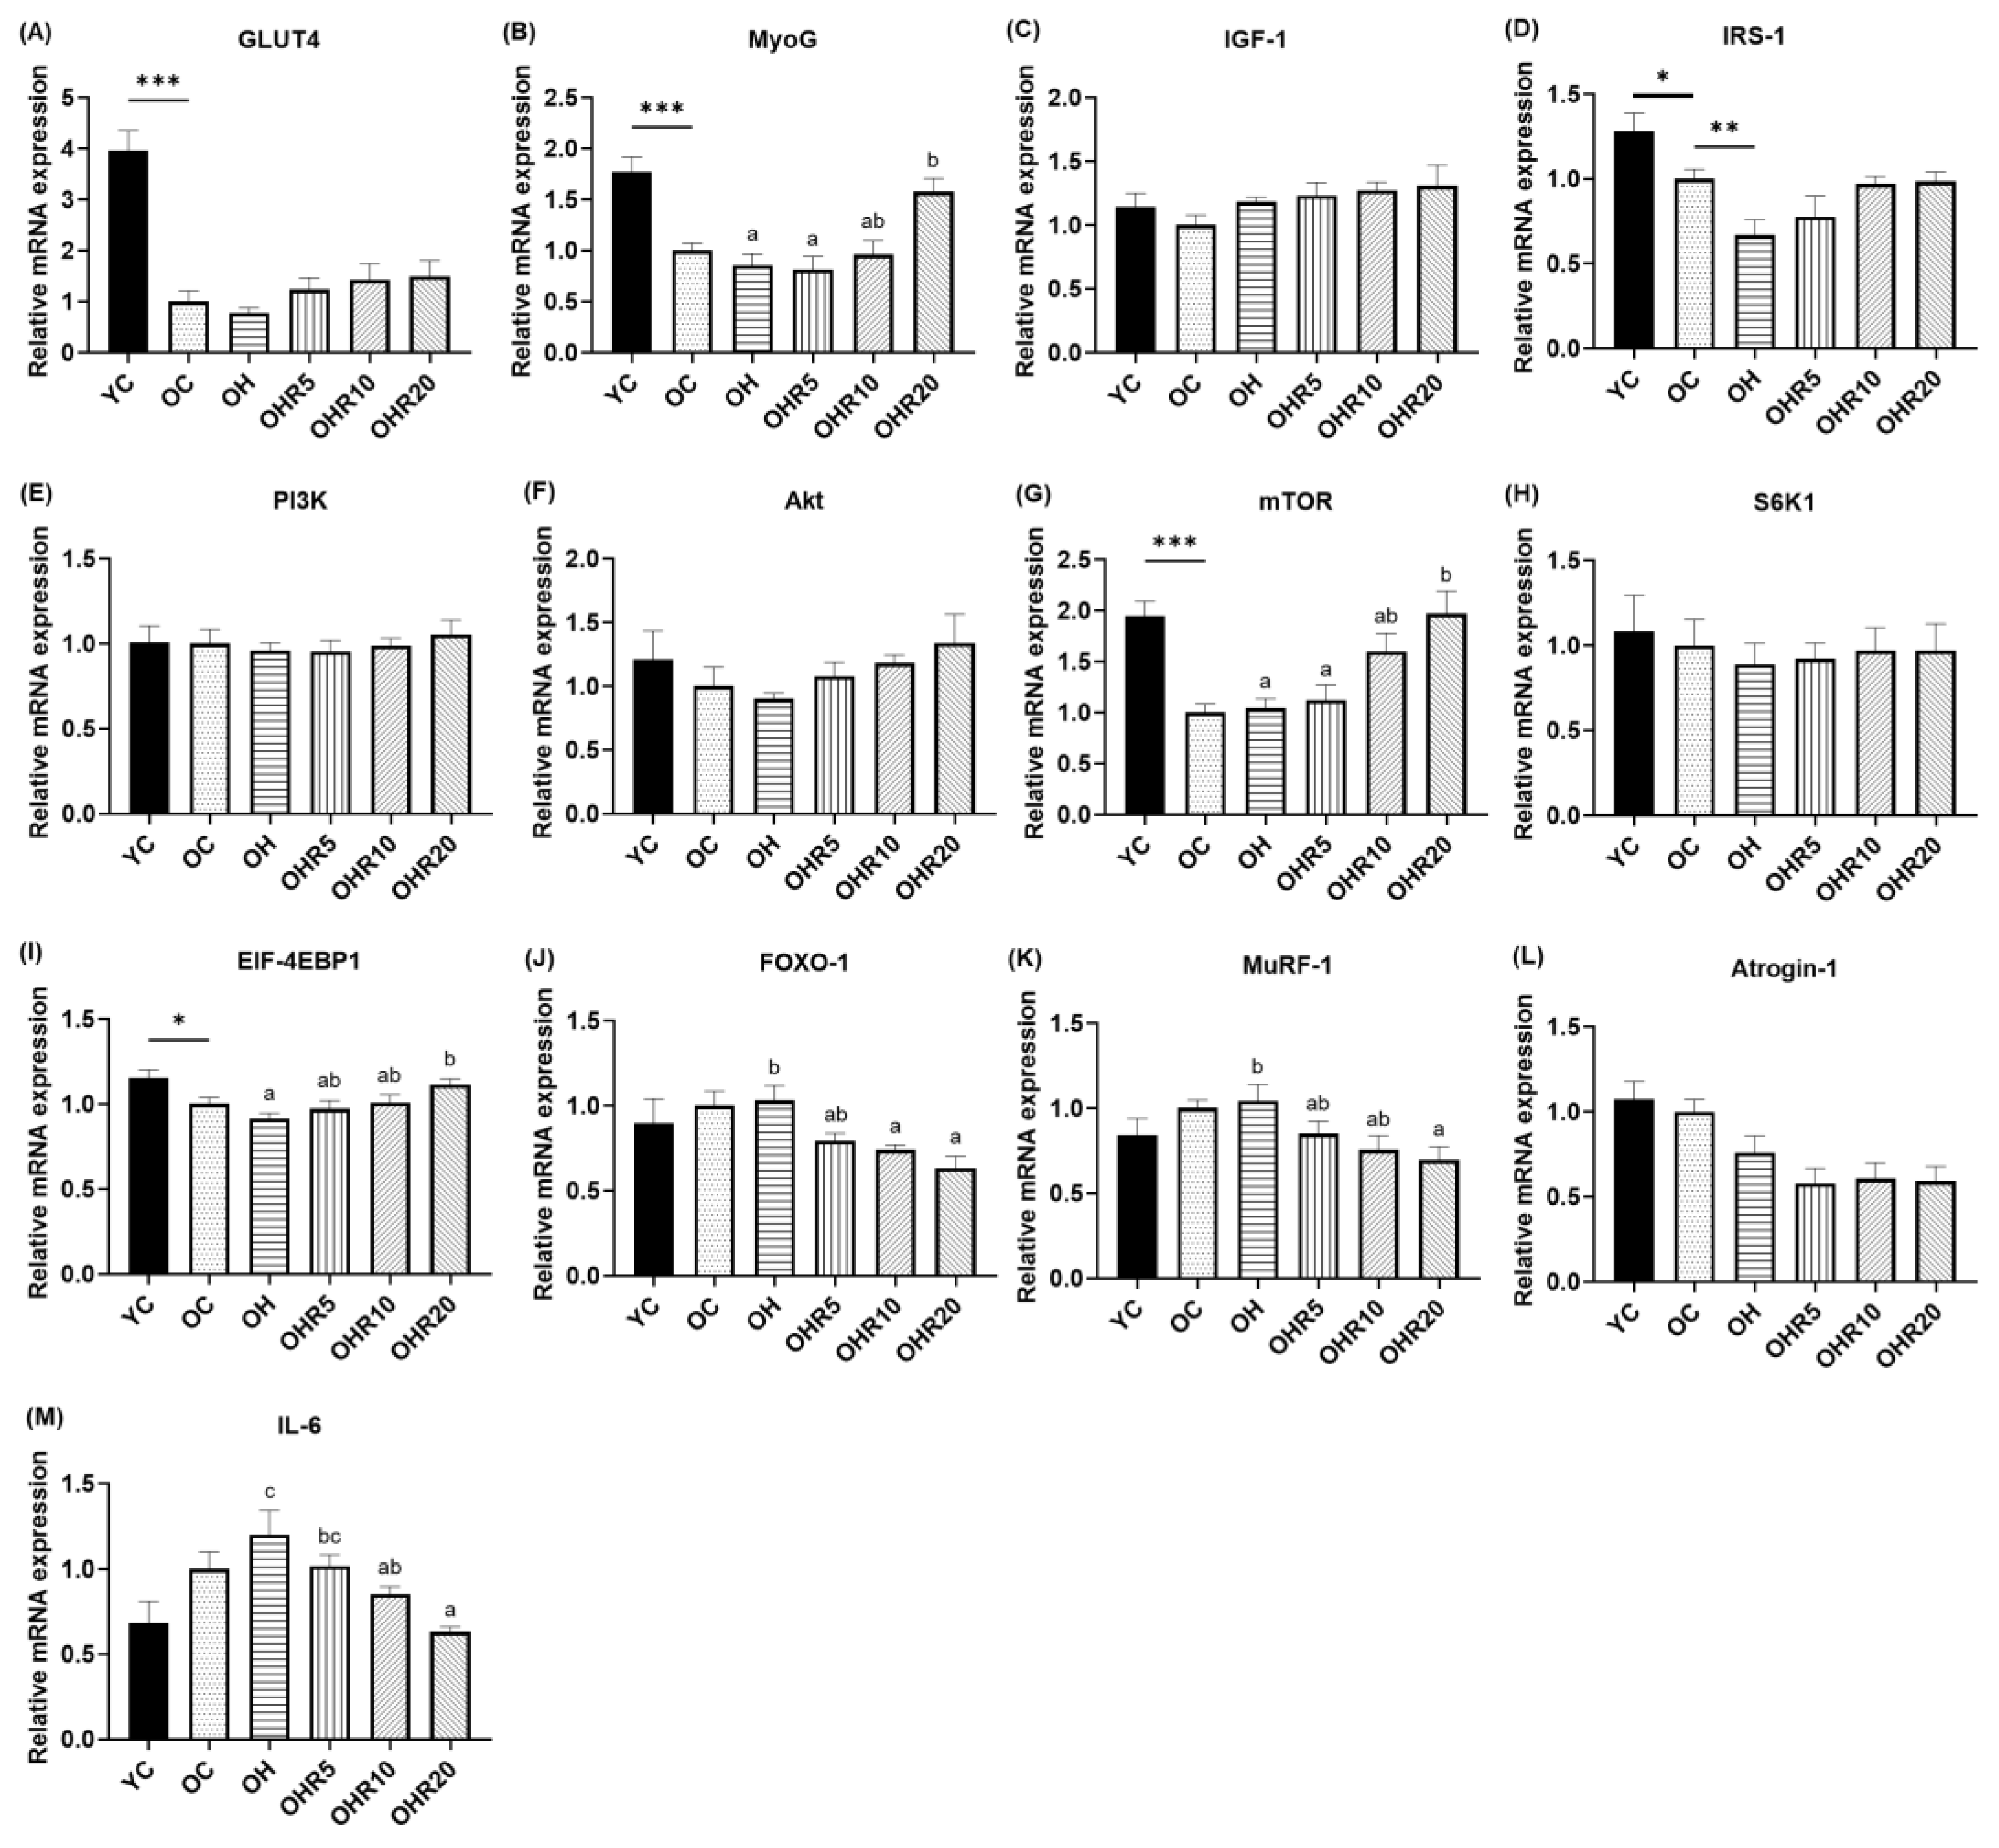
Figure 5.
Effect of full-fat rice bran on the production of short-chain fatty acids. (A) acetate, (B) propionate, and (C) butyrate. Data were expressed as the mean ± SEM (n = 6). The asterisk (*) indicated a significant mean difference between the YC and OC groups or OC and OH groups (p < 0.05*). The superscript letters (a, b, c) indicated a significant mean difference among the OH, OHR5, OHR10, and OHR20 (p < 0.05).
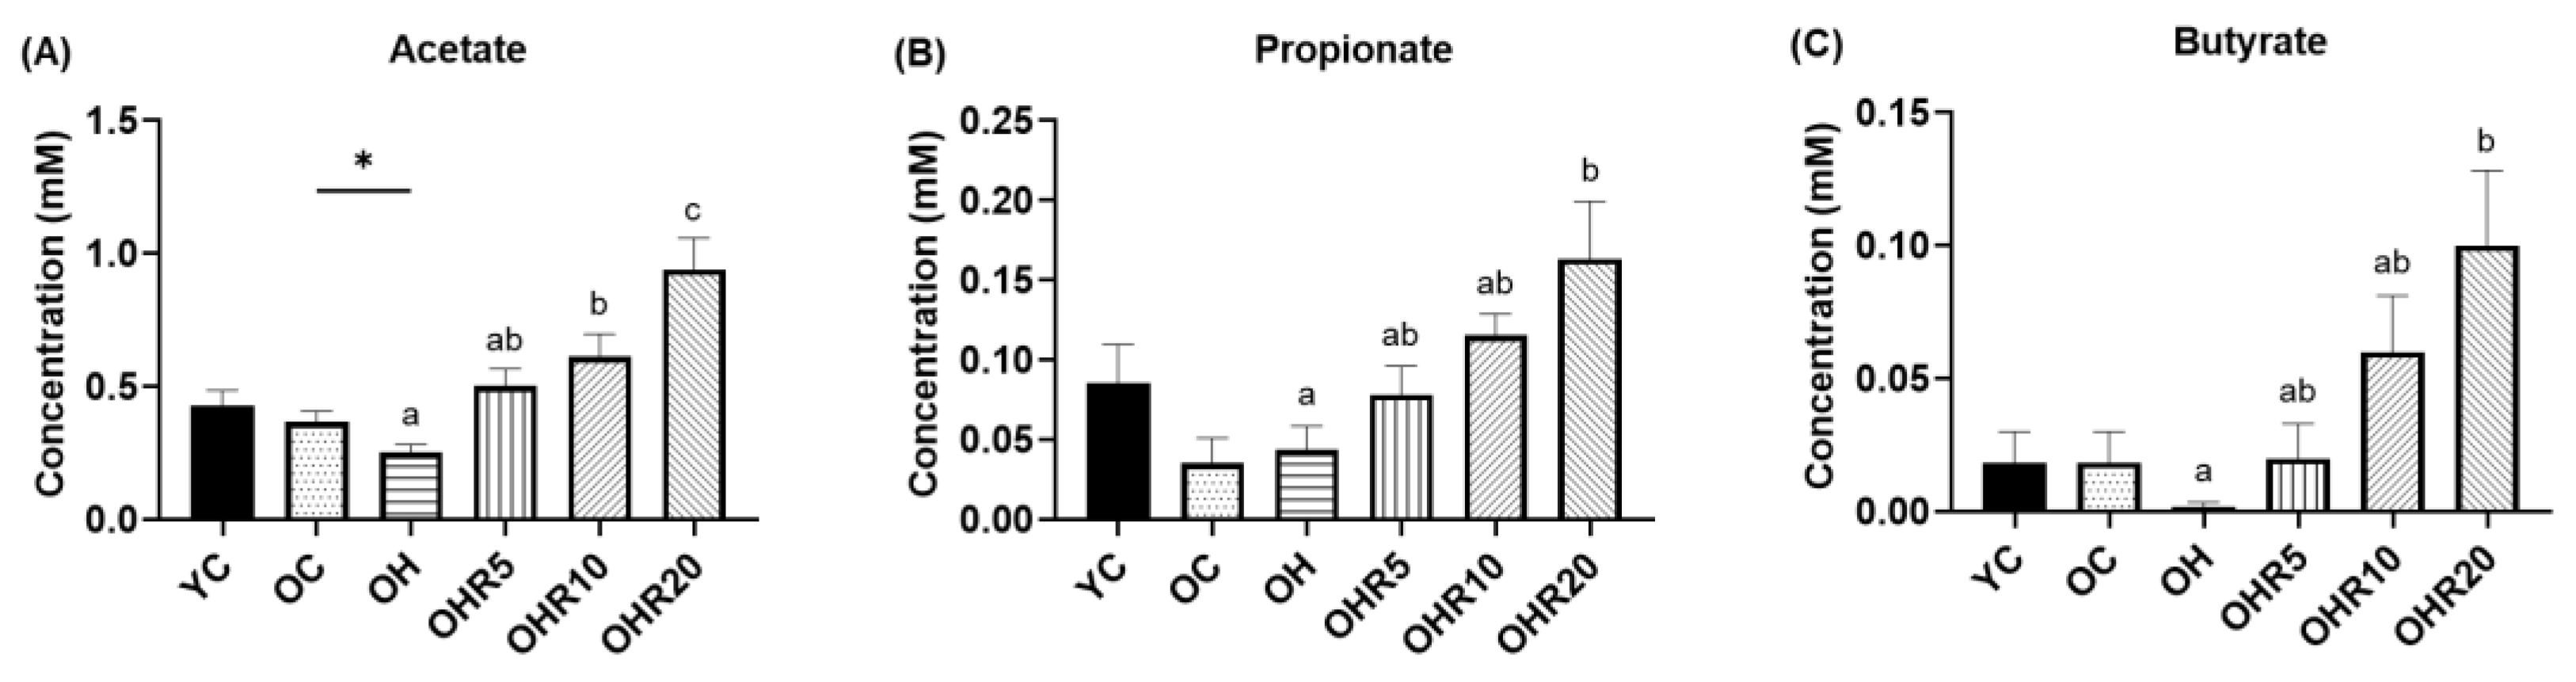
Figure 6.
Effect of full-fat rice bran on intestinal permeability. The relative mRNA expression related to colonic tight junction: (A) ZO-1 and (B) Occludin. Data were expressed as the mean ± SEM (n = 6). The asterisk (*) indicated a significant mean difference between the YC and OC groups or OC and OH groups (p < 0.05*, p < 0.001***). The superscript letters (a, b, c) indicated a significant mean difference among the OH, OHR5, OHR10, and OHR20 (p < 0.05).
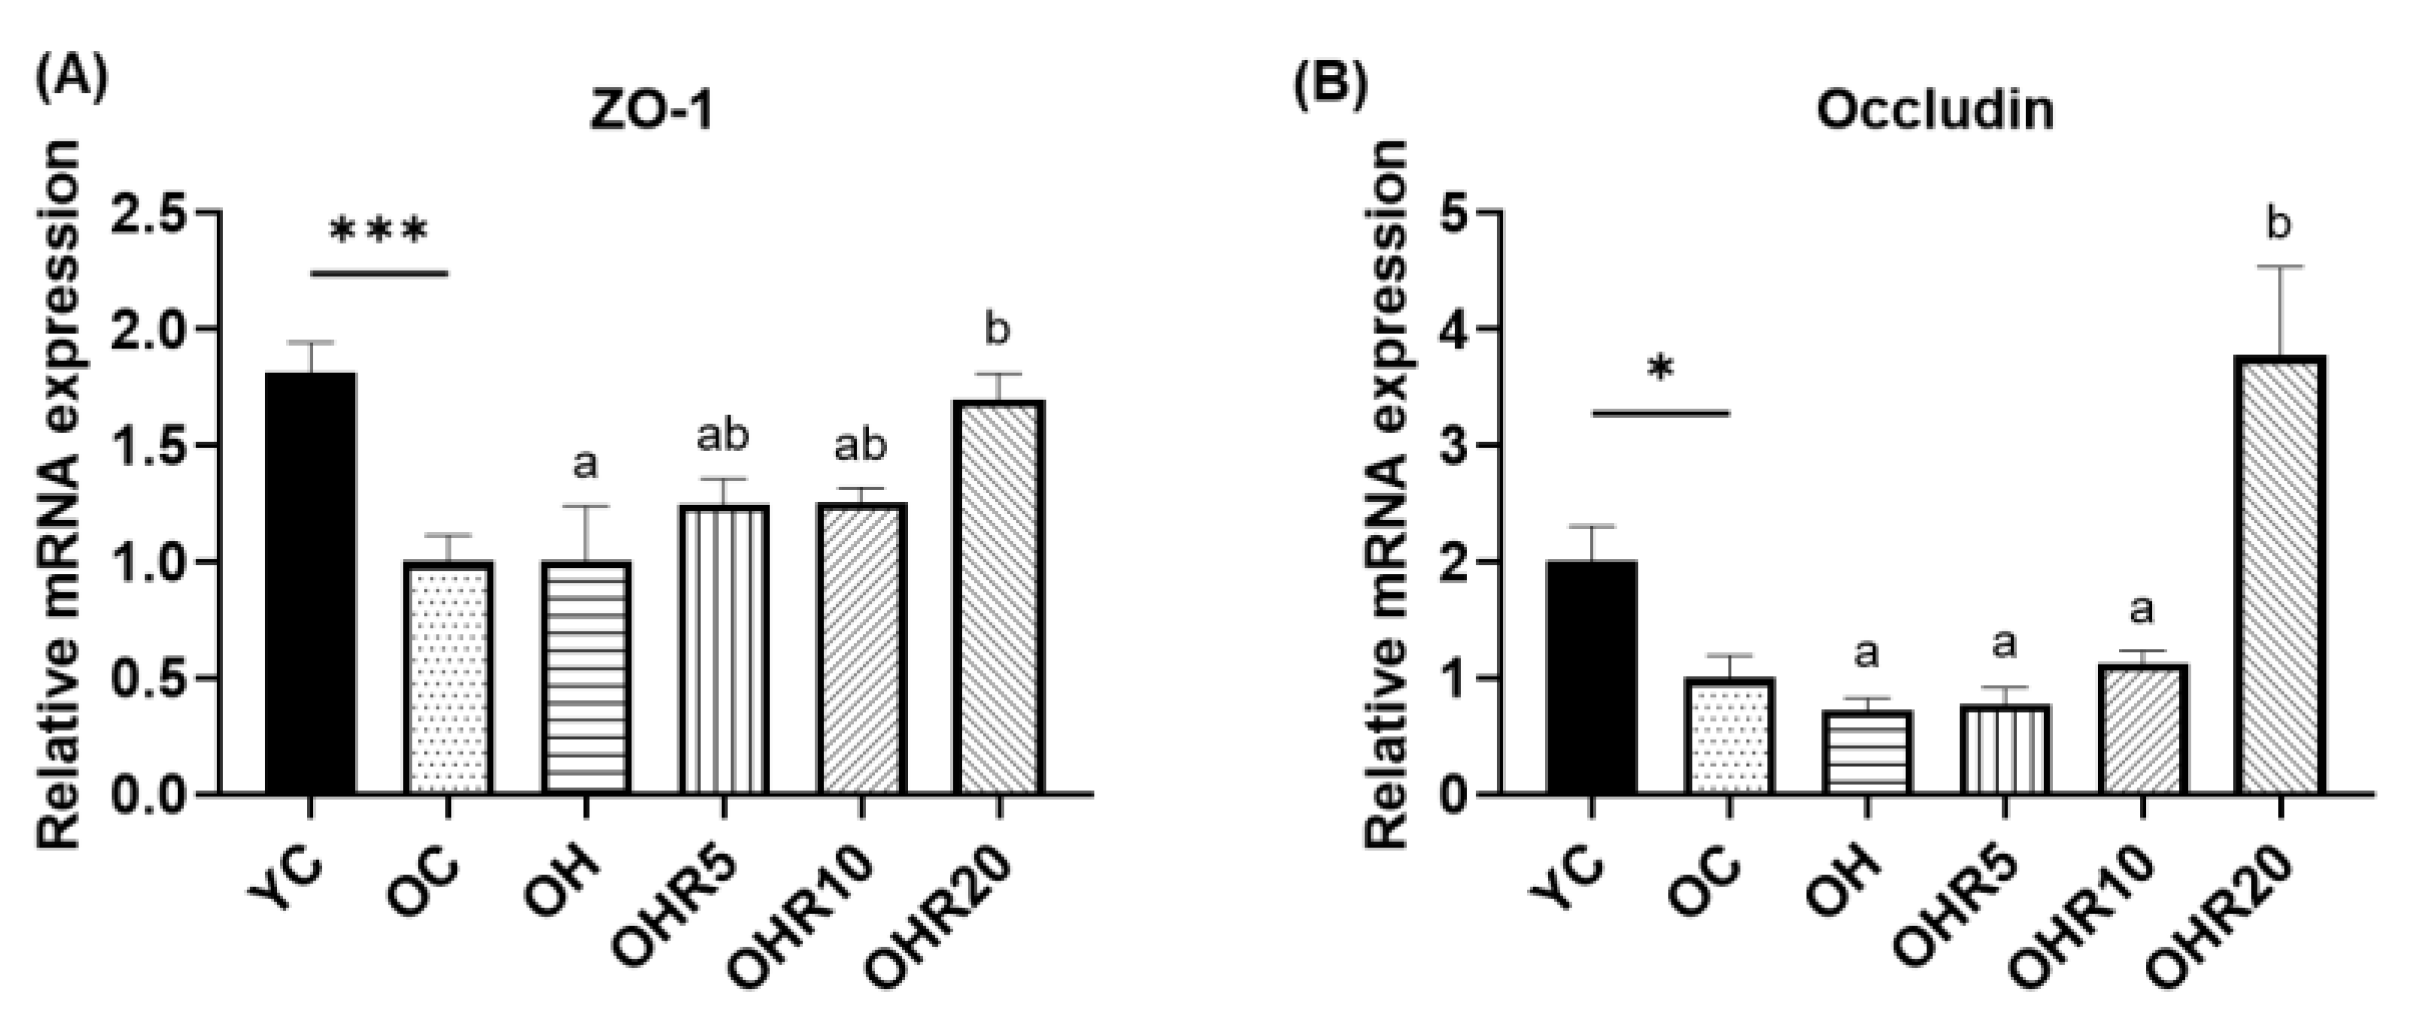
Figure 7.
Effect of full-fat rice bran on gut microbiota composition. (A) Linear discriminant analysis (LDA) effect size cladogram. (B) Histogram of the LDA scores. The significant difference among groups was detected by LDA score ≥ 3. The relative abundance of (C) g_Muribaculum, (D) g_ [Eubacterium]_brachy_group, and (E) g_Lachnospiraceae_UGC_001. Data were expressed as the mean ± SEM (n = 5). The asterisk (*) indicated a significant mean difference between the YC and OC groups or OC and OH groups (p < 0.05*). The superscript letters (a, b) indicated a significant mean difference among the OH, OHR5, OHR10, and OHR20 (p < 0.05).
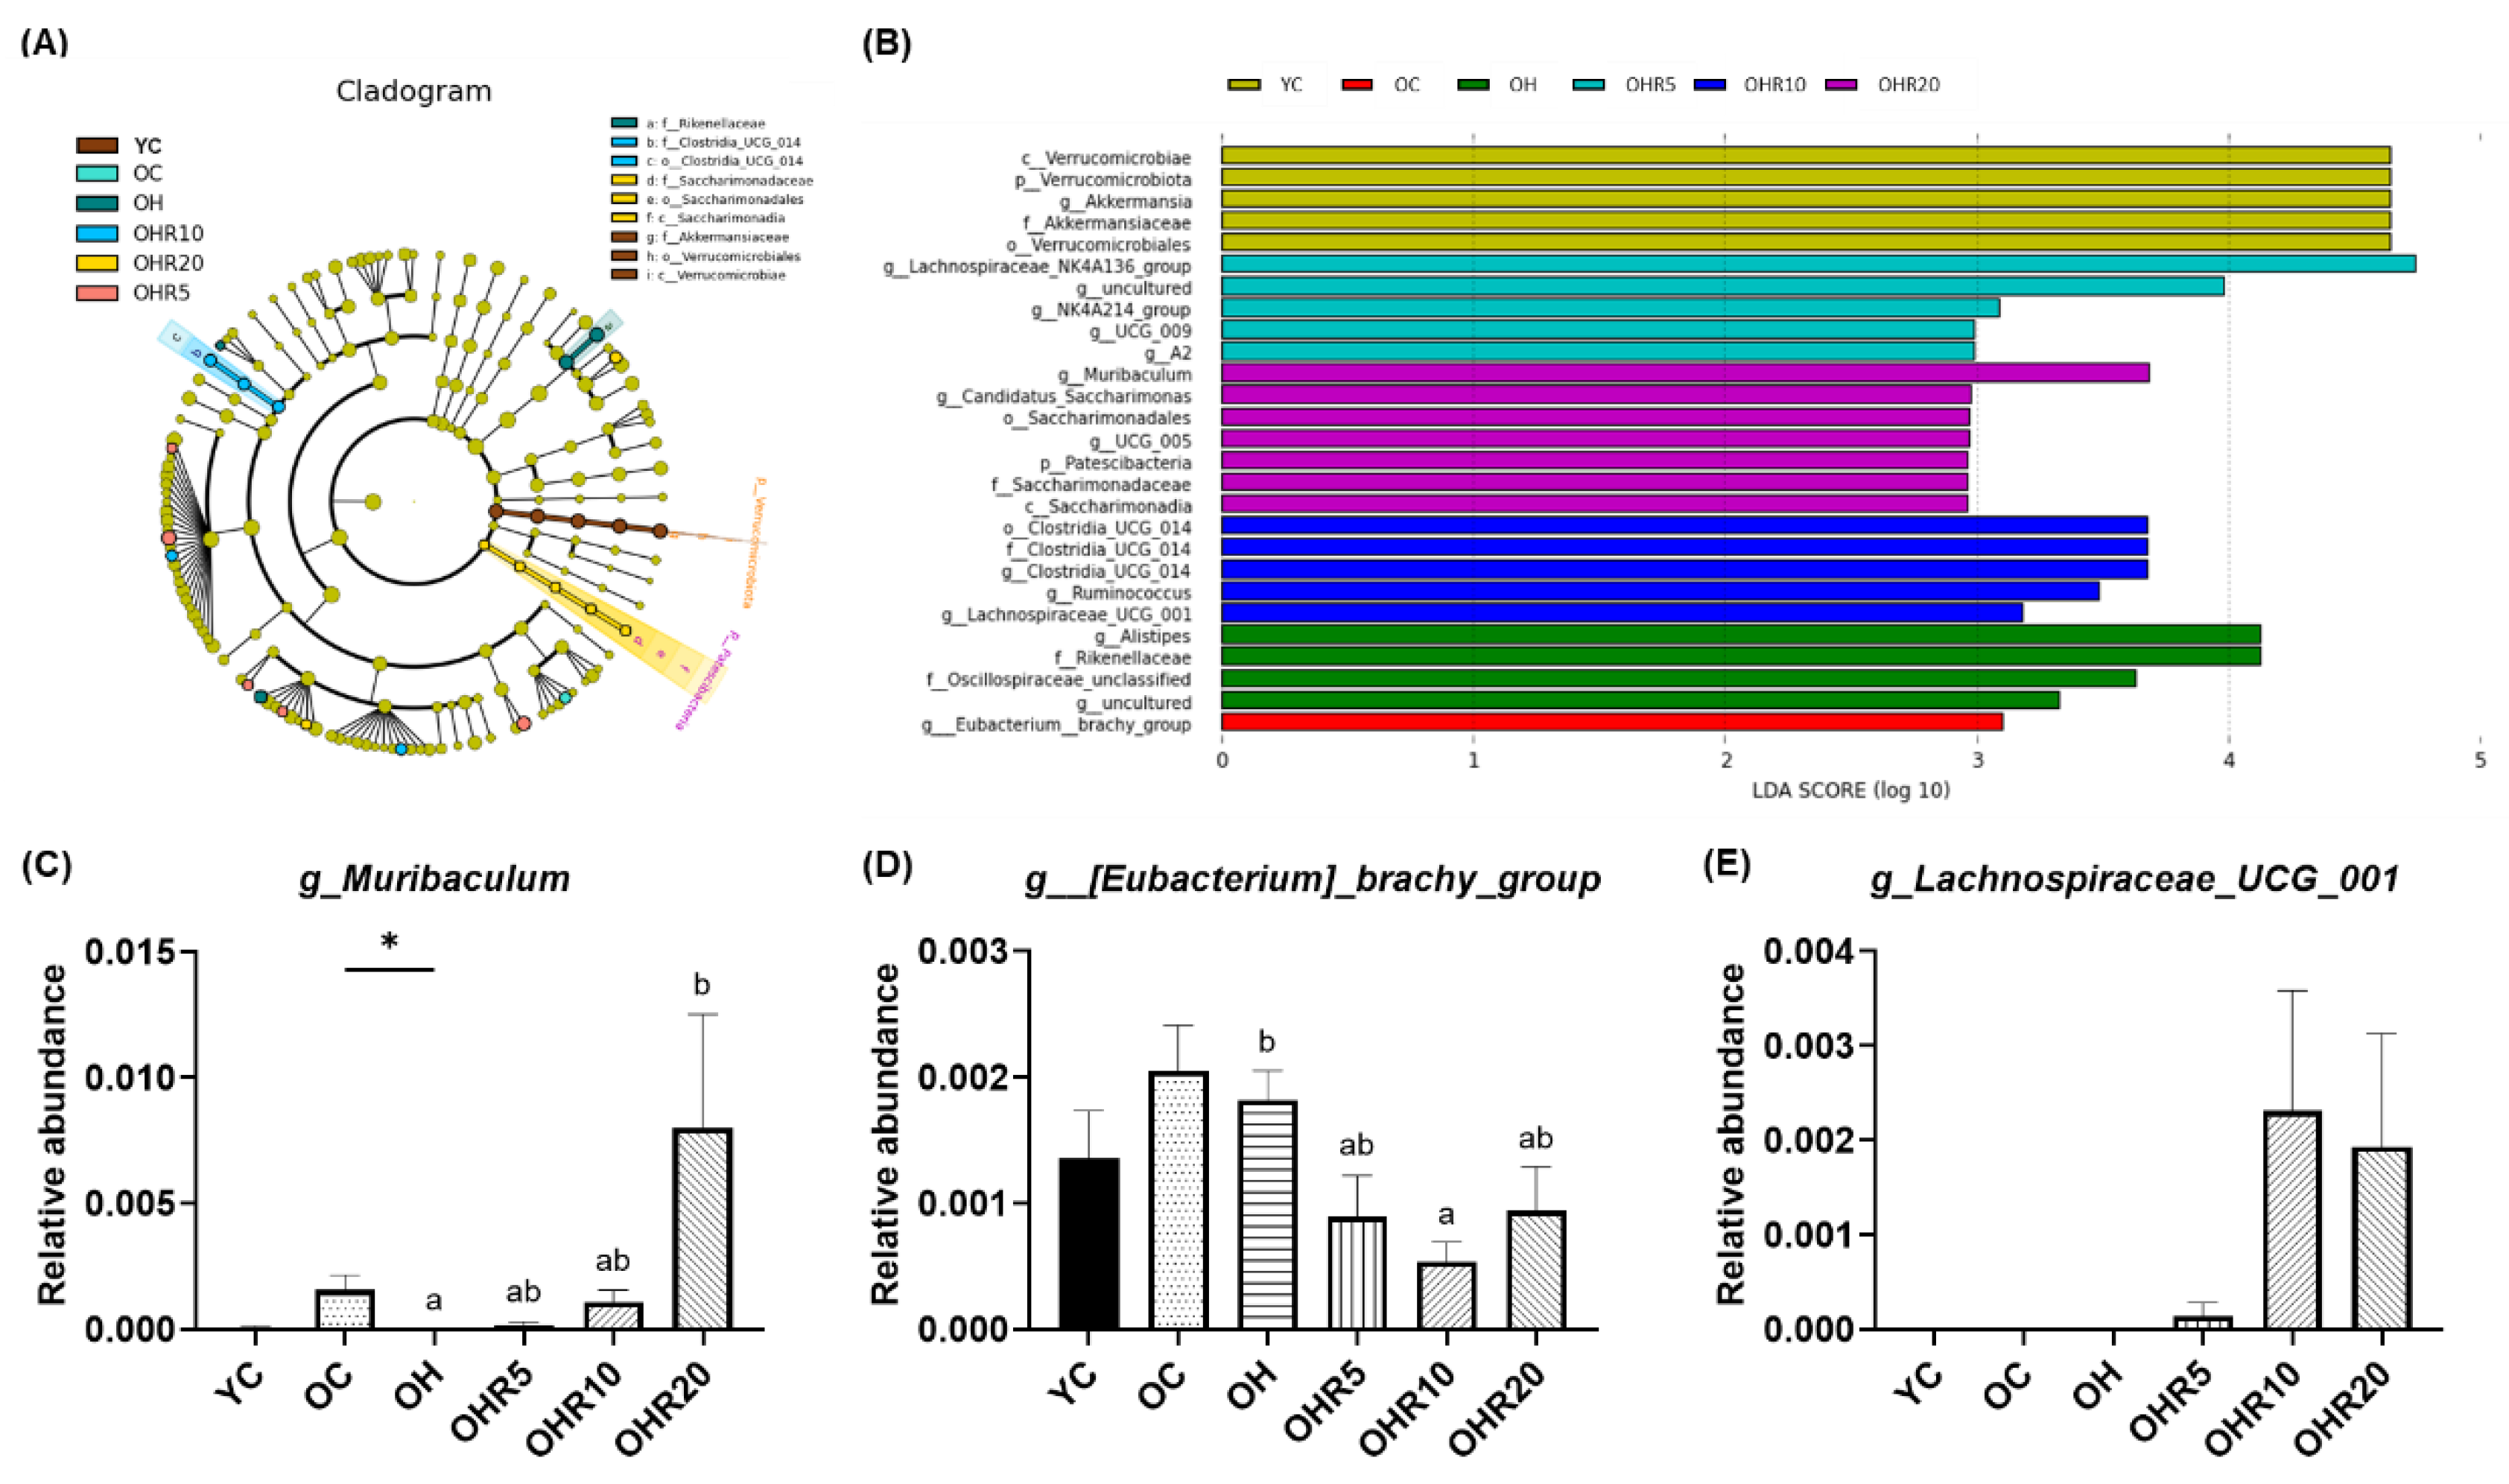
Figure 8.
The correlation heatmap of SCFAs, blood parameter, muscle, and gut microbiota. The asterisk (*) indicated significant difference using Spearman correlation test (p < 0.05*, p < 0.01**, p < 0.001***). Blue: negative correlations; red: positive correlations.
Figure 8.
The correlation heatmap of SCFAs, blood parameter, muscle, and gut microbiota. The asterisk (*) indicated significant difference using Spearman correlation test (p < 0.05*, p < 0.01**, p < 0.001***). Blue: negative correlations; red: positive correlations.
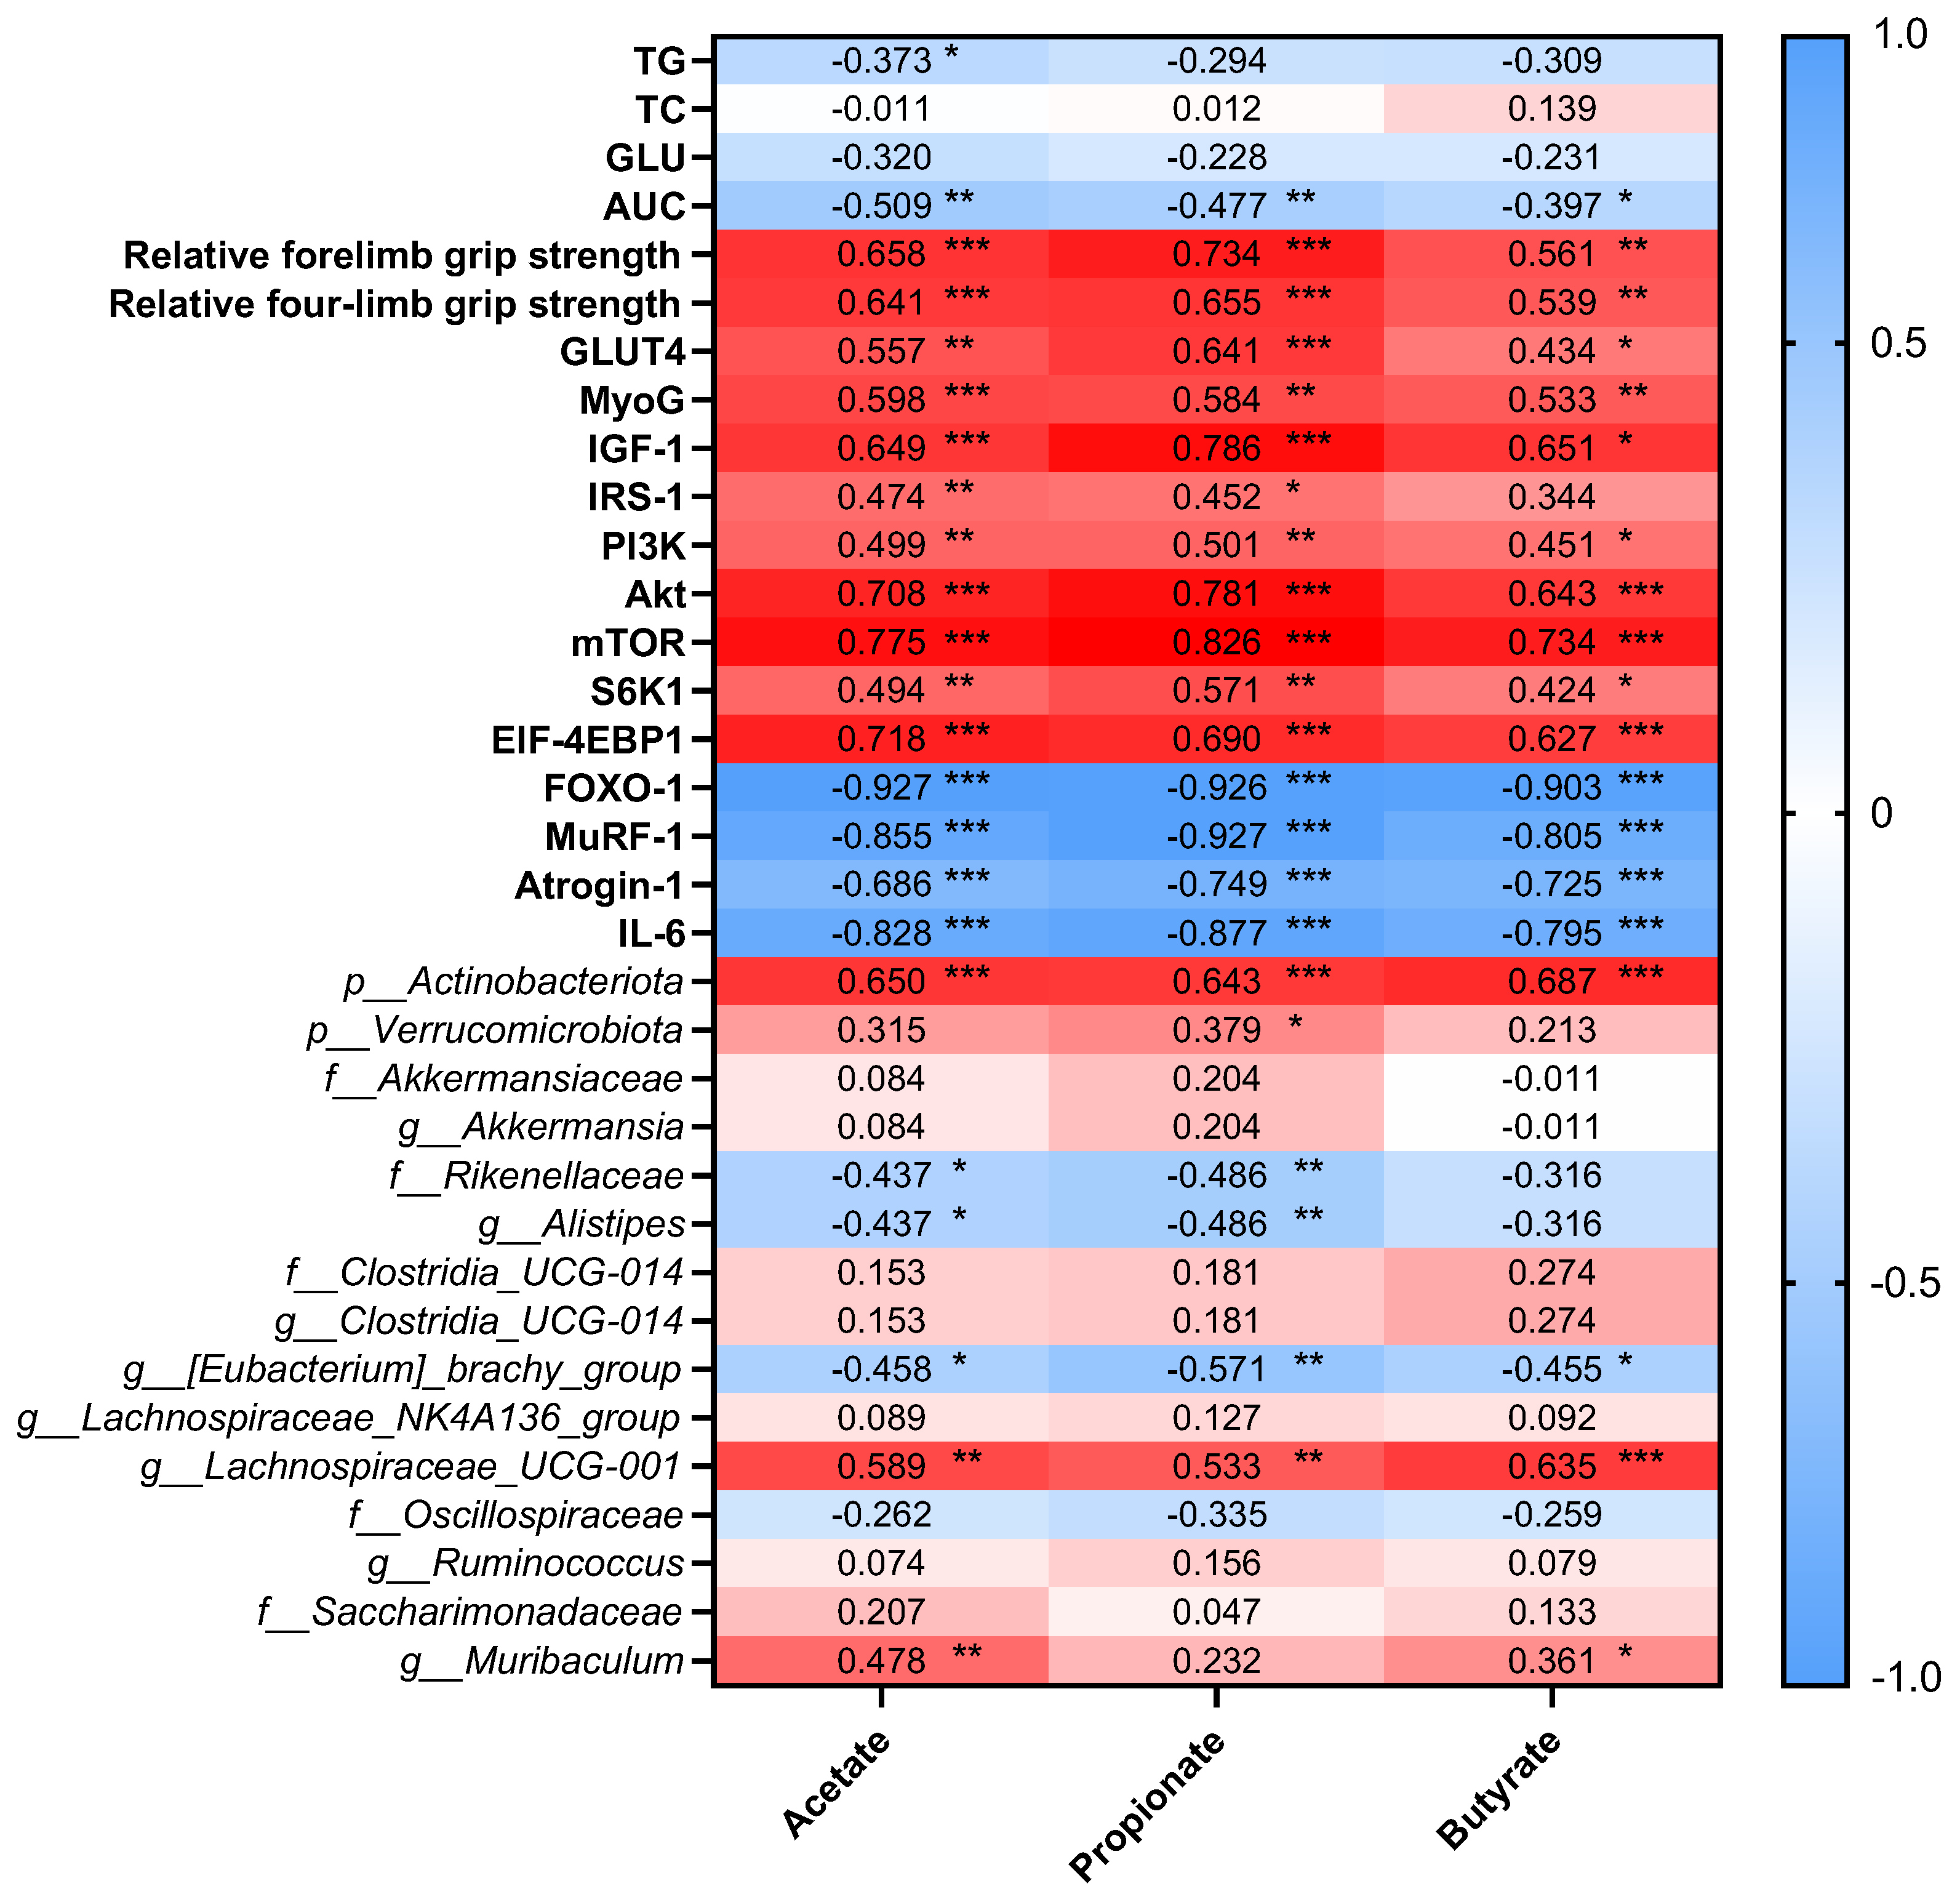

Table 1.
Diet composition of experimental groups.
| YC | OC | OH | OHR5 | OHR10 | OHR20 | |
| Energy (kcal) | 3808.00 | 3808.00 | 4808.00 | 4842.40 | 4874.30 | 4943.60 |
| Protein (kcal%) | 14.90 | 14.90 | 11.81 | 11.73 | 11.65 | 11.57 |
| Fat (kcal%) | 9.50 | 9.50 | 44.93 | 44.63 | 44.37 | 43.62 |
| Carbohydrate (kcal%) | 75.60 | 75.60 | 43.26 | 43.63 | 43.98 | 44.81 |
| Ingredients (g/kg) | ||||||
| Cornstarch | 465.0 | 465.0 | 265.0 | 244.0 | 222.5 | 182.0 |
| Maltodextrin | 155.0 | 155.0 | 155.0 | 155.0 | 155.0 | 155.0 |
| Sucrose | 100.0 | 100.0 | 100.0 | 100.0 | 100.0 | 100.0 |
| Casein | 140.0 | 140.0 | 140.0 | 133.0 | 125.9 | 112.8 |
| L-Cysteine | 2.0 | 2.0 | 2.0 | 2.0 | 2.0 | 2.0 |
| Soybean oil | 40.0 | 40.0 | 120.0 | 113.0 | 106.0 | 91.0 |
| Lard | 0.0 | 0.0 | 120.0 | 120.0 | 120.0 | 120.0 |
| Cellulose | 50.0 | 50.0 | 50.0 | 38.7 | 27.5 | 5.0 |
| Mineral Mix (AIN-93M-MIX) | 35.0 | 35.0 | 35.0 | 31.7 | 28.3 | 21.6 |
| Vitamin Mix (AIN-93M-MIX) | 10.0 | 10.0 | 10.0 | 9.5 | 9.0 | 8.0 |
| Choline Bitartrate | 3.0 | 3.0 | 3.0 | 3.0 | 3.0 | 3.0 |
| Tert-butylhydroquinone | 0.008 | 0.008 | 0.008 | 0.008 | 0.008 | 0.008 |
| Rice bran | 0.0 | 0.0 | 0.0 | 50.0 | 100.0 | 200.0 |
| Total | 1000.008 | 1000.008 | 1000.008 | 1000.400 | 1000.200 | 1000.400 |
Cornstarch: MP Biomedicals, Cat. No. 90295625, CA, USA; maltodextrin: MP Biomedicals, Cat. No. 96004801, CA, USA; sucrose: Taiwan Sugar, Taiwan; casein: MP Biomedicals, Cat. No. 90129325, CA, USA; L-cysteine: MP Biomedicals, Cat. No. 10145480, CA, USA; soybean oil: Taiwan Sugar, Taiwan; lard: I-Mei, Taiwan; cellulose: MP Biomedicals, Cat. No. 90045305, CA, USA; AIN-93M mineral mix: MP Biomedicals, Cat. No. 96040102, CA, USA; AIN-93M vitamin mix: MP Biomedicals, Cat. No. 96040201, CA, USA; choline bitartrate: UNI-ONWARD, Cat. No. SI-C1629, New Taipei City, Taiwan; tert-butylhydroquinone: UNI-ONWARD, Cat. No. AL-112941, New Taipei City, Taiwan.
Table 2.
Primer sequences used for real-time quantitative polymerase chain reaction analysis.
| Gene Name | Primer sequence (5’-3’) | |
| Forward | Reverse | |
| GAPDH | AACGACCCCTTCATTGAC | TCCACGACATACTCAGCAC |
| GLUT4 | ATTGCAGCGCCTGAGTCTTT | GAGGGGGTTCCCCATCCTTA |
| MyoG | AGTGAATGCAACTCCCACAG | CTGGGAAGGCAACAGACATA |
| IGF-1 | CAATACAGCCAACGGGAAACAG | AACAAAGCTGGATGCCTGTCA |
| IRS-1 | CCGGATACCGATGGCTTCTC | CCGCCACTTCTTCTCGTTCT |
| PI3K | GGGAGCAGCCTGGATGATTT | AGCGATTGGTTCCCCACAAT |
| Akt | GCTTGCGGTCTGATGTTTTCT | GCCTTTTCCAGCCACAAACA |
| mTOR | CGTCACAATGCAGCCAACAA | TGCCTTTCACGTTCCTCTCC |
| S6K1 | ACACCCTCCATCCTGGAGTAA | TTGTTCACGATAAGTCTCCACCT |
| eIF-4EBP1 | TCACTAGCCCTACCAGCGAT | TTGTGACTCTTCACCGCCTG |
| FOXO1 | CGGAAAATCACCCCGGAGAA | TACACCAGGGAATGCACGTC |
| Atrogin-1 | AACCGGGAGGCCAGCTAAAGAACA | TGGGCCTACAGAACAGACAGTGC |
| MuRF-1 | CCTTGAGGGCCATTGACTTG | TCCCCTCAGAACTCAAGAGGAA |
| IL-6 | GTCCTTCCTACCCCAATTTCCA | TGGTCTTGGTCCTTAGCCAC |
| ZO-1 | GGCACATCAGCACGATTTCT | CCACAAAAGAAATCCTTTCACACCT |
| Occludin | ACTGGGTCAGGGAATATCCA | TCAGCAGCAGCCATGTACTC |
Table 3.
The conditions set in the GC program.
| GC program | Conditions |
| Injection location | Front |
| Injection volume | 1 μL |
| Solvent A washes | Ethyl acetate, 2 μL, 2 times pre-injection, 2 times post-injection |
| Sample washes | 2 μL, 2 times pre-injection |
| Sample pumps | 2 |
| Plunger speed | Slow |
| Inlet temperature | 200 °C |
| Inlet pressure | 16.288 psi |
| Inlet mode | Pulsed split |
| Split flow | 60 mL/min |
| Column flow | Constant flow |
| Post run | 1.2 mL/min (same as set point flow) |
| Capillary column | Nukol™ 30 m × 0.25 mm × 0.25 μm |
| Carrier gas type | Helium |
| Oven temperature | Initial: 90 °C |
| Ramp 1: rate 15 °C/min; value 150 °C; hold time 1 min | |
| Ramp 2: rate 3 °C/min; value 170 °C; hold time 2 min | |
| Ramp 3: rate 50 °C/min; value 200 °C; hold time 2 min | |
| Post run: 90 °C | |
| AUX heaters | 200 °C |
Table 4.
Nutrient contents of Tainung No. 81 full-fat rice bran.
| Nutrient Contents | 100 g |
|---|---|
| Energy (kcal) | 418.7 |
| Protein (g) | 14.1 |
| Fat (g) | 14.3 |
| Carbohydrate (g) | 58.4 |
| Soluble fiber (g) | 1.6 |
| Insoluble fiber (g) | 20.9 |
| Sugars (g) | 5.2 |
| Sodium (mg) | 5.4 |
| Moisture (g) | 6.5 |
| Ash (g) | 6.7 |
Table 5.
Amino acid contents in Tainung No. 81 full-fat rice bran.
| Amino Acids | mg/kg |
|---|---|
| Alanine | 7870 |
| Arginine | 9678 |
| Aspartic acid | 13452 |
| Cystine | 1582 |
| Glutamic acid | 18758 |
| Glycine | 6318 |
| Histidine | 4374 |
| Isoleucine | 5133 |
| Leucine | 9016 |
| Lysine | 5935 |
| Methionine | 1662 |
| Phenylalanine | 5815 |
| Proline | 6560 |
| Serine | 5557 |
| Threonine | 4743 |
| Tyrosine | 2557 |
| Valine | 7389 |
| Tryptophan | 1540 |
Disclaimer/Publisher’s Note: The statements, opinions and data contained in all publications are solely those of the individual author(s) and contributor(s) and not of MDPI and/or the editor(s). MDPI and/or the editor(s) disclaim responsibility for any injury to people or property resulting from any ideas, methods, instructions or products referred to in the content. |
© 2026 by the authors. Licensee MDPI, Basel, Switzerland. This article is an open access article distributed under the terms and conditions of the Creative Commons Attribution (CC BY) license.
Copyright: This open access article is published under a Creative Commons CC BY 4.0 license, which permit the free download, distribution, and reuse, provided that the author and preprint are cited in any reuse.


