1. Introduction
With economic development and social progress, human energy consumption is also increasing year by year, resulting in many pollutants and increasingly serious air pollution. Generally, the air quality index (AQI) is used to characterize the air quality level, and its value depends on the concentration of six pollutants in the atmosphere, including PM2.5, PM10, SO2, NO2, CO and O3. Among these air pollutants, aerosol particles, especially those with an aerodynamic diameter greater than 2.5 μm (PM2.5), not only cause serious harm to the human body but also cause huge economic losses to society. Although the governance of PM2.5 has achieved remarkable results in recent years, the task of emission reduction is still very arduous. Therefore, the accurate prediction of pollutant concentrations plays a key role in society and people’s daily activities.
In the aspect of PM
2.5 pollution concentration prediction, numerical models and machine learning models are the two mainstream models used to predict the concentration of the air pollutant PM
2.5. The numerical model studies the diffusion mode of PM
2.5 pollution source substances and the mathematical relationship between PM
2.5 pollution source substances and PM
2.5 concentration and then summarizes the diffusion equation in mathematical form between them and numerically solves the equation. A good numerical model can accurately predict the concentration of air pollutants under specific meteorological conditions, specific places and specific times. The Community Multiscale Air Quality Model (CMAQ) [
1] and Weather Research and Forecasting Model with Cheemistry (WRF-Chem) [
2] are two mainstream numerical prediction models of air pollutants.
The CMAQ model is one of the most studied models by scholars at home and abroad. It is a numerical model developed by the leadership of the atmospheric model and analysis department under the exposure Research Laboratory of the U.S. Environmental Protection Agency. Chemel C [
3] applied the CMAQ model to study the concentration of air pollutants in the UK and predict the concentration of PM
2.5 in the UK. Their research results provide an important reference for the UK to formulate relevant policies. Djalalova I [
4] established a CMAQ model based on the historical data of the United States to predict the hourly PM
2.5 concentration in the United States within 12 months. The model results show that PM
2.5 is highly dependent on the concentration deviation under the CMAQ model. In China, some scholars use the CMAQ model to study PM
2.5. Shen J [
5] evaluates and compares O
3 simulations over the Pearl River Delta (PRD), and his research results show that the Models-3/CMAQ and CAMx models have better prediction effects. Cheng XH [
6] obtained the dynamic statistical prediction method by combining the CMAQ model and adaptive partial least squares method and studied the temporal and spatial evolution characteristics of PM
2.5 concentrations in China from January to December 2014. The research results provide a new way for air quality prediction, pollution weather early warning and pollution prevention and control. Wu YJ [
7] built a double-layer nested WRF-CMAQ three-dimensional air quality model suitable for Beijing, Tianjin, Hebei and surrounding areas. The model fitting results show that the WRF-CMAQ model simulations of the main meteorological parameters and pollutant concentrations in various cities are in good agreement with the observed values, and it is verified that the ISAM marking results are in good agreement with the main model. The WRF weather forecasting model is a weather forecasting model jointly developed by the U.S. Environmental Monitoring Center and the National Atmospheric Research Center. The WRF-Chem model is obtained by adding the atmospheric chemistry module to the WRF model [
8]. Im U [
9] studied the air pollution in Istanbul in winter by building the CAMQ model and WRF model. The research results are of great significance for exploring the local pollution emission sources in Istanbul. Tuccella P [
10] established the WRF-Chem model to evaluate and study the sensitivity of gases and aerosols in Europe. In summary, the numerical model can not only predict the severity of air pollution but also analyze the sources of air pollutants. The model is intuitive and clear. The limitation of the numerical model is that it requires very detailed air pollution parameters and meteorological data to establish an accurate air pollution prediction model.
In recent years, many scholars have begun to use deep learning models to predict PM
2.5 concentrations [
11,
12,
13]. Yue Q [
14] used a BP, CNN and LSTM to train the historical data of Beijing PM
2.5, and the accuracy of the model reached 81%. Chen PS [
15] combined a BP neural network with a genetic algorithm to study the evolution law of PM
2.5 and verified the effectiveness of the model.
This paper uses the historical data of PM2.5 in Wuhan from 2014 to 2021, decomposes it with the Prophet model, conveniently adds the long short-term memory (LSTM) model to the error prediction, uses the improved particle swarm optimization (PSO) algorithm to carry out weighted hybrid optimization on the hybrid model, and compares the model effect with other prediction models.
2. Models
2.1. Prophet
Prophet is a time series prediction model opened by Facebook in 2017. Prophet is widely used in a flexible and simple way, can automatically fill in missing values, and has a very good prediction effect. Prophet uses the time series decomposition method to predict and model the time series. Prophet’s model constitutes Equation (1):
where
is the trend item,
is the cycle item,
is the holiday item, and
is a random fluctuation term.
(1) Trend term: the trend term of the Prophet model uses the improved logistic growth function to fit the aperiodic changes in the time series (Equation (2)).
where C represents the capacity of the model, that is, the saturation value of growth, which is a function of time t,
represents the growth rate of the model over time,
represents the offset,
represents the mutation point where the growth rate changes during the change of time series, and
represents the change in growth rate at the mutation point.
(2) Periodic term: The Prophet model uses a Fourier series to simulate the periodicity of the time series (Equation (3)):
where
represents a fixed cycle, N represents the number of cycles to be used in the model, and
,
is the parameter to be estimated.
(3) Holiday item: The Prophet model regards the impact of different holidays in a year on the trend change of time series as an independent model and sets a separate dummy variable for each model (Equation (4)):
where
represents the impact of holidays on the predicted value and
represents a dummy variable.
The main advantages of the Prophet model are as follows: it can flexibly adjust the periodicity and make different assumptions about the trend of time series; there is no need to fill in the missing value, and the model will automatically process the missing value; the results that need to be predicted can be obtained in a relatively fast time; and it can adjust the parameters of the prediction model for different scenarios and improve the model.
2.2. LSTM
LSTM is an improved model based on a traditional recurrent neural network. It has good performance in time series prediction. LSTM has a more refined information transmission mechanism, which can solve the problems of insufficient long-term memory, gradient vanishing or gradient explosion faced by RNN in practical applications, allowing LSTM to deal with the long-term dependence problem in time series.
LSTM relies on the three units of the input gate, output gate and forget gate to control and protect the cell state. The input gate controls the inflow of information, and the output gate controls the outflow of information. The forget gate controls the strength of the memory unit to record the historical cell state. The main functions of each state gate are as follows:
(1) Input gate: determine which information enters the cell state and update the cell state information. Determine the value to be updated through the sigmoid function, then create a new value vector through the tanh function, and finally update the latest cell state (Equation (5)):
where
and
are the weight vectors and
and
are the deviation vectors.
(2) Forget gate: through selective processing of historical information, we can determine which information needs to be lost and which information needs to be retained in the cell state. Enter
and
. The forgetting gate
is calculated by the sigmoid function (Equation (6)):
where
is the weight vector and
is the deviation vector.
(3) Output gate: determine the information to be output. First, the sigmoid function is used to convert the output value into 0 and 1. 1 means output, 0 means no output. Multiply the cell state by the obtained value to output the final information (Equation (7)).
where
is the weight vector and
is the deviation vector.
2.3. Improved PSO
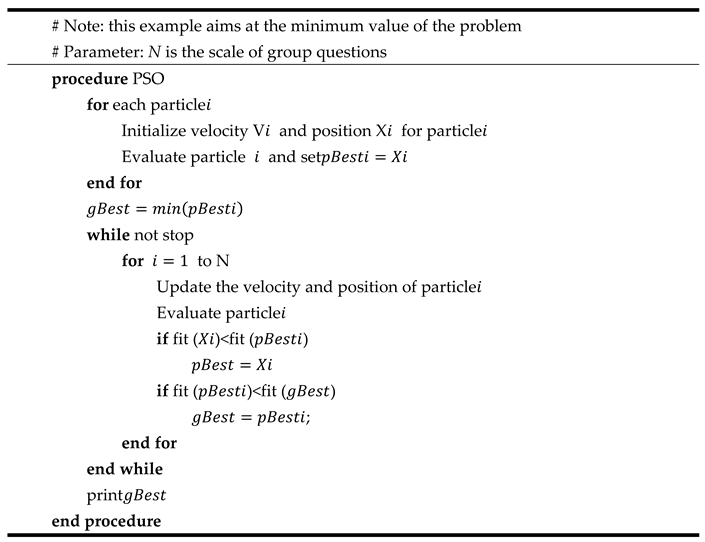
The PSO algorithm is a global search algorithm proposed by Eberhart in 1995. PSO is a random search algorithm that simulates biological activities in nature and swarm intelligence. In addition to considering the group activities of simulated organisms, the PSO algorithm integrates individual cognition and social influence, which is a swarm intelligence algorithm. It requires each particle to maintain two vectors, velocity vector and position vector, where
i is the number of the example and D is the dimension of the problem. The velocity of a particle determines the direction and velocity of its motion, and the position reflects the position of the solution represented by the example in the solution space, which is the basis for evaluating the quality of the solution. The algorithm also requires each particle to maintain its own historical optimal position vector (
pBest) and a global optimal vector (
gBest) in the swarm. The improved PSO algorithm uses cached (persistent) computing to accelerate the algorithm. Data caching occurs when these persistent data can be accessed between multiple operations. When an RDD persists, other partitions of each node can be calculated in memory using RDD, and other action operations on the data will directly use the data in memory. This will speed up the calculation of future action operations (usually 10 times faster). Because there is a lot of repetitive work on Bates input in this model, the operation speed of the model can be significantly improved by using this algorithm. The pseudocode of the algorithm is shown in
Table 1.
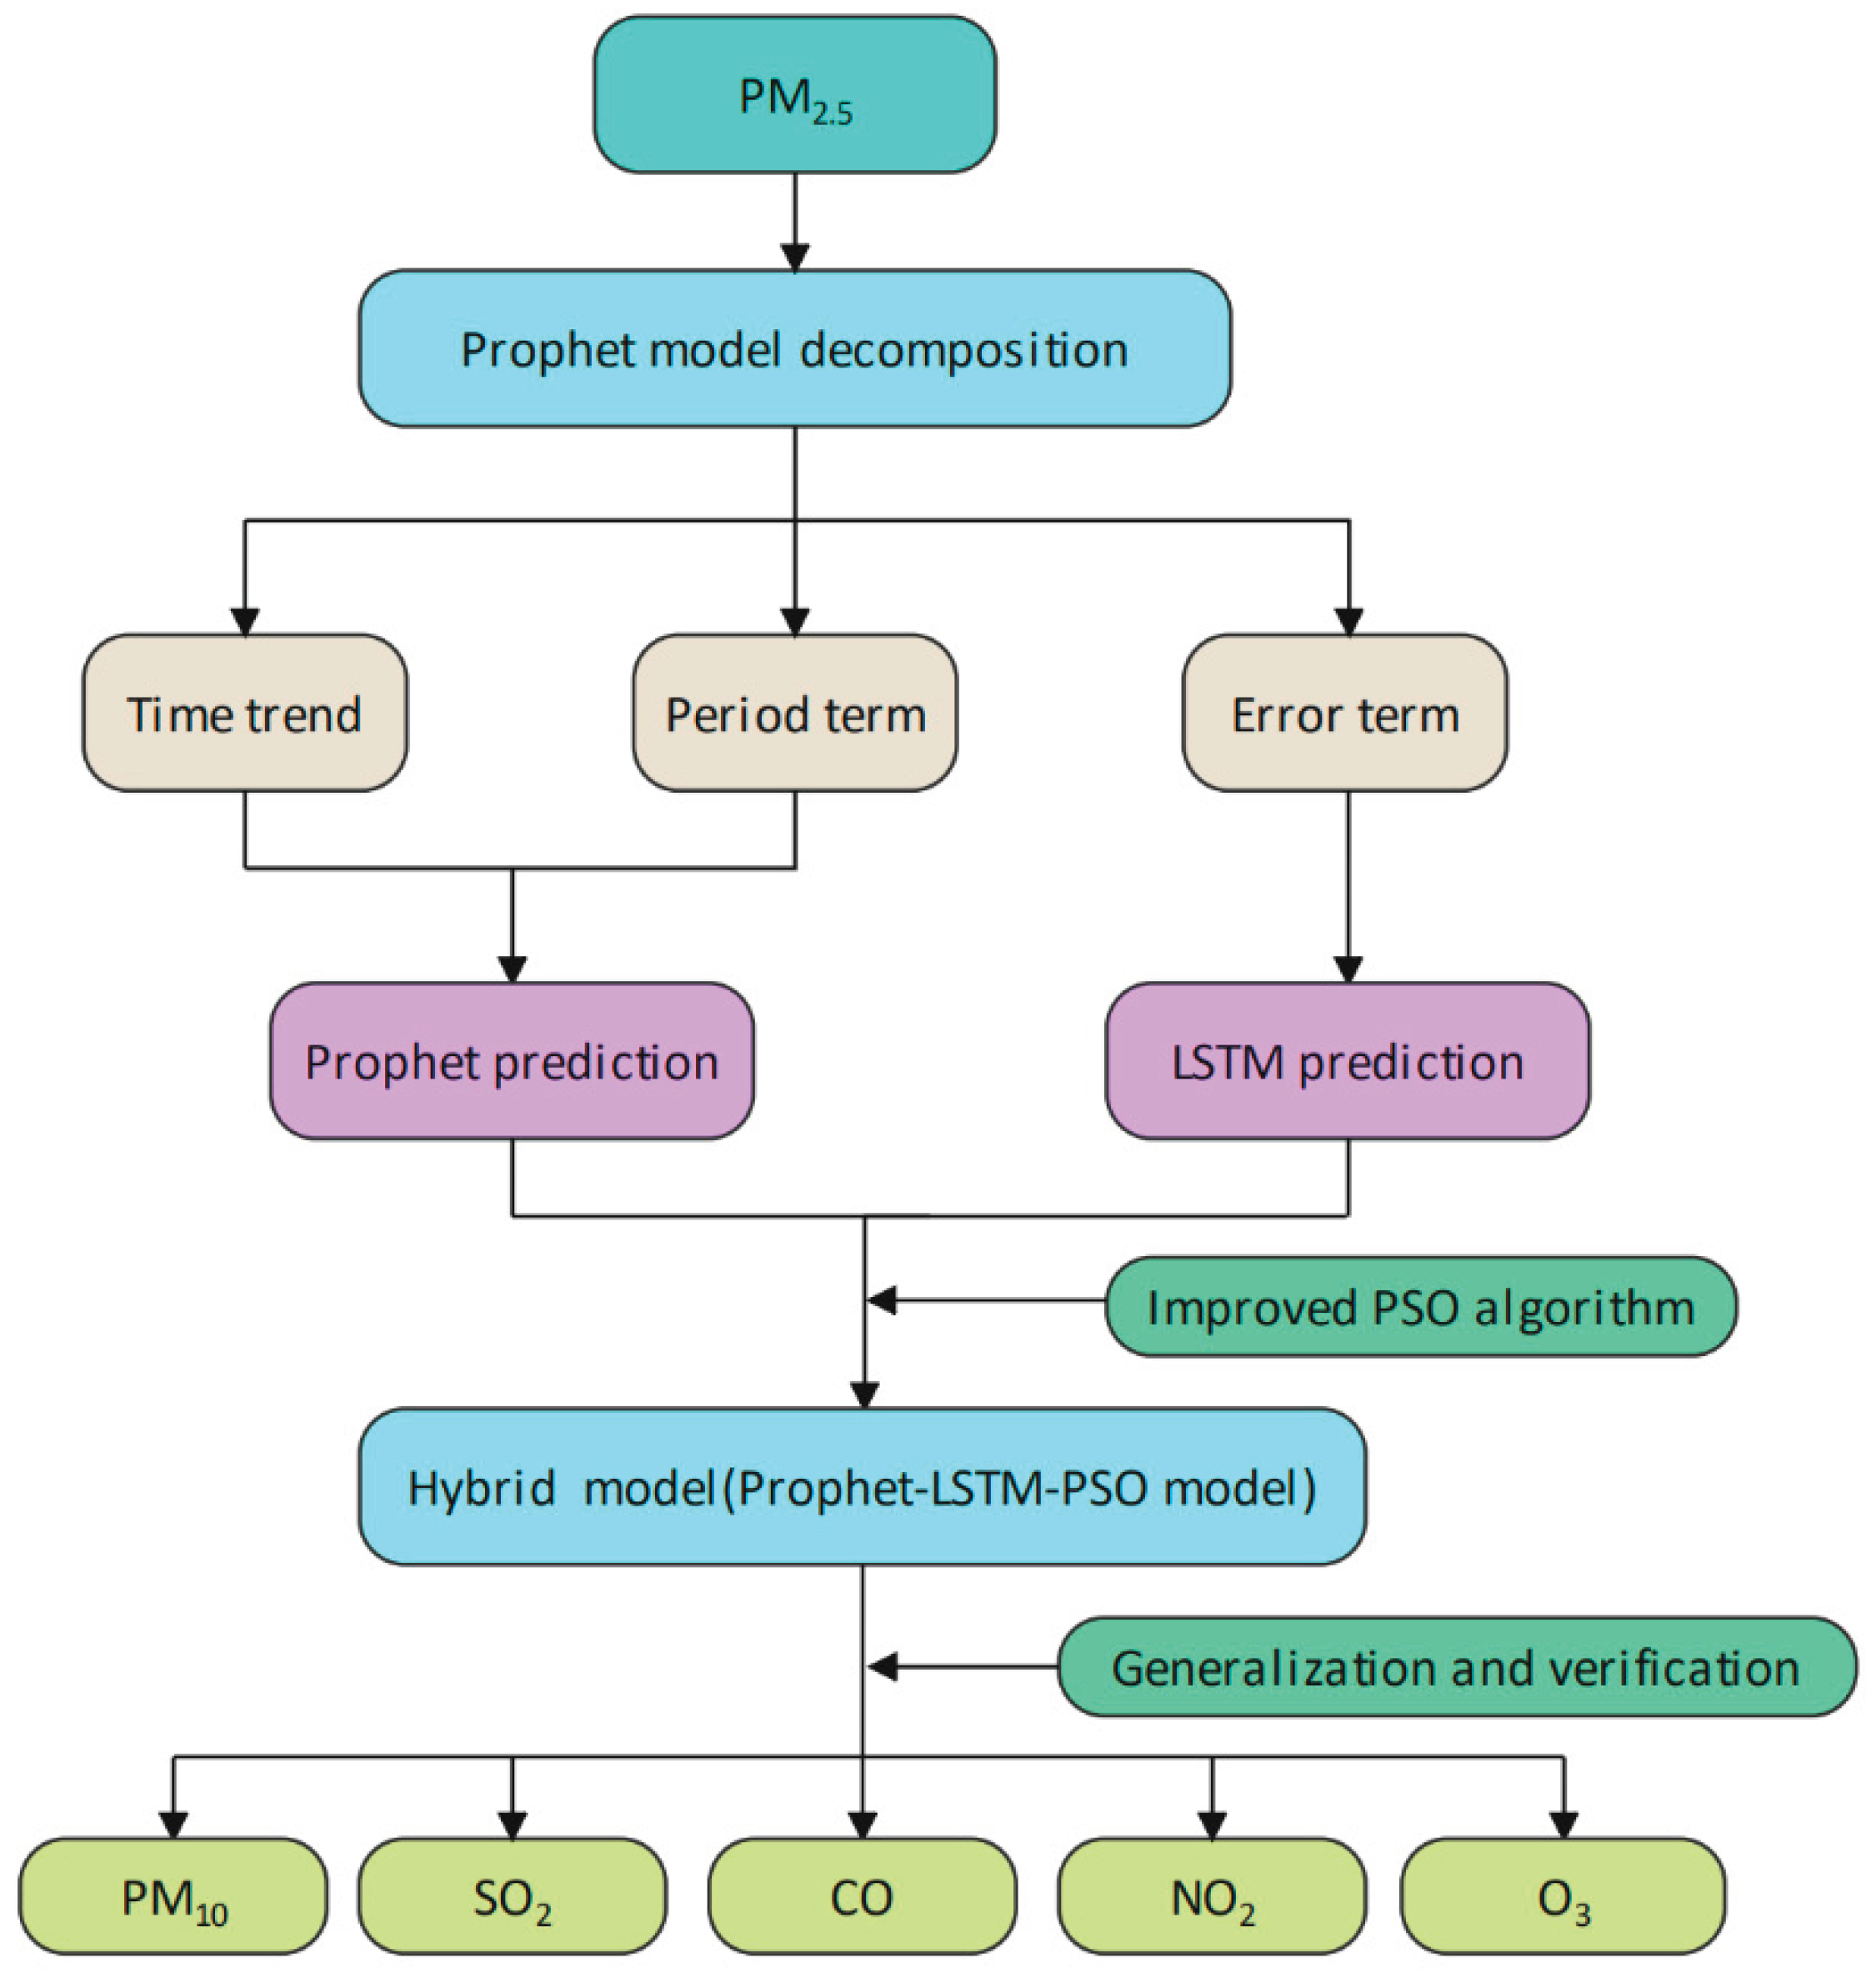
2.4. Prophet-LSTM Model with Improved PSO
First, PM
2.5 concentration data are segmented into trend terms, period terms and error terms by prophet. Among them, the trend term and periodic term are fitted by the Prophet model, and the error term is extracted by LSTM. Then, the combined model is optimized by the improved PSO, and the final characteristic is output, that is, the predicted value of the PM
2.5 concentration is obtained. Finally, the model is used to predict other pollutants to verify the generalization ability of the model. The prediction framework is shown in
Figure 1.
3. Analysis and Results
3.1. Data Description
The experimental data set is taken from the China Environmental Monitoring Station (
http://www.cnemc.cn/), and the daily data of PM
2.5 concentrations in Wuhan from January 1, 2014, to May 3, 2021, are selected. The total amount of data is 2678, and there are no missing values. We take the historical data of PM
2.5 from January 1, 2014, to December 30, 2020, as the training set and the PM
2.5 data from January 1, 2021, to May 3, 2021, as the test set. The training set is used to fit the model parameters, and the test set is used to evaluate the prediction ability of the model.
3.2. Prediction Appraisal Criteria
The average absolute error (MAE), root mean square error (RMSE) and mean square error (MSE) are selected to estimate the prediction results in different models. The smaller the values of the three indicators are, the smaller the prediction error of the model. Their expressions are shown in Equations (8)–(10)):
where
is the true value,
is the estimated value,
, and
is the sample size.
3.3. Hyperparameter Selection
The daily concentrations of PM2.5 from 2014 to 2021 are used in this experiment, and there are no missing values. The training set and test set are divided by a ratio of 8:2.
(1) Changepoint parameter: initialize the Prophet model, search in the interval [0.1,1] by the grid search method, and test the training set. When the changepoint is equal to 0.9, the average absolute error is the smallest.
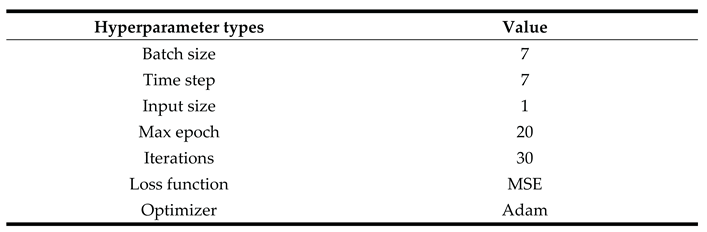
(2) LSTM prediction: To capture the error term, this paper considers feature extraction through LSTM. To accelerate LSTM model training, Wuhan PM
2.5 data are standardized. The standardization formula is Equation (11):
After example analysis, the parameter settings of LSTM are shown in
Table 2.
(3) Weight setting of the hybrid model: The Prophet model and LSTM model are fused by the weighted average method; that is, the final prediction result of the model is Equation (12):
where
and
represent the prediction results of the Prophet and LSTM models, respectively.
To find the optimal weight coefficient, this paper uses two methods to solve it. One is to search the optimal weight combination by the grid search method. The second is to use the improved PSO algorithm to solve the weight value. The two algorithms correspond to two models: the Prophet-LSTM model and the Prophet-LSTM model with improved PSO.
3.4. Comparison of Results
3.4.1. Experimental Results
The periodicity is decomposed based on the Prophet decomposition principle. From the annual trend, the PM2.5 concentrations in winter and spring in Wuhan are higher than those in summer and autumn, of which the PM2.5 concentrations are the lowest in July and the highest in February. The rationality and accuracy of the model are further verified by analyzing the decomposition results.
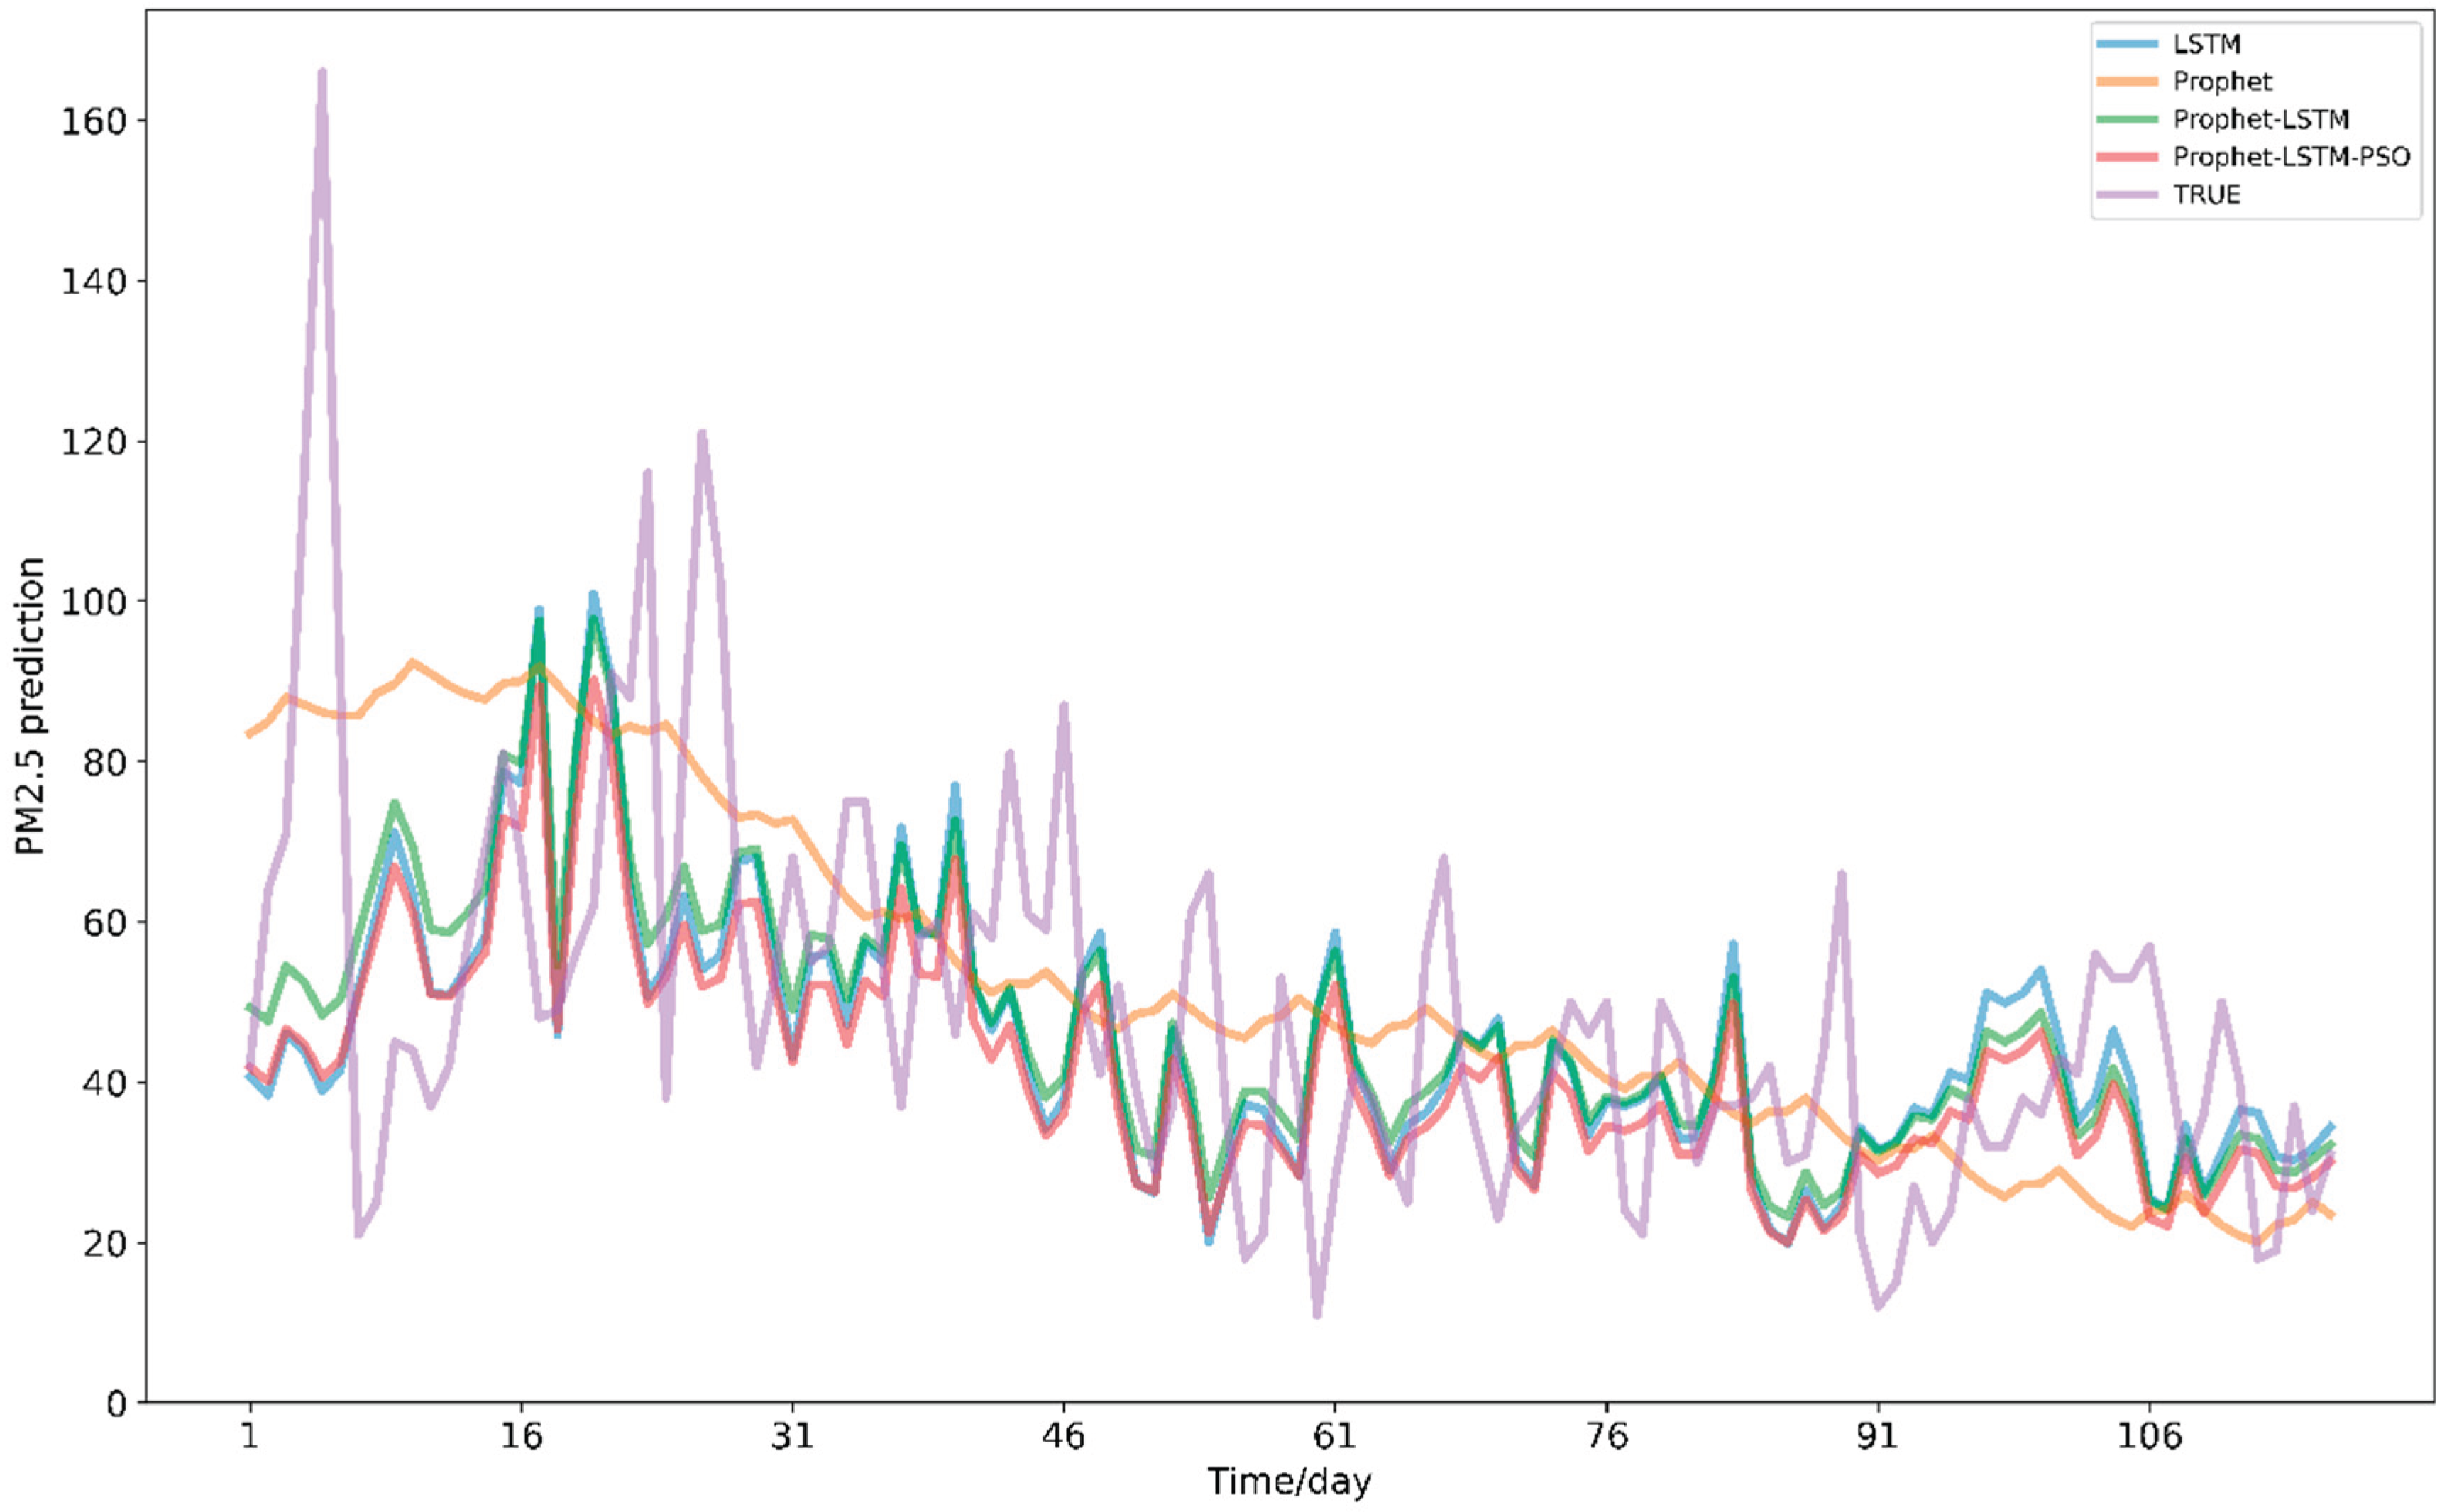
The predicted results of the four models are compared with the real values, as shown in
Figure 2. When forecasting through LSTM, the volatility is large, and the fitting degree with the real value increases with the passage of time. In contrast, the prediction data of the Prophet model are relatively flat and less volatile on the whole, but its accuracy is lower than that of LSTM. Therefore, the Prophet and LSTM models are combined to have the advantages of both. Therefore, we compare the predicted values of the first mock exam with the single model and clearly show that the prediction accuracy is improved while reducing the volatility. The effectiveness of the model is further verified by adding the improved PSO algorithm.
3.4.2. Comparative Analysis
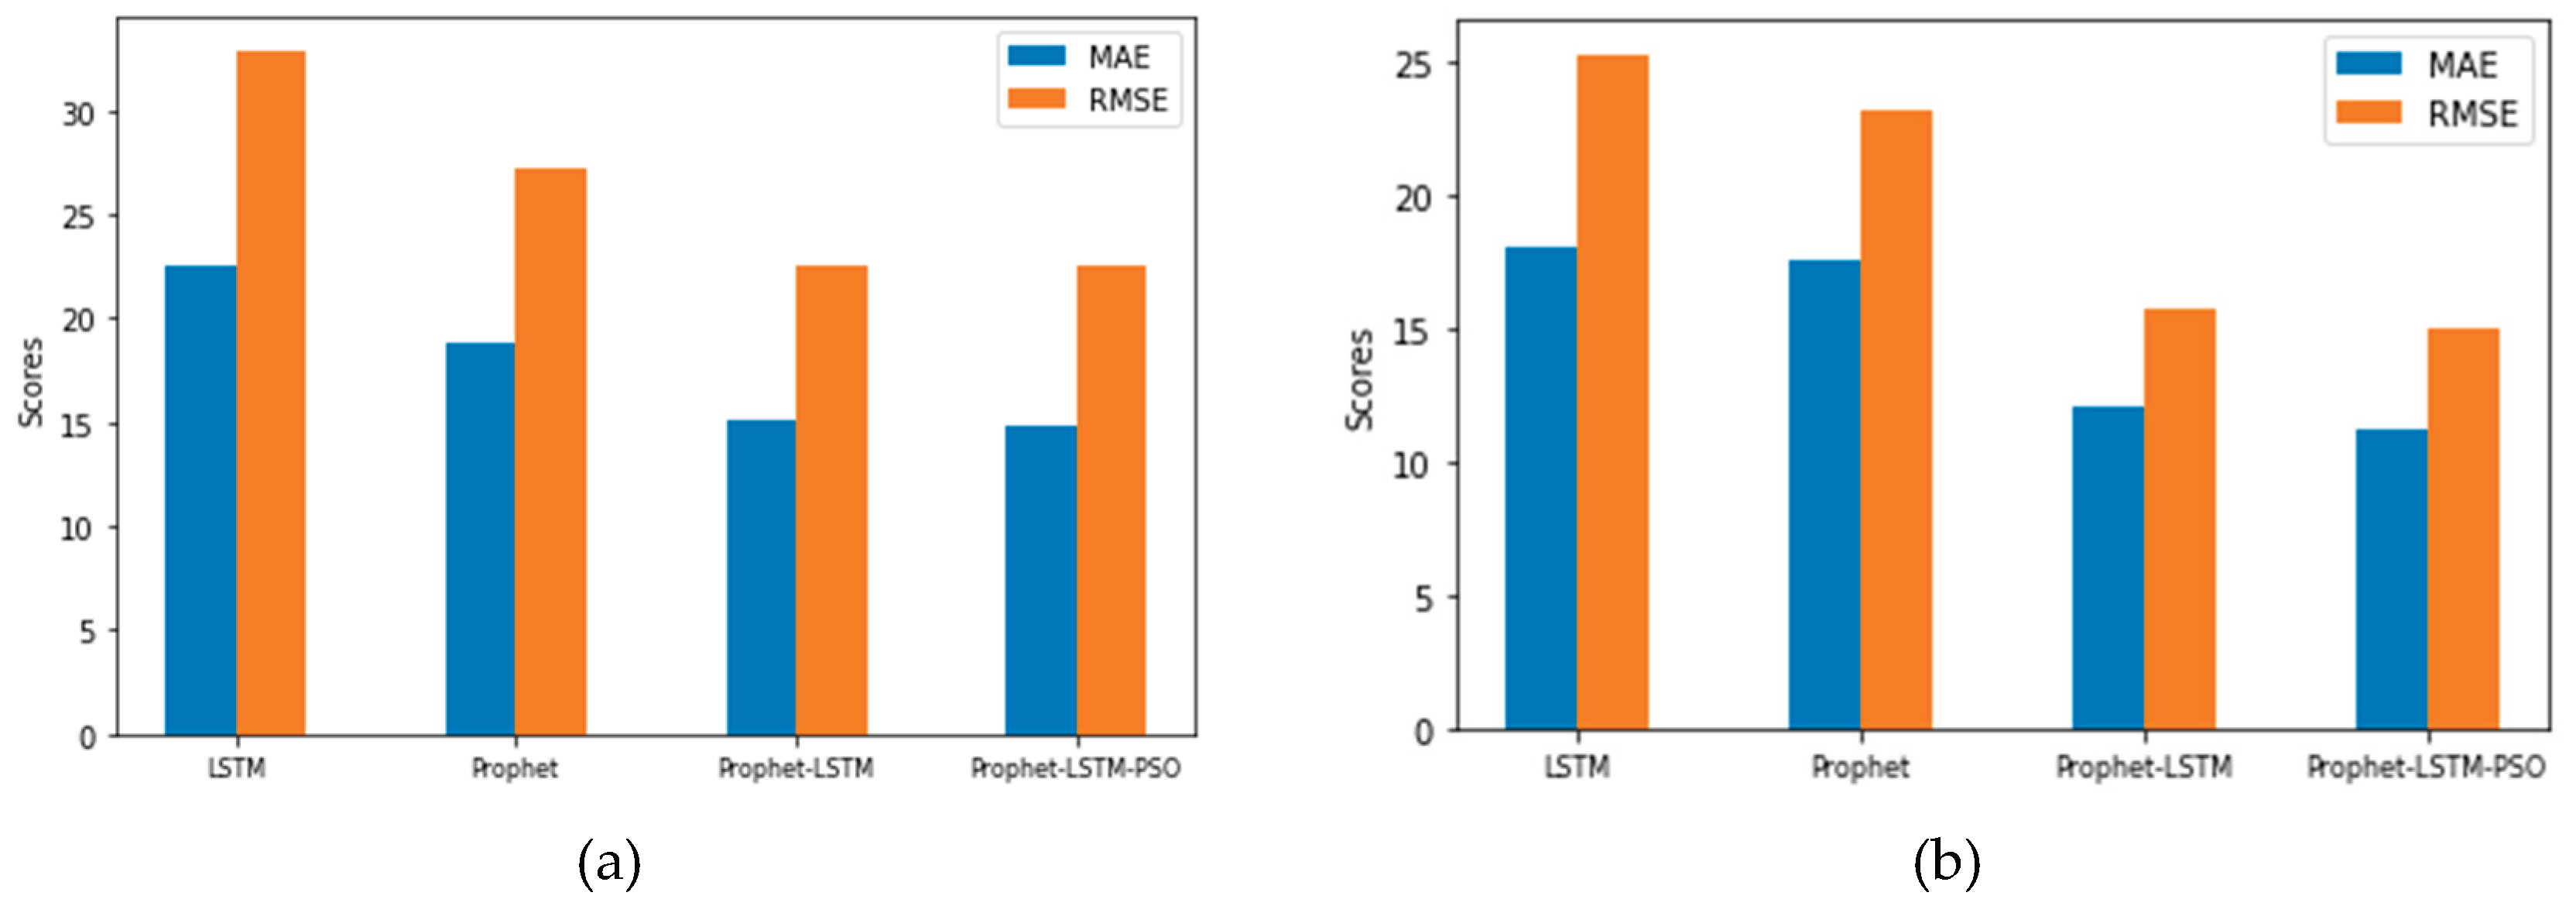
This paper selects three models (LSTM, Prophet and Prophet-LSTM) to compare with our models and uses the three indicators (MAE, MSE and RMSE) to measure the effect of each model.
Table 2 and
Table 3 show the daily PM2.5 concentration predictions on the training set and test set, respectively.
Figure 3 and
Figure 4 intuitively show the comparison of the evaluation effect in different models.
The experimental results indicate that (1) Prophet’s decomposition method has good applicability to the time series satisfying the multiplication model. The hybrid model solves the low prediction accuracy caused by more data noise. (2) The Prophet-LSTM model with the improved PSO algorithm has a better effect, and the accuracy of the weight solution is higher. (3) In terms of horizontal accuracy, the Prophet-LSTM model with improved PSO is better than other models in both the training set and test set. (4) Compared with the LSTM and Prophet, the Prophet-LSTM model with improved PSO combines the advantages of the two, which shows that the model proposed in this paper is more effective and accurate, and the hybrid model is crucial in improving the prediction effect.
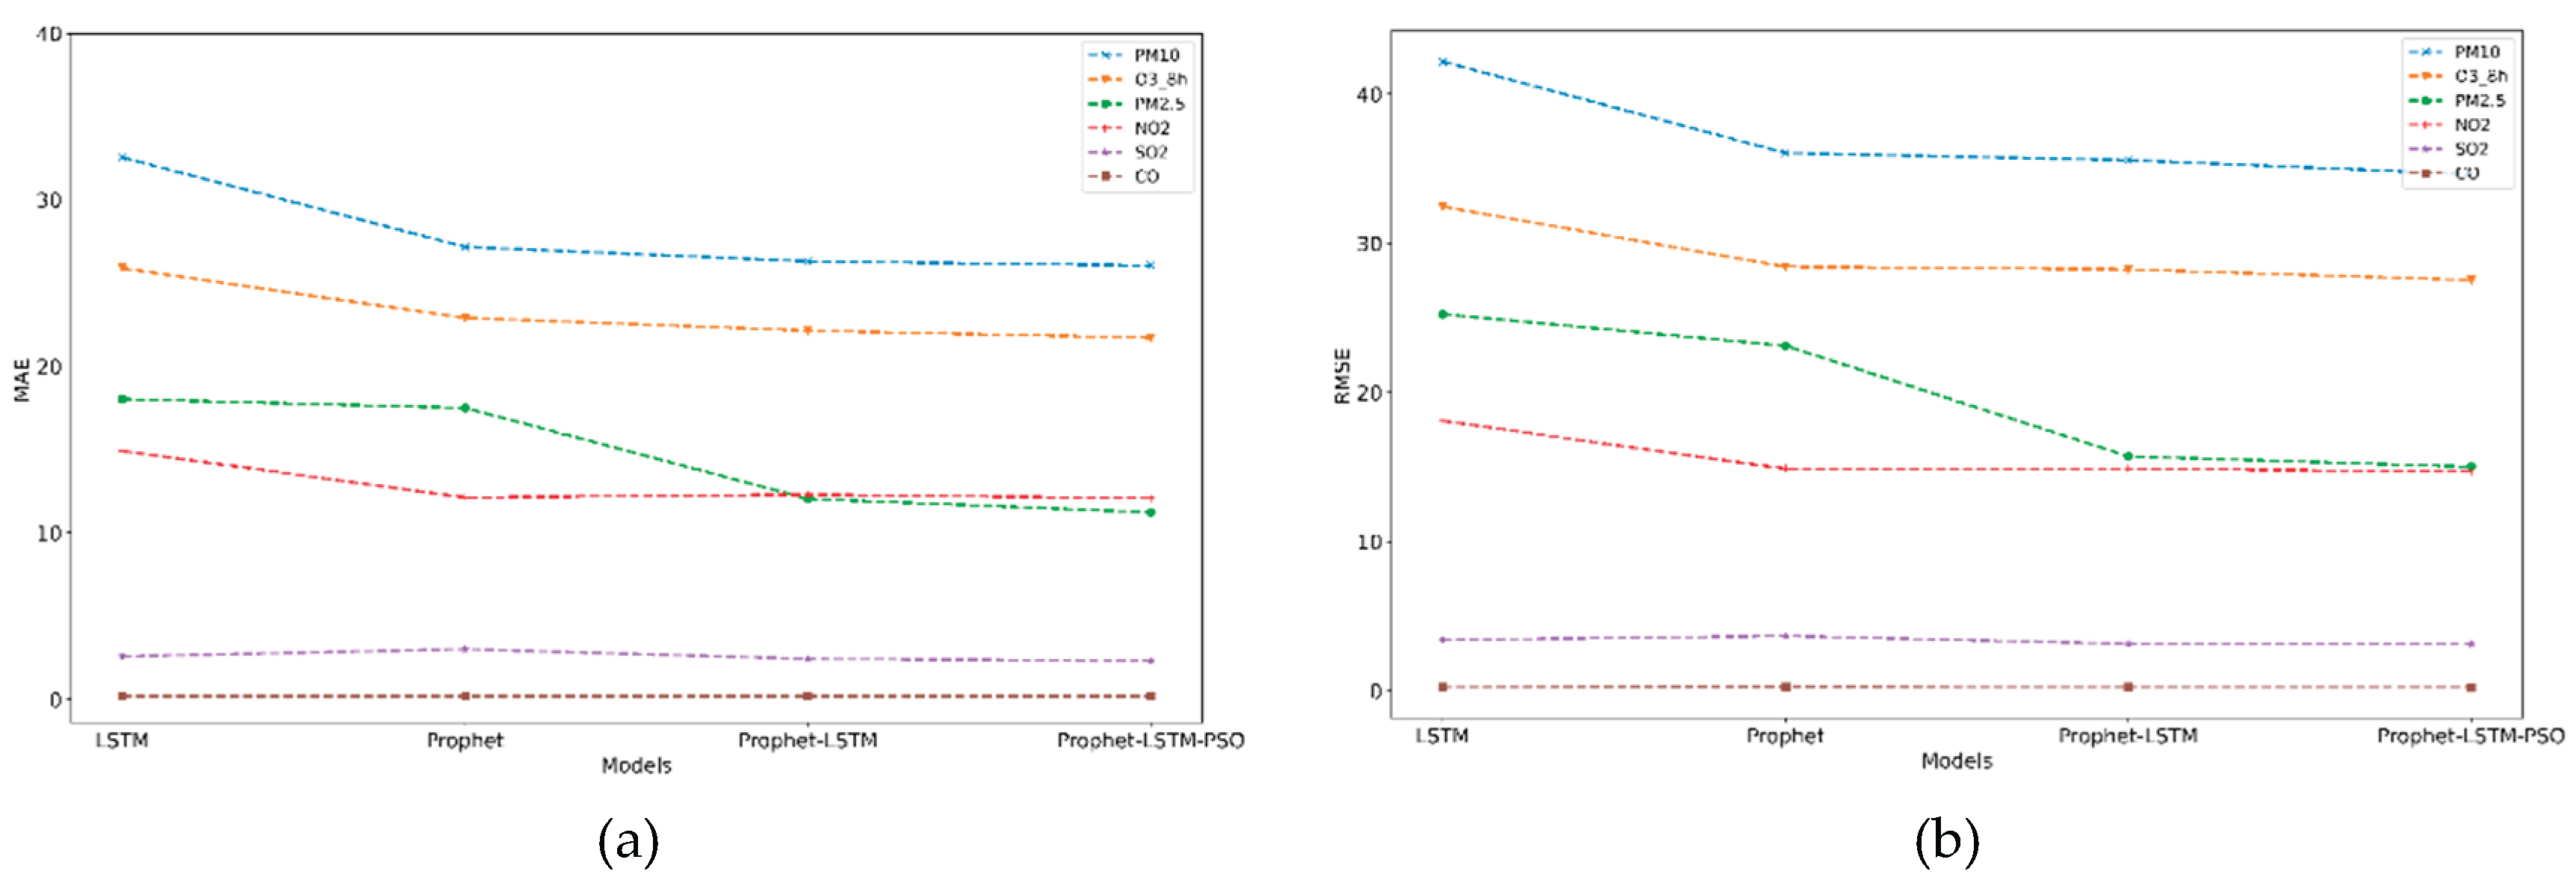
3.4.3. Generalization Capability Analysis
It is necessary to verify the robustness of the Prophet-LSTM model with improved PSO. The performance of the hybrid model is tested based on data sets of the same type (PM
10) and different types (SO
2, CO, NO
2, O
3). The prediction results of the model for different substance concentrations on the test set are shown in
Table 4. The prediction accuracy of the model is higher than the prediction accuracy of PM
2.5 when predicting CO, SO
2 and NO
2. In addition, the stationarity test (ADF test) of CO, SO
2 and NO
2 data shows that their
p values are less than 0.05, while the
p values of PM
10 and O
3 are greater than 0.05. Therefore, CO, SO
2 and NO
2 are nonstationary data, and PM
10 and O
3 are stationary data.
MAE and RMSE in the prediction of PM10 and O3 have little difference compared with the PM2.5 prediction model, and the reduction can be ignored. The first mock exam is that the single model LSTM and Prophet have no strict relationship with prediction accuracy, although Prophet shows a relatively good character in most cases. From the first mock exam, the Prophet-LSTM model with improved PSO is still the best prediction model, and the hybrid model has a higher accuracy than the single model. Third, the effectiveness and robustness of the proposed model are proved.
4. Conclusions
To solve the problem of low prediction accuracy caused by the noise of PM2.5, this paper uses the time series of PM2.5 in Wuhan city, and a hybrid Prophet-LSTM model with improved PSO is established in this paper. First, the data are divided into trend terms, periodic terms and error terms by the Prophet decomposition method. Next, considering the advantages of the Prophet and LSTM models, the trend term and periodic term are predicted by the Prophet model, and the error term is predicted by the LSTM model. Finally, the two models are combined by an improved PSO algorithm to predict the daily PM2.5 concentration. To highlight the effectiveness and rationality of the Prophet-LSTM model with improved PSO, it is compared with other models (Prophet, LSTM and Prophet-LSTM). The results indicate that (1) the prediction effect of the hybrid model is generally better than that of the single model. (2) The Prophet decomposition algorithm decomposes the original time series, which can effectively extract time series information and remove noise so that the prediction accuracy is significantly improved. (3) The hybrid model is optimized by adding an improved PSO algorithm to improve the weight accuracy, thereby improving the prediction accuracy. To study the generalization ability of the first mock exam, we predicted the concentrations of five other substances, such as PM10. We found that the hybrid model has a significant improvement in prediction accuracy compared with a single model.
In addition, considering the characteristics of the time series, we found some interesting phenomena. The hybrid model Prophet-LSTM with improved PSO seems to prefer time series with obvious periodicity and long-term trends and is in line with the multiplication model. In the above analysis, the conjecture was preliminarily verified only by broken line diagrams and ADF tests, without in-depth analysis, which provides a new direction for research in related fields. Although the Prophet-LSTM model with improved PSO proposed in this paper has high accuracy in the concentration prediction of a series of time series such as PM2.5 and can better solve the characteristics of irregular sequences and more noise, it has not performed too much extraction for the error term, resulting in more factors and poor interpretation of the error term. If the error term can be further decomposed, the prediction accuracy may be further improved.
Author Contributions
Hui Qi: Modeling, Writing. Chibiao Liu: Programming, Review, Editing. Xuchu Jiang: Formal analysis, Validation. Duochenxi Liu: Supervision, Formal analysis.
Funding
The research is supported by Fujian Provincial Natural Science Foundation of China(2024J01903, 2025J01393); the Key Project of the Education Department of Fujian Province (JZ230054).
Data Availability Statement
The data and methods used in the research have been presented in sufficient detail in this paper.
Conflicts of interest
The authors declare that they have no known competing financial interests or personal relationships that could have appeared to influence the work reported in this paper.:
References
- Wang, H; Qiu, J; Liu, Y; et al. MEIAT-CMAQ: A modular emission inventory allocation tool for Community Multiscale Air Quality Model[J]. Atmospheric Environment 2024, 331, 120604. [Google Scholar] [CrossRef]
- Swathi, V S; Panda, S K; Mondal, U; et al. Investigating dust storm dynamics and lightning interactions using Weather Research Forecasting-Chemistry (WRF-CHEM) model over India[J]. Science of The Total Environment 2025, 995, 180083. [Google Scholar] [CrossRef] [PubMed]
- Chemel, C; Fisher, B E A; Kong, X; et al. Application of chemical transport model CMAQ to policy decisions regarding PM2. 5 in the UK. Atmos Environ 2014, 82, 410–417. [Google Scholar] [CrossRef]
- Djalalova, I; Delle Monache, L; Wilczak, J. PM2.5 analog forecast and Kalman filter post-processing for the Community Multiscale Air Quality (CMAQ) model. Atmos Environ. 2015, 108, 76–87. [Google Scholar] [CrossRef]
- Shen, J; Wang, X S; Li, J F; et al. Evaluation and intercomparison of ozone simulations by Models-3/CMAQ and CAMx over the Pearl River Delta. Sci China Chem 2011, 54(11), 1789–1800. [Google Scholar] [CrossRef]
- Cheng, X H; Diao, Z G; Hu, J K; et al. Dynamical-statistical forecasting of PM2. 5 concentration based on CMAQ model and adapting partial least square regression method in China. Acta Sci. Circumst 2016, 36, 2771–2782. [Google Scholar]
- Wu, Y J. Source apportionment of PM2.5 over the Beijing-TianjinHebei and surrounding areas based on the WRF-CMAQ/ISAM Model; Zhejiang University: Hangzhou, 2019. [Google Scholar]
- Skamarock, W C; Klemp, J B; Dudhia, J; et al. A description of the advanced research WRF model version 4; National Center for Atmospheric Research: Boulder, CO, USA, 2019; p. 145. [Google Scholar]
- Im, U; Markakis, K; Unal, A; et al. Study of a winter PM episode in Istanbul using the high resolution WRF/CMAQ modeling system. Atmos Environ 2010, 44(26), 3085–3094. [Google Scholar] [CrossRef]
- Tuccella, P; Curci, G; Visconti, G; et al. Modeling of gas and aerosol with WRF/Chem over Europe: Evaluation and sensitivity study. J Geophys Res-Atmos 2012, 117(D3). [Google Scholar] [CrossRef]
- Peng, J; Han, H; Yi, Y; et al. Machine learning and deep learning modeling and simulation for predicting PM2. 5 concentrations[J]. Chemosphere 2022, 308, 136353. [Google Scholar] [CrossRef] [PubMed]
- Makhdoomi, A; Sarkhosh, M; Ziaei, S. PM2. 5 concentration prediction using machine learning algorithms: an approach to virtual monitoring stations[J]. Scientific Reports 2025, 15(1), 8076. [Google Scholar] [CrossRef] [PubMed]
- Shen, J; Liu, Q; Feng, X. Hourly PM2. 5 concentration prediction for dry bulk port clusters considering spatiotemporal correlation: A novel deep learning blending ensemble model[J]. Journal of Environmental Management 2024, 370, 122703. [Google Scholar] [CrossRef] [PubMed]
- Yue, Q; Xu, Q; Hong-qing, S; et al. Machine-learning-based model and simulation analysis of PM2. 5 concentration prediction in Beijing. Chinese J Eng 2019, 41(3), 401–407. [Google Scholar]
- Chen, P S; Zheng, Y J; Li, L; et al. Prediction of PM2. 5 Mass Concentration Based on the Back Propagation (BP) Neural Network Optimized by t-Distribution Controlled Genetic Algorithm. J Nanoelectron Optoe 2020, 15(4), 432–441. [Google Scholar] [CrossRef]
|
Disclaimer/Publisher’s Note: The statements, opinions and data contained in all publications are solely those of the individual author(s) and contributor(s) and not of MDPI and/or the editor(s). MDPI and/or the editor(s) disclaim responsibility for any injury to people or property resulting from any ideas, methods, instructions or products referred to in the content. |
© 2026 by the authors. Licensee MDPI, Basel, Switzerland. This article is an open access article distributed under the terms and conditions of the Creative Commons Attribution (CC BY) license (http://creativecommons.org/licenses/by/4.0/).