
Submitted:
14 January 2026
Posted:
15 January 2026
You are already at the latest version
Abstract
Gene expression is inherently stochastic, and promoter switching–induced transcriptional bursting generates substantial cell-to-cell variability in mRNA abundance. Such variability is commonly characterized by the mean and variance; however, these low-order statistics fail to capture the geometric features of mRNA copy number distributions and may obscure mechanistic differences in promoter dynamics.
In this work, we analyze a two-state stochastic gene transcription model and derive explicit analytical expressions for higher-order moments of mRNA abundance. We show that skewness and kurtosis provide mechanistically informative signatures of transcriptional bursting, explicitly depending on promoter switching kinetics and burst size. In particular, positive skewness increases with slower promoter switching and larger burst sizes, even when the mean expression level is fixed, while elevated kurtosis distinguishes burst-dominated, low-expression regimes from Gaussian-like high-expression regimes.
Our results demonstrate that distinct promoter dynamics can produce identical mean expression levels and variances while exhibiting markedly different skewness and kurtosis. Incorporating higher-order statistics, therefore, extends conventional mean–variance analyses and enables improved discrimination between competing stochastic gene expression mechanisms in single-cell data.
Keywords:
stochastic gene expression
; promoter switching
; transcriptional bursting
; skewness and kurtosis
; higher-order moments
MSC: (2020): Primary 92C40; Secondary 60J28; 60H10; 82C31
1. Introduction
Gene expression is an inherently stochastic process, arising from the small copy numbers of DNA templates, transcription factors, and mRNA molecules involved in transcriptional regulation. Early theoretical and experimental studies have established that intrinsic molecular fluctuations can lead to pronounced cell-to-cell variability, even in genetically identical populations under homogeneous environmental conditions [1,2,3,4]. With the advent of single-cell and single-molecule experimental techniques, such variability has been directly observed at the mRNA level, revealing substantial heterogeneity in transcriptional output across individual cells [5,6,7]. Quantifying and interpreting this variability has therefore become a central problem in systems biology and mathematical biology.
Variance and the Fano factor are among the most widely used statistical measures for characterizing transcriptional noise. These quantities effectively describe the overall dispersion of gene expression levels and have played an important role in elucidating the relationship between mean expression and noise [8,9,10,11]. However, variance-based measures provide only limited information about the geometric structure of the underlying mRNA copy number distributions. In particular, they are insensitive to distributional asymmetry and tail behavior, which naturally arise from transcriptional bursting driven by stochastic promoter switching dynamics [12,13,14,15]. A detailed understanding of the shape of mRNA distributions is therefore essential for uncovering the molecular mechanisms governing gene regulation and for accurately interpreting experimental data.
In principle, the full probability mass function of mRNA copy numbers contains complete information about distributional geometry. For simple stochastic gene expression models, exact or approximate stationary distributions can sometimes be obtained [15,16]. However, for biologically realistic models with explicit promoter switching, feedback regulation, or time-dependent synthesis rates, analytical expressions for the full distribution are often unavailable or unwieldy [17,18]. Even when closed-form solutions exist, they do not necessarily yield intuitive or easily comparable summaries for experimental analysis. This motivates the introduction of reduced statistical descriptors that capture essential geometric features of the distribution while remaining analytically tractable and experimentally accessible.
In this work, we focus on two such higher-order statistical measures: skewness and kurtosis. Skewness quantifies the degree of asymmetry of the mRNA distribution and indicates whether transcriptional fluctuations are biased toward rare, high-expression events or toward low-expression states. Kurtosis characterizes the sharpness of the distribution peak and the heaviness of its tails relative to a Gaussian distribution, thereby reflecting the prevalence of extreme transcriptional events. Recent studies have demonstrated that these higher-order moments provide sensitive indicators of transcriptional bursting and gene expression heterogeneity, particularly in large single-cell datasets [6,8].
The skewness is defined as the third standardized moment
where and denote the mean and standard deviation of the random variable X, respectively. The kurtosis is defined as the fourth standardized moment
By construction, these quantities are dimensionless and therefore enable direct comparison across genes, experimental conditions, and modeling frameworks.
The remainder of this article is organized as follows. In Section 2, we introduce a two-state stochastic gene transcription model with explicit promoter switching and present its mathematical formulation. Section 3 is devoted to the analytical derivation of skewness and kurtosis for the model. In Section 4, we perform numerical simulations and apply our theoretical results to open-source experimental data to investigate how skewness, kurtosis, and the coefficient of variation depend on key kinetic parameters. Finally, concluding remarks and biological implications are discussed in Section 5.
2. The Model and Expressions of Skewness and Kurtosis
2.1. Two-State Gene Transcription Model
We consider a stochastic two-state gene transcription model, which has been widely used to characterize promoter-mediated transcriptional bursting and has also been adopted in our previous studies. A schematic representation of the model is shown in Figure 1.
In this framework, the promoter of a gene stochastically switches between two discrete states: an inactive (OFF) state and an active (ON) state. Transitions from the OFF state to the ON state occur at a constant rate , whereas transitions from the ON state back to the OFF state occur at a rate . As a result, the residence times in both promoter states are exponentially distributed. When the promoter is in the ON state, mRNA molecules are synthesized at a constant transcription rate , while no transcription occurs when the promoter is in the OFF state. Independent of the promoter dynamics, each mRNA molecule is degraded at a constant rate . This minimal model captures the essential features of transcriptional bursting induced by stochastic promoter switching.
Let denote the total number of mRNA transcripts present in a cell at time t, where takes values in the set of nonnegative integers. We introduce an indicator variable to represent the promoter state at time t, with corresponding to the gene OFF state and corresponding to the gene ON state. The joint probability distributions are defined as
The time evolution of the joint probabilities and is governed by the following system of chemical master equations:
for , with the convention that .
The marginal probability mass function of the mRNA copy number is then given by
which represents the probability that m mRNA molecules are present in the cell at time t.
The terms in Eqs. (2.1)–(2.2) account, respectively, for stochastic switching of the promoter state, mRNA synthesis in the active state, and first-order degradation of mRNA molecules. This coupled system of master equations fully characterizes the stochastic dynamics of the two-state transcription process.
In principle, the probability mass function provides a complete description of the distribution of mRNA copy numbers across a cell population. However, for transcription models of even moderate complexity, obtaining explicit analytical expressions for is often intractable. Even for the two-state model considered here, closed-form solutions are available only under restrictive assumptions and are typically expressed in terms of integrals or special functions. Consequently, rather than relying exclusively on the full probability mass function, we focus on higher-order statistical descriptors—such as skewness and kurtosis—to characterize the geometric features of the mRNA copy-number distribution. These quantities provide tractable and informative measures of transcriptional variability when explicit distributional forms are unavailable.
2.2. Moments, Skewness, and Kurtosis of Transcript Distributions
Let denote the kth moment of the mRNA transcript number at time t. By definition,
where is the marginal probability mass function of the mRNA copy number.
The first moment corresponds to the mean mRNA copy number and characterizes the average transcription level across the cell population. The second central moment defines the variance,
which quantifies the magnitude of transcriptional fluctuations around the mean.
To further characterize the geometric properties of the transcript number distribution, we consider higher-order standardized moments. The skewness is defined as
which measures the degree of asymmetry of the distribution. The excess kurtosis is defined by
and quantifies the heaviness of the distribution tails relative to a Gaussian distribution.
Equations (2.5) and (2.6) show that both skewness and kurtosis are fully determined by the first four moments of the transcript number distribution. Consequently, analyzing the dynamics of these moments provides direct insight into the temporal evolution of the shape of mRNA distributions arising from stochastic gene transcription.
2.3. Moment Expressions and Higher-Order Statistics
We now derive explicit expressions for the moments of the transcript number distribution. In the following analysis, we count only newly synthesized mRNA molecules and assume that the promoter initially resides in the gene OFF state at time . Accordingly, the initial condition is
Condition (2.7) implies
Consequently, all moments vanish at the initial time,
Using calculations analogous to those in previous studies, the time-dependent mean mRNA copy number is obtained as
The last two terms in (2.10) decay to zero exponentially as . Hence, as , the mean mRNA copy number converges to the steady-state value
Similarly, the second moment of the transcript number distribution at steady state is given by
The variance of the transcript number distribution then follows as
where denotes the standard deviation.
The squared coefficient of variation (noise) and the Fano factor are therefore given by
These quantities characterize the dispersion of transcript numbers across single cells but do not fully describe the shape of the underlying distribution.
To further elucidate the distributional geometry of mRNA copy numbers, we consider the skewness and kurtosis. By definition,
where and denote the third and fourth moments of the transcript number distribution, respectively. Explicit expressions for these higher-order moments are given by
These expressions explicitly reveal how skewness and kurtosis depend on transcriptional kinetics, promoter switching dynamics, and mRNA degradation rates.
Biological interpretation of skewness and kurtosis. Skewness and kurtosis provide biologically meaningful information about the shape of the mRNA copy number distribution beyond what is captured by the mean and variance. A positive value of indicates a pronounced right tail, corresponding to rare cells exhibiting exceptionally high transcript abundance. Such asymmetry is a characteristic feature of stochastic gene expression and is commonly associated with transcriptional bursting.
Kurtosis quantifies the weight of the distribution tails relative to a Gaussian distribution. A large positive value of implies an elevated probability of extreme transcriptional events, reflecting strong cell-to-cell heterogeneity. Together, skewness and kurtosis offer intuitive and quantitative measures of how transcriptional noise manifests at the population level and how strongly the mRNA distribution deviates from symmetric, light-tailed behavior.
3. Discussion
The explicit moment expressions derived above enable a systematic asymptotic analysis of the skewness and kurtosis in biologically relevant limits. In this section, we summarize the leading-order behavior of these higher-order statistics in three canonical parameter regimes that are commonly encountered in stochastic gene expression models. All kinetic parameters are nondimensionalized by the mRNA degradation rate . Under this rescaling, both the numerical values and qualitative features of the moments remain unchanged. Therefore, without loss of generality, we set in the following analysis.
The asymptotic structure of the skewness and kurtosis is primarily governed by the relative timescales of promoter switching and mRNA degradation. Depending on whether promoter switching is fast or slow compared to transcript turnover, qualitatively distinct transcriptional behaviors emerge, each associated with characteristic distributional signatures [19,20,21,22]. Accordingly, we classify the asymptotic regimes into fast promoter switching, slow promoter switching, and a bursty transcription limit. For each regime, we derive the leading-order asymptotic expressions for skewness and kurtosis and interpret their implications for transcriptional variability and distributional shape.
Fast promoter switching regime. Assume
so that promoter switching is much faster than mRNA degradation [23]. In this limit, the promoter rapidly equilibrates on the timescale of mRNA dynamics, and the system effectively reduces to a single birth–death process with mean
Expanding the higher-order moments in powers of yields, to leading order,
Consequently, the skewness and excess kurtosis scale asymptotically as
Thus, both skewness and excess kurtosis decrease as the mean expression level increases, and the mRNA copy number distribution approaches a Poisson-like form with weak asymmetry and light tails.
Slow promoter switching regime. Assume
so that mRNA molecules degrade rapidly relative to promoter switching [24,25]. In this regime, transcription occurs in well-separated episodes, leading to pronounced cell-to-cell heterogeneity. Retaining the leading-order terms in , we obtain the asymptotic expressions
Consequently, the skewness and excess kurtosis scale as
Both quantities increase with the ratio , reflecting strong distributional asymmetry and heavy-tailed behavior driven by long inactive periods and rare promoter activation events. Although the distribution may exhibit bimodality in this regime, the large excess kurtosis originates from intermittent transcription bursts and long OFF periods, which generate strong deviations from Poisson-like statistics.
Bursty transcription regime. Assume
while keeping the burst size
finite. In this limit, transcription occurs in rare but intense bursts. The mean mRNA copy number is
The higher-order moments are asymptotically given by
From these, the skewness and excess kurtosis scale as
These expressions show that increasing the burst size amplifies both skewness and excess kurtosis, even when the mean expression level is fixed, providing a natural mechanism for generating highly asymmetric, heavy-tailed mRNA distributions.
The asymptotic behavior of the mean, variance, skewness, and kurtosis in different promoter switching and transcription regimes is summarized in Table 1.

Table 1.
Asymptotic expressions for steady-state mRNA statistics in different promoter switching and transcription regimes, including the squared coefficient of variation (CV2).
Table 1.
Asymptotic expressions for steady-state mRNA statistics in different promoter switching and transcription regimes, including the squared coefficient of variation (CV2).
| Regime | Mean | Variance | CV2 | Skewness | Kurtosis |
|---|---|---|---|---|---|
| Fast switching | |||||
| Slow switching | |||||
| Bursty transcription |
Connection to negative binomial distributions. In bursty transcription limits, the steady-state mRNA copy number distribution converges to a negative binomial distribution with mean and variance
where B denotes the burst size. The negative binomial probability mass function (PMF) can be written as
with parameters
This negative binomial distribution reproduces the asymptotic expressions for skewness and excess kurtosis derived above:
This explicit correspondence provides a theoretical justification for the widespread use of negative binomial models in fitting single-cell RNA-sequencing data, where transcriptional bursting and promoter switching naturally generate transcript count distributions that are overdispersed relative to a Poisson process. The relative timescale of promoter switching and mRNA degradation critically determines transcriptional variability and distributional shape. In the fast-switching regime, the promoter rapidly equilibrates between active and inactive states, so that transcription effectively proceeds at an averaged rate [20,26]. Consequently, transcriptional bursts are weak and the mRNA copy number distribution approaches a Poisson-like form with reduced skewness and kurtosis. In contrast, slow promoter switching gives rise to long inactive periods punctuated by rare activation events that generate intense transcriptional bursts [7,14,27]. This temporal clustering leads to highly asymmetric and heavy-tailed mRNA distributions, characterized by large positive skewness and elevated kurtosis. Importantly, these higher-order features persist even when mean expression levels are fixed, demonstrating that slow promoter switching encodes mechanistic information beyond that captured by mean–variance statistics alone.
4. Numerical Simulations
In this section, all parameters are nondimensionalized by the mRNA degradation rate. We define
This normalization does not affect the values or qualitative properties of the mean, skewness, or kurtosis of the mRNA distribution.
To identify the dominant regulatory factors underlying the skewness and kurtosis of mRNA copy number distributions, we examined their joint dependence on the promoter activation rate and the mRNA degradation rate using three-dimensional representations. In Figure 2, the three-dimensional surfaces display the values of the skewness (A) and kurtosis (B) of the steady-state mRNA distribution as functions of and , both varying within the range . Red dots mark the locations of the minimum values on each surface. Slow promoter switching, corresponding to small or , gives rise to large skewness and kurtosis due to pronounced transcriptional bursting, whereas faster switching reduces higher-order variability. Interestingly, when and are comparable in magnitude and both are small, a global minimum of both skewness and kurtosis is observed. These surfaces provide a clear visualization of how promoter kinetics shape mRNA variability across a biologically relevant parameter space.
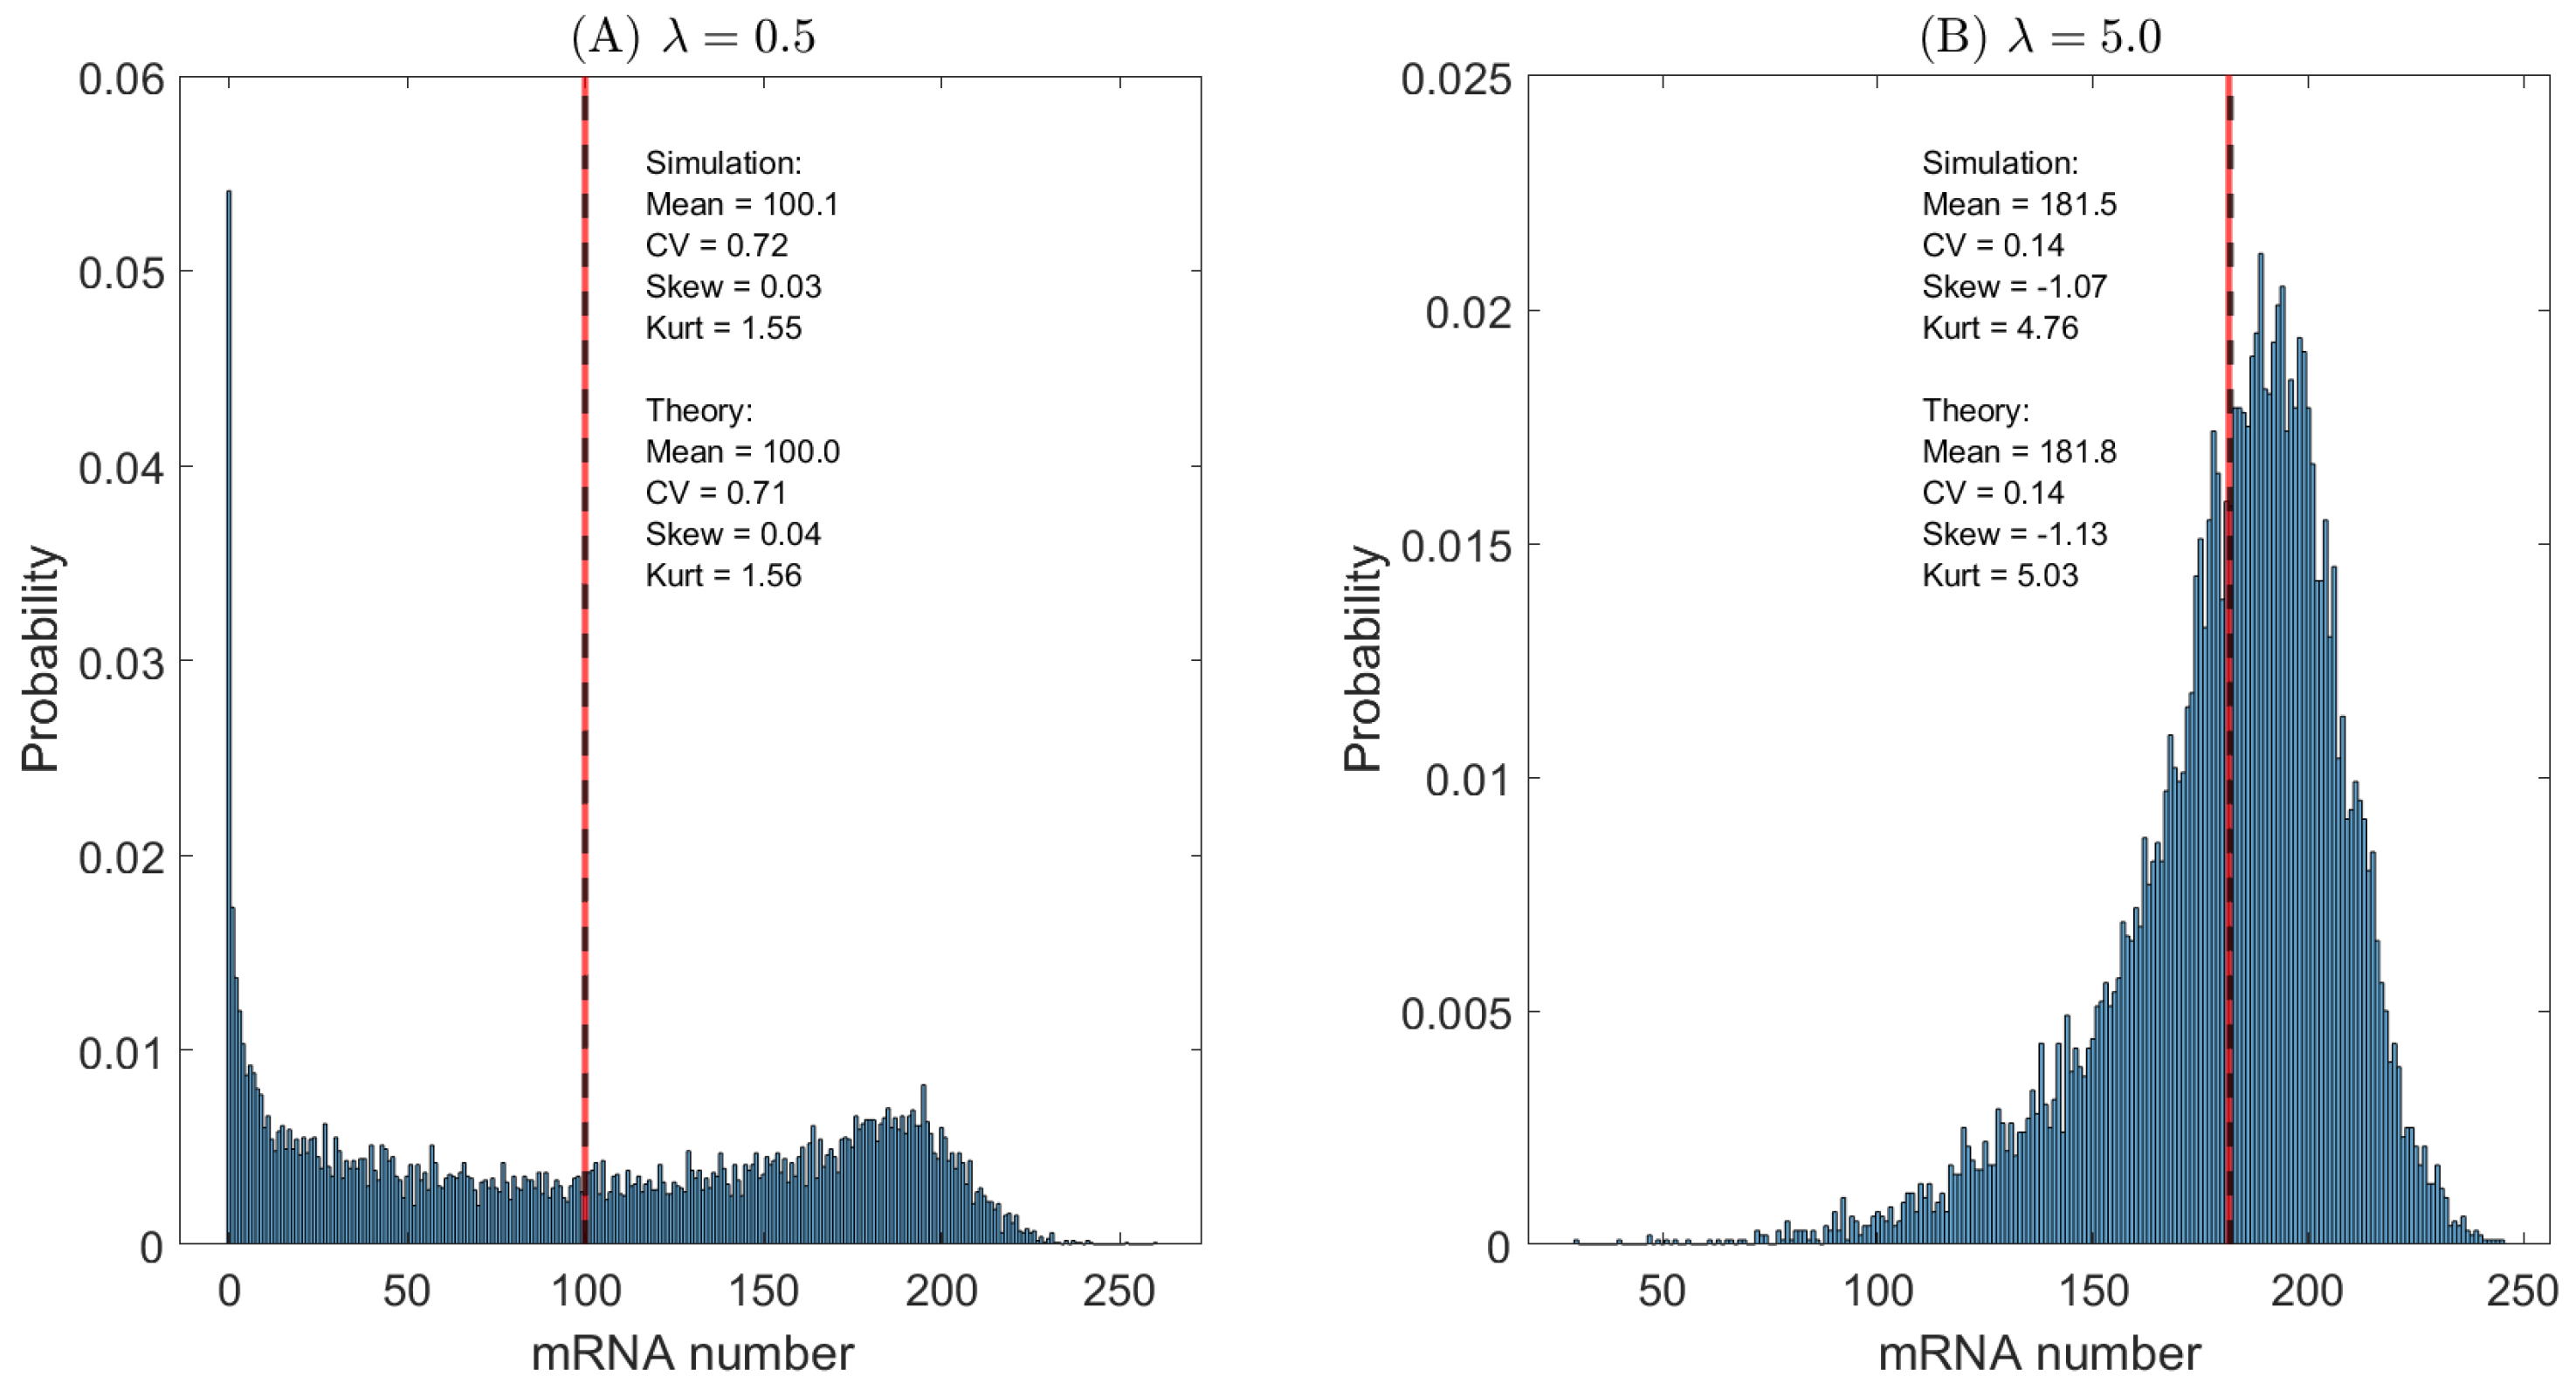
To further assess the impact of promoter activation dynamics, we compare two representative regimes: a slow-switching promoter () and a fast-switching promoter (), while keeping all other parameters fixed. Figure 3 shows the steady-state distributions of mRNA copy numbers obtained from exact Gillespie simulations of the two-state gene transcription model.
For slow promoter activation (, Figure 3A), the gene spends long periods in the inactive state, interrupted by rare but extended activation events. During each active period, mRNA molecules are produced rapidly, giving rise to pronounced transcriptional bursts. As a consequence, the distribution is strongly right-skewed. Moreover, the coexistence of low- and high-expression subpopulations leads to a bimodal structure, in which probability mass is distributed between two modes rather than concentrated in extreme tails, resulting in a reduced kurtosis compared to burst-dominated, heavy-tailed distributions.
In contrast, for fast promoter activation (, Figure 3B), frequent switching between the active and inactive states effectively averages transcriptional activity over time. This suppresses burstiness and yields a narrower and more symmetric mRNA distribution with reduced skewness and kurtosis.
In both regimes, the vertical lines denote the mean mRNA copy number. Analytical predictions derived from the exact expressions of the first four moments are in quantitative agreement with the simulation results, validating the theoretical analysis of mean expression levels and higher-order fluctuations.
5. Conclusions
Stochastic gene expression is most often characterized using low-order statistical descriptors such as the mean expression level, variance, or related noise measures including the Fano factor. While these quantities effectively quantify the overall magnitude of transcriptional variability, it has long been recognized that they are insufficient to capture the full geometric structure of mRNA copy number distributions generated by promoter switching and transcriptional bursting [3,11]. In this work, we demonstrate that skewness provides essential information about distributional asymmetry that cannot be inferred from variance alone.
Positive skewness emerges naturally from bursty transcription dynamics, in which rare promoter activation events give rise to intense transcriptional episodes [7,14,27]. Our analytical results show that the skewness depends explicitly on promoter switching kinetics and burst size, increasing with the ratio and with the burst size , even when the mean expression level is held fixed. This establishes skewness as a mechanistically informative statistic that reflects the underlying regulatory architecture rather than merely the overall noise magnitude. From a biological perspective, skewness quantifies the contribution of rare, high-expression cells within a population. Such cells can play a disproportionate role in downstream regulatory processes, including threshold-dependent responses, stress adaptation, and phenotypic diversification [25,28]. Variance-based measures treat fluctuations symmetrically around the mean and therefore obscure the statistical weight of these rare transcriptional events, whereas skewness directly captures the asymmetry induced by transcriptional bursting and slow promoter switching.
Beyond skewness, kurtosis further characterizes the sharpness and tail heaviness of mRNA distributions. Our results indicate that low mRNA abundance regimes are associated with elevated skewness and kurtosis, reflecting highly asymmetric and heavy-tailed distributions dominated by rare transcriptional bursts. As mRNA abundance increases, both skewness and kurtosis decrease, and the distribution approaches a Gaussian-like form. This behavior is consistent with effective averaging over many transcription events and aligns with previous theoretical analyses of noise–mean relationships in gene expression models [8,29].
Finally, our analysis provides a theoretical foundation for extending negative binomial–based analyses of single-cell transcriptomic data beyond conventional mean–variance fitting [6]. Distinct promoter dynamics may generate identical mean expression levels and variances while exhibiting markedly different skewness and kurtosis, a limitation that has been highlighted in recent studies on model identifiability and model reduction [26,30]. Incorporating higher-order statistics therefore offers a principled route toward improved discrimination between competing transcriptional mechanisms and establishes a tighter quantitative link between statistical inference and the underlying molecular regulation of gene expression.
Limitations and future directions. The present study focuses on a minimal two-state promoter model with constant kinetic parameters, which, while analytically tractable, represents an idealized description of transcriptional regulation. In particular, real promoters often exhibit multiple inactive or active states, transcription factor–dependent switching rates, and memory effects that can give rise to non-exponential waiting times between transcriptional events. Extending the analytical framework developed here to multi-state promoter architectures or non-Markovian switching processes would provide a more comprehensive characterization of transcriptional heterogeneity.
Moreover, our analysis is restricted to intrinsic noise arising from stochastic transcription and promoter switching and does not explicitly account for extrinsic sources of variability such as cell-to-cell differences in transcription factor abundance, cell cycle stage, or global physiological state. Incorporating extrinsic fluctuations, either through additional stochastic variables or through hierarchical modeling approaches, represents an important direction for future work.
Finally, while the present results establish skewness and kurtosis as mechanistically informative statistics at the mRNA level, an important open question concerns how these higher-order features propagate through translation and post-transcriptional regulation to shape protein-level variability. Systematic analysis of higher-order moments in coupled mRNA–protein models, together with direct comparisons to single-cell transcriptomic and proteomic data, will be essential for further bridging stochastic gene expression theory with experimental inference.
Author Contributions
ST and QS conceived the study, ST carried out the analysis, and ST and QS wrote the draft, all authors revised the manuscript critically and approved it for publishing.
Funding
This work was supported by the National Natural Science Foundation of China (No. 12171113) and the China Scholarship Council (No. 202409940012).
Data Availability Statement
The data presented in this study are available on request from the corresponding author.
Conflicts of Interest
The authors declare no competing interests.
Appendix A Detailed Derivation of Moments and Asymptotic Formulas
In this appendix, we give a step-by-step derivation of the mean, variance, skewness, and excess kurtosis of mRNA distributions in the two-state promoter model. The derivation proceeds from the chemical master equations (CME) (2.1)–(2.2) for the OFF/ON states.
Appendix A.1. Promoter State Probabilities
Summing over all transcript numbers m, define
which give the probability that the promoter resides in the OFF and ON states, respectively. Since these form a complete set of promoter states,
Differentiating and using the CME, we obtain
Solving with initial conditions , , we get
The steady-state probabilities are
Appendix A.2. First Moment (Mean)
Define the k-th moment of transcript numbers as
Decomposing by promoter state,
For (the mean),
Step 1: Steady-state solution.
Setting derivatives to zero, the equilibrium moments are
The total mean is
Step 2: Time-dependent solution.
Appendix A.3. Second Moment (Variance)
Similarly, for ,
Step 1: Steady-state solution.
Setting derivatives to zero,
The total second moment is , and the variance is
Appendix A.4. Third and Fourth Moments
Third moment:
At steady state,
Fourth moment:
Steady-state solution is obtained by setting derivative to zero and solving algebraically.
Appendix B Derivation of Asymptotic Formulas
In this appendix, we present the detailed derivation of the asymptotic expressions for the moments, skewness, and excess kurtosis in different transcription regimes. We start from the exact expressions for the first four moments derived in Appendix A.
Appendix B.1. Fast-Switching Regime
In the fast-switching limit, the promoter switching rates are much larger than mRNA degradation,
The exact moments contain terms proportional to and transient exponential terms . Since these decay rapidly, we can neglect them at steady state. Expanding the exact expressions in powers of , we obtain
From the definitions of skewness and excess kurtosis,
we obtain to leading order
Thus, in the fast-switching regime, the distribution is close to Poisson, with weak asymmetry and light tails.
Appendix B.2. Slow-Switching Regime
In the slow-switching limit, mRNA degradation is fast relative to promoter switching,
In the exact expressions for , the terms and , etc. Retaining leading-order terms in yields
Plugging into the skewness and excess kurtosis formulas gives
Derivation step:
1. Start from the exact moments (see Appendix A), e.g.,
using . 2. Similarly, expand and in powers of , keeping the leading terms. 3. Compute central moments to obtain skewness and excess kurtosis.
Appendix B.3. Bursty Transcription Regime
The bursty limit corresponds to rare but intense transcription events,
while keeping the burst size
Step 1: Mean and variance
In this limit, the mean and variance reduce to
which coincide with a negative binomial distribution.
Step 2: Higher-order moments
Expanding the exact expressions of in powers of B and keeping leading-order terms,
which after standardization yield
Step 3: Connection to negative binomial
The negative binomial PMF with parameters
reproduces the above skewness and excess kurtosis, confirming that bursty transcription naturally leads to overdispersed transcript count distributions.
Taken together, the slow-switching and bursty limits illustrate how promoter kinetics and burst size control the higher-order statistics of mRNA distributions, including skewness and excess kurtosis.
References
- Elowitz, M; Levine, A; Siggia, E; et al. Stochastic gene expression in a single cell. Science 2002, 297(5584), 1183–1186. [Google Scholar] [CrossRef]
- Hansen, A; Zechner, C. Promoters adopt distinct dynamic manifestations depending on transcription factor context. Molecular Systems Biology 2021, 17, MSB20209821. [Google Scholar] [CrossRef] [PubMed]
- Paulsson, J. Models of stochastic gene expression. Physics of Life Reviews 2004, 1(3), 157–175. [Google Scholar] [CrossRef]
- Swain, P; Elowitz, M; Siggia, E. Intrinsic and extrinsic contributions to stochasticity in gene expression. Proceedings of the National Academy of Sciences 2002, 99(20), 12795–12800. [Google Scholar] [CrossRef]
- Aitken, S; Robert, M; Alexander, R; et al. Processivity and coupling in messenger RNA transcription. PLoS One 2010, 5, e8845. [Google Scholar] [CrossRef]
- Church, B; Williams, H; Mar, J. Investigating skewness to understand gene expression heterogeneity in large patient cohorts. BMC Bioinformatics 2019, 20, 668. [Google Scholar] [CrossRef] [PubMed]
- Golding, I; Paulsson, J; Zawilski, S; et al. Real-time kinetics of gene activity in individual bacteria. Cell 2005, 123(6), 1025–1036. [Google Scholar] [CrossRef]
- Kuang, J; Tang, M; Yu, J. The mean and noise of protein numbers in stochastic gene expression. Journal of Mathematical Biology 2013, 67, 261–291. [Google Scholar] [CrossRef]
- Sun, Q; Tang, M; Yu, J. Temporal profile of gene transcription noise modulated by cross-talking signal transduction pathways. Bulletin of Mathematical Biology 2012, 74, 375–398. [Google Scholar] [CrossRef]
- Sun, Q; Jiao, F; Yu, J. The dynamics of gene transcription with a periodic synthesis rate. Nonlinear Dynamics 2021, 104, 4477–4492. [Google Scholar] [CrossRef]
- Tang, M. The mean and noise of stochastic gene transcription. Journal of Theoretical Biology 2008, 253, 271–280. [Google Scholar] [CrossRef]
- Blake, W; Kærn, M; Cantor, C. Noise in eukaryotic gene expression. Nature 2003, 422(6932), 633–637. [Google Scholar] [CrossRef]
- Lin, G; Yu, J; Zhou, Z; et al. Fluctuations of mRNA distributions in multiple pathway activated transcription. Discrete and Continuous Dynamical Systems - B 2019, 24(4), 1543–1568. [Google Scholar] [CrossRef]
- Liu, F; Wang, W; Ni, T; et al. Gene transcription in bursting: a unified mode for realizing accuracy and stochasticity. Biological Reviews 2019, 94(1), 248–258. [Google Scholar]
- Peccoud, J; Ycart, B. Markovian modeling of gene product synthesis. Theoretical Population Biology 1995, 48(2), 138–164. [Google Scholar] [CrossRef]
- Mackey, M; Tyran-Kamińska, M; Yvinec, R. Dynamic behavior of stochastic gene expression models in the presence of bursting. SIAM Journal on Applied Mathematics 2013, 73, 1830–1852. [Google Scholar] [CrossRef]
- Bokes, P. Stationary and time-dependent molecular distributions in slow-fast feedback Circuits. SIAM Journal on Applied Dynamical Systems 2022, 21(2), 903–931. [Google Scholar] [CrossRef]
- Jia, C; Li, Y. Analytical Time-Dependent Distributions for Gene Expression Models With Complex Promoter Switching Mechanisms. SIAM Journal on Applied Mathematics 2023, 83(4), 1572–1602. [Google Scholar] [CrossRef]
- da Silva, L; Yvinec, R; Prata, G; et al. Two-state stochastic model of in vivo observations of transcriptional bursts. Brazilian Journal of Physics 2025, 55, 150. [Google Scholar] [CrossRef]
- Jia, C; Grima, R. Dynamical phase diagram of an auto-regulating gene in fast switching conditions. The Journal of Chemical Physics 2020, 152, 174110. [Google Scholar] [CrossRef]
- Pedraza, J; Paulsson, J. Effects of molecular memory and bursting on fluctuations in gene expression. Science 2008, 319(5867), 1056–1060. [Google Scholar] [CrossRef] [PubMed]
- Zhang, Q; Cao, W; Wang, J; et al. Transcriptional bursting dynamics in gene expression. Frontiers Genetics 2024, 15, 1451461. [Google Scholar] [CrossRef]
- Sepúlveda, L; Xu, H; Zhang, J; et al. Measurement of gene regulation in individual cells reveals rapid switching between promoter states. Science 2016, 351, 1218–1222. [Google Scholar] [CrossRef] [PubMed]
- Lin, Y; Buchler, N. Efficient analysis of stochastic gene dynamics in the non-adiabatic regime using piecewise deterministic Markov processes. Journal of The Royal Society Interface 2018, 15(138), 20170804. [Google Scholar] [CrossRef]
- Thomas, P; Popović, N; Grima, R. Phenotypic switching in gene regulatory networks. Proceedings of the National Academy of Sciences 2014, 111(19), 6994–6999. [Google Scholar] [CrossRef]
- Holehouse, J; Grima, R. Revisiting the reduction of stochastic models of genetic feedback loops with fast promoter switching. Biophysical Journal 2019, 117(7), 1311–1330. [Google Scholar] [CrossRef] [PubMed]
- Hebenstreit, D; Karmakar, P. Transcriptional bursting: from fundamentals to novel insights. Biochemical Society Transactions 2024, 52(4), 1695–1702. [Google Scholar] [CrossRef]
- Fraser, D; Kærn, M. A chance at survival: gene expression noise and phenotypic diversification strategies. Molecular Microbiology 2009, 71(6), 1333–1340. [Google Scholar] [CrossRef]
- Hornung, G; Bar-Ziv, R; Rosin, D; et al. Noise–mean relationship in mutated promoters. Genome Research 2012, 22(12), 2409–2417. [Google Scholar] [CrossRef]
- Jiao, F; Li, J; Liu, T; et al. What can we learn when fitting a simple telegraph model to a complex gene expression model? PLoS Computational Biology 2024, 20(5), e1012118. [Google Scholar] [CrossRef]
Figure 1.
Schematic of the two-state telegraph model for mRNA bursty transcription. The gene promoter stochastically switches between an inactive state and an active state. No mRNA is produced when the promoter is inactive, whereas during the active state, mRNA molecules are synthesized in bursts, with burst initiation events occurring as a Poisson process at rate . Each mRNA molecule degrades independently at rate .
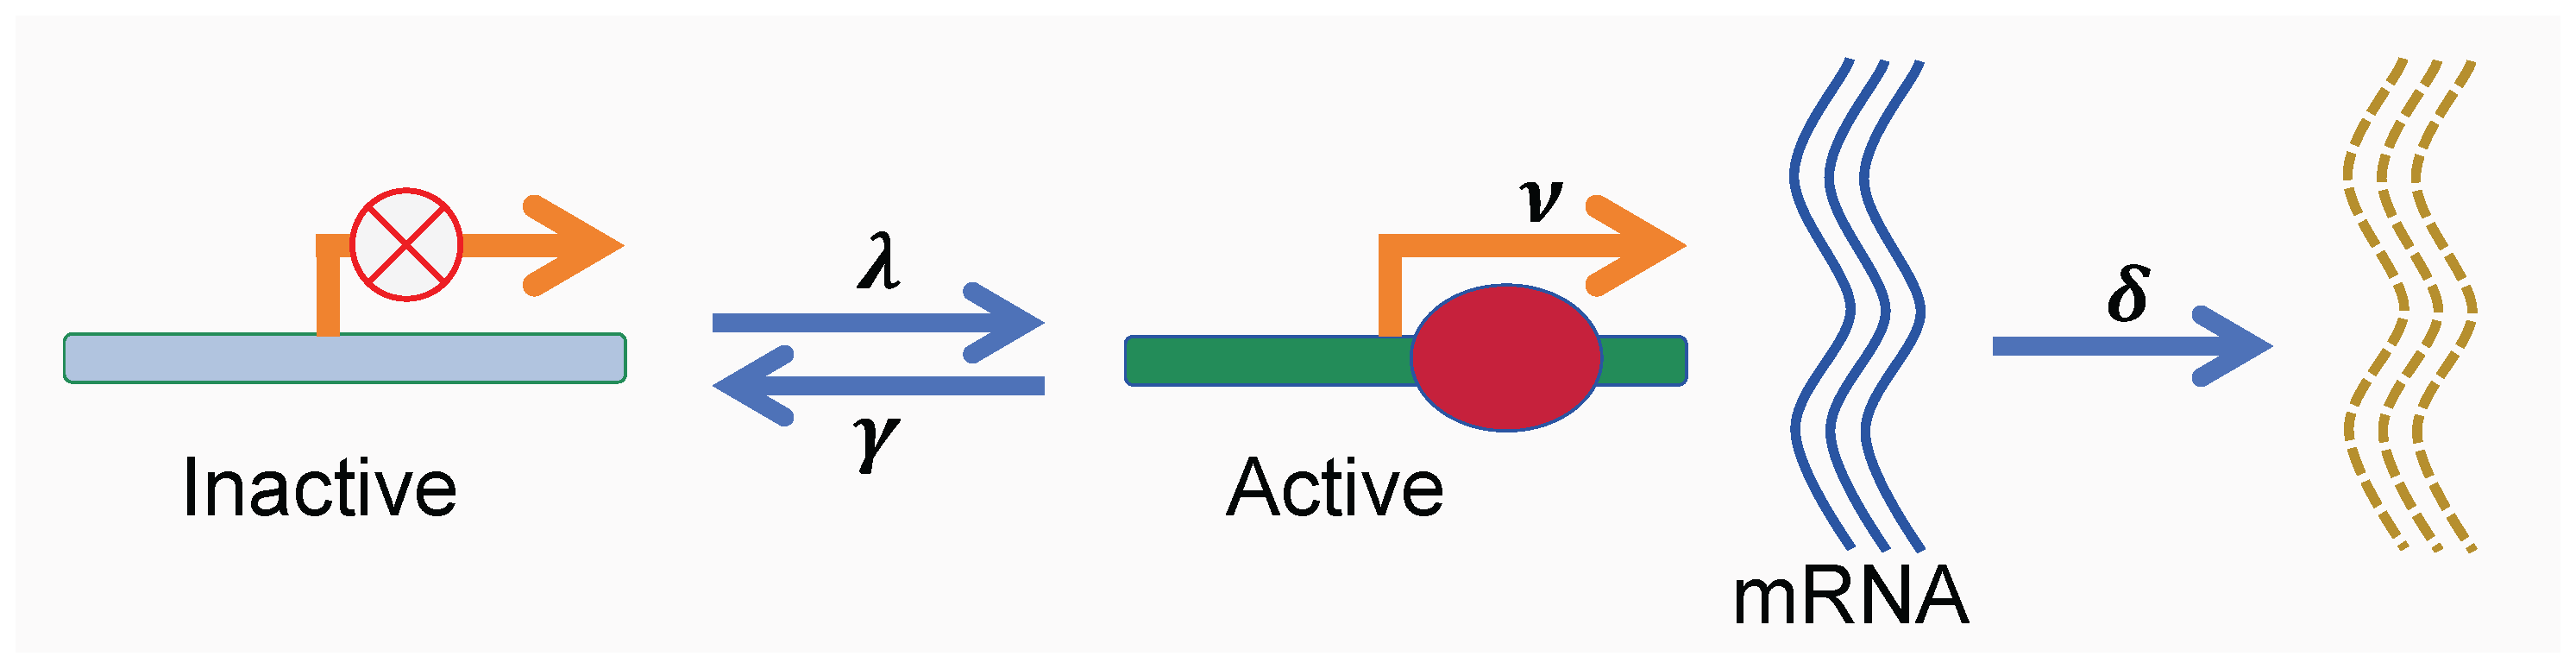
Figure 2.
Skewness and kurtosis of the steady-state mRNA distribution as functions of the promoter switching rates λ and γ. Red dots indicate the minimum values on each surface.
Figure 2.
Skewness and kurtosis of the steady-state mRNA distribution as functions of the promoter switching rates λ and γ. Red dots indicate the minimum values on each surface.
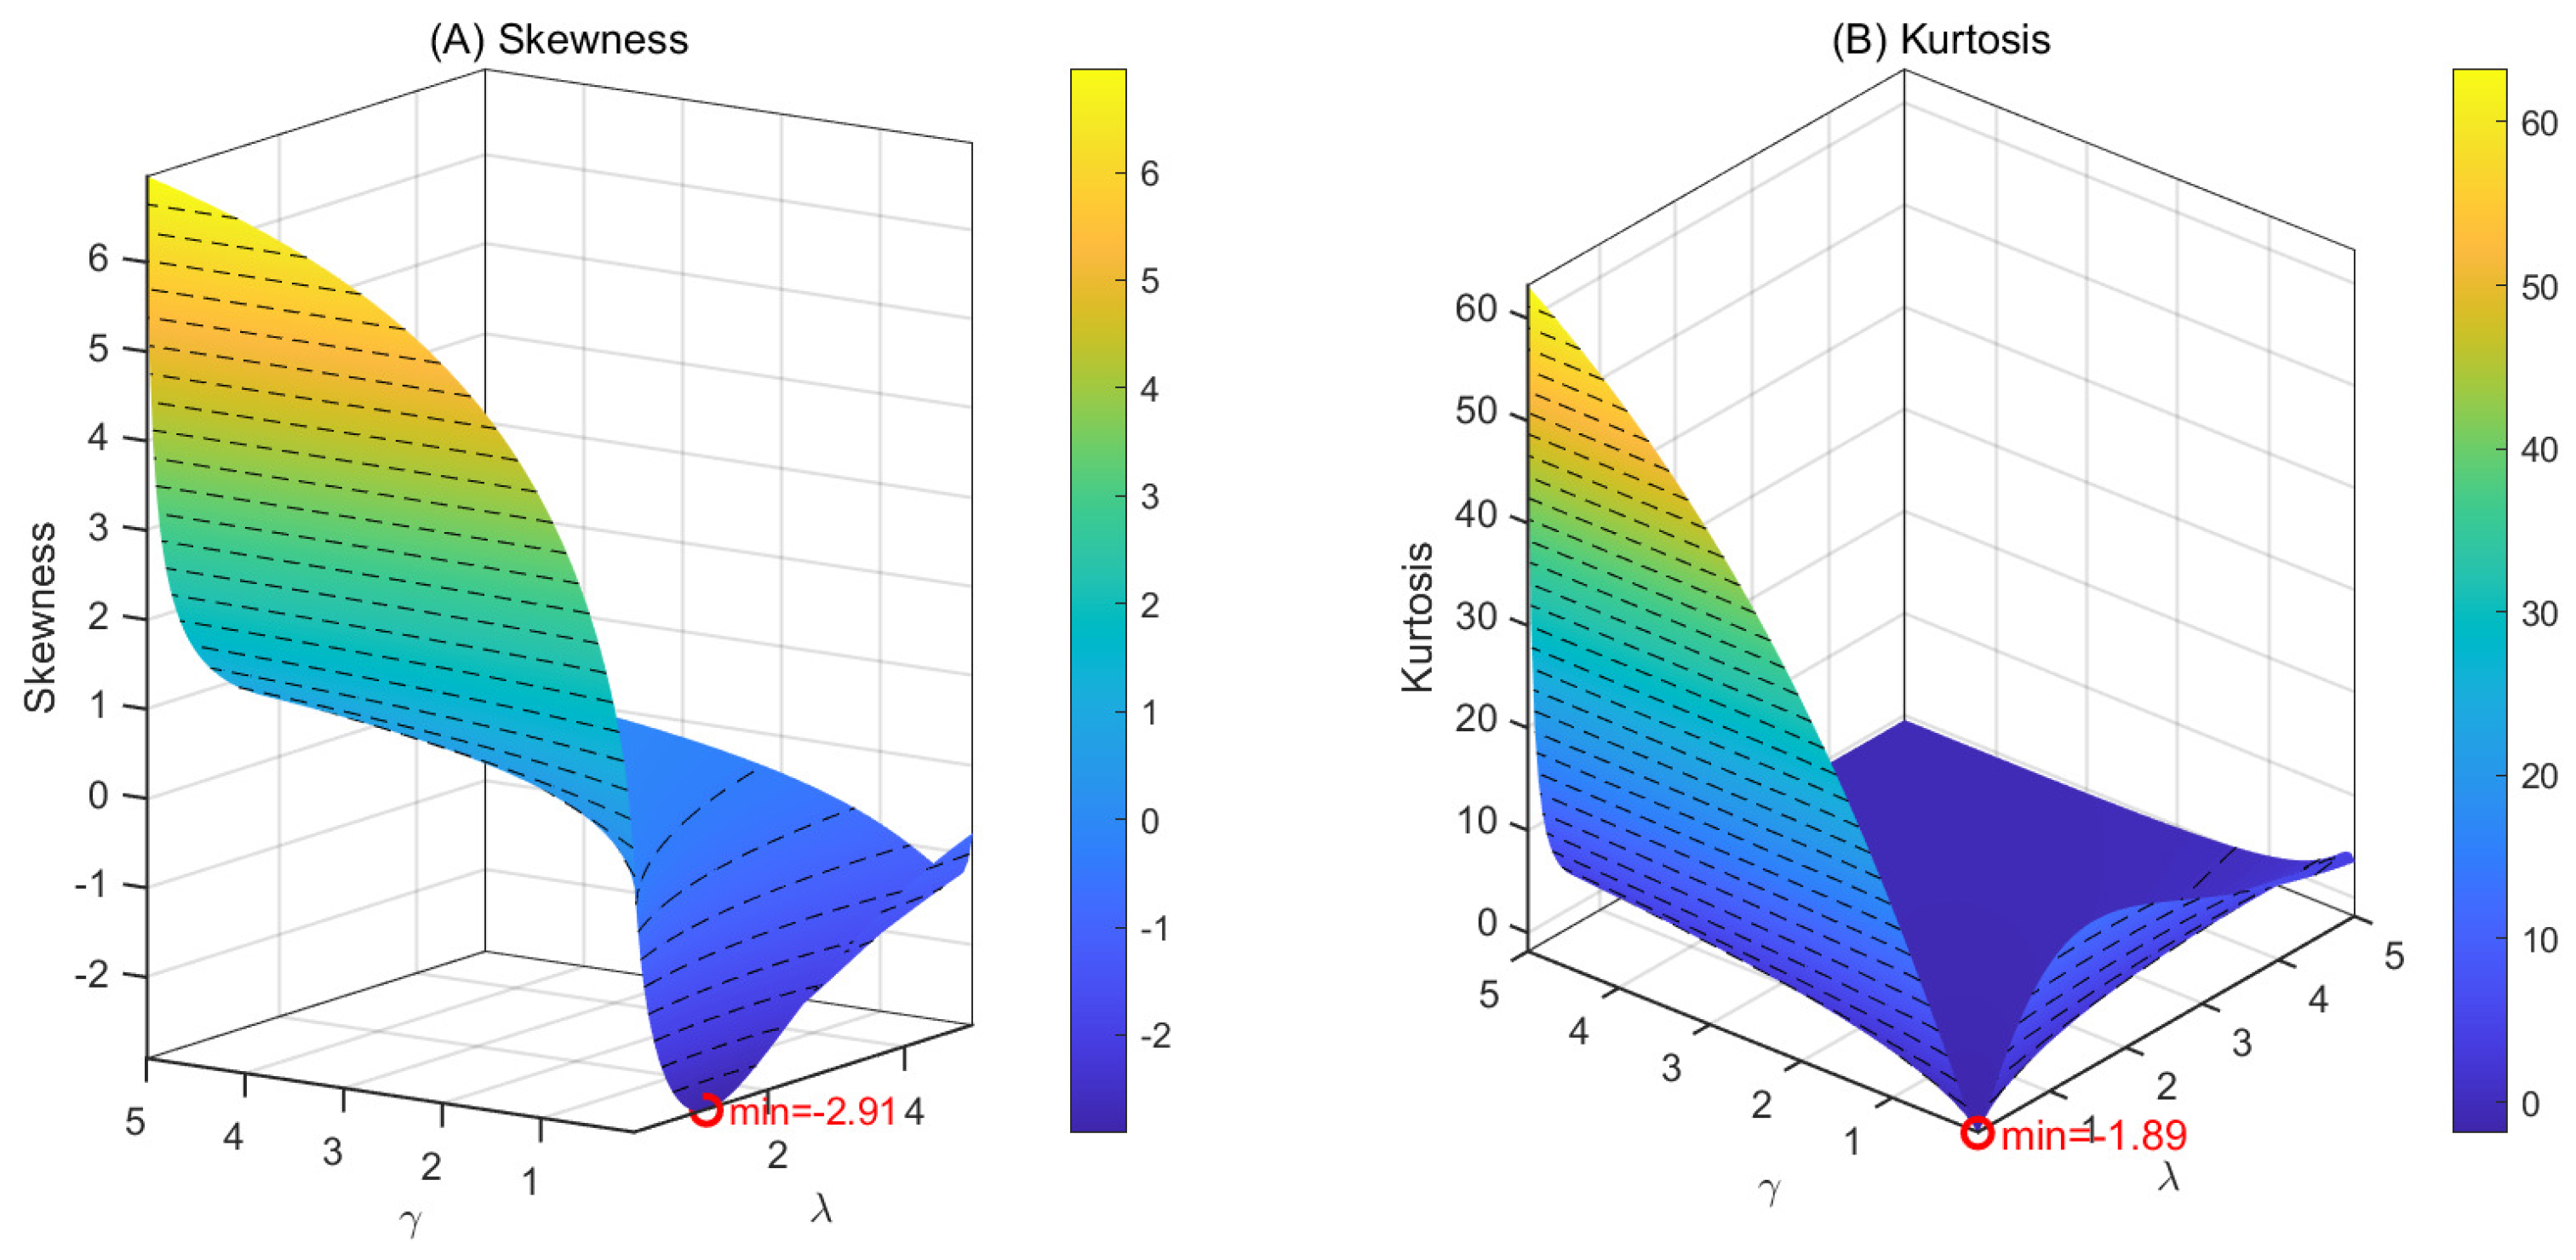
Figure 3.
Steady-state mRNA distributions for different promoter activation rates. (A) Slow promoter activation (). (B) Fast promoter activation ().
Figure 3.
Steady-state mRNA distributions for different promoter activation rates. (A) Slow promoter activation (). (B) Fast promoter activation ().
Disclaimer/Publisher’s Note: The statements, opinions and data contained in all publications are solely those of the individual author(s) and contributor(s) and not of MDPI and/or the editor(s). MDPI and/or the editor(s) disclaim responsibility for any injury to people or property resulting from any ideas, methods, instructions or products referred to in the content. |
© 2026 by the authors. Licensee MDPI, Basel, Switzerland. This article is an open access article distributed under the terms and conditions of the Creative Commons Attribution (CC BY) license (http://creativecommons.org/licenses/by/4.0/).
Copyright: This open access article is published under a Creative Commons CC BY 4.0 license, which permit the free download, distribution, and reuse, provided that the author and preprint are cited in any reuse.


