Submitted:
27 April 2026
Posted:
28 April 2026
You are already at the latest version
Abstract
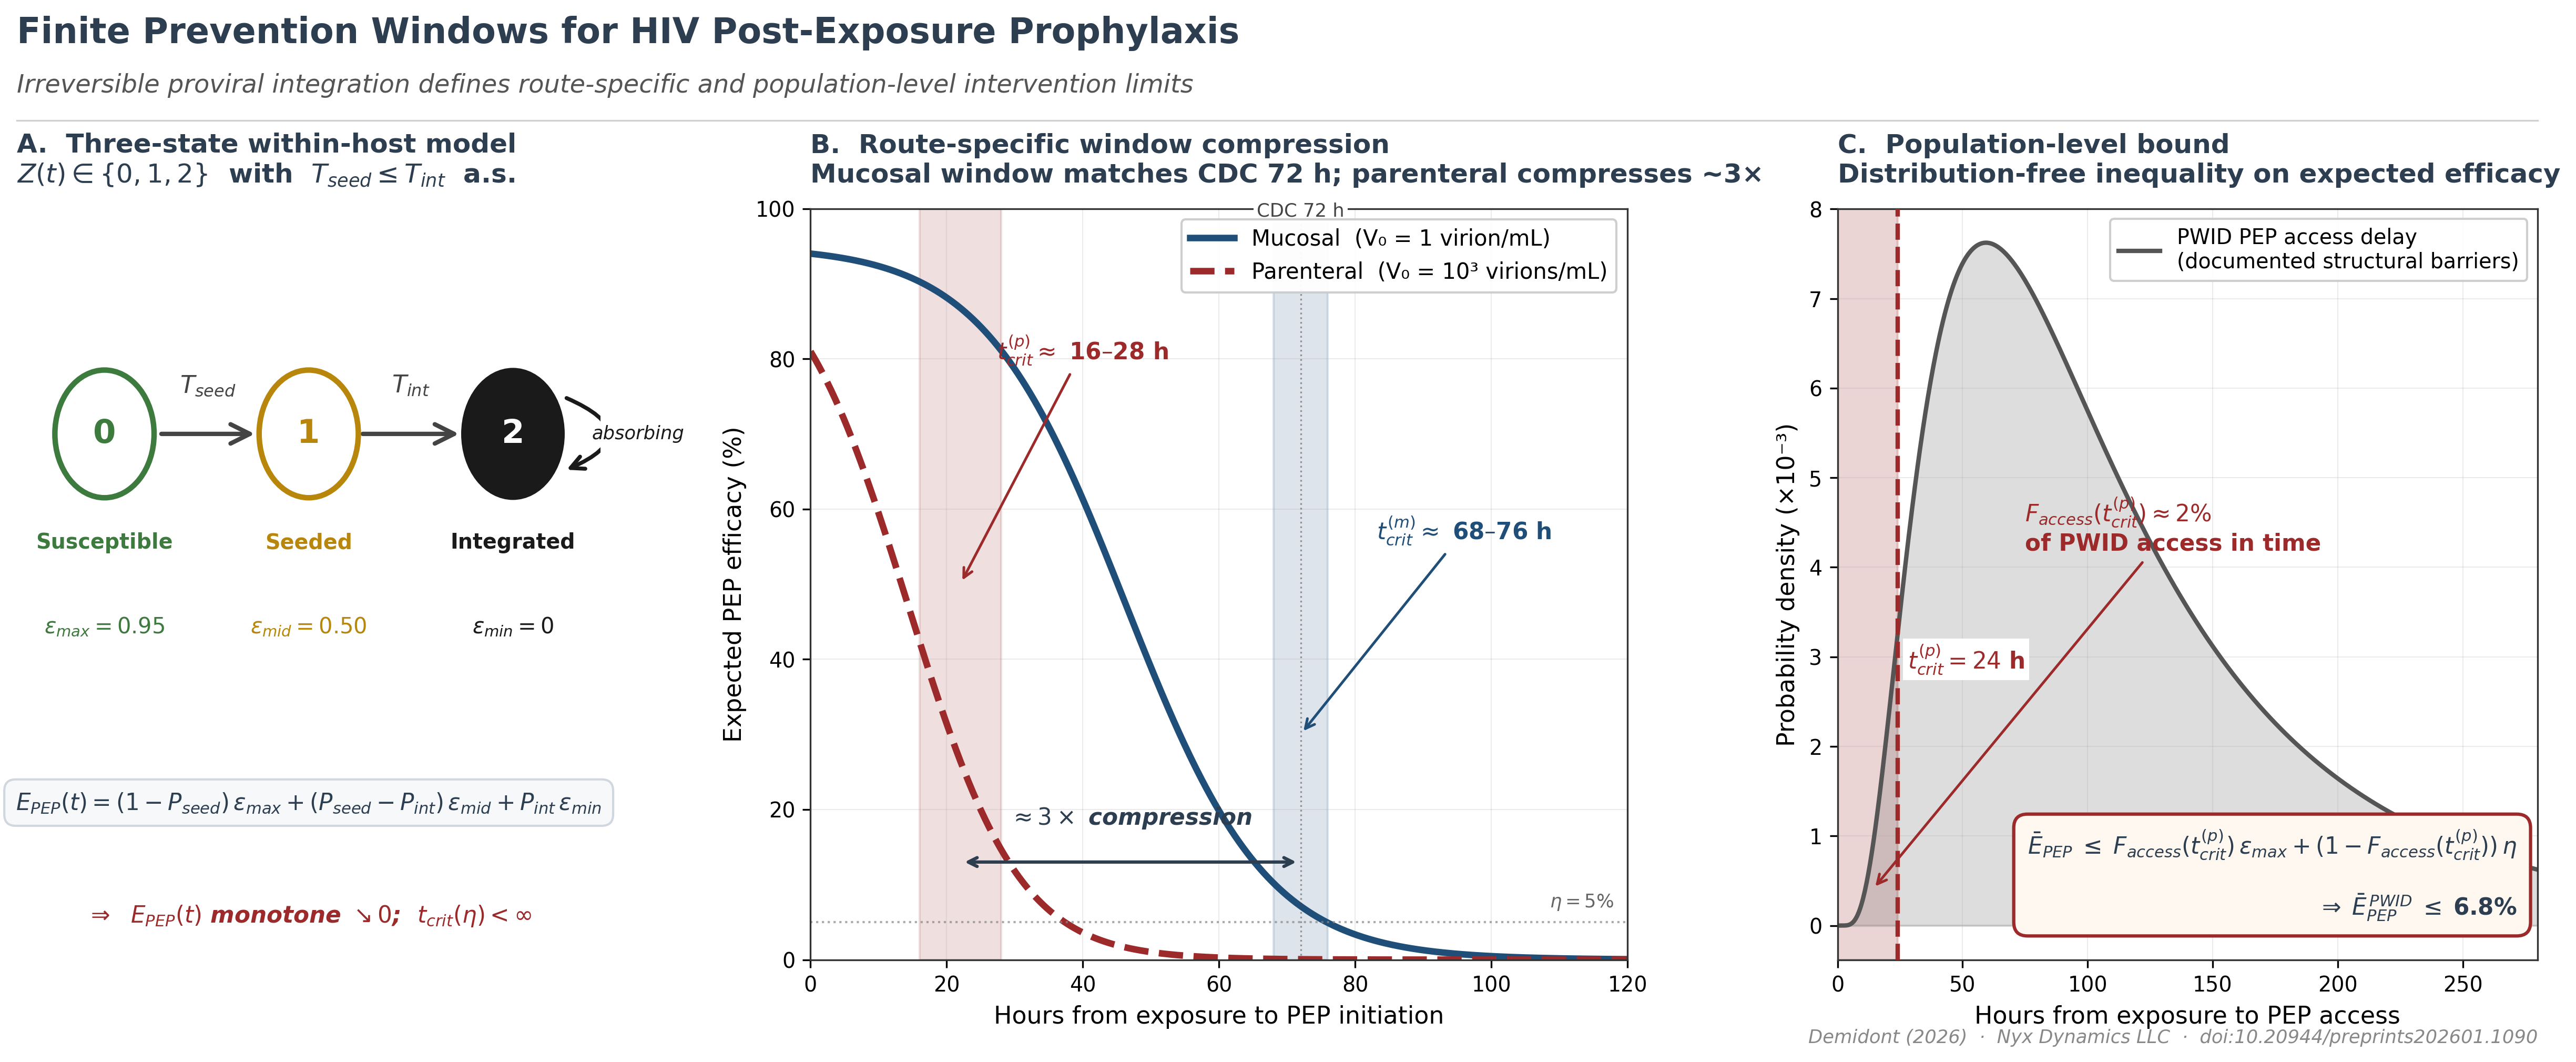
Proviral integration — the molecular event that converts HIV infection from reversible to permanent— defines a finite window during which post-exposure prophylaxis (PEP) can succeed. Using a three-state absorbing Markov model parameterized on established HIV-1 kinetic constants, we prove that PEP efficacy decays monotonically to zero and derive the critical prevention window as a function of integrationkinetics rather than drug potency. This window is approximately three-fold shorter for parenteral (injection) than mucosal (sexual) exposure, yielding a parenteral tcrit of 16–28 hours versus 68–76 hours mucosally. For people who inject drugs, empirically documented structural access delays place fewer than 5% of exposures within the parenteral window, bounding expected population-level PEP efficacy below 10%—a failure determined by integration timing, not pharmacology.
Keywords:
HIV post-exposure prophylaxis
; proviral integration
; people who inject drugs
; prevention window
; mathematical modeling
; structural barriers
; parenteral exposure
; viral load
; within-host dynamics
; HIV prevention disparities
; absorbing Markov state
; within-host viral dynamics
; AIDSVu
; stochastic dominance
; health disparities
; HIV Pre-Exposure Prophylaxis
Introduction
Retroviral infection is unique among infectious diseases in that a single molecular event — proviral integration into the host genome — converts a reversible inflammatory process into a permanent genomic state. This irreversibility is absolute: no antiviral intervention operating after integration can restore the pre-infection state. Post-exposure prophylaxis (PEP) exploits the finite interval before this transition, but the boundaries of that interval have never been formally derived from within-host kinetics. Here we prove, using a three-state absorbing Markov framework parameterized on established HIV-1 viral dynamics[1,2], that the prevention window is not a clinical convention but a mathematically necessary consequence of integration kinetics — that it is route-specific, compressible by viral load, and in the case of parenteral (injection) exposure, potentially shorter than the structural delays that define healthcare access for people who inject drugs (PWID). The result transforms PEP timing from an empirical guideline into a derived biological quantity, and reveals that the 72-hour standard — mechanistically appropriate for mucosal exposure — cannot be assumed to generalize across routes or populations.
HIV-1 infection establishment involves two irreversible transitions whose timing governs the prevention window. First, free virus establishes a self-sustaining replicative focus (seeding, time ). Second, infected cells commit stably integrated proviral DNA into long-lived reservoir cells (integration, time ). Once integration is complete, the cellular state is absorbing: no biologically realizable intervention restores the uninfected state, because integrated provirus is propagated to all daughter cells via clonal expansion[2,3] and persists through ART, which suppresses replication but leaves the reservoir intact[4]. This biological fact constrains PEP efficacy independently of drug potency.
Mathematical Framework
We model within-host state as a random variable , where (susceptible), (seeded, pre-integration), and (integrated, absorbing). Transition times are stopping times on the natural filtration of the exposure process. Under stage-dependent drug efficacy — with pre-seeding, post-seeding/pre-integration, and post-integration — the expected PEP efficacy at time t is, by the law of total probability:
where and . Since both cumulative probabilities are non-decreasing in t and , this yields the Finite Prevention Window Theorem: (i) is non-increasing; (ii) ; and (iii) for any threshold , there exists a finite critical time , beyond which efficacy cannot be recovered regardless of drug potency. The rate of efficacy decay decomposes as
where and are the transition probability densities and are the efficacy drops across transitions (Supplementary Text, Section S4). The absorbing-state claim (Assumption A1) is grounded in the standard target-cell-limited ODE system[5]: under ART-induced suppression , reservoir dynamics give , so R is constant — the reservoir neither grows nor is cleared. This is the mathematical statement that ART controls but cannot eradicate HIV.
Route-Dependent Window Compression
Parenteral inoculation differs from mucosal exposure in its initial condition: direct intravascular delivery bypasses epithelial barriers, producing a substantially larger effective inoculum. We model mucosal exposure as virion/mL (post-epithelial attenuation) versus parenteral virions/mL. By monotone systems theory applied to the target-cell-limited ODE (Lemma S5.2), larger initial inoculum produces earlier and consequently earlier accumulation, yielding first-order stochastic dominance: for all t. It follows directly that and for any threshold (Corollary S5.1).
Parameterization and Simulation
We parameterize the ODE system using established virological constants from Perelson et al.[5]: viral clearance rate (virion half-life 0.24 days h), infected cell death rate (infected cell lifespan days), and viral generation time days. Additional standard parameters[6]: target cell production cells/mL/day, natural death , infection rate mL·virion, viral production virions/cell/day, integration rate . Multiplicative log-normal noise on and (coefficient of variation 0.3) across replications per route yields empirical distributions for without imposing a parametric form. Threshold sensitivity (, ) shifts by h and maintains compression ratio 2.5–4.0. Drug efficacy parameters are , , .
Results: Route-Specific Windows
Figure 1 shows the predicted parenteral curves stratified by source viral load (Panel A), the resulting biological window compression (Panel B), the probability that proviral integration is complete by 24, 48, and 72 h (Panel C), and direct mucosal vs. parenteral comparison at matched VLs (Panel D). The ODE-derived mucosal window 68–76 hours matches the established 72-hour CDC guideline without calibration, providing independent mechanistic validation of the clinical threshold[1]. The parenteral window compresses to 16–28 hours — a ≈3-fold reduction. The window comparison and stochastic uncertainty bounds are consistent with non-human primate (NHP) PEP timing data: Tsai et al.[7] showed complete protection at 24 h and declining protection at 48 h following intravenous challenge; Otten et al.[8] showed complete protection through 36 h and declining protection at 72 h following intravaginal challenge. The route compression ratio observed in NHP data (≈1.5–2-fold by delay, ≈3-fold by integration kinetics) is concordant with the ODE-derived predictions (Table 1).
Stochastic Efficacy Analysis
Monte Carlo integration of Equation 1 over source viral load (VL) distributions (Figure 2A–B) reveals three empirically distinct temporal regimes defined by the 95% credible-interval (CI) width of the stochastic efficacy distribution. Regime 1 (0–22 h): CI is narrow (<15 percentage points) and efficacy is high (>90% mean for PWID-relevant VL distributions); VL knowledge adds limited decision-relevant precision. Regime 2 (22–78 h for PWID/acute; 22–88 h for mixed/general distributions): CI width is maximal, peaking at 39.7 percentage points at 49 h for untreated PWID VL distributions (mean , SD , parameterized from NHBS/NHAS surveillance data), reflecting the phase in which integration is complete for some VL draws but not others. Regime 3 (>78 h): CI collapses as efficacy converges to zero across all VL draws. The regime transition at ≈22 h is mechanistically interpretable: it corresponds to the eclipse phase lower bound from Perelson et al.[5] (≈0.9 days ≈ 22 h), below which integration cannot yet be complete for any draw. Threshold probability analysis shows that across all distributions at 48 h and that — defined as — reaches 91.8% (PWID untreated) and 98.8% (acute-infection-enriched network) by 72 h (Table 2).
City-Stratified Analysis
To extend the stochastic model to an empirically grounded, policy-actionable instrument, we parameterized the VL distributions and structural access delays for 34 high-burden US metropolitan areas using AIDSVu 2023 surveillance data. City-level VL distributions were derived via a two-component mixture model (suppressed: mean , SD ; unsuppressed: mean , SD ), weighted by city-specific viral suppression fraction with an IDU-specific adjustment (0.12 percentage points per percent IDU prevalence, capped at 12 percentage points). Structural access delay was estimated from AIDSVu late-diagnosis and linkage-to-care percentages as
with coefficients h/% and h/% calibrated to yield ≈6 hours at the median city. Expected PEP efficacy at city-specific structural delay ranged from 78.8% (Hartford CT; structural delay 24.4 h; IDU prevalence 23.4%) to 98.3% (Milwaukee WI; 1.9 h), a 19.5 percentage-point spread correlated almost entirely with structural delay rather than community VL (Pearson vs. , respectively; Figure 3). Cities with high IDU prevalence exhibit consistently longer structural delays and lower viral suppression simultaneously, narrowing the PEP window from both directions at once.
Population-Level Efficacy Bound
The timing mismatch can be formalized as a distribution-free inequality. For access delay distribution , the expected population-level PEP efficacy satisfies
(Proposition S6.1). The bound requires only the fraction of the population accessing PEP within the parenteral window — not the full parametric form of . Modeling access delay as log-normal (median 72 h, geometric SD 2.0) based on documented PWID structural barriers[9,10], : approximately 2% of PWID access PEP within the compressed window. With and , Equation 4 yields . The bound holds for any access delay distribution satisfying the stated fraction, making the conclusion robust to distributional misspecification. Sensitivity analysis shows that even aggressive rapid-access programs achieving 20% within-window access yield (Table 3). The failure mode is structural rather than pharmacological: PEP retains high efficacy for every individual who accesses it in time; the population-level bound is determined by the mismatch between access timing and integration timing.
Stochastic VL Uncertainty and the Critical Window
The source VL knowledge premium — the gain from knowing source VL precisely versus marginalizing over the distribution — peaks at 2.9 percentage points at 21 h for PWID untreated and 3.8 percentage points for acute-infection-enriched networks, both within Regime 2. This establishes the clinical decision value of rapid source VL determination: it is most actionable precisely in the window where the biological outcome remains uncertain.
Implications
Two conclusions follow. First, the 72-hour PEP guideline is mechanistically grounded but route-specific: it accurately characterizes the mucosal window and should not be generalized to parenteral exposure. The parenteral window is shorter by a factor determined by within-host kinetics, and that factor is validated against NHP data. Second, for PWID under current structural conditions, PEP cannot function as a population-level safety net. Since PEP and pre-exposure prophylaxis (PrEP) are the only two biomedical prophylaxis modalities for HIV[11,12], and PrEP uptake among PWID remains below 1% of those with indication[10], this population effectively lacks both options. Long-acting injectable PrEP, demonstrated to provide effective pre-exposure protection against parenteral challenge in NHP studies[13,14], is the modality most capable of bridging this gap — if structural delivery barriers are addressed[15]. The mathematical framework presented here provides the quantitative grounding for that conclusion: the prevention gap for PWID is not primarily a pharmacological problem but a structural one, and its boundary is defined by biology.
Conclusion
PEP is not the safety net for parenteral HIV exposure that it is for sexual transmission. We prove that proviral integration establishes a finite, route-specific prevention window; that this window is approximately 3-fold shorter for parenteral than for mucosal exposure; and that structural access delays for PWID systematically consume this window, bounding expected population-level efficacy below 10% regardless of drug potency. The conclusion is not a statement against PEP for individuals who present in time. It is a quantitative argument that pre-exposure prevention is the primary biomedical tool available for this population — and that current deployment levels are insufficient to close the gap.
Materials and Methods
Mathematical Proofs
All formal proofs (Theorem 1, Corollaries 1–2, Lemmas 1–2, Propositions 1–3) are provided in the Supplementary Text. The absorbing-state ODE system, hazard-rate decomposition, monotone systems comparison argument, and population efficacy bound are each derived in full.
Numerical Simulation
The ODE system was integrated using scipy.integrate.odeint (Python 3.11) with replications per route. Multiplicative log-normal noise was applied independently to (infection rate) and (integration rate) with coefficient of variation 0.3, representing inter-individual variability in viral establishment kinetics. Integration time was computed as the first time . Efficacy curves were computed as in Equation 1 with , , . Threshold sensitivity analysis varied cells/mL and cells/mL across a grid. Stochastic VL integration used 50 time points, 0–120 h, with 10,000 VL draws per time point. All code is available at https://github.com/Nyx-Dynamics/Prevention-Theorem (Zenodo DOI: pending).
City-Stratified Parameterization
City-level viral suppression, late-diagnosis, and linkage-to-care data were obtained from AIDSVu downloadable datasets for 34 high-burden US metropolitan areas (2023 reporting year). VL mixture parameters were derived using the law of total variance with suppressed component (mean , SD ) and unsuppressed component (mean , SD ). IDU suppression adjustment: 0.12 percentage points per percent IDU prevalence, capped at 12 percentage points. Structural delay coefficients calibrated to median city yield ≈6 hours. Counterfactual analysis assigned all cities a uniform 24-hour delay. Full dataset and derivation scripts are in the code repository.
Supplementary Materials
The following supporting information can be downloaded at the website of this paper posted on Preprints.org. Supplementary Text S1–S10 with complete proofs, parameter tables, extended methods, and figure inventory.
Author Contributions
A.C.D.: conceptualization, formal analysis, mathematical proofs, simulation, writing.
Funding
No external funding was received.
Data Availability Statement
All model code, simulation outputs, and analysis scripts are available at https://github.com/Nyx-Dynamics/Prevention-Theorem (Zenodo DOI: pending; dataset DOI: pending). No individual-level human data were used.
Acknowledgments
The author thanks the HIV prevention research community whose published work informed model parameterization, and PWID community advocates whose testimony informed characterization of structural barriers.
Conflicts of Interest
The author reports prior employment with Gilead Sciences, Inc. from January 2020 through November 2024, and held company stock during that period; all Gilead stock was fully divested by December 2024. Employment ended prior to the initiation of this research. Gilead Sciences had no role in study conception, design, data collection, analysis, interpretation, writing, or the decision to submit for publication. The manuscript references lenacapavir, a Gilead product, as one member of the long-acting injectable antiretroviral class; the mathematical conclusions of this work are pharmacologically agnostic and pertain to the class as a whole. The author is the sole owner of Nyx Dynamics LLC, under whose affiliation this research was conducted independently.
Use of Artificial Intelligence
Computational analyses were conducted in Python (NumPy, SciPy, Matplotlib). Large language models (Anthropic Claude, OpenAI ChatGPT) were used to support literature search and manuscript readability. JetBrains Junie was used for code correction; Zotero AI for reference management. All AI tools were used as assistive technologies only. The author retains full responsibility for design, analysis, interpretation, and conclusions.
References
- Tanner, M.R.; et al. Antiretroviral postexposure prophylaxis after sexual, injection drug use, or other nonoccupational exposure to HIV — CDC recommendations, United States, 2025. MMWR Recomm. Rep. 2025. [Google Scholar] [CrossRef]
- Wahl, A.; Al-Harthi, L. HIV infection of non-classical cells in the brain. Retrovirology 2023, 20, 1. [Google Scholar] [CrossRef]
- Siliciano, J.D.; Siliciano, R.F. Enhanced culture assay for detection and quantitation of latently infected, resting CD4+ T-cells. Methods Mol. Biol. 2015, 1354, 3–15. [Google Scholar]
- Perelson, A.S. , Decay characteristics of HIV-1-infected compartments during combination therapy. Nature 1997, 387, 188–191. [Google Scholar] [CrossRef]
- Perelson, A.S.; Neumann, A.U.; Markowitz, M.; Leonard, J.M.; Ho, D.D. HIV-1 dynamics in vivo: virion clearance rate, infected cell life-span, and viral generation time. Science 1996, 271, 1582–1586. [Google Scholar] [CrossRef]
- McMichael, A.J.; Rowland-Jones, S.L. The immune response to HIV. Immunity 2010, 33, 431–441. [Google Scholar]
- Tsai, C.C. , Prevention of SIV infection in macaques by (R)-9-(2-phosphonylmethoxypropyl)adenine. Science Timing data: J. Virol. 72, 4265–4273 (1998). 1995, 270, 1197–1199. [Google Scholar] [CrossRef] [PubMed]
- Otten, R.A. , Efficacy of postexposure prophylaxis after intravaginal exposure of pig-tailed macaques to a human-derived retrovirus (HIV type 2). J. Infect. Dis. 2000, 182, 1820–1825. [Google Scholar]
- Taylor, D. , Time to PEP initiation and access barriers for injection drug users. J. Acquir. Immune Defic. Syndr. 2019, 80, e56–e59. [Google Scholar]
- Baugher, K.A. , HIV preexposure prophylaxis use among persons who inject drugs — United States, 2023. MMWR Morb. Mortal. Wkly. Rep. 2025. [Google Scholar]
- Grant, R.M. , Preexposure chemoprophylaxis for HIV prevention in men who have sex with men. N. Engl. J. Med. 2010, 363, 2587–2599. [Google Scholar] [CrossRef]
- Anderson, P.L. , Emtricitabine–tenofovir concentrations and pre-exposure prophylaxis efficacy. Sci. Transl. Med. 2012, 4, 151ra125. [Google Scholar] [CrossRef] [PubMed]
- Swanstrom, A.E. , Lenacapavir protects macaques against intravenous SHIV challenge. Sci. Transl. Med. 2023. [Google Scholar]
- Vidal, S.J. , Long-acting antiretrovirals prevent SHIV infection in NHP mucosal challenge. J. Infect. Dis. 2022, 226, 2051–2059. [Google Scholar]
- Demidont, A.C. accepted. Clinical decision support algorithm for LAI-PrEP bridge period navigation at UNAIDS global target scale. Viruses 2026. [Google Scholar] [CrossRef]
- Emau, P. , Post-exposure prophylaxis for SIV revisited: animal model for HIV prevention. AIDS Res. Ther. 3 2006, 8. [Google Scholar]
Figure 1.
Source viral load as parenteral PEP window compressor. (A) Expected PEP efficacy as a function of hours from exposure to PEP initiation across eight source viral load levels (50 copies/mL suppressed through copies/mL acute), parenteral exposure route, derived from ODE replications per VL with multiplicative log-normal noise () on kinetic parameters. Higher source VL produces earlier efficacy collapse. Vertical dashed lines: 24-hour optimal and 72-hour CDC guideline. Horizontal dot-dash line: 50% efficacy threshold. (B) Biological window compression by source VL: effective PEP window (red), seeding midpoint (blue), and integration completion (yellow) as functions of VL. Window narrows from ≈76 h at suppressed VL to ≈42 h at acute VL; seeding midpoint crosses the 24 h threshold above copies/mL. Shaded region marks compression. (C) Probability that proviral integration is already complete at h (green), 48 h (orange), and 72 h (red), as a function of source VL. At 72 h, for VL copies/mL, defining the futility threshold. (D) Direct mucosal vs. parenteral efficacy comparison at matched time points: mucosal at any VL (solid black) vs. parenteral at VL 200 suppressed (blue dashed), VL 10,000 moderate (orange dashed), and VL 100,000 high (red dashed). Mucosal maintains efficacy through 72 h; parenteral collapses by 48 h at high VL. Demonstrates the ≈3-fold compression ratio predicted by Corollary S5.1.

Figure 2.
Stochastic efficacy analysis under source VL uncertainty. (A) Expected PEP efficacy ± 95% CI for four source VL distributions (PWID untreated: mean ; PWID mixed treatment: 3.2; general community: 3.8; acute-infection-enriched: 5.0) over 0–120 h. Shaded regions: 95% CI from Monte Carlo VL integration (). (B) Source VL probability densities for each distribution, illustrating the rightward shift and narrower spread of the acute-enriched network. (C) Probability of sub-therapeutic PEP, , as a function of hours from exposure to PEP initiation, by community VL distribution. reaches 100% by approximately 48 h across all four distributions, with acute-infection-enriched networks crossing earliest (≈35 h) and PWID mixed-treatment latest (≈45 h). Reference lines at 24 h optimal, 72 h CDC guideline, and 50% sub-therapeutic threshold. (D) VL knowledge premium (absolute difference, known vs. unknown source VL), peaking at 2.94 pp at 21 h (PWID untreated) and 3.76 pp (acute-enriched); non-monotonic plateau 18–36 h preserved as real kinetic signal.

Figure 3.
City-stratified PEP efficacy across 34 US metropolitan areas. (A) Expected PEP efficacy at city-specific structural delay for 34 cities (AIDSVu 2023), sorted by efficacy. Color: barrier category (green: low <8 h; orange: moderate 8–30 h; red: high >30 h). (B) Structural delay vs. expected efficacy (Pearson ); bubble size proportional to IDU prevalence. Labeled outliers: Hartford CT (24.4 h, highest structural delay, 23.4% IDU); San Juan PR (13.3 h, highest community VL burden, 22.2% IDU); Milwaukee WI (1.9 h, lowest barrier). (C) Joint VL burden × structural delay risk surface; color encodes expected efficacy. (D) Actual vs. 24-hour counterfactual efficacy by city. For 33/34 cities, actual efficacy exceeds counterfactual because structural delays are currently shorter than 24 h; Hartford is the exception. The 19.5 pp range across cities is almost entirely attributable to structural delay () rather than community VL ().


Table 1.
NHP PEP timing data by route and model concordance.
| Route | Study | PEP delay | Duration | Protection | Model prediction |
|---|---|---|---|---|---|
| Parenteral (IV) | Tsai 1998[7] | 24 h | 28 days | 100% | Concordant |
| Tsai 1998 | 24 h | 10 days | 50% | Concordant | |
| Tsai 1998 | 24 h | 3 days | 0% | Concordant | |
| Tsai 1998 | 48 h | 28 days | 50% | Concordant | |
| Emau 2006 [16] | 24 h | 28 days | 100% | Concordant | |
| Mucosal (vaginal) | Otten 2000[8] | 12 h | 28 days | 100% | Concordant |
| Otten 2000 | 36 h | 28 days | 100% | Concordant | |
| Otten 2000 | 72 h | 28 days | 50% | Concordant |
Route compression concordance: complete protection extends through 24 h (parenteral) vs. 36 h (mucosal), declining to 50% at 48 h vs. 72 h respectively (≈1.5–2-fold observed ratio vs. ≈3-fold predicted by ODE kinetics; difference explained by sample size –4 per NHP group).
Table 2.
Stochastic efficacy metrics by VL distribution at key time points.
| Distribution | 24 h mean | 36 h mean | 48 h | 48 h P(futile) | 72 h P(futile) | Peak CI (time) |
|---|---|---|---|---|---|---|
| PWID untreated | 65.5% | 44.6% | 100% | 9.1% | 91.8% | 39.7 pp (49 h) |
| PWID mixed Tx | 75.4% | 52.8% | 100% | 3.1% | 56.5% | 40.1 pp (54 h) |
| General community | 71.2% | 49.2% | 100% | 3.5% | 76.0% | 39.8 pp (54 h) |
| Acute-enriched | 61.2% | 41.3% | 100% | 13.8% | 98.8% | 37.4 pp (49 h) |
P(futile) . CI = peak 95% credible interval width in percentage points (pp). probability that efficacy falls below majority protection. At 48 h, across all distributions regardless of VL profile.
Table 3.
Population-level PEP efficacy bound sensitivity to access fraction within parenteral window (Equation 4, , ).
Table 3.
Population-level PEP efficacy bound sensitivity to access fraction within parenteral window (Equation 4, , ).
| Interpretation | upper bound | |
|---|---|---|
| 1% | Severe structural barriers | |
| 2% | Base case (log-normal, median 72 h) | |
| 5% | Moderate barrier reduction | |
| 10% | Substantial barrier reduction | |
| 20% | Aggressive rapid-access programs |
Bound is distribution-free: it holds for any satisfying the stated fraction. Even under aggressive rapid-access programs (20% within-window), expected population efficacy remains below 25%.
Disclaimer/Publisher’s Note: The statements, opinions and data contained in all publications are solely those of the individual author(s) and contributor(s) and not of MDPI and/or the editor(s). MDPI and/or the editor(s) disclaim responsibility for any injury to people or property resulting from any ideas, methods, instructions or products referred to in the content. |
© 2026 by the authors. Licensee MDPI, Basel, Switzerland. This article is an open access article distributed under the terms and conditions of the Creative Commons Attribution (CC BY) license (http://creativecommons.org/licenses/by/4.0/).
Copyright: This open access article is published under a Creative Commons CC BY 4.0 license, which permit the free download, distribution, and reuse, provided that the author and preprint are cited in any reuse.


