
Submitted:
12 January 2026
Posted:
14 January 2026
You are already at the latest version
Abstract
Background: Engagement of the NF-κB signaling pathway is crucial for controlling im-mune and inflammatory gene expression within the central nervous system (CNS). Naringenin, a flavonoid derived from citrus fruits, is known for its anti-inflammatory and antioxidant effects; however, its impact on LPS-induced neuroinflammation in HMC3 (human microglial) and SH-SY5Y (neuronal) cell lines has not been thoroughly studied. Objectives: To ascertain the neuroprotective role of Naringenin on LPS-induced neuroin-flammation in microglia and neuronal cell lines with focus on modulation of NF-κB sig-naling pathway. Methods: LPS treatment was given to HMC3 cells to induce an inflam-matory response and secretome of HMC3 cells to SH-SY5Y cells with the administration of Naringenin. The cell viability assay, ROS levels, Western blotting, immunocytochemis-try were employed to quantify and localize NF-κB and pro-inflammatory cytokines (TNF-α, IL-6, IL-1β). Nuclear and cytosolic fractions of NF-κB were analyzed to screen its activation and translocation. Results: Naringenin treatment led to a dose-dependent de-crease in LPS-induced reactive oxygen species (ROS) production. It significantly reduced the expression of pro-inflammatory cytokines and inhibited NF-κB activation in HMC3 cells. The nuclear translocation of NF-κB was notably diminished after treatment, as demonstrated by both western blot and immunocytochemistry. These results suggest that Naringenin exerts an anti-inflammatory effect by suppressing the NF-κB signaling path-way. Conclusion: The findings suggest the potential therapeutic role of Naringenin using in vitro models in mitigating neuroinflammation through modulation of NF-κB signaling pathway.
Keywords:
proinflammatory cytokines
; NF-κB signaling
; cell culture
; reactive oxygen species
; phytocompounds
; neuroinflammation
1. Introduction
The neurodegenerative diseases are characterized by neuronal loss and diminished cognition, representing a global health concern with socioeconomic impact. The precise molecular mechanism underlying such conditions, despite extensive research, remains poorly understood, and effective disease-modifying therapies are still limited. Accumulating evidence suggests neuroinflammation and oxidative stress as central processes in the pathogenesis and progression of neurodegenerative disorders. The stimulation of the CNS innate immune system, especially microglial cells, is now recognized as a crucial factor in the genesis of neuronal dysfunction and death. This activation can be triggered by pathological stimuli such as infection, trauma, or the buildup of misfolded proteins. While microglial activation initially serves a protective role by releasing reactive oxygen species and proinflammatory cytokines, prolonged or dysregulated activation can become harmful (1). Chronic microglial activation is widely recognized to cause neuronal damage and accelerate the progression of neurological diseases. NF-κB, a transcription factor, is the central mediator of microglial activation and neuroinflammatory signaling. It regulates the expression of several genes involved in immune and inflammatory response, cell proliferation and cell survival (2). NF-κB under resting conditions remains in the cytoplasm in an inactive state, bound by an inhibitory protein termed IκBs. The translocation of NF-κB usually takes place upon stimulation of pro-inflammatory signals such as LPS, which degrades or phosphorylates the IκB. The binding of NF-κB with the recognition site of DNA initiates transcription of target genes like tumor necrosis factor-alpha (TNF-α), interleukin-6 (IL-6), and interleukin-1 beta (IL-1β) within microglial cells, contributing to neurotoxicity combined with oxidative stress (3).
LPS component of the outer membrane of Gram-negative bacteria is remarkable in the induction of neuroinflammation in both in vitro and in vivo models. The action of LPS is documented in literature as it binds with toll-like receptors on microglia, ultimately signaling for NF-κB release and translocation, which initiates the release of pro-inflammatory mediators. This model finds its applicability in testifying to the efficacy of any product under question.
Naringenin (4′,5,7-trihydroxyflavanone-7-rhamnoglucoside), a flavonoid abundant in citrus fruits, has been proven against inflammation, carcinogenesis, oxidative stress, etc. The effect of naringenin has not been tested in LPS-stimulated HMC-3 and SHSY cell lines, and the mechanistic ways of its neuroprotection are not well understood. In this study, we aimed to investigate the effect of Naringenin against LPS-induced neuroinflammation using human microglial (HMC-3) and SHSY5Y cell lines. By treatment of HMC3 cells with LPS to induce an inflammatory phenotype and subsequently exposing SH-SY5Y nerve cells to conditioned media extracted from LPS-treated microglial cells, we focused on elucidating the action of Naringenin on the production of an inflammatory microenvironment, ROS generation, and the action of the NF-κB signaling pathway(4). These observations provide new insights into the mechanism by which Naringenin may confer neuroprotection and support its potential as a therapeutic agent for the prevention or treatment of neuroinflammatory and neurodegenerative disorders.
2. Materials and Methods
2.1. Material: Naringenin was procured from Sigma-Aldrich, and a stock solution of (250mM) was formulated by dissolving it in DMSO, stored at -20°C. Modified Dulbecco’s Eagle’s medium (DMEM F12) was acquired from Thermofisher Scientific and stored at 4°C. The ROS staining dye DCFDA and 3-(4,5-dimethylthiazol-2-yl)-2,5-diphenyltetrazolium bromide (MTT) were acquired from Sigma. The fluorescent dyes 2′,7′-dichlorodihydrofluorescein diacetate (H2DCF-DA) were obtained from Invitrogen. 4′,6-diamino-2′-phenylindoledihydrochloride (DAPI) and protease inhibitor were sourced from Thermofisher Scientific. Antibodies against Rabbit anti-IL6-2, anti-TNF alpha, rabbit anti-IL1beta, anti-beta actin, rabbit anti-Gapdh, and Horseradish peroxidase-linked IgG antibodies were acquired from Cell Signaling Technology Inc. (Danvers, MA, USA). All other chemicals used were of high grade and commercially available.
2.2. Cell culture: Human microglial cells HMC3 were procured from ATCC (American Tissue Culture Collection, Manassas, United States). Initially, the cells were cultivated in EMEM medium maintained in an incubator under a humidified atmosphere of 95% air and 5% CO2 with 1% penicillin/streptomycin in a petri dish. Media changes occurred every two days with a DPBS wash until cells reached 80% confluence. Subsequently, cells were trypsinized with 0.25% trypsin-EDTA, followed by centrifugation, sediment collection, and subculturing at a density of 1×10^4 cells/well and 2×10 ^5 cells/well on 96- and 6-well plates, respectively (Coaster, United States). Plates were initially treated with poly D-Lysine (ThermoFisher Scientific) for 3 hours to facilitate proper cell adhesion. The subsequently selected media consisted of Dulbecco's Modified Eagle Medium (DMEM/F12), Horse serum 10%, and FBS 5%.Modified Eagle Medium (DMEM/F12), Horse serum 10% and FBS 5%. SH-SY5Y cells (undifferentiated) were cultured on Eagle’s Minimum Essential Medium (EMEM) with FBS and 1% streptomycin/penicillin in an incubator with a humidified atmosphere containing 95% air and 5% CO2 in a petri dish. The cells were subjected to media change every two days with a DPBS wash until they reached 80% confluence. These cells were used for cell viability assays and ROS staining.
2.3. MTT Assay: This assay is based on the enzymatic reduction of the MTT dye, 3-(4,5-dimethylthiazol-2-yl)-2,5-diphenyltetrazolium bromide, which produces a measurable absorbance that correlates directly with the number of viable cells, as described previously. (5) The HMC3 cells were subjected to varying concentrations of Naringenin (25, 50, 100, 200, 300, 400 & 500 µM) dissolved in DMSO for 24 h in 100 µl of media. Re-incubation of 3h was done after adding 10 µl of MTT dye till the development of formazan blue crystals. Afterward, the media was removed and 100 µl of DMSO was added for 10 min at 370 °C to dissolve the formazan crystals. The absorbance was measured at 550 nm using a microplate (ELISA) reader (6).
2.4. Preparation of LPS: Lyophilized lipopolysaccharide (LPS) derived from E. coli, strain O111:B4, was obtained from Sigma. One milligram of LPS was dissolved in 1 mL of sterile, cell culture-grade distilled water (ThermoFisher), dispensed in aliquots, and stored at -20°C until further use.
2.5. Cell Viability Assay: This assay facilitates convenient testing using Dojindo's highly water-soluble tetrazolium salt, WST-8 {2-(2-methoxy-4-nitrophenyl)-3-(4-nitrophenyl)-3-(4-nitrophenyl)-5-(2,4-disulfophenyl)-2H-tetrazolium, monosodium salt}, which generates soluble formazan dye upon reducing under the influence of an electron mediator (7). This assay was performed using CCK-8 Kit (Dajinoo Laboratories). HMC3 cells were seeded in 6-well plates, divided into two groups: control receiving no treatment, and the LPS group to which 100ng/ml LPS was added and allowed to stand for 24h in a CO2 incubator. The media of HMC3 cells were collected and added to SH-SY5Y cells using 96 plate wells along with treatments of Naringenin @ 15, 20, 25 and 30µM in different groups. The cells were cultured for 24h and subjected to the addition of 10 µl of the Cell Counting Kit-8 (CCK-8) solution to each well of the plate. The plate was incubated for 1 to 4 hours, and absorbance was repeatedly measured at 450 nm using a microplate reader.
2.6. H2DCFDA- ROS staining: H2DCFDA- ROS levels were estimated by using the standard protocol (8). HMC3 cells were plated in 6-well plates and allocated into two experimental groups: the untreated control group and the LPS group exposed to 100ng/ml LPS, subsequently incubated for 24 hours in a CO2 incubator. Culture media from the HMC3 cells were collected and transferred to SH-SY5Y cells in 96-well plates, along with treatments of Naringenin at concentrations of 15, 20, 25, and 30µM to different groups. Subsequently, cells were cultured for an additional 24 hours on conditioned media containing the secretome. Following this incubation, the cells were stained with 20 μM DCFDA (2′,7′-dichlorodihydrofluorescein diacetate) from the DCFDA Assay Kit (Abcam, Waltham, MA, USA) for 30 minutes at 37 °C in the dark. Fluorescence intensity was assessed using flow cytometry (Ex = 485; Em = 535 nm) using a FITC signal detector (FL1) as per the manufacturer's instructions. The changes in fluorescence intensity were observed under a fluorescent microscope.
2.7. Western blotting analysis: HMC3 cells were initially seeded in EMEM medium with 10% FBS and 1% penicillin/streptomycin in the incubator with humidified atmosphere containing 95% air and 5% CO2 in a petri dish grown for 5 days, washed with 1x PBS. The trial was conducted at various time points as biological triplicates. The plates were kept in a CO2 incubator (5%CO2) until 60-70% confluency was achieved. The media was discarded from each well before treatment. The 6-well plates (each group set as triplicate) were subjected to different groups: Control receiving DMSO (0.5%); LPS received LPS at 100 ng/mL; Naringenin 100 µM dissolved in DMEM HS media. The plates were incubated in a CO2 incubator for 24hours. The plates were taken out of incubator and media collected from each well was placed in labeled tubes separately and stored for further evaluation.
Ice-cold lysis buffer (20 mM Tris, pH 8.0; 137 mM NaCl; 1% NP-40; 10% glycerol) containing protease inhibitors was used to prepare the cell lysates. (1 mM phenylmethyl sulfonyl fluoride (PMSF), 10 μg/ml aprotinin, 10 μg/ml leupeptin), and 3 mM Na3VO4. Following centrifugation for clearance, protein concentration was determined using the Bradford assay (Bio-Rad; Hercules, CA, USA). A quantity of 25 μg of total protein was obtained using SDS-polyacrylamide gel electrophoresis (SDS-PAGE) with gel concentration of 10–12% and then transferred into a polyvinylidene difluoride (PVDF) membrane. Following a 30-minute block with blocking buffer (composed of 5% BSA, PBS, 0.05% Tween-20), the membranes were left to incubate overnight at 4 °C with primary antibodies obtained from Cell Signaling Technology, MA USA): anti-NF-κB(1:1000), anti-IL-6 (1:1000), anti-IL-1β (1:1000), anti-TNF-α (1:1000), GAPDH and β-actin (1:5000). Subsequently, secondary antibodies, including anti-rabbit and anti-mouse HRP IgG (1:5000), were applied. β-actin and GAPDH (both diluted 1:3000, Cell Signaling Technology) were used as loading control.
2.8. Nuclear Cytosolic Fraction of NF-κB was collected by running a similar fresh experiment on HMC3 cells, and the cell lysates were prepared in ice-cold buffer A (composed of 20 mM Hepes, 10 mM KCl, 2Mm MgCl2, 0.5% Nonidet P40, and 1 mM Na3VO4) with PIC. The cell scrapings were transferred to 1.5mL microfuge tubes, followed by centrifugation at 1500 x g for 5 min. The supernatant was centrifuged in a cooling centrifuge, and the resultant supernatant was stored as a cytosolic fraction. The nuclear pellet underwent three washes with lysis buffer A before adding to same buffer supplemented with 0.5 M NaCl to facilitate nuclear protein extraction. The sample was vortexed 4 to 5 times at 10-minute intervals, then centrifuged at 1500 × g for 10 minutes. The collected supernatants constituted a nuclear fraction containing NF-κB.
2.9. Immunocytochemistry: Immunocytochemistry was performed following standardized protocols. HMC-3 cells were maintained in EMEM supplemented with 10% fetal bovine serum (FBS) and 1% Penicillin-Streptomycin (PenStrep), seeded onto poly-D-lysine (PDL)-coated coverslips in a 24-well plate, and incubated for 24 hours or until reaching the desired confluency. The cells were then treated with various combinations of lipopolysaccharide (LPS) and Naringenin for an additional 24 hours. Following treatment, the cells were gently washed with 1X phosphate-buffered saline (PBS, pH 7.4), fixed with 4% paraformaldehyde, and subsequently permeabilized with 0.25% Triton X-100. To prevent nonspecific antibody binding, cells were blocked for 30 minutes using a solution of 1% bovine serum albumin (BSA) and 22.52 mg/mL glycine in PBST (PBS supplemented with 0.1% Tween 20) in the incubator. After the blocking step, the cells were incubated overnight at 4°C with gentle agitation in rabbit anti-NFκB primary antibody (1:250; Cell Signaling Technology, Danvers, MA, USA). This was followed by 1 hr incubation and treatment with an Alexa Fluor® 488-conjugated secondary antibody—anti-rabbit IgG (H+L), F(ab')2 fragment (1:1000; Cell Signaling Technology) the next day. Following three 5-minute washes with PBS, the coverslips were mounted onto glass slides using Fluoromount-G™ mounting medium containing DAPI (Invitrogen™), and the edges were sealed. Fluorescence images were then captured at 40X magnification using a fluorescence microscope.
2.10. Statistical analysis: Prism6 software (GraphPad Software) was utilized for statistical analyses. The data underwent analysis through one-way analysis of variance (one-way ANOVA) followed by post-test Bonferroni for multiple comparisons. Mean values ± standard error of the mean are presented, and significant differences are denoted as *, **, and ***, **** corresponding to P < 0.05, P < 0.01, P < 0.001, P < 0.0001, respectively.
3. Results
3.1. Cytotoxicity Effect of Naringenin and Morin on HMC3 Cells
As shown in Figure 1, the MTT assay demonstrates a decrease in cell proliferation of HMC3 cell lines in this experiment using concentrations of Naringenin ranging between 25 and 500 µM. The estimated IC 50 for HMC 3 cells was found to be 485 ± 8µM after 24h of treatment. Safe concentrations of not more than 150 µM were selected based on the MTT assay for HMC3 cells.
3.2. Cell Viability Assay
The impact of different concentrations of Naringenin (15 µM, 20 µM, 25 µM, and 30 µM) on SH-SY5Y cells treated with conditioned media (enriched with the secretome), which was extracted from HMC3 cells upon treatment with LPS for 24 hours, was investigated. A significant reduction in cell viability was observed between control and LPS group. However, all doses of Naringenin demonstrated ineffectiveness in reducing cell viability, resulting in a significant difference between the LPS and treatment groups. (Figure 2).
3.3. Naringenin Reduced the LPS-Initiated ROS Production
The generation of ROS, as determined by using the fluorogenic probe 2′, 7′-dichlorodihydrofluorescein, revealed the lipopolysaccharide (LPS)-initiated reactive oxygen species (ROS) generation in the LPS group. There was a notable decrease in ROS production triggered by lipopolysaccharide (LPS) by the inclusion of Naringenin. The effect of various concentrations of Naringenin (15µM, 20 µM, 25 µM, and 30 µM) on SH-SY5Y cells treated for 24h with the conditioned media extracted from LPS-treated HMC3 cells, revealed a dose-dependent notable decrease of ROS production triggered by lipopolysaccharide (Figure 3).
3.4. Effect of Naringenin on the Level of Proinflammatory Cytokines and NF-κB Activity
The proinflammatory cytokines TNF-α, IL-1β, IL-6 and transcription factor NF-κB are the basic markers of neuroinflammatory response. Their quantification and levels showed a significant increase in LPS-treated group (Figure 4). Our results demonstrate the anti-inflammatory role of Naringenin given at 100 µM to HMC3 cells by significantly decreasing the activity of TNF-α (P < 0.001), IL-6 (P < 0.1), IL-1β (P < 0.01) and transcription factor NF-κB (P < 0.001) compared to control (Figure 4).
3.5. Effect of Naringenin on Nuclear Fraction of NF-κB Activity
The transcription factor NF-κB, a contributing factor of inflammation, is expressed in the nucleus upon activation. Our study involved the detection of NF-κB in the nuclear fraction, which increased significantly in the LPS-treated groups of HMC3 cell lines. Administration of Naringenin to the LPS-treated cells significantly inhibited NF-κB levels at doses of 100 µM (P < 0.1) and 150 µM (P < 0.1) (Figure 5).
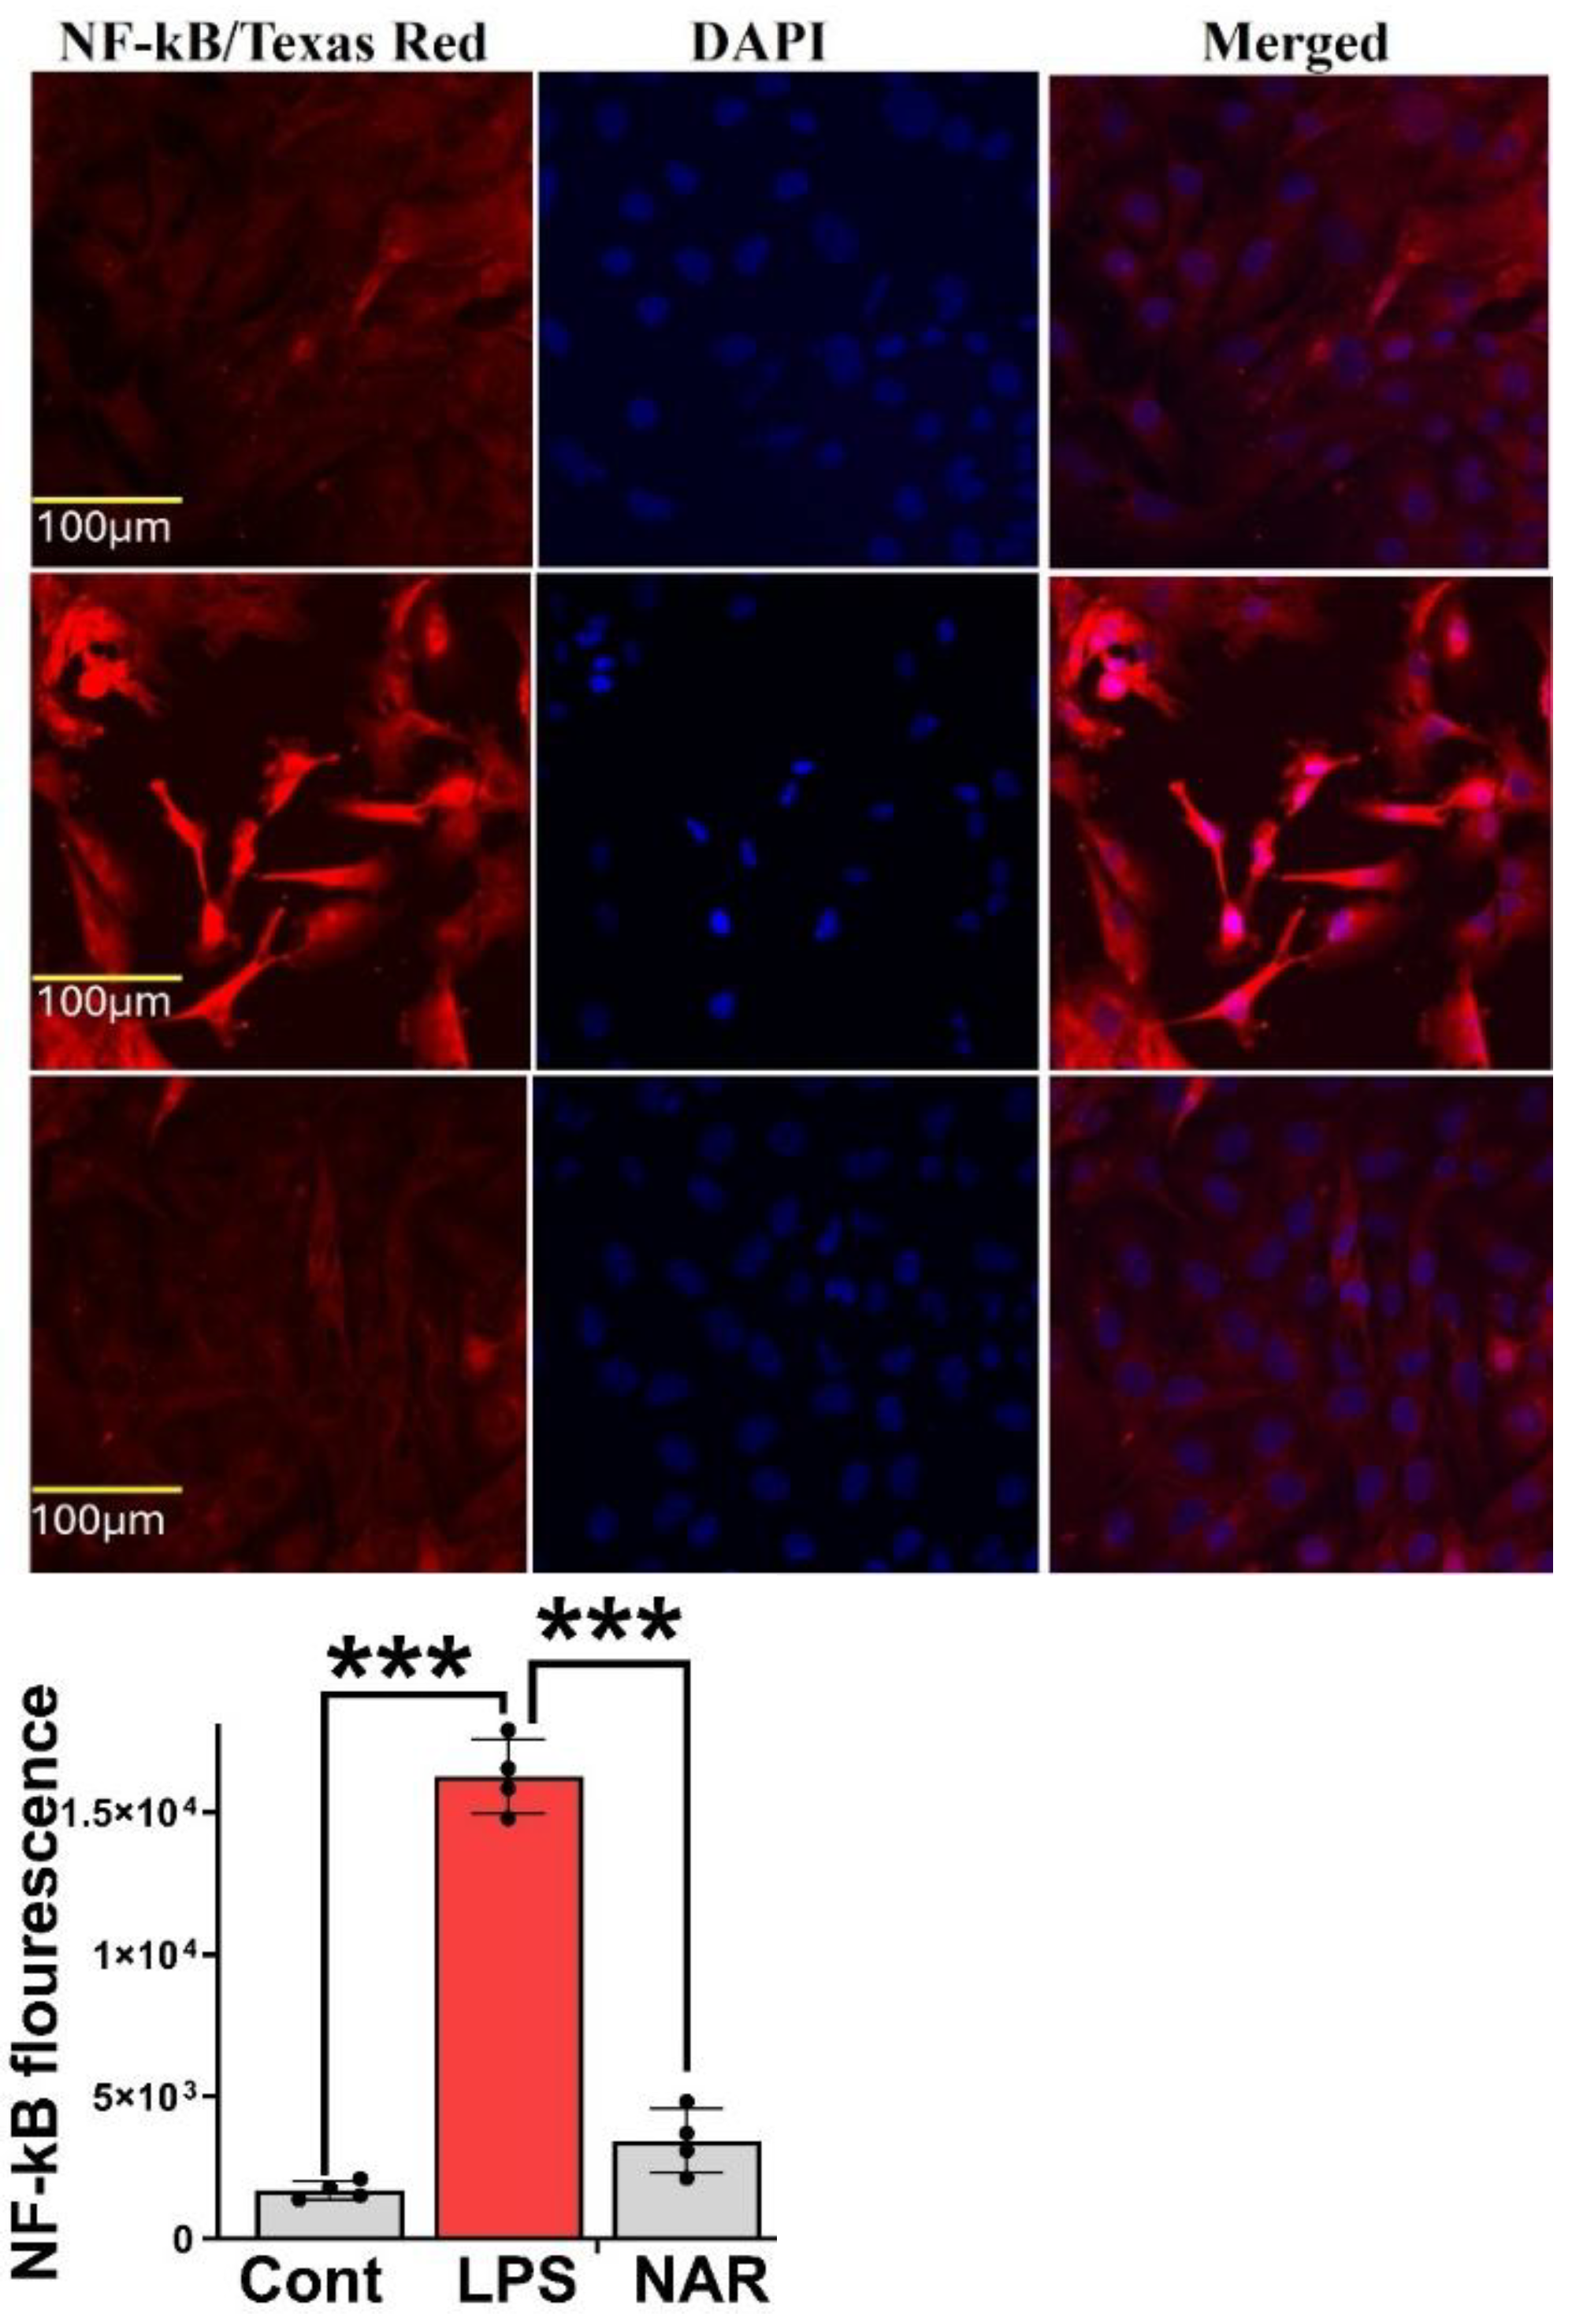
3.6. Immunocytochemistry Revealed Inhibition of LPS-Induced NF-κB Overexpression
Immunocytochemistry was performed on HMC-3 cells subjected to the following treatment conditions: (1) Control, (2) LPS (100 ng/mL), (3) LPS (100 ng/mL) + Naringenin (100 μM), and (4) LPS (100 ng/mL) + Naringenin (150 μM). After 24 hours of treatment, cells were stained with an NF-κB antibody conjugated to FITC (green fluorescence) and counterstained with DAPI (blue) for nuclear visualization. The LPS-treated group exhibited a marked increase in green fluorescence intensity, indicative of elevated NF-κB expression compared with the control group. Conversely, cells co-treated with Naringenin demonstrated a reduction in NF-κB fluorescence, with a more pronounced effect observed at the higher concentration of 150 μM. These findings indicate that Naringenin effectively suppresses LPS-induced NF-κB activation in HMC-3 microglial cells in a dose-dependent manner (Figure 6).
4. Discussion
Oxidative stress and neuroinflammation contribute to the pathogenesis of neurodegenerative disorders. Microglia, the resident brain macrophages, on one hand phagocytose non-self and debris, thereby maintaining brain homeostasis; alternatively, they exacerbate the neuronal injury in neurodegenerative diseases by contributing to chronic inflammation. Our study aimed to investigate the role of naringenin in mitigating LPS-induced neuroinflammation in HMC3 cells. Furthermore, our study involved the use of conditioned culture (LPS-treated microglial cell extract) on the nerve cells (SH-SY5Y) for understanding the action of this compound in a more homogeneous in vitro model. The results of this study demonstrated that LPS induces the production of inflammatory cytokines through activation of the NF-κB signaling pathway. In contrast, Naringenin exhibited significant anti-inflammatory and antioxidative effects by downregulating the NF-κB transcription factor. Thus, Naringenin demonstrates neuroprotective effects by mitigating microglial-related inflammatory responses and ameliorating neuronal cell death. Promoting an anti-inflammatory M2 phenotype may offer a new approach for combating neuroinflammation and enhancing neuroprotection. Neuroinflammation driven by microglia is widely acknowledged as the key mechanism leading to neuronal loss (9)(10). They function as guardians of the central nervous system (CNS), consistently surveying the environment for detrimental threats or pathogens. Distributed throughout the CNS like sentinels, they activate in response to local danger signals, adopting their cell morphology by enlarging their soma and retracting cytoplasmic processes. These activated microglia stimulate A1 subtype astrocytes, which attract neuronal damage through the release of the inflammatory cytokines such as IL-6, tumor necrosis factor α (TNF-α), and IL-1β, reactive oxygen species, and excitotoxins like glutamate via activation of nuclear factor κB (NF-κB)-dependent mechanisms. (11) On the contrary, the activation of reactive astrocytes by M2 microglia triggers the brain to produce anti-inflammatory factors through the STAT6 pathway. (12) The LPS-generated neuroinflammation in our study, through the activation of immune cells and the release of pro-inflammatory molecules via NF-κB activation, is attributed to microglial activation. Our study demonstrated a dose-dependent notable decrease of ROS production triggered by lipopolysaccharide by the administration of Naringenin. Our study is in agreement with many studies that suggested a promising effect of Naringenin against LPS-induced inflammatory and oxidative response. (13)(14)(15) There is wider evidence in support of ROS production and the resultant oxidative damage as contributing factors to incur neuronal damage. During neurodegenerative conditions, the overproduction of ROS to the level that exceeds the reductive capabilities of the intact antioxidant system is responsible for nerve cell damage and apoptosis. At cellular level, mitochondrial damage due to ROS leakage causes the dysfunction of this organelle, which could be brought about by mitochondrial fission, apoptosis and energy depletion thus resulting in the etiopathology of neurodegenerative diseases. (16)
Proinflammatory cytokines such as TNF-α, IL-1β, IL-6, along with the transcription factor NF-κB, serve as key indicators of a neuroinflammatory response. In this study, their expression levels were significantly elevated in HMC3 cells following LPS stimulation. Treatment with 100 µM Naringenin markedly reduced the expression of these inflammatory markers, demonstrating its potent anti-inflammatory effect. Specifically, Naringenin significantly downregulated TNF-α, IL-1β, and NF-κB levels, critical mediators of the inflammatory cascade, when compared to the control group.
Several studies have highlighted the pro-inflammatory role of cytokines in the pathogenesis of neuroinflammatory conditions. TNF-α, a pleiotropic proinflammatory cytokine activated by PAMPs like LPS in this study, is a key pro-inflammatory cytokine produced by microglia in response to injury, infection, or neurodegeneration. Toll-like receptors (TLRs) serve as receptor engagements on microglia that consequently initiate the signal transduction pathways. TNF-α increases the levels of IL-6, IL-1β, involved in further advancement of inflammatory reactions. (17) Targeting the cytokine trafficking and degradation would support the development of new anti-cytokine formulations. Thus, our study confirms the specificity of Naringenin to promote cytokine degradation, which may offer a new avenue for drug development in this area.
This study demonstrated that stimulation with lipopolysaccharide (LPS) resulted in a pronounced increase in nuclear NF-κB levels in HMC3 microglial cells, signifying stimulation of the inflammatory signaling cascade. However, treatment with 100 µM Naringenin significantly attenuated this LPS-induced nuclear translocation of NF-κB. As a pivotal transcription factor, NF-κB governs the inflammatory response by regulating the expression of genes that drive the production and activation of various proinflammatory mediators. The LPS as a PAMP tends to activate the HMC3 cells to produce a spectrum of cytokines and chemokines. NF-κB released in the cytoplasm is translocated to the nucleus, binds with the DNA and activates the transcription of targeted genes like IL-6, IL-1β, IL-12, TNF-α. (18) Thus, our study demonstrated Naringenin as a potent agent in amelioration of LPS-induced inflammation by acting against NF-κB, which acts as a key regulator of pro-inflammatory gene induction and functions.
5. Conclusions
The present study demonstrates that Naringenin effectively mitigates LPS-induced neuroinflammation in both HMC3 microglial and SH-SY5Y neuronal cells by downregulating the NF-κB signaling pathway. This suppression results in decreased production of proinflammatory cytokines and oxidative stress markers, highlighting Naringenin’s potential as a neuroprotective agent. The neuroprotective potential of Naringenin is established, thus suggesting its promise as a therapeutic agent for combating neuroinflammatory processes and neuronal damage associated with neurodegenerative disorders. By promoting an anti-inflammatory response and mitigating microglial activation, Naringenin offers a valuable strategy for enhancing neuroprotection and potentially slowing the progression of neurodegenerative diseases. Further research is warranted to clarify the underlying molecular mechanisms and to investigate the translational potential of these findings in preclinical and clinical settings.
Author Contributions
S M R: conceptualized, designed the study and prepared the manuscript draft. AW J: contributed to methodology, data analysis, and critical revision of the manuscript, data collection and validation. F S: assisted in data acquisition and literature review. SY: Drafting of manuscript. ZAS: provided overall guidance, supervised the work, funding acquisition, critical review, and final approval of the manuscript.
Funding
Please add: The study was supported by grants from the National Institute of Neurological Disorders and Stroke of the National Institutes of Health (#R01NS112642).
Institutional Review Board Statement
Not applicable.
Informed Consent Statement
Not applicable.
Data Availability Statement
Data can be provided upon request.
Acknowledgments
All illustrative figures and statistics in the manuscript were prepared using BioRender https://BioRender.com and GraphPad Prism version 10.6.1 (892), respectively.
Conflicts of Interest
“The authors declare no conflicts of interest.
References
- Almarghalani, D.A.; Shah, Z.A. Progress on siRNA-based gene therapy targeting secondary injury after intracerebral hemorrhage. Gene Ther. 2021, 30, 1–7. [Google Scholar] [CrossRef]
- Magid-Bernstein, J.; Girard, R.; Polster, S.; Srinath, A.; Romanos, S.; Awad, I.A.; Sansing, L.H. Cerebral hemorrhage: Pathophysiology, treatment, and future directions. Circ. Res. 2022, 130, 1204–1229. [Google Scholar] [CrossRef]
- Sun, Y.; Sun, W.; Liu, J.; Zhang, B.; Zheng, L.; Zou, W. The dual role of microglia in intracerebral hemorrhage. Behav. Brain Res. 2024, 473, 115198. [Google Scholar] [CrossRef]
- Gong, Y. Microglial Mechanisms and Therapeutic Potential in Brain Injury Post-Intracerebral Hemorrhage. Journal of Inflammation Research 2025, 2955–2973. [Google Scholar] [CrossRef] [PubMed]
- Zhu, X.; Xu, Z.; Liu, Y.; Yang, J.; Bai, L.; Li, X.; Sun, Q.; Li, H.; Chen, G. Unveiling microglia heterogeneity in intracerebral hemorrhage. Neuroscience 2024, 555, 167–177. [Google Scholar] [CrossRef]
- Ostrowska, Z.; Robaszkiewicz, K.; Moraczewska, J. Regulation of actin filament turnover by cofilin-1 and cytoplasmic tropomyosin isoforms. Biochim. et Biophys. Acta (BBA) - Proteins Proteom. 2017, 1865, 88–98. [Google Scholar] [CrossRef] [PubMed]
- Shehjar, F.; Almarghalani, D.A.; Mahajan, R.; Hasan, S.A.-M.; Shah, Z.A. The multifaceted role of cofilin in neurodegeneration and stroke: Insights into pathogenesis and targeting as a therapy. Cells 2024, 13, 188. [Google Scholar] [CrossRef] [PubMed]
- Uruk, G.; Mocanu, E.; Shaw, A.E.; Bamburg, J.R.; Swanson, R.A. Cofilactin rod formation mediates inflammation-induced neurite degeneration. Cell Rep. 2024, 43, 113914–113914. [Google Scholar] [CrossRef]
- Xing, J.; Wang, Y.; Peng, A.; Li, J.; Niu, X.; Zhang, K. The role of actin cytoskeleton CFL1 and ADF/cofilin superfamily in inflammatory response. Front. Mol. Biosci. 2024, 11, 1408287. [Google Scholar] [CrossRef]
- Almarghalani, D.A.; Sha, X.; Mrak, R.E.; Shah, Z.A. Spatiotemporal Cofilin Signaling, Microglial Activation, Neuroinflammation, and Cognitive Impairment Following Hemorrhagic Brain Injury. Cells 2023, 12, 1153. [Google Scholar] [CrossRef]
- Alhadidi, Q.; Shah, Z.A. Cofilin mediates LPS-induced microglial cell activation and associated neurotoxicity through activation of NF-κB and JAK–STAT pathway. Mol. Neurobiol. 2017, 55, 1676–1691. [Google Scholar] [CrossRef]
- Alhadidi, Q.; Nash, K.M.; Alaqel, S.; Bin Sayeed, M.S.; Shah, Z.A. Cofilin knockdown attenuates hemorrhagic brain injury-induced oxidative stress and microglial activation in mice. Neuroscience 2018, 383, 33–45. [Google Scholar] [CrossRef]
- Almarghalani, D.A.; Bahader, G.A.; Ali, M.; Tillekeratne, L.M.V.; Shah, Z.A. Cofilin inhibitor improves neurological and cognitive functions after Intracerebral Hemorrhage by suppressing endoplasmic reticulum stress related-neuroinflammation. Pharmaceuticals 2024, 17, 114. [Google Scholar] [CrossRef]
- Rust, M.B.; Gurniak, C.B.; Renner, M.; Vara, H.; Morando, L.; Görlich, A.; Sassoè-Pognetto, M.; Al Banchaabouchi, M.; Giustetto, M.; Triller, A.; et al. Learning, AMPA receptor mobility and synaptic plasticity depend on n-cofilin-mediated actin dynamics. EMBO J. 2010, 29, 1889–1902. [Google Scholar] [CrossRef] [PubMed]
- Goodson, M.; Rust, M.B.; Witke, W.; Bannerman, D.; Mott, R.; Ponting, C.P.; Flint, J. Cofilin-1: A modulator of anxiety in mice. PLOS Genet. 2012, 8, e1002970. [Google Scholar] [CrossRef]
- Wolf, M.; Zimmermann, A.-M.; Görlich, A.; Gurniak, C.B.; Sassoè-Pognetto, M.; Friauf, E.; Witke, W.; Rust, M.B. ADF/Cofilin Controls Synaptic Actin Dynamics and Regulates Synaptic Vesicle Mobilization and Exocytosis. Cereb. Cortex 2014, 25, 2863–2875. [Google Scholar] [CrossRef] [PubMed]
- Rust, M.B. Novel functions for ADF/cofilin in excitatory synapses - lessons from gene-targeted mice. Commun. Integr. Biol. 2015, 8, e1114194–e1114194. [Google Scholar] [CrossRef]
- Nakamura, T.; Xi, G.; Hua, Y.; Schallert, T.; Hoff, J.T.; Keep, R.F. Intracerebral hemorrhage in mice: Model characterization and application for genetically modified mice. J. Cereb. Blood Flow Metab. 2004, 24, 487–494. [Google Scholar] [CrossRef]
- Xie, Y.; Li, Y.-J.; Lei, B.; Kernagis, D.; Liu, W.-W.; Bennett, E.R.; Venkatraman, T.; Lascola, C.D.; Laskowitz, D.T.; Warner, D.S.; et al. Sex differences in gene and protein expression after intracerebral hemorrhage in mice. Transl. Stroke Res. 2018, 10, 231–239. [Google Scholar] [CrossRef]
- Chen, Z.; Xi, G.; Mao, Y.; Keep, R.F.; Hua, Y. Effects of progesterone and testosterone on ICH-induced brain injury in rats, in Intracerebral Hemorrhage Research: From Bench to Bedside; Springer, 2011; pp. 289–293. [Google Scholar]
- Chen, T.-Y.; Tsai, K.-L.; Lee, T.-Y.; Chiueh, C.C.; Lee, W.-S.; Hsu, C. Sex-specific role of thioredoxin in neuroprotection against iron-induced brain injury conferred by estradiol. Stroke 2010, 41, 160–165. [Google Scholar] [CrossRef] [PubMed]
- Sterenstein, A.; Garg, R. The impact of sex on epidemiology, management, and outcome of spontaneous intracerebral hemorrhage (sICH). J. Stroke Cerebrovasc. Dis. 2024, 33, 107755–107755. [Google Scholar] [CrossRef] [PubMed]
- Nash, K.M.; Schiefer, I.T.; Shah, Z.A. Development of a reactive oxygen species-sensitive nitric oxide synthase inhibitor for the treatment of ischemic stroke. Free. Radic. Biol. Med. 2018, 115, 395–404. [Google Scholar] [CrossRef]
- García-Campos, P.; Báez-Matus, X.; Jara-Gutiérrez, C.; Paz-Araos, M.; Astorga, C.; Cea, L.A.; Rodríguez, V.; Bevilacqua, J.A.; Caviedes, P.; Cárdenas, A.M. N-Acetylcysteine Reduces Skeletal Muscles Oxidative Stress and Improves Grip Strength in Dysferlin-Deficient Bla/J Mice. Int. J. Mol. Sci. 2020, 21, 4293. [Google Scholar] [CrossRef]
- Clark, W.; Gunion-Rinker, L.; Lessov, N.; Hazel, K. Citicoline treatment for experimental Intracerebral Hemorrhage in mice. Stroke 1998, 29, 2136–2140. [Google Scholar] [CrossRef]
- Bahader, G.A.; Nash, K.M.; Almarghalani, D.A.; Alhadidi, Q.; McInerney, M.F.; Shah, Z.A. Type-I diabetes aggravates post-hemorrhagic stroke cognitive impairment by augmenting oxidative stress and neuroinflammation in mice. Neurochem. Int. 2021, 149, 105151. [Google Scholar] [CrossRef]
- Deacon, R.M.J.; Rawlins, J.N.P. T-maze alternation in the rodent. Nat. Protoc. 2006, 1, 7–12. [Google Scholar] [CrossRef]
- A Bevins, R.; Besheer, J. Object recognition in rats and mice: a one-trial non-matching-to-sample learning task to study 'recognition memory'. Nat. Protoc. 2006, 1, 1306–1311. [Google Scholar] [CrossRef]
- Denninger, J.K.; Smith, B.M.; Kirby, E.D. Novel object recognition and object location behavioral testing in mice on a budget. JoVE (Journal of Visualized Experiments) 2018, e58593. [Google Scholar]
- Li, Z.; Li, M.; Shi, S.X.; Yao, N.; Cheng, X.; Guo, A.; Zhu, Z.; Zhang, X.; Liu, Q. Brain transforms natural killer cells that exacerbate brain edema after intracerebral hemorrhage. J. Exp. Med. 2020, 217. [Google Scholar] [CrossRef] [PubMed]
- Young, K.; Morrison, H. Quantifying microglia morphology from photomicrographs of immunohistochemistry prepared tissue using ImageJ. Journal of visualized experiments: JoVE 2018, 57648. [Google Scholar]
- Wang, C.; Xu, Y. Mechanisms for sex differences in energy homeostasis. J. Mol. Endocrinol. 2019, 62, R129–R143. [Google Scholar] [CrossRef]
- Benz, V.; Bloch, M.; Wardat, S.; Böhm, C.; Maurer, L.; Mahmoodzadeh, S.; Wiedmer, P.; Spranger, J.; Foryst-Ludwig, A.; Kintscher, U. Sexual dimorphic regulation of body weight dynamics and adipose tissue lipolysis. PLOS ONE 2012, 7, e37794. [Google Scholar] [CrossRef]
- Rathod, Y.D.; Di Fulvio, M. The feeding microstructure of male and female mice. PLoS ONE 2021, 16, e0246569. [Google Scholar] [CrossRef] [PubMed]
- Satoh, J.; Kino, Y.; Asahina, N.; Takitani, M.; Miyoshi, J.; Ishida, T.; Saito, Y. TMEM119 marks a subset of microglia in the human brain. Neuropathology 2015, 36, 39–49. [Google Scholar] [CrossRef] [PubMed]
- Bennett, M.L.; Bennett, F.C.; Liddelow, S.A.; Ajami, B.; Zamanian, J.L.; Fernhoff, N.B.; Mulinyawe, S.B.; Bohlen, C.J.; Adil, A.; Tucker, A.; et al. New tools for studying microglia in the mouse and human CNS. Proc. Natl. Acad. Sci. USA 2016, 113, E1738–E1746. [Google Scholar] [CrossRef]
- Ma, W.; Oswald, J.; Angulo, A.R.; Chen, Q. Tmem119 expression is downregulated in a subset of brain metastasis-associated microglia. BMC Neurosci. 2024, 25, 1–11. [Google Scholar] [CrossRef] [PubMed]
- Ruan, C.; Elyaman, W. A new understanding of TMEM119 as a marker of microglia. Front. Cell. Neurosci. 2022, 16, 902372. [Google Scholar] [CrossRef]
- Shi, X.; Bai, H.; Wang, J.; Wang, J.; Huang, L.; He, M.; Zheng, X.; Duan, Z.; Chen, D.; Zhang, J.; et al. Behavioral assessment of sensory, motor, emotion, and cognition in rodent models of intracerebral hemorrhage. Front. Neurol. 2021, 12, 667511. [Google Scholar] [CrossRef]
- Bamburg, J.R.; Minamide, L.S.; Wiggan, O.; Tahtamouni, L.H.; Kuhn, T.B. Cofilin and actin dynamics: multiple modes of regulation and their impacts in neuronal development and degeneration. Cells 2021, 10, 2726. [Google Scholar] [CrossRef]
- Liu, J. Microglial TMEM119 binds to amyloid-β to promote its clearance in an Aβ-depositing mouse model of Alzheimer’s disease. Immunity 2025. [Google Scholar] [CrossRef]
- Bedolla, A.; Wegman, E.; Weed, M.; Stevens, M.K.; Ware, K.; Paranjpe, A.; Alkhimovitch, A.; Ifergan, I.; Taranov, A.; Peter, J.D.; et al. Adult microglial TGFβ1 is required for microglia homeostasis via an autocrine mechanism to maintain cognitive function in mice. Nat. Commun. 2024, 15, 1–25. [Google Scholar] [CrossRef] [PubMed]
- Mercurio, D.; Fumagalli, S.; Schafer, M.K.-H.; Pedragosa, J.; Ngassam, L.D.C.; Wilhelmi, V.; Winterberg, S.; Planas, A.M.; Weihe, E.; De Simoni, M.-G. Protein expression of the microglial marker tmem119 decreases in association with morphological changes and location in a mouse model of traumatic brain injury. Front. Cell. Neurosci. 2022, 16, 820127. [Google Scholar] [CrossRef] [PubMed]
- Villa, A.; Vegeto, E.; Poletti, A.; Maggi, A. Estrogens, neuroinflammation, and neurodegeneration. Endocr. Rev. 2016, 37, 372–402. [Google Scholar] [CrossRef] [PubMed]
Figure 1.
The impact of different concentrations of Naringenin on the survival of normal HMC3 cells. In the experiment, cell lines underwent treatment with Naringenin at concentrations ranging from 25 to 500 µg/ml for a duration of 24 hours. Subsequently, an MTT assay was employed to measure cell viability. The reported values represent the mean ± SEM and are conveyed as a percentage relative to the untreated control samples. Statistical significance is denoted by ****P < 0.0001 and ***P < 0.001, indicating notable differences compared to the control group.
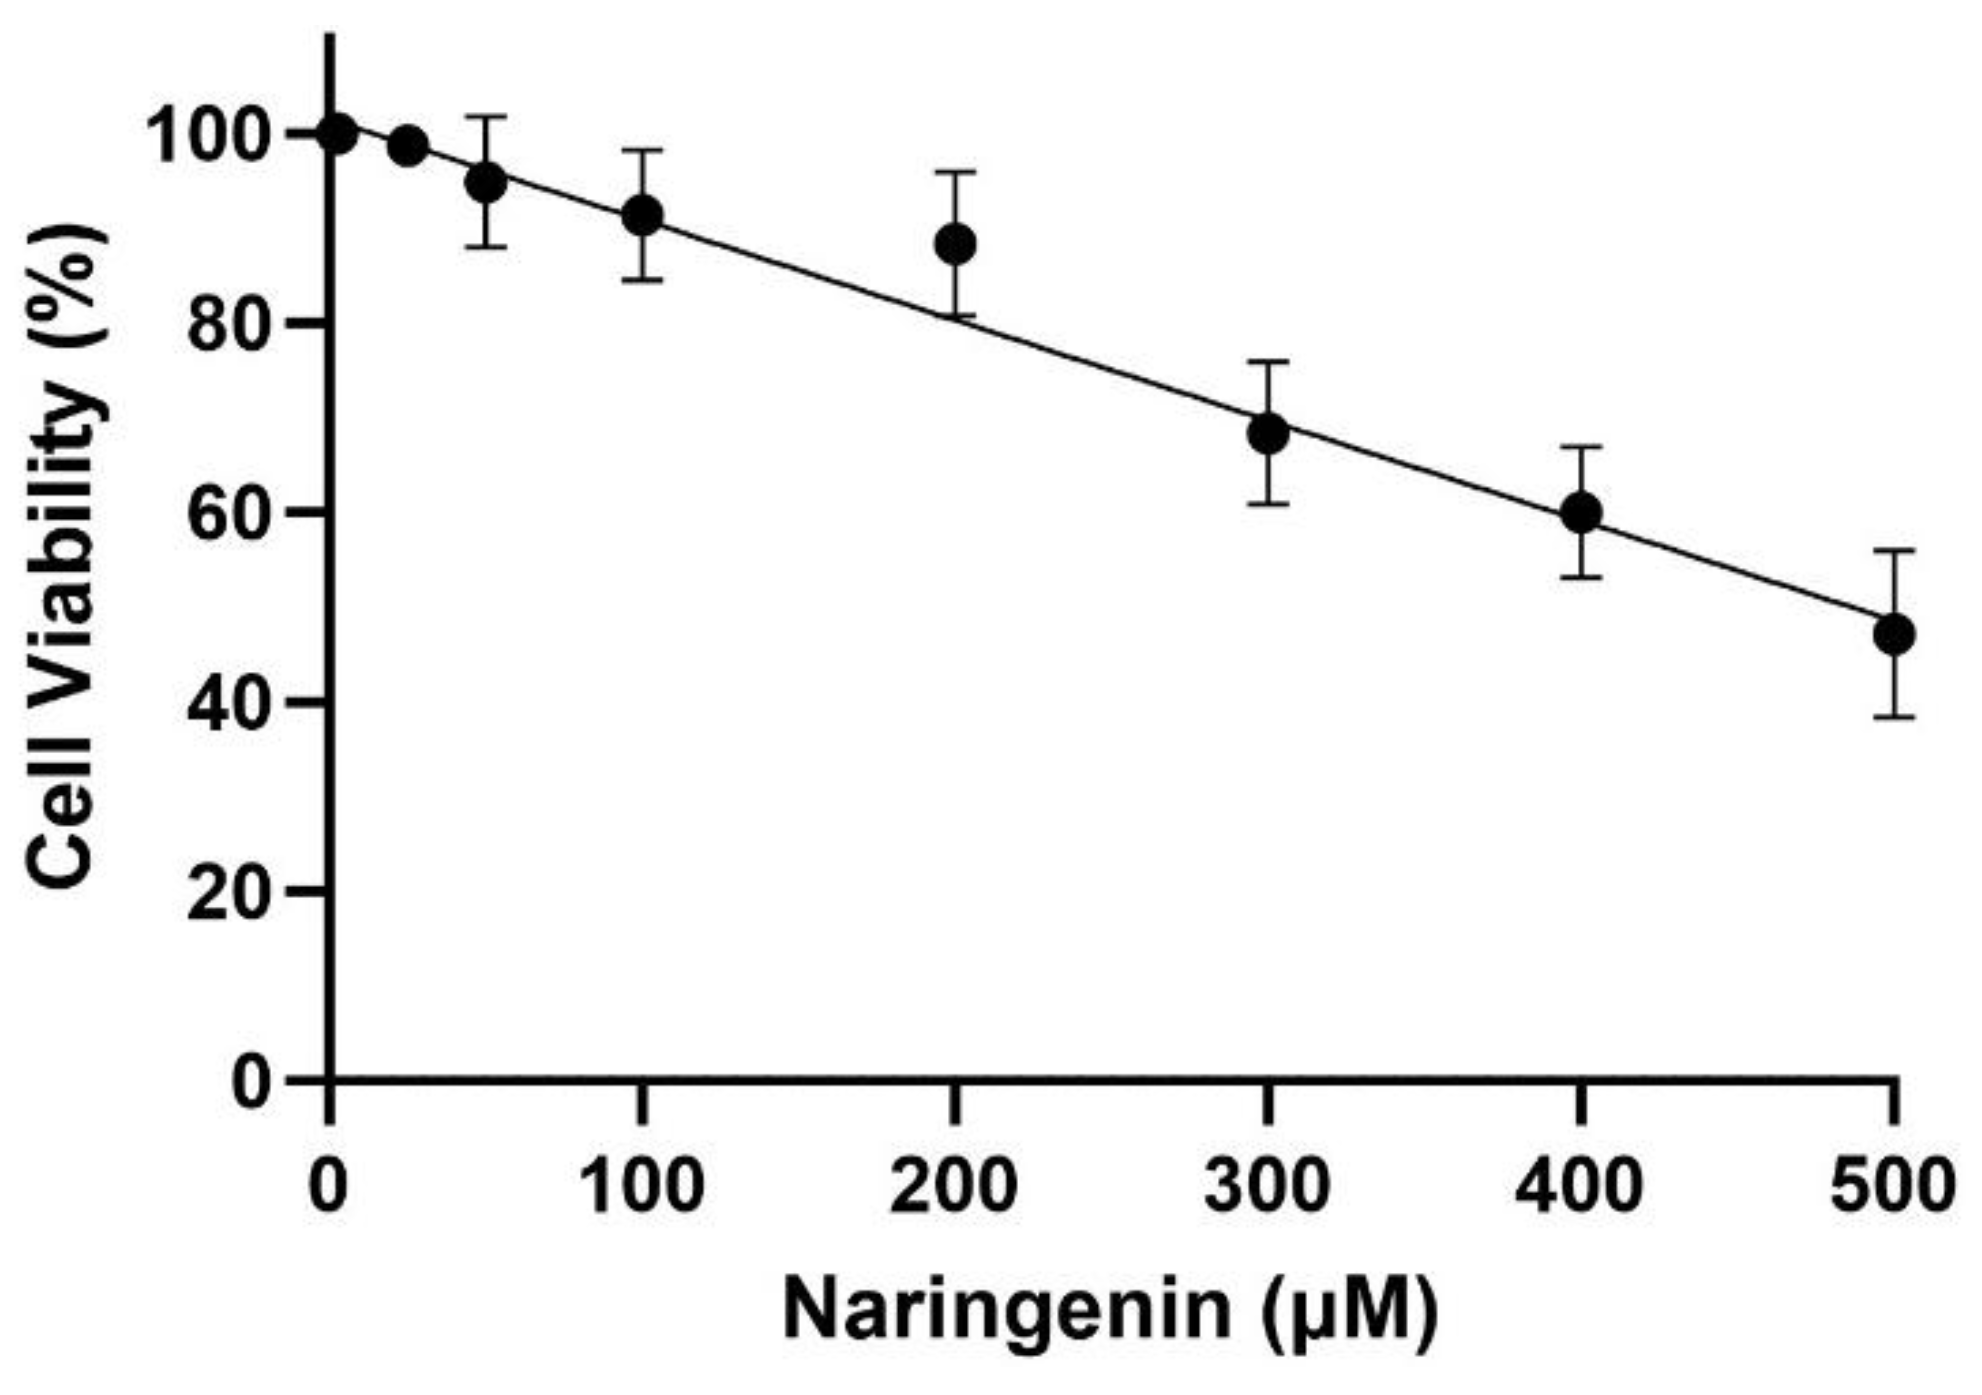
Figure 2.
The effect of various concentrations of Naringenin (15µM, 20 µM, 25 µM, and 30 µM) on SH-SY5Y cells treated for 24h with the conditioned media extracted from LPS-treated HMC3 cells. The control received DMSO only. The presented values signify the mean ± SEM and are expressed as a percentage in relation to the untreated control samples. Statistical significance is marked by ***P < 0.001 and **P < 0.01, indicating substantial differences compared to the control group.
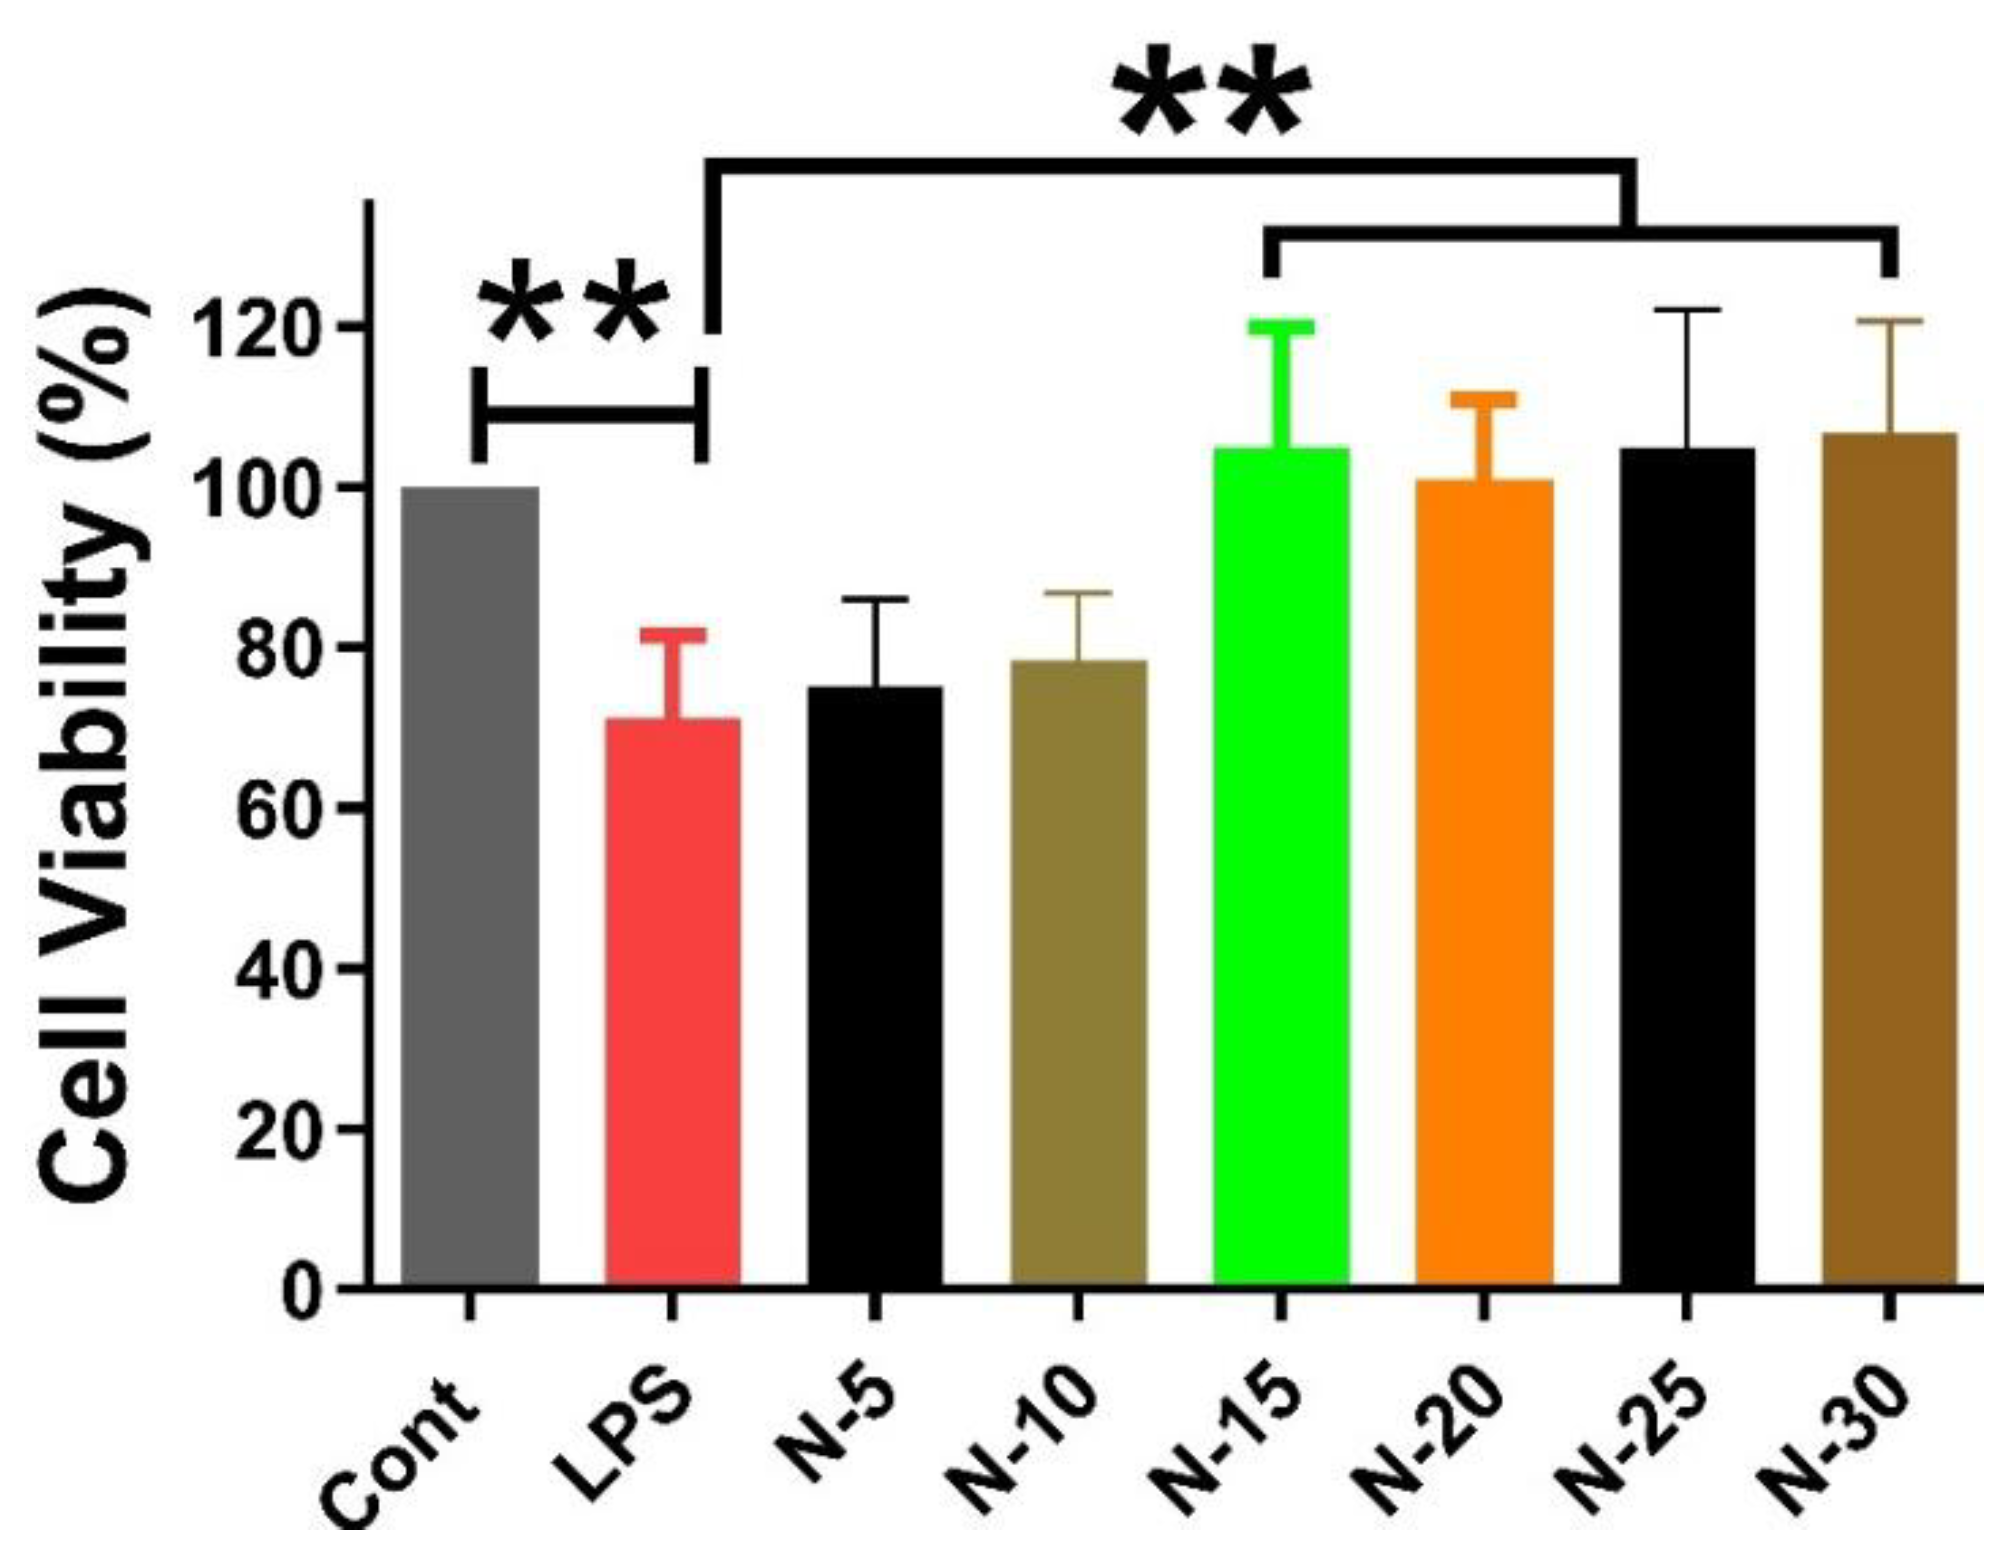
Figure 3.
Effect of different concentrations of Naringenin on ROS production of SH-SY5Y cells treated with the media extracted from LPS-treated HMC3 cells. ROS was measured by staining the cells with DCFDA cellular ROS detection assay kit according to the manufacturer’s instructions. ROS generation was observed under a fluorescence microscope at 200× magnification. Control treated with DMSO A, LPS (100 ng/mL) treated group showing excessive ROS generation B, treatment with 15 µM of Naringenin C, treatment with 20 µM of Naringenin D, treatment with 25µM of Naringenin E, and treatment with 30 µM of Naringenin F, all showing dose-dependent decrease of ROS production.
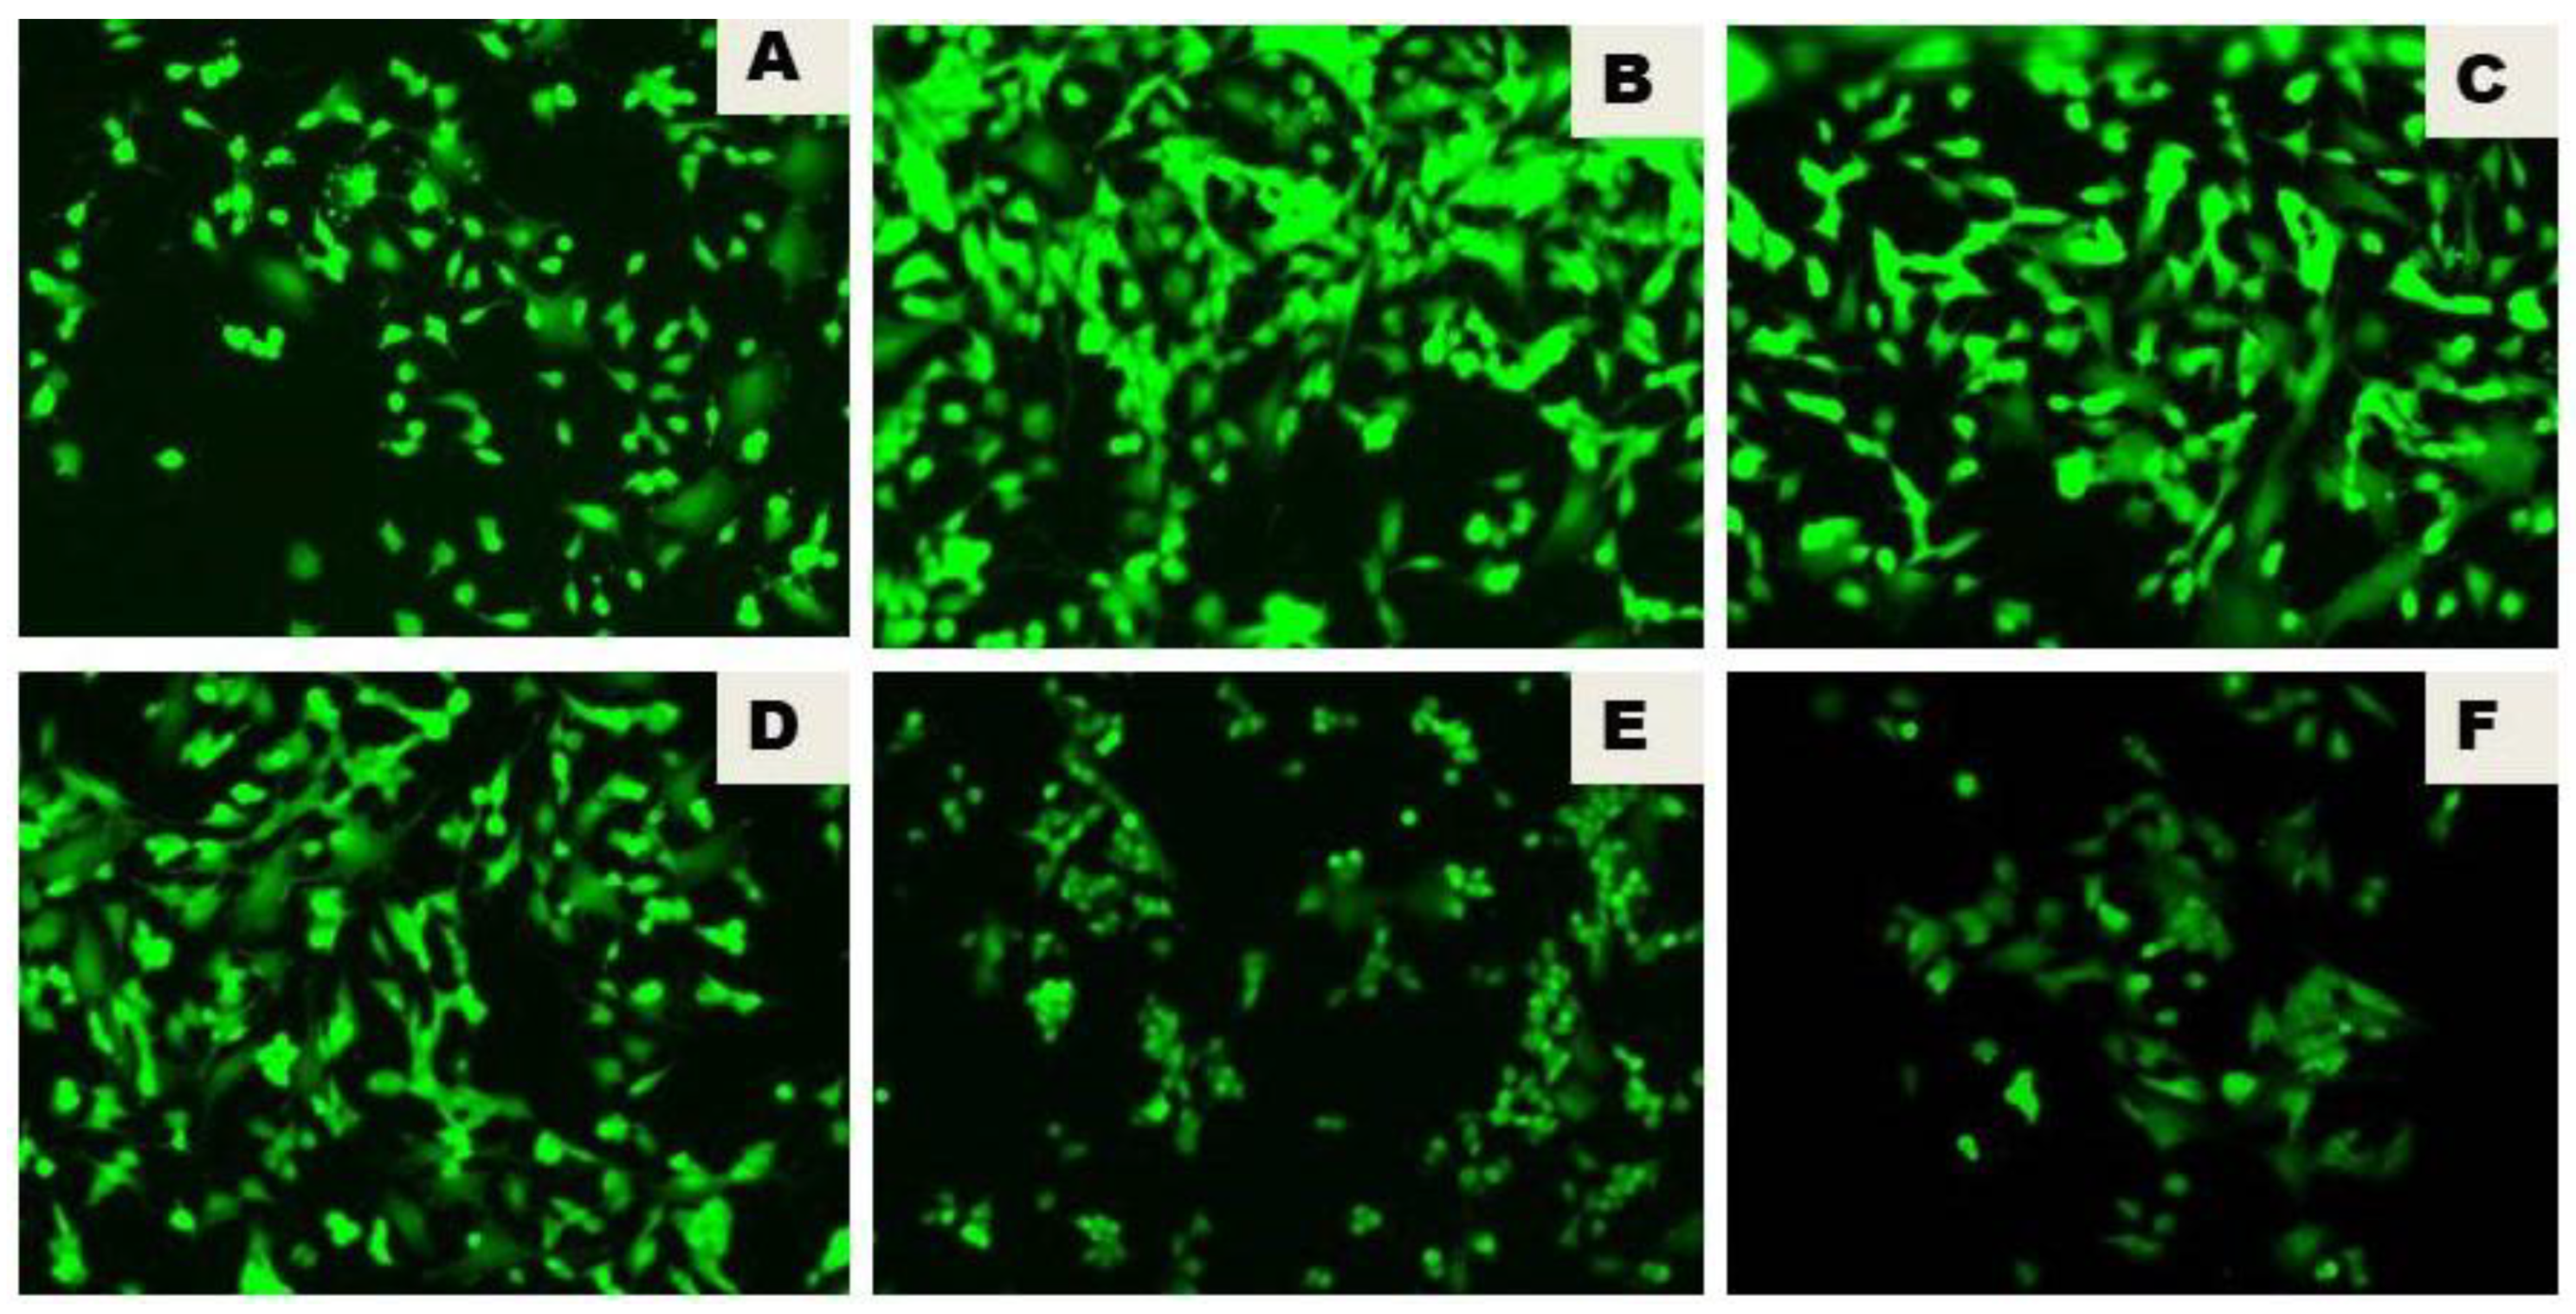
Figure 4.
Effect of Naringenin pretreatment on the expression level of NF-κB, TNF-α, IL-6 and IL-1βas measured by Western blot. Data is expressed as mean ± S.E.M of triplicates per group. Western blot analysis showed significantly (p < 0.0001, p < 0.001, p < 0.1, and p < 0.01) increased expression levels of NF-κB, TNF-α, IL-6, and IL-1β, respectively, in LPS groups. Naringenin treatment at 100 µM in LPS-treated HMC3 cells showed a significant reduction in the level of all these markers. Statistical significance is denoted by ****P < 0.0001, ***P < 0.001, **P < 0.01 and *P < 0.1, indicating noteworthy differences compared to the LPS group.
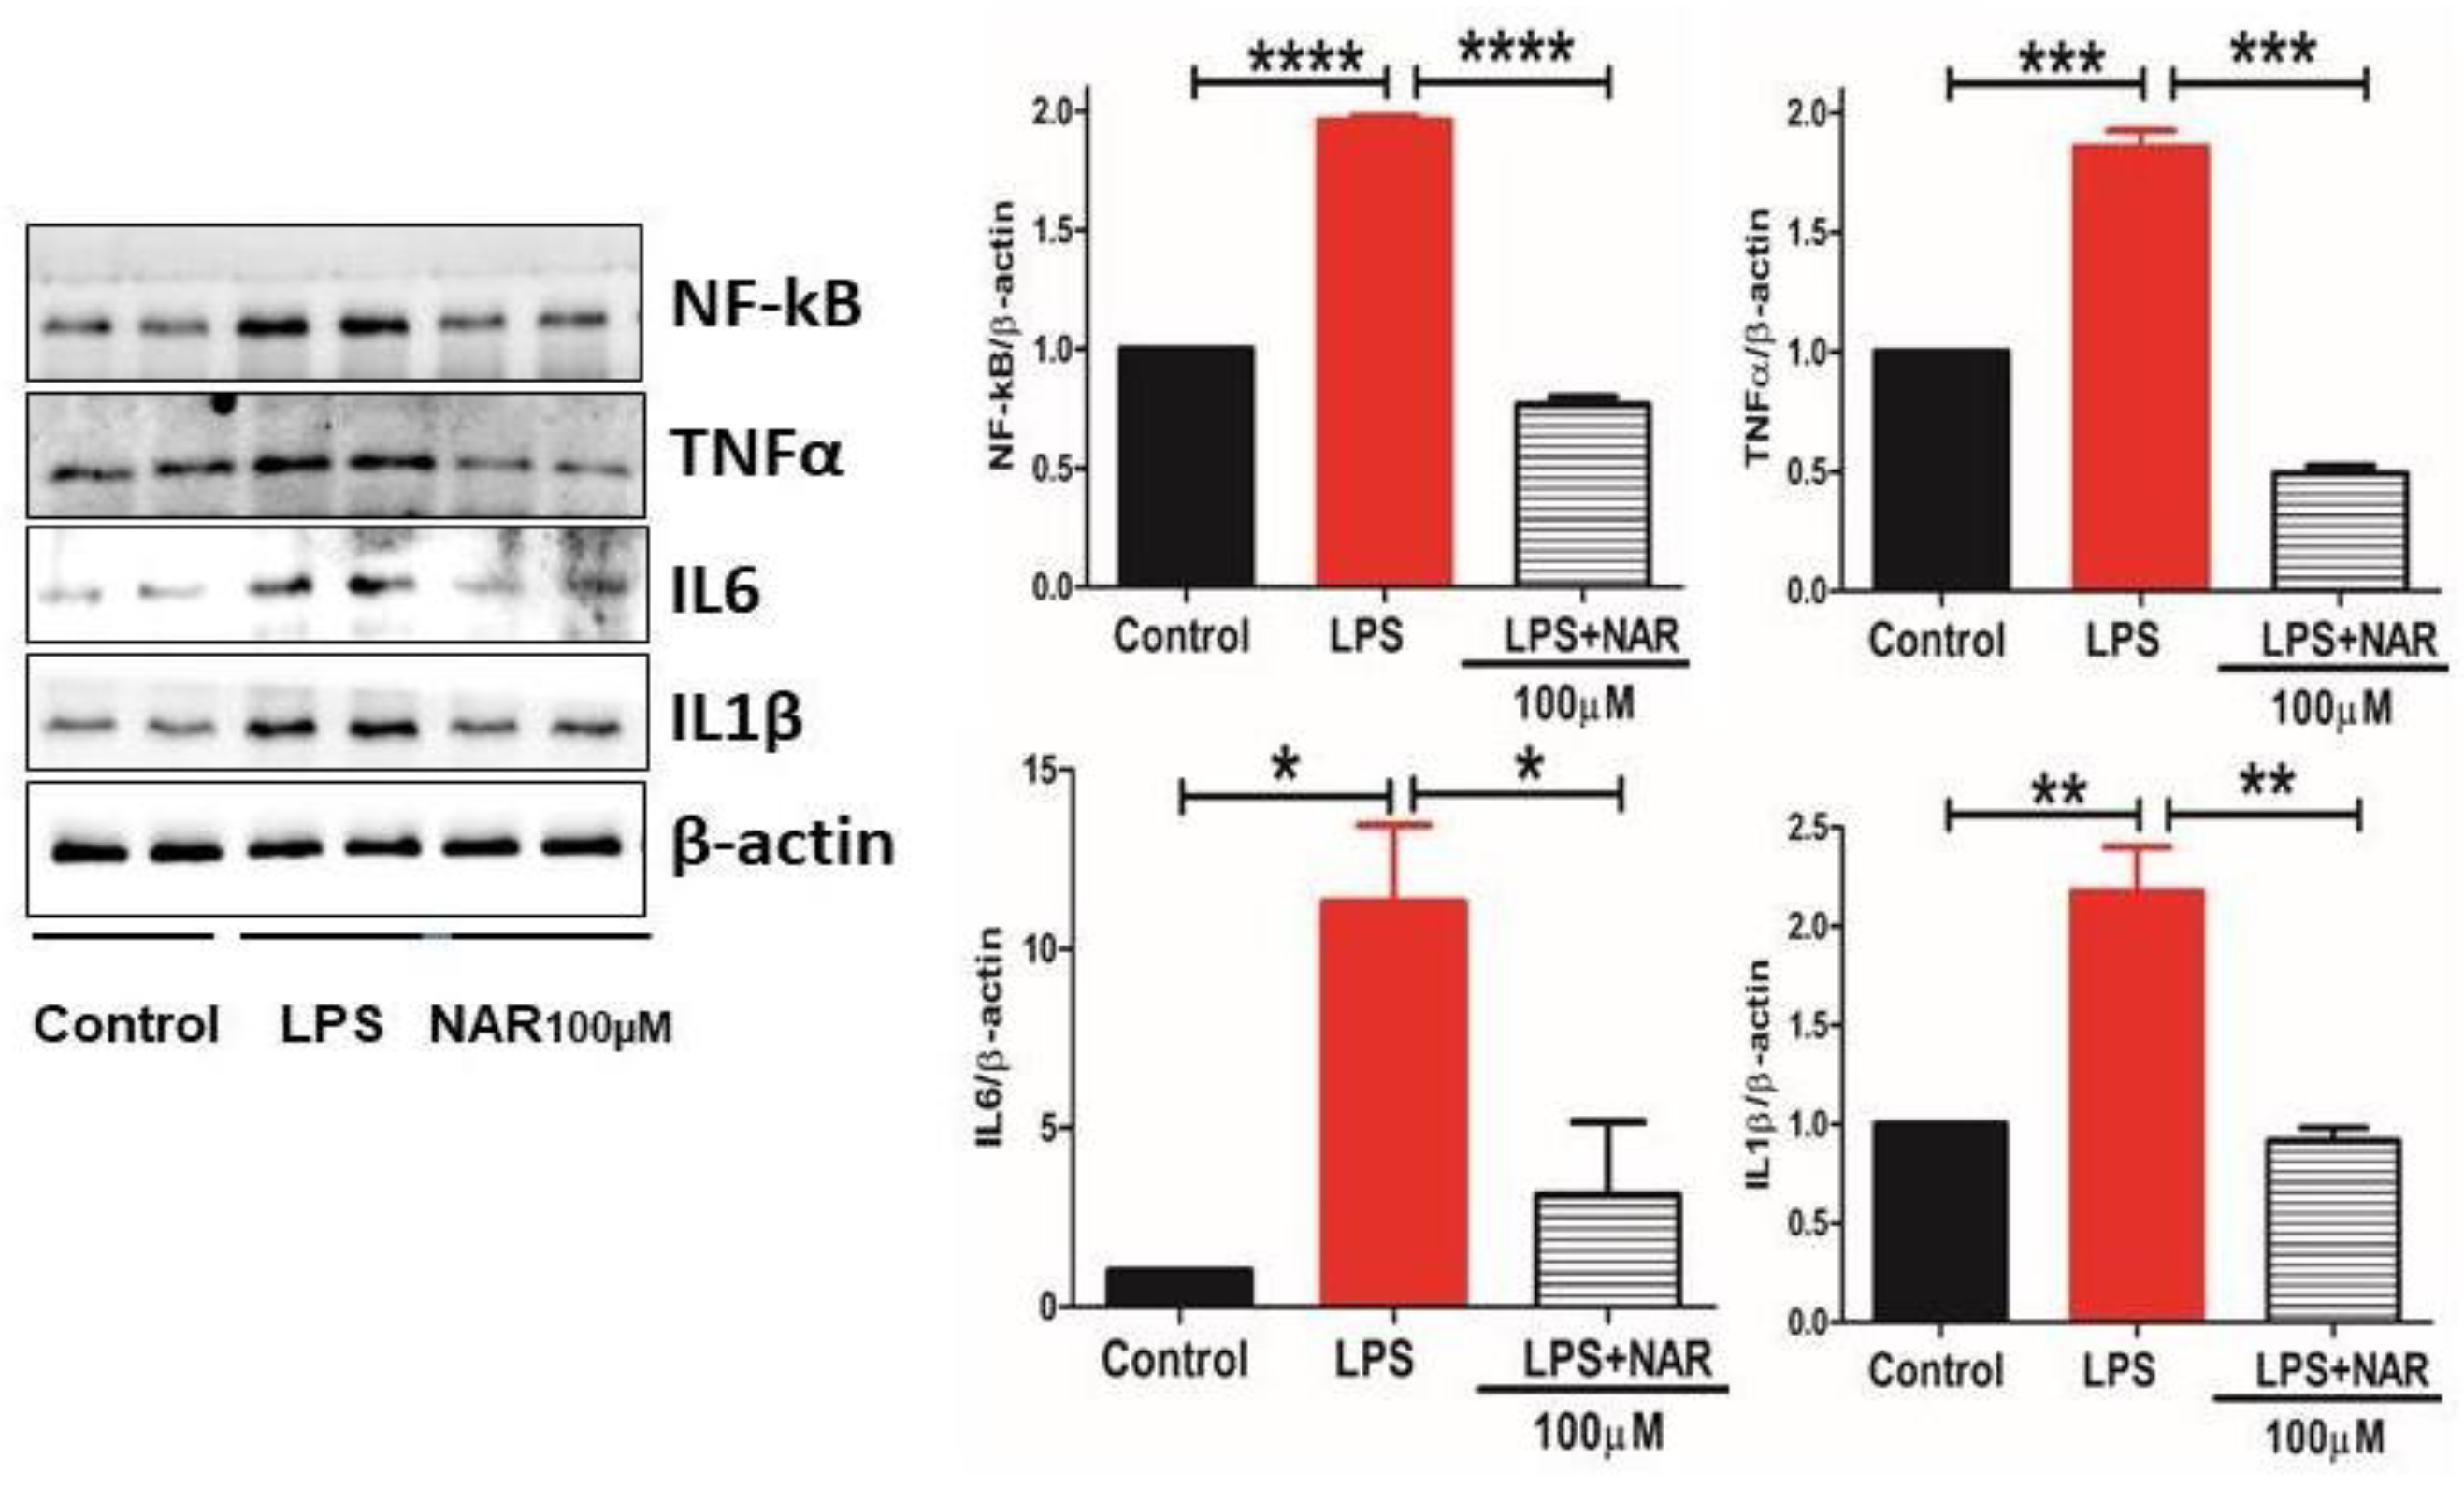
Figure 5.
The impact of Naringenin treatment on the expression levels of nuclear NF-κB assessed through Western blot analysis. Data presented as mean ± S.E.M of triplicates per group. The experiment revealed a substantial increase (p < 0.01) in the expression levels of NF-κB in the nuclear fraction in the LPS groups. The treatment with Naringenin at doses of 100µM and 150µM in LPS-exposed HMC3 cells resulted in a noteworthy decrease in the levels of these markers. The statistical significance of these changes is represented by *P < 0.1, indicating a significant difference compared to the LPS group.
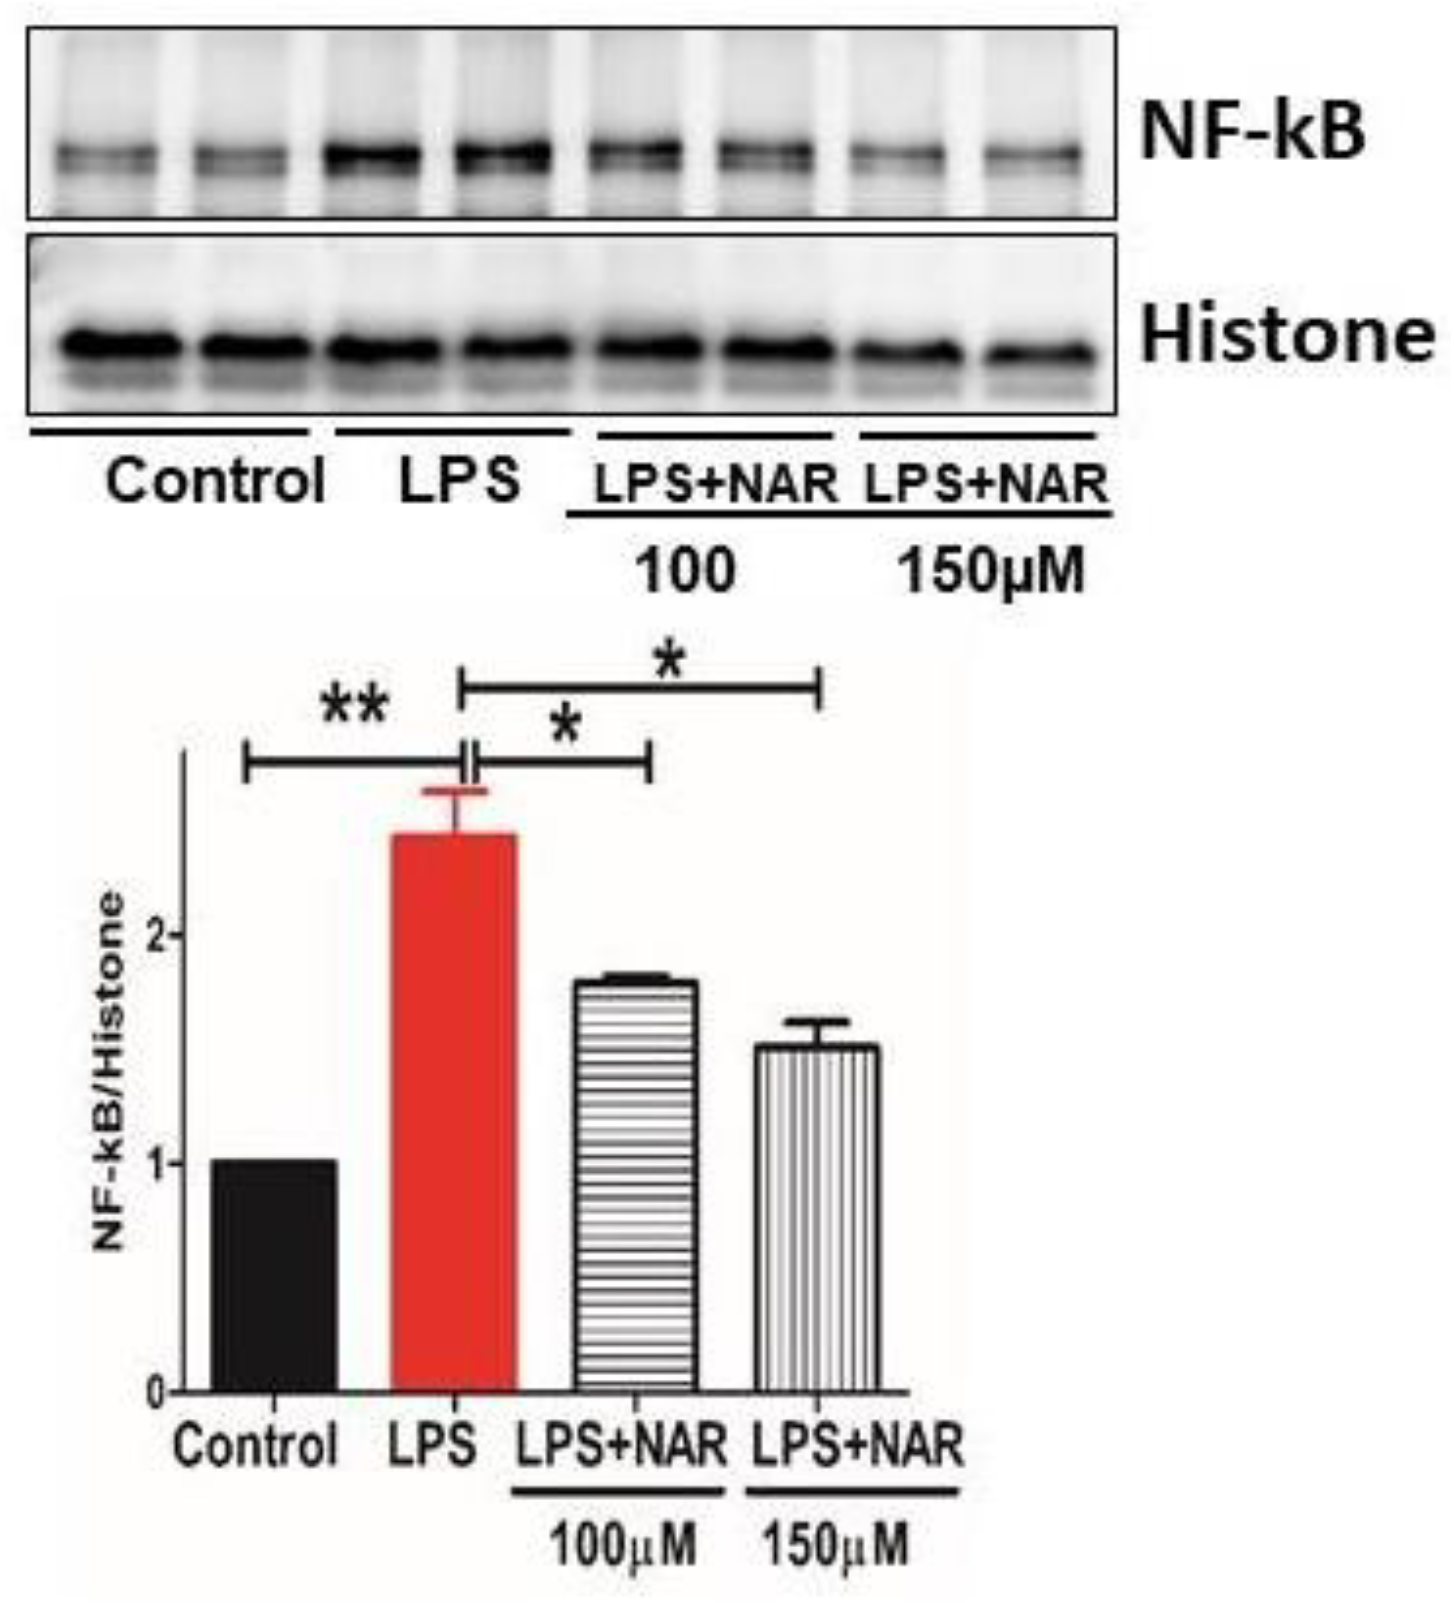
Figure 6.
Figure 6. NFκB expression levels in response to LPS and Naringenin. HMC-3 cells were treated with LPS (100ng/ml), LPS (100ng/ml)+Naringenin (100μM) and Naringenin (150μM) for 24h and then immunocytochemistry was performed for NFκB antibody (FITC green) with nuclear stain DAPI (Blue). Representative immunofluorescence pictures show increased fluorescence of NFκB (stained green) in the LPS group (Yellow arrows) as compared with the control group. Further, there was a decrease in the fluorescence (NFκB/Green) in the Naringenin (100μM) and Naringenin (150μM) groups as compared with the LPS group.
Disclaimer/Publisher’s Note: The statements, opinions and data contained in all publications are solely those of the individual author(s) and contributor(s) and not of MDPI and/or the editor(s). MDPI and/or the editor(s) disclaim responsibility for any injury to people or property resulting from any ideas, methods, instructions or products referred to in the content. |
© 2026 by the authors. Licensee MDPI, Basel, Switzerland. This article is an open access article distributed under the terms and conditions of the Creative Commons Attribution (CC BY) license (http://creativecommons.org/licenses/by/4.0/).
Copyright: This open access article is published under a Creative Commons CC BY 4.0 license, which permit the free download, distribution, and reuse, provided that the author and preprint are cited in any reuse.


