Submitted:
14 January 2026
Posted:
14 January 2026
You are already at the latest version
Abstract
Measles resurgence threatens elimination achievements in the Americas. We conducted a nationwide analysis of Mexico's 2025 measles outbreak, integrating individual-level surveillance data from the Special Surveillance System for Febrile Exanthematous Dis-eases with municipal-level social determinants from eight national databases, comple-mented by molecular surveillance data. We analyzed 6151 confirmed cases (epidemio-logical weeks 8–52, 2025) using spatial autocorrelation (Moran’s I, LISA), effective re-production number estimation, negative binomial regression, and logistic regression for risk factors. Cases concentrated in Chihuahua (73%), with 45 LISA hot-spot municipalities containing 71.68% of cases. Molecular surveillance confirmed two independent intro-ductions: D8/MVs/Ontario.CAN/47.24 (98.1%) linked to the Canadian outbreak, and B3 (1.9%) in Oaxaca. Transmission followed a three-stage pattern: introduction through seasonal agricultural worker networks, amplification in undervaccinated communities, and diffusion to marginalized indigenous populations. Vaccine effectiveness was 98.2%, with 83.4% of cases in pockets of susceptibles (municipalities with ≥80% unvaccinated). Risk factors for complications included age < 5 years (aOR 3.59), indigenous status (aOR 2.35), and unvaccinated status (aOR 2.03). Indigenous individuals comprised 30% of cases but 76% of deaths. This outbreak demonstrates that national vaccination thresholds are insufficient when marginalized populations remain systematically underserved.
Keywords:
measles
; outbreak investigation
; social determinants of health
; vaccine effectiveness
; molecular epidemiology
; spatial analysis
; indigenous populations
; Mexico
; pockets of susceptibles
1. Introduction
Measles remains a significant global public health concern due to its high transmissibility, morbidity, and mortality, particularly among children in low- and middle-income countries[1,2]. Despite the availability of a highly effective vaccine for over half a century, measles continues to cause substantial disease burden worldwide, with periodic resurgences linked to gaps in immunization coverage and disruptions in health systems[3,4].
In 2024, there were 395,521 laboratory-confirmed measles cases reported worldwide, and 16,147 cases in the first two months of 2025, with the true burden likely higher due to underreporting and limited surveillance in some regions[1,5]. More than half of reported cases required hospitalization, underscoring the severity of disease and complications such as pneumonia and encephalitis, particularly among unvaccinated children and immunocompromised individuals[1,5].
The burden of measles is highest among children under 5 years old, and mortality is driven not only by acute infection but also by measles-induced immune amnesia, which increases susceptibility to other infections for months to years after recovery[6,7,8]. Larger outbreaks—such as those projected for 2025—could cost up to US$90 million, underscoring the fiscal consequences of reduced vaccination coverage, while measles vaccination programs generate a substantial economic and societal return, with an estimated 58:1 return on investment through averted healthcare expenditures and productivity losses [9,10].
Globally, measles incidence and mortality declined by over 90% between 1990 and 2021, largely attributable to widespread vaccination efforts[5]. However, in 2021, measles still caused approximately 4.1 million cases, 48,100 deaths, and 4.2 million disability-adjusted life years (DALYs) among children under 5 years old[5]. The burden is disproportionately concentrated in regions with low socio-demographic indices and suboptimal vaccine coverage, such as sub-Saharan Africa and parts of South Asia[5,11,12]. For example, in the African region, measles incidence increased from 69.2 to 81.9 per million population between 2017 and 2021, and no country in the region has achieved verified elimination[12].
Measles is one of the most contagious infectious diseases, with a basic reproduction number (0) of 12–18, necessitating at least 95% coverage with two doses of measles-containing vaccine to achieve herd immunity and prevent outbreaks[3,13]. However, global coverage with the first dose (MCV1) has stagnated or declined in recent years, exacerbated by the COVID-19 pandemic, which disrupted routine immunization and catch-up campaigns[1,5,14]. In 2022 and 2023, global MCV1 coverage was only 83%, with much lower rates in low-income countries (64%)[1,5]. These gaps have led to large outbreaks in multiple regions, including a dramatic increase in cases in 2019 and ongoing crises in 2024–2025, with Europe reporting its highest case numbers in over 25 years[1,15,16].
Measles outbreaks in the Latin American region have seen a resurgence in recent years, primarily due to declining vaccination coverage, increased vaccine hesitancy, and gaps in public health preparedness[17,18]. Between 2019 and 2023, 18 countries in the Americas experienced measles outbreaks, with two countries temporarily losing their elimination status due to re-established endemic transmission; however, by the end of 2023, no country in the region had ongoing endemic measles transmission[17].
Historically, Mexico interrupted endemic measles transmission in 1997 through high vaccination coverage and robust surveillance, with subsequent cases primarily resulting from importation events and limited local spread[19]. Surveillance systems in Mexico and other Latin American countries have demonstrated high sensitivity, with few undetected cases and rapid identification of outbreaks[20].
In post-elimination settings, measles resurgence is increasingly driven not only by importations but by marked subnational heterogeneity in population immunity: high national coverage can coexist with geographically and socially clustered “pockets of susceptibility” where routine services are weakest, access barriers persist, or vaccine acceptance is low[21,22]. These pockets are shaped by structural and social determinants—inequitable access to health services, rurality, social marginalization, and mobility-linked networks—and can enable rapid amplification after introduction, followed by diffusion into communities facing compounded vulnerability[23]. Evidence from Latin America shows that multiple deprivations are associated with suboptimal childhood vaccination, underscoring that measles risk is socially patterned rather than randomly distributed[23,24]. Therefore, this study aims to provide the first comprehensive epidemiological analysis of Mexico's 2025 measles epidemic, integrating national surveillance, immunization registry, and sociodemographic data to characterize outbreak dynamics, identify high-risk populations, and elucidate the social determinants driving this resurgence—generating evidence to guide targeted interventions and inform elimination strategies in post-elimination settings.
2. Materials and Methods
2.1. Study Design and Setting
We conducted a population-based retrospective observational study analyzing the 2025 measles epidemic in Mexico. The study period spanned epidemiological weeks 8 through 52 (February 19 to December 28, 2025), covering the entire outbreak trajectory from initial case detection to the declining phase. The geographic scope encompassed all 32 Mexican states and 2,469 municipalities, with analyses conducted at both individual (confirmed cases) and ecological (municipal) levels.
2.2. Data Sources
We integrated data from eight open-access national databases containing 72 original variables covering epidemiological surveillance, hospital discharges, socioeconomic marginalization, migration intensity, agricultural labor patterns, and vaccination coverage. From these primary sources, we derived 11 additional analytic variables (total: 83 variables) based on biological plausibility and a priori hypotheses, including: relative outbreak week by state, epidemic phase classification, binary indicators for high-marginalization and high-migration municipalities, and municipal-level vaccination gap estimates. Supplementary Table S1 provides a complete data dictionary of all variables, including data types, sources, and definitions.
2.2.1. Primary Data Source: Epidemiological Surveillance
Case-level data were obtained from Mexico’s Special Surveillance System for Febrile Exanthematous Diseases (Sistema Especial de Vigilancia Epidemiológica de Enfermedades Febriles Exantemáticas, EFE), maintained by the General Directorate of Epidemiology (DGE), Ministry of Health[25]. This open-access database is updated weekly and includes 24 clinical–epidemiological variables per reported case (e.g., demographics, clinical manifestations, vaccination and indigenous status, and diagnostic classification)[25]. The dataset covered epidemiological weeks 1–52 of 2025.
Cases were defined according to the Mexican Official Standard NOM-017-SSA2-2012[26] and InDRE laboratory surveillance guidelines for febrile exanthematous disease[27] as (a) laboratory-confirmed (measles-specific IgM or RT-PCR positive) or (b) clinically–epidemiologically confirmed (compatible illness with an epidemiological link to a laboratory-confirmed case). Analyses included only confirmed measles cases (laboratory-confirmed and clinically–epidemiologically linked per NOM-017-SSA2-2012); suspected, discarded, and rubella cases were excluded.
2.2.2. Hospital Discharge Data
Hospitalization records for measles cases (ICD-10 code B05) were obtained from the Automated Hospital Discharge Subsystem (Subsistema Automatizado de Egresos Hospitalarios, SAEH) maintained by the General Directorate of Health Information (DGIS)[28]. This database captures all hospital discharges from Ministry of Health facilities, including diagnosis codes, complications, length of stay, and discharge status. Data for 2025 were accessed as preliminary records through the national open data portal.
2.2.3. Sociodemographic and Marginalization Data
Municipal-level socioeconomic indicators were obtained from complementary sources:
Marginalization Index 2020 (CONAPO): The National Population Council (Consejo Nacional de Población) publishes a composite marginalization index incorporating nine indicators of social deprivation, including illiteracy, incomplete basic education, inadequate housing (lacking drainage, electricity, piped water), overcrowding, income below minimum wage, and rurality[29]. Latest reference period: 2020 census data.
Social Lag Index 2020 (CONEVAL): The National Council for the Evaluation of Social Development Policy (Consejo Nacional de Evaluación de la Política de Desarrollo Social) provides a municipal-level social lag index based on education, health services access, housing quality, and basic services indicators[30]. Latest reference period: 2020.
Migration Intensity Index 2020 (CONAPO): The National Population Council also publishes a municipal-level Migration Intensity Index based on the proportion of households receiving remittances, with emigrants to the United States, with circular migrants, and with return migrants[31]. This index characterizes municipalities with high international migration activity, which may serve as conduits for disease introduction through returning migrant workers.
2.2.4. Agricultural Census Data
To identify municipalities with high agricultural migrant worker (jornalero) activity, we analyzed the 2022 Agricultural Census (Censo Agropecuario 2022) conducted by the National Institute of Statistics and Geography (INEGI)[32]. Variables related to agricultural labor force and seasonal worker presence were used to characterize municipalities with substantial agricultural migrant worker populations.
2.2.5. Vaccination Coverage Data
Historical vaccination coverage estimates were obtained from two sources:
BIO-SIS Database (1990–2023): The National Center for Child and Adolescent Health (Centro Nacional para la Salud de la Infancia y la Adolescencia, CENSIA) maintains immunization coverage records by state and year, including first and second doses of measles-mumps-rubella (MMR) vaccine[33].
2.2.6. Molecular Surveillance Data
Measles virus genomic sequencing data were obtained from two main sources. First, the public GenBank database from the National Center for Biotechnology Information (NCBI) was queried, identifying 26 historical sequences from the N-450 region of the nucleoprotein gene corresponding to Mexico (2003-2021 period)[34]. For the current 2025 outbreak data, information was manually extracted from the Epidemiological Bulletins published by the General Directorate of Epidemiology of the Mexican Ministry of Health[35], specifically from the Bulletin corresponding to Epidemiological Week 48 of 2025, which contains aggregated sequencing data by state, including number of sequences, genotype, and identified lineage.
2.2.7. Population Denominators
Mid-year population estimates for 2025 by municipality and age group were obtained from CONAPO official projections[36], enabling calculation of age-specific and municipality-specific incidence rates.
2.3. Data Linkage
All databases were linked at the municipal level using the official five-digit geographic code (clave geoestadística) assigned by INEGI, consisting of a two-digit state identifier and a three-digit municipality identifier. This standardized coding system enabled deterministic linkage across all data sources. Complete socioeconomic indicators were available for 99.5% of municipalities (n=2457).
2.4. Statistical Analysis
2.4.1. Descriptive Analysis
We characterized the epidemic through temporal (epidemic curves by epidemiological week), geographic (distribution by state and municipality), and demographic (age, sex, indigenous status, vaccination status) dimensions. Incidence rates were calculated per 100,000 population using CONAPO 2025 projections as denominators. Case fatality rates were computed as deaths divided by confirmed cases.
Epidemic phase classification. Two temporal frameworks were employed for phase analysis: (1) absolute epidemiological weeks for national-level descriptive summaries, and (2) state-relative weeks (calculated from each state's index case) for social determinants analysis, enabling comparison of outbreak dynamics across states with different introduction dates. For relative week analysis, phases were defined as: introduction (weeks 1–4, initial transmission), growth (weeks 5–11, exponential increase), peak (weeks 12–14, maximum incidence), decline (weeks 15–24, sustained decrease), and late phase (weeks 25+, residual transmission). For national aggregate descriptions (Section 3.1), absolute epidemiological weeks were used: Introduction (weeks 8–16), Peak (weeks 17–28), Decline (weeks 29–40), and Late (weeks 41+).
2.4.2. Transmission Dynamics
The time-varying effective reproduction number (Rt) was estimated using Bayesian inference with a parametric serial interval distribution. Based on published estimates for measles, we assumed a gamma-distributed serial interval with mean 11.7 days and standard deviation 2.0 days, derived from contact-tracing studies[37]. Rt was calculated using a 7-day sliding window to balance temporal resolution with estimate stability. Posterior mean estimates and 95% credible intervals (CrI) were obtained for each time point. National Rt was estimated from the aggregated daily case counts, while state-level Rt was calculated separately for the five states with the highest case burden (Chihuahua, Jalisco, Guerrero, Michoacán, and Chiapas) to characterize regional transmission dynamics. Sustained transmission was defined as Rt > 1, indicating that each case generates, on average, more than one secondary infection.
2.4.3. Spatial Analysis
Spatial autocorrelation of measles incidence was assessed at the municipal level (N = 2457 municipalities) using exploratory spatial data analysis. Incidence rates per 100,000 population were calculated for each municipality using 2020 census population estimates as denominators. A spatial weights matrix was constructed based on queen contiguity (shared boundaries including corners), with row-standardized weights to account for varying numbers of neighbors. Global spatial autocorrelation was evaluated using Moran's I statistic, which measures the degree of clustering in the spatial distribution of incidence rates. Local Indicators of Spatial Association (LISA) were calculated using the local Moran’s I statistic to identify statistically significant clusters. Municipalities were classified into four categories based on their local Moran’'s I value and statistical significance (p < 0.05): hot spots (High-High: high incidence surrounded by high incidence), cold spots (Low-Low: low incidence surrounded by low incidence), and spatial outliers (High-Low or Low-High). To assess temporal-spatial spread patterns, we calculated the Euclidean distance from each affected municipality’s centroid to the outbreak epicenter (Cuauhtémoc, Chihuahua) and examined its relationship with the timing of case detection using linear regression. The epicenter was defined as the municipality reporting the earliest sustained case cluster.
2.4.4. Social Determinants and Introduction Mechanism
To identify social and structural factors associated with measles occurrence, we conducted a municipal-level ecological analysis comparing 219 municipalities with confirmed cases versus 2250 municipalities without cases. Municipal indicators were obtained from four national sources: CONAPO Marginalization Index 2020 (normalized index 0-100, categorical degree), CONAPO Migration Intensity Index 2020 (categorical degree from null to very high), CONEVAL Social Lag Index 2020 (including proportion without health insurance), and the INEGI 2022 Agricultural Census (percentage of agricultural production units employing seasonal workers [jornaleros]). All indicators represent municipal-level characteristics linked to individual cases through residence municipality, not individual patient attributes.
Bivariate comparisons used Mann-Whitney U tests for continuous variables and chi-squared tests for categorical variables. Multivariable analysis employed negative binomial regression to model case counts with the logarithm of municipal population as an offset, yielding incidence rate ratios (IRR) with 95% confidence intervals.
Given the heterogeneous nature of the outbreak across regions and time, we performed stratified analyses by: (1) outbreak phase using relative epidemiological weeks per state (introduction: weeks 1-4; growth: weeks 5-11; peak: weeks 12-14; decline: weeks 15-24; late: weeks 25+), where week 1 represents the first week with confirmed cases in each state; (2) by state for the six states with ≥50 cases (representing 95.5% of total cases); and (3) sensitivity analyses comparing the first 50 versus last 50 municipalities affected chronologically.
Temporal trends in social determinants were assessed using Spearman rank correlation coefficients to test for monotonic associations with relative week. Additionally, locally estimated scatterplot smoothing (LOESS) with span = 0.4 was applied to visualize non-linear temporal patterns, with 95% confidence intervals calculated. This approach was particularly relevant for identifying U-shaped or non-monotonic patterns not captured by linear correlation tests.
2.4.5. Vaccination and Case Incidence
Vaccine effectiveness (VE) was estimated using the Farrington screening method, calculated as VE = 1– [(PCV × (1–PPV)) / (PPV × (1–PCV))], where PCV is the proportion of cases vaccinated (from EFE surveillance data: vaccinated=1, unvaccinated=2) and PPV is the population proportion vaccinated (estimated from mean MCV1 coverage 2014-2023, CENSIA/CNI). Confidence intervals (95% CI) were calculated using the Orenstein method based on the standard error of the log odds ratio. State-level VE was estimated for states with ≥20 confirmed cases using state-specific historical coverage. Additional metrics included relative risk (RR) of disease among unvaccinated versus vaccinated individuals and population attributable fraction (PAF). To characterize the focal nature of transmission, municipalities with ≥10 cases were classified by the proportion of unvaccinated cases (<70%, 70-79%, 80-89%, 90-94%, ≥95%), identifying “pockets of susceptible" where transmission concentrated independent of state-level coverage averages.
2.4.6. Complications and Risk Factors for Severity
Risk factors for measles complications were analyzed using logistic regression. The outcome was the presence of any complication (pneumonia, otitis media, encephalitis, or other) as recorded in the EFE surveillance form. Individual-level variables included age group (<1, 1-4, 5-19, and ≥20 years), sex, vaccination status, and indigenous self-identification. Contextual variables at the municipality level were linked using standardized codes and included marginalization degree, rurality (>50% population in localities <5000 inhabitants), access to piped water, drainage, and health services (CONAPO 2020, CONEVAL 2020). Bivariable analysis was performed for all candidate variables; those with p<0.20 were considered for multivariable modeling. The final multivariable model was selected based on parsimony, avoiding collinearity (variance inflation factor <5), and model fit criteria (AIC, pseudo-R²). Results are expressed as crude odds ratios (OR) and adjusted odds ratios (aOR) with 95% confidence intervals. Given the low number of deaths (n=25), mortality analysis was limited to descriptive comparisons.
2.4.7. Molecular Epidemiology
Measles virus genomic sequencing data were obtained from two sources. For historical context, the NCBI GenBank database was queried to retrieve all available measles virus sequences from Mexico corresponding to the N-450 region of the nucleoprotein gene, the standard region for WHO genotype classification. For the current outbreak, data were obtained from the Epidemiological Bulletins published by the General Directorate of Epidemiology of the Mexican Ministry of Health, specifically from the Bulletin corresponding to Epidemiological Week 48 of 2025, which contains aggregated sequencing data by state, including number of sequences, genotype, and identified lineage. Genotype and lineage classification followed WHO nomenclature standards. Molecular analysis was based on 207 sequences reported through epidemiological week 48; sequencing data for weeks 49-52 were not available at the time of analysis.
Spatial autocorrelation of the epidemiological week of symptom onset was assessed using Moran’'s I statistic with a spatial weights matrix based on k=4 nearest neighbors to determine whether early-infected states were geographically clustered. A linear regression model was fitted using distance from the epicenter (Chihuahua) as the predictor and week of first case as the outcome to estimate outbreak propagation speed. Distances were calculated using the Haversine formula. Propagation speed was estimated as the ratio between distance to the epicenter and time elapsed until the first case appeared in each state, stratified by geographic region (North, Central, South). States with genotypes differing from the predominant lineage were evaluated separately to identify potential independent introductions.
2.4.8. Software and Reproducibility
All analyses were conducted using R version 4.4.1 (R Foundation for Statistical Computing, Vienna, Austria). Data management and visualization used tidyverse packages (v2.0.0), including ggplot2 (v4.0.1) and dplyr (v1.1.4). Spatial analysis employed sf (v1.0.23) for geographic data handling and spdep (v1.3.13) for spatial autocorrelation. Effective reproduction number estimation used EpiEstim (v2.2.5). Logistic regression diagnostics used broom (v1.0.9), and summary tables were generated with gtsummary (v2.3.0) and flextable (v0.9.9). Figure composition used patchwork (v1.3.2). All scripts are available in a reproducible analysis pipeline with centralized configuration enabling re-execution with updated surveillance data and are available upon request to the corresponding author.
3. Results
3.1. Descriptive Analysis
A total of 6151 confirmed measles cases (5692 laboratory; 459 epidemiologically-linked) were reported across 30 states during epidemiological weeks 8–52, 2025, with marked geographic concentration in northern Mexico (Figure 1).
Given that Chihuahua state accounted for 73.0% of all cases (n=4493), demographic and clinical characteristics were stratified by geographic concentration to compare the outbreak epicenter with the rest of the country (Table 1). Cases in Chihuahua were significantly older (median 20 years, IQR 4–31) compared with other states (median 11 years, IQR 4–23; p<0.001), with adults aged 20–39 years comprising the largest proportion (41.5% vs 25%). The majority of cases were unvaccinated (85.9%), with a higher proportion in Chihuahua (87.0% vs 83%; p<0.001). Indigenous individuals accounted for 30.6% of total cases. Regarding transmission origin, 78.2% of Chihuahua cases were classified as import-related compared with 23.3% in other states (p<0.001), while imported cases were predominantly reported outside Chihuahua (12.6% vs 0.2%). Complications occurred in 16.4% of cases, with significantly higher rates in Chihuahua (19.1% vs 8.9%; p<0.001). Twenty-five deaths were recorded (case fatality rate 0.4%), with no significant difference between regions.
Age-stratified analysis revealed significant differences across all characteristics (Supplementary Table S2). Complication rates showed a clear inverse gradient with age, ranging from 36.5% in infants (<1 year) to 7.9% in adults aged 20–39 years (p<0.001). Infants had the highest proportion of unvaccinated cases (95.0%), consistent with the recommended vaccination schedule starting at 12 months of age. Indigenous status was more prevalent among children and adolescents (34.2–41.4%) compared with adults ≥40 years (12.8%). Import-related transmission increased with age, from 57.9% in infants to 76.7% in those ≥40 years, suggesting that adult population mobility played a key role in outbreak propagation.
Cases with complications (n=1006, 16.4%) were significantly younger than uncomplicated cases (median 4 years, IQR 1–18 vs 19 years, IQR 6–30; p<0.001), with children <5 years accounting for over half of all complications (51.8%) (Supplementary Table S3). Unvaccinated status was more frequent among complicated cases (92.5% vs 84.6%, p<0.001). Notably, indigenous individuals represented 53.3% of cases with complications compared with 26.2% of uncomplicated cases (p<0.001), highlighting a marked disparity in disease severity. Sex was not associated with complication risk (p=0.9).
For national aggregate description, outbreak phases were defined using absolute epidemiological weeks to provide an overall temporal picture of the epidemic. The outbreak was analyzed across four epidemiological phases: Introduction (weeks 8–16, n=647, 10.5%), Peak (weeks 17–28, n=2770, 45.0%), Decline (weeks 29–40, n=1398, 22.7%), and Late (weeks 41+, n=1336, 21.0%) (Supplementary Table S4). Median age was highest during Peak (23 years) when adults 20–39 years predominated (45.6%), decreasing to 11 years in the Late phase. Unvaccinated cases remained consistently high (83–90%) across all phases. The most striking temporal shift occurred in indigenous status: from 0.8% during Introduction to 54.6% during Decline—a 25-fold increase (p<0.001)—reflecting propagation into hard-to-reach communities. Complication rates peaked during Decline (25.1%) compared with 12–15% in other phases. Twenty-five deaths occurred (CFR 0.4%), predominantly during Peak (n=10) and Decline (n=12), with highest case fatality in Decline (0.9%).
3.2. Transmission Dynamics
The national effective reproduction number peaked at 12.1 (95% CrI: 8.5–16.4) on March 15, 2025, during the early growth phase of the epidemic, indicating intense initial transmission (Figure 2, Panel A). Rt declined progressively, crossing the threshold of 1 for the first time on May 8, 2025, approximately 8 weeks after the peak. As of epidemiological week 52, the national Rt was 0.38 (95% CrI: 0.25–0.54), indicating that transmission has been controlled at the national level.
In Chihuahua, which accounted for approximately 73% of all cases, the Rt trajectory closely paralleled national estimates, reaching a maximum of 13.0 on March 17, 2025, and first declining below 1 on May 6, 2025 (Figure 2, Panel B). The close alignment between Chihuahua and national Rt curves reflects the dominant contribution of this state to overall epidemic dynamics. Current Rt in Chihuahua stands at 1.48, indicating ongoing active transmission in the epicenter.
Secondary outbreak foci in other states showed distinct temporal patterns (Figure 2, Panel C). States with later epidemic onset (Guerrero, Jalisco, Michoacán, Chiapas) exhibited elevated Rt values during their respective growth phases, though estimates were associated with wider credible intervals due to smaller case numbers. By December 2025, Rt remained above 1 in three of the five most affected states—Chihuahua (1.48), Michoacán (1.76), and Chiapas (2.10)—while transmission was controlled in Jalisco (0.42) and Guerrero (0.30). Notably, Chiapas exhibited the highest current Rt (2.10) among all states, consistent with a late introduction and ongoing exponential growth in a susceptible population.
3.3. Spatial Analysis
Spatial analysis revealed significant clustering of measles incidence at the municipal level (Figure 3). Global spatial autocorrelation was strongly positive (Moran's I = 0.417, z = 36.0, p < 0.001), indicating non-random geographic clustering. LISA analysis identified 45 statistically significant hot spot municipalities containing 4409 cases (71.68% of total). The vast majority (43/45, 95.6%) were located in Chihuahua. The municipalities with highest incidence rates were San Francisco de Conchos (1261 per 100,000), Carichí (1060), and Cuauhtémoc (799)—areas characterized by high indigenous population and limited healthcare access. Temporal-spatial analysis demonstrated a significant relationship between distance from the epicenter and timing of outbreak arrival (R² = 0.375, p < 0.001), consistent with radial spread from epicenter through population mobility networks.
3.4. Social Determinants and Introduction Mechanism
Initial municipal-level analysis revealed distinct profiles between affected and unaffected municipalities (Table 2). Municipalities with confirmed cases were significantly larger (median population 39,656.5 vs 12,290; p<0.001) and more urbanized, with lower rurality (median 43.5% vs 100% rural population; p<0.001). Despite this urban profile, affected municipalities showed a bimodal marginalization pattern: 51.4% had very low marginalization while 13% had very high marginalization, compared to a more uniform distribution in unaffected areas (p<0.001). Similarly, 50.5% of affected municipalities had very low social lag versus 25.2% in unaffected areas (p<0.001). Affected municipalities had a lower proportion of agricultural units employing day laborers (median 41.7% vs 48.1%; p<0.001), with 47.4% in the lowest tertile. Migration intensity patterns also differed significantly (p<0.001), with affected municipalities concentrated in low-to-medium migration categories. These initial findings suggested that the outbreak predominantly affected urban and periurban municipalities rather than isolated rural communities, warranting further temporal and spatial stratification to elucidate transmission dynamics.
To enable comparison across states with different introduction dates, temporal stratification by outbreak phase used relative weeks (week 1 = first confirmed case in each state), revealing marked shifts in case characteristics (Table 3, Figure 4). During the introduction phase (relative weeks 1-4), 40% of cases occurred in municipalities with high seasonal agricultural worker activity (>50%), decreasing sharply to 7.1% during the peak phase (weeks 12-14) (p<0.001 for trend across phases). Notably, the LOESS-smoothed temporal analysis revealed a distinctive U-shaped pattern for seasonal agricultural workers (Figure 4A, Panel C): elevated values during introduction (mean 44%), declining to a nadir during peak transmission (35%), then rising again during the late phase (41%). This non-monotonic pattern explains the non-significant Spearman correlation (ρ = 0.08, p = 0.67), as this test assesses monotonic (consistently increasing or decreasing) trends rather than quadratic or U-shaped relationships. The pattern suggests a dual role of agricultural worker networks: initial virus introduction during early phases, followed by resurgence in late phases as the outbreak spread to agricultural communities with structural vulnerability.
In contrast, the proportion of indigenous cases showed a strong monotonic increase from 18% in the introduction phase to 66% in the late phase (weeks 25+) (3.7-fold increase; Spearman ρ = 0.90, p < 0.001), reflecting progressive spread to marginalized indigenous communities (Figure 4D). Similarly, complication rates demonstrated a significant positive trend (ρ = 0.76, p < 0.001), more than doubling from 10% to 23% between introduction and late phases (Figure 4E), consistent with higher disease severity in vulnerable populations reached later in the outbreak.
Median age showed a non-linear pattern: youngest during introduction (10 years), oldest during growth/peak (22 years), then declining again in late phases (11 years). Incidence rate ratios from negative binomial regression (Figure 4B) confirmed that municipalities with >50% seasonal agricultural workers had 2.3-fold higher incidence (IRR 2.3, 95% CI: 1.4-3.8) compared to municipalities with lower agricultural worker density.
These temporal patterns support a three-stage epidemiological model: (1) initial introduction through seasonal agricultural worker networks in periurban areas, (2) amplification and peak transmission in the general urban population, and (3) subsequent diffusion to marginalized indigenous communities with higher vulnerability to severe disease and complications.
State-level stratification among the six states with ≥100 cases (representing 93.9% of total cases) revealed distinct epidemiological profiles (Table 4). Chihuahua, the outbreak epicenter (n=4493; 73%), showed a median age of 20 years with 28% indigenous cases and 19% complications, but only 2.1% of cases in high day-laborer municipalities—reflecting agricultural workers as introducers rather than the predominantly affected population. In contrast, Guerrero (n=242) and Michoacán (n=225) had younger cases (median 7 and 10 years), higher indigenous proportions (60% and 61%), and nearly all cases (100% and 90%) occurred in municipalities with high day-laborer activity. Jalisco (n=544) presented an intermediate profile with 28% indigenous cases and the lowest complication rate (4.4%). Chiapas (n=161) emerged as a notable secondary focus with 52% indigenous cases and 20% complications, consistent with its elevated Rt (2.10) indicating ongoing transmission. Sonora (n=111) showed a distinct profile with only 12% indigenous cases but 76% of cases in high day-laborer municipalities. These state-level differences underscore the heterogeneous nature of the outbreak, with distinct transmission dynamics operating across geographic regions.
Sensitivity analysis comparing the first 50 versus last 50 municipalities affected confirmed the temporal shift in outbreak characteristics (Table 5). The first 50 municipalities (epi weeks 8-19; n=4400 cases) were predominantly urban (median rurality 19.3%), with older cases (median 20 years), and only 2.4% located in high day-laborer municipalities. In contrast, the last 50 municipalities (epi weeks 45-52; n=132 cases) were more rural (median 59.5%), younger (median 9.5 years), with higher indigenous proportion (52% vs 25%; p<0.001), and 33% in high day-laborer municipalities. Notably, despite the more vulnerable profile of late-affected populations, complication rates were lower (8.3% vs 18%), possibly reflecting improved clinical awareness and outbreak response capacity. These findings support a model of initial urban introduction followed by secondary spread to marginalized rural and indigenous communities.
3.5. Vaccination and Vaccine Effectiveness (VE)
Among 6151 confirmed cases, 868 (14.1%) were vaccinated and 5284 (85.9%) were unvaccinated, contrasting with national population coverage of 90% (Table S5). National vaccine effectiveness was 98.2% (95% CI: 98.0-98.3%), with a relative risk of 54.8 for unvaccinated individuals and a population attributable fraction of 97.9%, indicating that approximately 6022 cases were attributable to non-vaccination. State-level VE ranged from 93.5% (Jalisco) to 99.2% (Zacatecas) among 13 states with ≥20 cases (Table S6). Analysis of 69 municipalities with ≥10 cases revealed that 83.1% of cases occurred in "pockets of susceptibles"—municipalities where ≥80% of cases were unvaccinated—with 65.8% concentrated in municipalities with 80-89% unvaccinated (Figure 5). States with highest case counts showed chronic undervaccination: Chihuahua had 15 years with MCV1 coverage below 80% since 1990 (2023 coverage: 65.6%), and Chiapas had 20 years below threshold. This focal distribution suggests that the outbreak concentrated in marginalized communities with persistently low coverage not captured by state-level averages, explaining the absence of correlation between state coverage and incidence.
3.6. Complications and Risk Factors for Severity
Complications were documented in 1006 of 6151 cases (16.4%), and 25 deaths occurred (case fatality rate: 0.41%). In bivariable analysis, 26 of 27 variables evaluated showed association with complications at p<0.20 (Table S7). The strongest crude associations were observed for age <5 years (OR=4.13, 95% CI: 3.59-4.76), indigenous status (OR=3.21, 95% CI: 2.79-3.69), rural municipality (OR=2.70, 95% CI: 2.33-3.11), lack of drainage (OR=2.39, 95% CI: 2.07-2.75), and unvaccinated status (OR=2.26, 95% CI: 1.77-2.90). In the final multivariable model (Table 6), independent risk factors for complications included age <1 year (aOR=3.59, 95% CI: 2.88-4.46), age 1-4 years (aOR=2.69, 95% CI: 2.20-3.28), indigenous status (aOR=2.35, 95% CI: 1.99-2.77), unvaccinated status (aOR=2.03, 95% CI: 1.57-2.63), and rural municipality (aOR=1.81, 95% CI: 1.55-2.13). Adults ≥20 years had lower odds of complications compared to children 5-19 years (aOR=0.66, 95% CI: 0.54-0.80). Neither sex nor outbreak phase were independently associated with complications in the adjusted analysis. Among the 25 deaths, indigenous individuals were disproportionately affected, representing 76% of fatalities despite comprising 31% of cases..
3.6.1. Hospital Discharge Analysis
Linkage with the Automated Hospital Discharge Subsystem (SAEH) identified 663 measles-related hospitalizations in Ministry of Health facilities (estimated hospitalization rate: 11.5%). Among hospitalized patients, 308 (46.5%) had documented complications, with pneumonia being the predominant type (n=270, 87.7% of complications), followed by encephalitis (n=10, 3.2%), other complications (n=18, 5.8%), and otitis media (n=3, 1.0%) (Supplementary Table S8). The proportion of pneumonia was highest among children aged 5–9 years (49.7%) and 1–4 years (47.5%), and lowest among adults 20–39 years (15.7%). Median length of hospital stay was 4 days (IQR: 2–6), with no significant difference by complication type. Indigenous patients had significantly longer hospitalizations (median 4 days, IQR 3–6) compared to non-indigenous patients (median 4 days, IQR 2–5; p<0.001), and higher complication rates (50.3% vs 41.6%; p=0.033). Six in-hospital deaths occurred (case fatality rate among hospitalized:0.9%), with three (50%) associated with pneumonia.
3.7. Molecular Epidemiology
Historical surveillance data from GenBank revealed circulation of six different genotypes in Mexico between 2011 and 2023: H1 (2014, 2023), D4 (2011), D7 (2020), D8 (2013, 2019), D9 (2015), and B3 (2018, 2019), with a total of 21 sequences across this period (Supplementary Figure S1). This genotypic diversity contrasts markedly with the 2025 outbreak pattern. Analysis of 207 sequences distributed across 25 states revealed circulation of two genotypes: D8 (lineage MVs/Ontario.CAN/47.24) representing 98.1% (n=203) of sequences in 24 states, and B3 (lineage MVs/New South Wales.AUS/10.24) comprising 1.9% (n=4) located exclusively in Oaxaca (Figure 6A). Notably, both D8 and B3 genotypes had been detected in Mexico during 2018-2019, though at much lower frequencies; the 2025 outbreak represents a dramatic shift toward D8 dominance, with sequence counts increasing nearly 30-fold compared to historical records. Spatial autocorrelation analysis demonstrated a significant contagious diffusion pattern for the epidemiological week of onset (Moran's I = 0.562, p < 0.0001), indicating that early-infected states are geographically proximate to each other (Figure 6B). The linear regression model between distance to epicenter and week of onset showed robust fit (R² = 0.754, p < 0.001), where for every 100 km from Chihuahua, the outbreak arrived approximately 0.80 weeks (5.6 days) later (Figure 6C). Propagation speed for genotype D8 showed marked regional variation (Figure 6D): the Northern region exhibited the fastest spread (290.9 km/week, 41.6 km/day), followed by Central (156.5 km/week, 22.4 km/day) and Southern regions (141.6 km/week, 20.2 km/day), consistent with distance-dependent attenuation from the Chihuahua epicenter. The Oaxaca case (B3 genotype) did not follow the D8 spatial diffusion pattern; according to the model, the outbreak should have arrived approximately at epidemiological week 14.9, however, it was recorded at week 20, with a difference of 5.1 weeks suggesting an independent introduction unrelated to the Chihuahua epicenter. The presence of B3 in Oaxaca mirrors the pattern observed in 2018-2019, when this genotype was detected in geographically distant states (Baja California, San Luis Potosí, Nuevo León), consistent with multiple independent importations rather than sustained local transmission. It is important to note that these analyses were performed with state-level aggregated data due to public information availability, which represents a limitation that prevents identification of intra-state transmission dynamics and local clusters at the municipal level; nevertheless, results are consistent with a hierarchical diffusion pattern from the northern border toward central and southern regions of the country.
4. Discussion
This nationwide analysis of 6,151 confirmed measles cases represents Mexico’s largest measles epidemic since the interruption of endemic transmission in 1997 and provides comprehensive insight into the epidemiological dynamics, spatial diffusion, and social determinants associated with this resurgence[19]. Five findings stand out. First, the outbreak was highly concentrated geographically: 73.0% of cases occurred in Chihuahua and 76.8% clustered in 45 LISA hot-spot municipalities. Second, molecular surveillance supported two independent introductions—a predominant D8 genotype (98.1%) linked to the lineage MVs/Ontario.CAN/47.24 entering through the northern border, and a separate B3 genotype (1.9%) importation in Oaxaca. Third, transmission followed a three-stage pattern: introduction through seasonal agricultural worker networks, amplification in undervaccinated communities, and subsequent diffusion toward marginalized indigenous populations. Fourth, estimated vaccine effectiveness remained high (98.2%), supporting that the outbreak was driven by accumulation of susceptible individuals rather than vaccine failure. Fifth, independent risk factors for complications included age <5 years (aOR 3.59), indigenous status (aOR 2.35), unvaccinated status (aOR 2.03), and rural residence (aOR 1.81).
The predominance of the D8/MVs/Ontario.CAN/47.24 lineage is consistent with contemporaneous North American circulation and supports a cross-border transmission context. In November 2025, PAHO reported that the Region of the Americas lost measles elimination status, noting that regional verification—first achieved in 2016 and regained in 2024—can be jeopardized when endemic transmission is re-established in any country for ≥12 months[38]. This broader context aligns with recent analyses describing the operational challenges of sustaining measles elimination in the Americas amid coverage gaps and recurrent importations[17].
The spatial diffusion pattern observed in our study—with Moran's I = 0.562 and propagation speed of 194.8 km/week—is consistent with contagious diffusion as described in classic epidemiological theory. Grenfell et al. (2001) demonstrated that in the pre-vaccination era, hierarchical waves of infection moved regionally from large cities to smaller towns, and that vaccination restricted but did not eliminate such spatial contagion[39]. Our regression model (R² = 0.754), showing a delay of 0.8 weeks per 100 km from the Chihuahua epicenter, supports a predominantly contagious rather than strongly hierarchical diffusion pattern, likely reflecting the rural and dispersed nature of affected communities.
Our finding that 65.5% of cases in the late outbreak phase occurred among indigenous individuals—compared to 19.1% during the introduction phase—mirrors patterns observed in other settings. A case-control study in Ecuador demonstrated that the odds of measles were fourfold higher in parishes with larger indigenous populations (>1.4%) compared to those with smaller proportions, even after adjustment for other variables[40]. The Pan American Health Organization reported in August 2025 that most measles deaths in Mexico have occurred in indigenous people, confirming the disproportionate impact on this vulnerable population[41].
The progressive shift of the outbreak toward marginalized communities with higher indigenous proportions, greater social lag, and limited healthcare access is consistent with evidence that measles risk in elimination settings is socially patterned and geographically clustered. Fine-scale heterogeneity in vaccination uptake can be obscured by aggregated reporting, creating localized “pockets of susceptibles” that sustain transmission after introduction[21,22,42]. In Latin America and the Caribbean, multiple deprivations are strongly associated with suboptimal basic childhood vaccination, reinforcing the role of structural barriers in shaping susceptibility landscapes[24]. These findings are also consistent with recent syntheses emphasizing that outbreaks reflect interrelated limitations in healthcare access, routine coverage, and service delivery in vulnerable populations[42,43].
The concentration of cases in Mennonite communities in Chihuahua parallels the 2025 West Texas outbreak. CDC described that, during January 1–April 17, 2025, most U.S. cases were linked to an ongoing outbreak in close-knit communities with low vaccination coverage across Texas and neighboring states[44,45,46]. Texas DSHS later reported that the outbreak ultimately totaled 762 confirmed cases and two deaths in Texas before it was declared over[45]. This pattern is not unique to 2025; large outbreaks in the post-elimination era have repeatedly concentrated in close-knit communities with sustained immunity gaps, including Orthodox Jewish communities in New York in 2019 and Amish communities in Ohio in 2014[46]. These outbreaks illustrate how localized “pockets of susceptibles” can dominate epidemic burden, consistent with our finding that 83.4% of cases occurred within identified susceptibility clusters.
Mexico’s earlier success in interrupting endemic measles transmission was documented by Santos et al. (2004), who reported that routine vaccination augmented by mass campaigns achieved >95% two-dose coverage among children aged 1–6 years since 1996, and that surveillance data suggested interruption of indigenous measles virus transmission in 1997[19]. The 2025 outbreak represents the largest setback to elimination efforts in nearly three decades and highlights vulnerabilities that accumulated over years of suboptimal coverage in specific populations. Our finding that Chihuahua had 15 years with MCV1 coverage below 80% since 1990 (including only 65.6% in 2023) is consistent with global patterns. As Do & Mulholland (2025) noted, global coverage with the first dose of measles-containing vaccine has stagnated or declined in recent years, exacerbated by the COVID-19 pandemic, with global MCV1 coverage at only 83% in 2022–2023 and much lower rates in specific populations[1].
Our vaccine effectiveness estimate of 98.2% using the Farrington screening method is consistent with expected values. Measles-containing vaccines are estimated to provide ~93% protection after one dose and ~97% after two doses, and remain highly effective when administered correctly, with two-dose efficacy exceeding 95%[3]. The absence of correlation between state-level vaccination coverage and incidence rates in our analysis does not indicate vaccine failure but reflects the focal nature of transmission in “pockets of susceptibles.” As highlighted by the Local Burden of Disease Vaccine Coverage Collaborators (2021), even when high national vaccination coverage is reported, marginalized, vulnerable, or conflict-affected communities may be missed by vaccination programmes, resulting in substantial subnational variation that state averages cannot capture[47].
Our multivariable model identifying age under 5 years, indigenous status, unvaccinated status, and rural residence as independent risk factors for complications is consistent with global evidence. Gastañaduy et al. (2021) noted that measles complications are most common in children under 5 years and adults over 20 years, with malnutrition, vitamin A deficiency, and limited access to healthcare contributing to severity[9]. The disproportionate mortality among indigenous individuals (76% of deaths despite comprising 30% of cases) in our study reflects the intersection of biological vulnerability, healthcare access barriers, and social marginalization.
This study has several limitations that should be acknowledged. First, vaccination status was self-reported by patients or caregivers and may be subject to recall bias; misclassification could lead to underestimation of vaccine effectiveness if vaccinated cases were incorrectly classified as unvaccinated. Second, the screening method for vaccine effectiveness estimation assumes that cases are representative of the population with respect to vaccination status, an assumption that may not hold in outbreak settings where vaccination campaigns modify coverage differentially across populations. Third, our ecological analyses linking individual cases to municipal-level social determinants may be subject to ecological fallacy; municipal averages may mask important intra-municipal heterogeneity, particularly in large or diverse municipalities. Fourth, the cross-sectional design limits causal inference regarding social determinants and transmission; we cannot definitively establish whether marginalization caused increased transmission or whether common underlying factors explain both. Fifth, genomic data covered only 207 sequences representing approximately 4% of cases; although geographic representation was adequate across 25 states, intra-state transmission dynamics and local clusters at the municipal level could not be identified due to limitations in public data availability. Sixth, complication rates may be underestimated as the surveillance system captures acute complications but may miss delayed sequelae such as subacute sclerosing panencephalitis. Finally, our analyses are limited to the declining phase of the outbreak (through week 52, 2025), and final outbreak characteristics may differ as transmission continues in some regions.
Despite these limitations, our study has strengths. To our knowledge, this is the first comprehensive epidemiological analysis of a large measles outbreak in Latin America that integrates individual-level surveillance data with municipal-level social determinants from eight national databases, enabling analysis of structural factors beyond individual risk factors. The nationwide case-based reporting through the SINAVE surveillance system provides a comprehensive picture of the outbreak across all 32 Mexican states. The inclusion of molecular surveillance data from 207 sequences allowed confirmation of introduction pathways and identification of two independent importation events, advancing understanding of outbreak origins. Our temporal analysis using relative epidemiological weeks normalized to each state's first case provides an approach to understanding outbreak evolution across geographically and temporally diverse regions.
From a regional and international perspective, this study provides a detailed documentation of a three-stage transmission model—introduction through mobile worker networks, amplification in undervaccinated communities, and diffusion to marginalized populations—that may inform outbreak response in other post-elimination settings. The identification of "pockets of susceptibles" at the municipal level offers a methodological framework for surveillance system enhancement in Latin America and globally. For the Mexican context specifically, this study generates evidence on the role of seasonal agricultural workers (jornaleros) as potential transmission bridges between international sources and domestic susceptible populations, a mechanism not previously documented for measles in Mexico. The quantification of vaccine effectiveness at 98.2% using nationally representative data provides reassurance about vaccine quality while emphasizing that the outbreak was driven by coverage gaps rather than vaccine failure.
Several research directions emerge from our findings. First, prospective seroprevalence studies are needed to accurately quantify population immunity at subnational levels, particularly in communities identified as "pockets of susceptibles," to guide targeted vaccination campaigns. Second, qualitative research exploring vaccine decision-making in Mennonite, indigenous, and agricultural worker communities would inform culturally appropriate interventions. Third, mathematical modeling studies could estimate the vaccination coverage required to prevent future outbreaks in the specific demographic and spatial context of northern Mexico, accounting for population mobility and community structure. Fourth, implementation research should evaluate strategies for reaching mobile populations, including seasonal agricultural workers, with vaccination services. Fifth, enhanced molecular surveillance with real-time whole-genome sequencing could enable more precise tracking of transmission chains and earlier identification of new importations. Sixth, economic analyses quantifying the direct and indirect costs of this outbreak would strengthen the case for investment in elimination maintenance. Finally, cross-border surveillance coordination mechanisms between Mexico, the United States, and Canada warrant systematic evaluation to develop sustainable approaches for the post-elimination era.
5. Conclusions
Mexico’s 2025 measles epidemic represents the largest resurgence since the country achieved interruption of endemic transmission and underscores a hard truth of post-elimination settings: national progress can coexist with local vulnerability. In this nationwide linked analysis, transmission was highly focal—concentrated in municipal hot spots and driven predominantly by the accumulation of susceptible individuals rather than vaccine failure, as reflected by very high estimated vaccine effectiveness. Molecular evidence was consistent with at least two introductions, dominated by a D8 lineage with limited contribution from a distinct B3 cluster, highlighting the continued importance of cross-border and genomic surveillance. Beyond virology, the outbreak’s trajectory followed a socially patterned diffusion: early introduction compatible with mobility-linked networks, amplification in undervaccinated communities, and later spread into marginalized and indigenous populations where the burden of complications was disproportionate. At the individual level, severe outcomes clustered among infants and young children, unvaccinated persons, indigenous individuals, and residents of rural municipalities—signals of structural barriers to timely prevention and care. Sustaining elimination in Mexico will require shifting from coverage “averages” to precision public health: identifying and closing municipal pockets of susceptibility, strengthening routine and catch-up vaccination, and deploying culturally safe, community-partnered strategies for indigenous communities and mobile worker populations. Integrating surveillance with sociodemographic indicators can support earlier detection, smarter targeting, and more equitable outbreak control—preventing future resurgences despite ongoing importation pressure.
Supplementary Materials
The following supporting information can be downloaded at: https://www.mdpi.com/article/doi/s1, Supplementary Figure S1: Measles Virus Genotype Distribution in Mexico, Genomic surveillance data from GenBank (2011−2023) and SSA Epidemiological Bulletins (2025); Supplementary Table S1: Data dictionary of variables from linked national open-access databases used in the analysis.; Supplementary Table S2: Demographic and clinical characteristics of confirmed measles cases by age group, Mexico, epidemiological weeks 8–52, 2025. Supplementary Table S3: Demographic and clinical characteristics of confirmed measles cases by complication status, Mexico, epidemiological weeks 8–52, 2025; Supplementary Table S4: Demographic and clinical characteristics of confirmed measles cases by outbreak phase, Mexico 2025; Supplementary Table S5: National vaccination metrics, Mexico measles outbreak 2025; Supplementary Table S6: Vaccine Effectiveness by state (states with >=20 cases); Supplementary Table S7: Risk factors for measles complications: bivariable and multivariable logistic regression analysis, Mexico 2025 (n=6,151).
Author Contributions
Conceptualization, J.C.D.A.-J., P.M.-A., J.B.-R.; methodology, J.C.D.A.-J., P.M.-A., P.N.V-B., J.B.-R.; software, J.B.-R. and O.F.F.-D.; validation, J.C.D.A.-J., P.M.-A., P.N.V-B., J.B.-R.; formal analysis, J.B.-R., P.M.-A., P.N.V-B.; investigation, J.C.D.A.-J., S.S-E., A.M.L.-Y., R.M.D.-N., S.G-P; resources, J.C.D.A.-J., S.S-E., J.B.-R.; data curation, A.M.L.-Y., S.S-E., R.M.D.-N., S.G-P; writing—original draft preparation, J.C.D.A.-J., P.M.-A., O.F.F.-D., A.M.L.-Y., R.M.D.-N., S.G-P; writing—review and editing, J.B.-R., S.S-E., P.N.V-B.; visualization, J.B.-R., P.M.-A., O.F.F.-D.; supervision, J.C.D.A.-J. and J.B.-R.; project administration, J.C.D.A.-J. and J.B.-R. All authors have read and agreed to the published version of the manuscript.
Funding
This research received no external funding.
Institutional Review Board Statement
This study was conducted in accordance with the principles of the Declaration of Helsinki and its subsequent amendments, as well as applicable national regulations and institutional guidelines. Under Mexican regulations (Reglamento de la Ley General de Salud en Materia de Investigación para la Salud, Article 17), research based exclusively on anonymized data from public sources is classified as research without risk. Therefore, formal ethical review and approval were waived because this study involved a secondary analysis of anonymized, publicly available surveillance data collected as part of routine public health activities..
Informed Consent Statement
Informed consent was waived because this retrospective study exclusively used anonymized secondary data from national surveillance systems and publicly available open-access databases. No primary data were collected, there was no direct contact with patients, and no attempts were made to re-identify individuals.
Data Availability Statement
The primary and secondary datasets analyzed in this study are publicly available from official Mexican government open data portals and international repositories. The R scripts used for data linkage, statistical analysis, and figure generation are available from the corresponding author upon request.
Conflicts of Interest
The authors declare no conflicts of interest.
Abbreviations
The following abbreviations are used in this manuscript:
| aOR | Adjusted Odds Ratio |
| AIC | Akaike Information Criterion |
| CFR | Case Fatality Rate |
| CENSIA | Centro Nacional para la Salud de la Infancia y la Adolescencia (National Center for Child and Adolescent Health) |
| CI | Confidence Interval |
| CONAPO | Consejo Nacional de Población (National Population Council) |
| CONEVAL | Consejo Nacional de Evaluación de la Pol√≠tica de Desarrollo Social (National Council for the Evaluation of Social Development Policy) |
| CrI | Credible Interval |
| DALYs | Disability-Adjusted Life Years |
| DGE | Dirección General de Epidemiología (General Directorate of Epidemiology) |
| DGIS | Dirección General de Informaci√≥n en Salud (General Directorate of Health Information) |
| EFEs | Sistema Especial de Vigilancia Epidemiológica de Enfermedades Febriles Exantem√°ticas (Special Surveillance System for Febrile Exanthematous Diseases) |
| ICD-10 | International Classification of Diseases 10th Revision |
| IgM | Immunoglobulin M |
| INEGI | Instituto Nacional de Estadística y Geografía (National Institute of Statistics and Geography) |
| IQR | Interquartile Range |
| IRR | Incidence Rate Ratio |
| LISA | Local Indicators of Spatial Association |
| LOESS | Locally Estimated Scatterplot Smoothing |
| MCV1 | Measles-Containing Vaccine First Dose |
| MMR | Measles-Mumps-Rubella (vaccine) |
| NCBI | National Center for Biotechnology Information |
| NOM | Norma Oficial Mexicana (Mexican Official Standard) |
| OR | Odds Ratio |
| PAF | Population Attributable Fraction |
| PAHO | Pan American Health Organization |
| PCV | Proportion of Cases Vaccinated |
| PPV | Population Proportion Vaccinated |
| R0 | Basic Reproduction Number |
| RR | Relative Risk |
| RT-PCR | Reverse Transcription Polymerase Chain Reaction |
| Rt | Effective Reproduction Number |
| SAEH | Subsistema Automatizado de Egresos Hospitalarios (Automated Hospital Discharge Subsystem) |
| SD | Standard Deviation |
| SE | Semana Epidemiológica (Epidemiological Week) |
| SINAVE | Sistema Nacional de Vigilancia Epidemiológica (National Epidemiological Surveillance System) |
| VE | Vaccine Effectiveness |
| VIF | Variance Inflation Factor |
| WHO | World Health Organization |
References
- Do, L.A.H.; Mulholland, K. Measles 2025. New England Journal of Medicine 2025, 393, 2447–2458. [CrossRef]
- Stoneman, E.K. Measles. JAMA 2025, 334, 1665–1666. [CrossRef]
- Hübschen, J.M.; Gouandjika-Vasilache, I.; Dina, J. Measles. Lancet 2022, 399, 678–690. [CrossRef]
- Bester, J.C. Measles and Measles Vaccination: A Review. JAMA Pediatr 2016, 170, 1209–1215. [CrossRef]
- Chen, W.; Du, M.; Deng, J.; Liu, M.; Liu, J. Global, Regional, and National Trends of Measles Burden and Its Vaccination Coverage among Children under 5 Years Old: An Updated Systematic Analysis from the Global Burden of Disease Study 2021. Int J Infect Dis 2025, 156, 107908. [CrossRef]
- Peltola, H. The History of Measles and Vaccine Development. Acta Paediatr 2025. [CrossRef]
- Laksono, B.M.; de Vries, R.D.; Verburgh, R.J.; Visser, E.G.; de Jong, A.; Fraaij, P.L.A.; Ruijs, W.L.M.; Nieuwenhuijse, D.F.; van den Ham, H.-J.; Koopmans, M.P.G.; et al. Studies into the Mechanism of Measles-Associated Immune Suppression during a Measles Outbreak in the Netherlands. Nat Commun 2018, 9, 4944. [CrossRef]
- Mina, M.J.; Kula, T.; Leng, Y.; Li, M.; de Vries, R.D.; Knip, M.; Siljander, H.; Rewers, M.; Choy, D.F.; Wilson, M.S.; et al. Measles Virus Infection Diminishes Preexisting Antibodies That Offer Protection from Other Pathogens. Science 2019, 366, 599–606. [CrossRef]
- Gastañaduy, P.A.; Goodson, J.L.; Panagiotakopoulos, L.; Rota, P.A.; Orenstein, W.A.; Patel, M. Measles in the 21st Century: Progress Toward Achieving and Sustaining Elimination. J Infect Dis 2021, 224, S420–S428. [CrossRef]
- Mattingly, T.J. Penny Wise, Pound Foolish: The Cost of Reduced Support for Measles Prevention. Vaccine 2025, 65, 127830. [CrossRef]
- Local Burden of Disease Vaccine Coverage Collaborators Mapping Routine Measles Vaccination in Low- and Middle-Income Countries. Nature 2021, 589, 415–419. [CrossRef]
- Masresha, B.G.; Hatcher, C.; Lebo, E.; Tanifum, P.; Bwaka, A.M.; Minta, A.A.; Antoni, S.; Grant, G.B.; Perry, R.T.; O’Connor, P. Progress Toward Measles Elimination - African Region, 2017-2021. MMWR Morb Mortal Wkly Rep 2023, 72, 985–991. [CrossRef]
- Guerra, F.M.; Bolotin, S.; Lim, G.; Heffernan, J.; Deeks, S.L.; Li, Y.; Crowcroft, N.S. The Basic Reproduction Number (R0) of Measles: A Systematic Review. Lancet Infect Dis 2017, 17, e420–e428. [CrossRef]
- Jones, C.E.; Danovaro-Holliday, M.C.; Mwinnyaa, G.; Gacic-Dobo, M.; Francis, L.; Grevendonk, J.; Nedelec, Y.; Wallace, A.; Sodha, S.V.; Sugerman, C. Routine Vaccination Coverage - Worldwide, 2023. MMWR Morb Mortal Wkly Rep 2024, 73, 978–984. [CrossRef]
- Marziano, V.; Bella, A.; Menegale, F.; Del Manso, M.; Petrone, D.; Palamara, A.T.; Pezzotti, P.; Merler, S.; Filia, A.; Poletti, P. Estimating Measles Susceptibility and Transmission Patterns in Italy: An Epidemiological Assessment. Lancet Infect Dis 2025, 25, 1303–1313. [CrossRef]
- Filia, A.; Del Manso, M.; Petrone, D.; Magurano, F.; Gioacchini, S.; Pezzotti, P.; Palamara, A.T.; Bella, A. Surge in Measles Cases in Italy from August 2023 to January 2025: Characteristics of Cases and Public Health Relevance. Vaccines (Basel) 2025, 13, 663. [CrossRef]
- Rey-Benito, G.; Pastor, D.; Whittembury, A.; Durón, R.; Pacis-Tirso, C.; Bravo-Alcántara, P.; Ortiz, C.; Andrus, J. Sustaining the Elimination of Measles, Rubella and Congenital Rubella Syndrome in the Americas, 2019-2023: From Challenges to Opportunities. Vaccines (Basel) 2024, 12, 690. [CrossRef]
- Carnalla, M.; Gaspar-Castillo, C.; Dimas-González, J.; Aparicio-Antonio, R.; Justo-Berrueta, P.S.; López-Martínez, I.; Shamah-Levy, T.; Lazcano-Ponce, E.; Barrientos-Gutiérrez, T.; Alpuche-Aranda, C.M.; et al. A Population-Based Measles Serosurvey in Mexico: Implications for Re-Emergence. Vaccine 2025, 51, 126886. [CrossRef]
- Santos, J.I.; Nakamura, M.A.; Godoy, M.V.; Kuri, P.; Lucas, C.A.; Conyer, R.T. Measles in Mexico, 1941-2001: Interruption of Endemic Transmission and Lessons Learned. J Infect Dis 2004, 189 Suppl 1, S243-250. [CrossRef]
- Hersh, B.S.; Tambini, G.; Nogueira, A.C.; Carrasco, P.; de Quadros, C.A. Review of Regional Measles Surveillance Data in the Americas, 1996-99. Lancet 2000, 355, 1943–1948. [CrossRef]
- Masters, N.B.; Eisenberg, M.C.; Delamater, P.L.; Kay, M.; Boulton, M.L.; Zelner, J. Fine-Scale Spatial Clustering of Measles Nonvaccination That Increases Outbreak Potential Is Obscured by Aggregated Reporting Data. Proc Natl Acad Sci U S A 2020, 117, 28506–28514. [CrossRef]
- Robert, A.; Kucharski, A.J.; Funk, S. The Impact of Local Vaccine Coverage and Recent Incidence on Measles Transmission in France between 2009 and 2018. BMC Med 2022, 20, 77. [CrossRef]
- Rivadeneira, M.F.; Bassanesi, S.L.; Fuchs, S.C. Socioeconomic Inequalities and Measles Immunization Coverage in Ecuador: A Spatial Analysis. Vaccine 2018, 36, 5251–5257. [CrossRef]
- Fene, F.; Johri, M.; Michel, M.E.; Reyes-Morales, H.; Pelcastre-Villafuerte, B.E. Multiple Deprivations as Drivers of Suboptimal Basic Child Vaccination in Latin America and the Caribbean: Cross-Sectional Analysis of Household Survey Data for 18,136 Children across 211 Regions in 15 Countries. Int J Equity Health 2025, 24, 184. [CrossRef]
- Secretaría de Salud Datos Abiertos - Dirección General de Epidemiología [Internet] 2025.
- Salud, S. de Norma Oficial Mexicana NOM017 SSA2 2012 y Manuales para la Vigilancia Epidemiológica Available online: http://www.gob.mx/salud/documentos/manuales-para-la-vigilancia-epidemiologica-102563 (accessed on 28 December 2025).
- Lineamientos Para La Vigilancia Por Laboratorio de La Enfermedad Febril Exantemática.
- Egresos Hospitalarios Available online: http://dgis.salud.gob.mx/contenidos/basesdedatos/bdc_egresoshosp_gobmx.html (accessed on 28 December 2025).
- Índices de Marginación - Base de Datos - Datos.Gob.Mx Available online: https://datos.gob.mx/dataset/indices_marginacion (accessed on 28 December 2025).
- Índice Rezago Social 2020 Available online: https://www.coneval.org.mx/Medicion/IRS/Paginas/Indice_Rezago_Social_2020.aspx (accessed on 28 December 2025).
- Población, C.N. de Índices de intensidad migratoria México-Estados Unidos 2020 Available online: http://www.gob.mx/conapo/documentos/indices-de-intensidad-migratoria-mexico-estados-unidos-2020 (accessed on 11 January 2026).
- Geografía(INEGI), I.N. de E. y Censo Agropecuario (CA) 2022 Available online: https://www.inegi.org.mx/programas/ca/2022/#datos_abiertos (accessed on 28 December 2025).
- Catálogo Nacional de Indicadores Available online: https://www.snieg.mx/cni/escenario.aspx?idOrden=1.4&ind=6300000008&gen=143&d=n (accessed on 28 December 2025).
- GenBank Overview Available online: https://www.ncbi.nlm.nih.gov/genbank/ (accessed on 28 December 2025).
- Salud, S. de BoletínEpidemiológico Sistema Nacional de Vigilancia Epidemiológica Sistema Único de Información Available online: http://www.gob.mx/salud/documentos/boletinepidemiologico-sistema-nacional-de-vigilancia-epidemiologica-sistema-unico-de-informacion (accessed on 28 December 2025).
- Plataforma Nacional de Datos Abiertos Available online: https://www.datos.gob.mx (accessed on 28 December 2025).
- Lessler, J.; Reich, N.G.; Brookmeyer, R.; Perl, T.M.; Nelson, K.E.; Cummings, D.A.T. Incubation Periods of Acute Respiratory Viral Infections: A Systematic Review. Lancet Infect Dis 2009, 9, 291–300. [CrossRef]
- PAHO Calls for Regional Action as the Americas Lose Measles Elimination Status - PAHO/WHO | Pan American Health Organization Available online: https://www.paho.org/en/news/10-11-2025-paho-calls-regional-action-americas-lose-measles-elimination-status?utm_source=chatgpt.com (accessed on 11 January 2026).
- Grenfell, B.T.; Bjørnstad, O.N.; Kappey, J. Travelling Waves and Spatial Hierarchies in Measles Epidemics. Nature 2001, 414, 716–723. [CrossRef]
- Rivadeneira, M.F.; Bassanesi, S.L.; Fuchs, S.C. Role of Health Determinants in a Measles Outbreak in Ecuador: A Case-Control Study with Aggregated Data. BMC Public Health 2018, 18, 269. [CrossRef]
- Ten Countries in the Americas Report Measles Outbreaks in 2025 - PAHO/WHO | Pan American Health Organization Available online: https://www.paho.org/en/news/15-8-2025-ten-countries-americas-report-measles-outbreaks-2025 (accessed on 7 January 2026).
- Lanke, R.; Chimurkar, V. Measles Outbreak in Socioeconomically Diverse Sections: A Review. Cureus 16, e62879. [CrossRef]
- Pasadyn, F.; Mamo, N.; Caplan, A. Battling Measles: Shifting Strategies to Meet Emerging Challenges and Inequities. Ethics, Medicine and Public Health 2025, 33, 101047. [CrossRef]
- Mathis, A.D. Measles Update — United States, January 1–April 17, 2025. MMWR Morb Mortal Wkly Rep 2025, 74. [CrossRef]
- Measles Outbreak – August 12, 2025 | Texas DSHS Available online: https://www.dshs.texas.gov/news-alerts/measles-outbreak-2025?utm_source=chatgpt.com (accessed on 11 January 2026).
- Hewitt, G.-L.; Obeid, A.; Fischer, P.R. Measles Outbreaks in the United States in 2025: Practice, Policy, and the Canary in the Coalmine. New Microbes New Infect 2025, 65, 101591. [CrossRef]
- Sbarra, A.N.; Rolfe, S.; Nguyen, J.Q.; Earl, L.; Galles, N.C.; Marks, A.; Abbas, K.M.; Abbasi-Kangevari, M.; Abbastabar, H.; Abd-Allah, F.; et al. Mapping Routine Measles Vaccination in Low- and Middle-Income Countries. Nature 2021, 589, 415–419. [CrossRef]
Figure 1.
Measles outbreak overview — Mexico, epidemiological weeks 8–52, 2025. (A) Geographic distribution of confirmed cases showing municipal incidence rates per 100,000 population. (B) National epidemic curve by epidemiological week. (C) State-level epidemic curves ordered by total case count.
Figure 1.
Measles outbreak overview — Mexico, epidemiological weeks 8–52, 2025. (A) Geographic distribution of confirmed cases showing municipal incidence rates per 100,000 population. (B) National epidemic curve by epidemiological week. (C) State-level epidemic curves ordered by total case count.
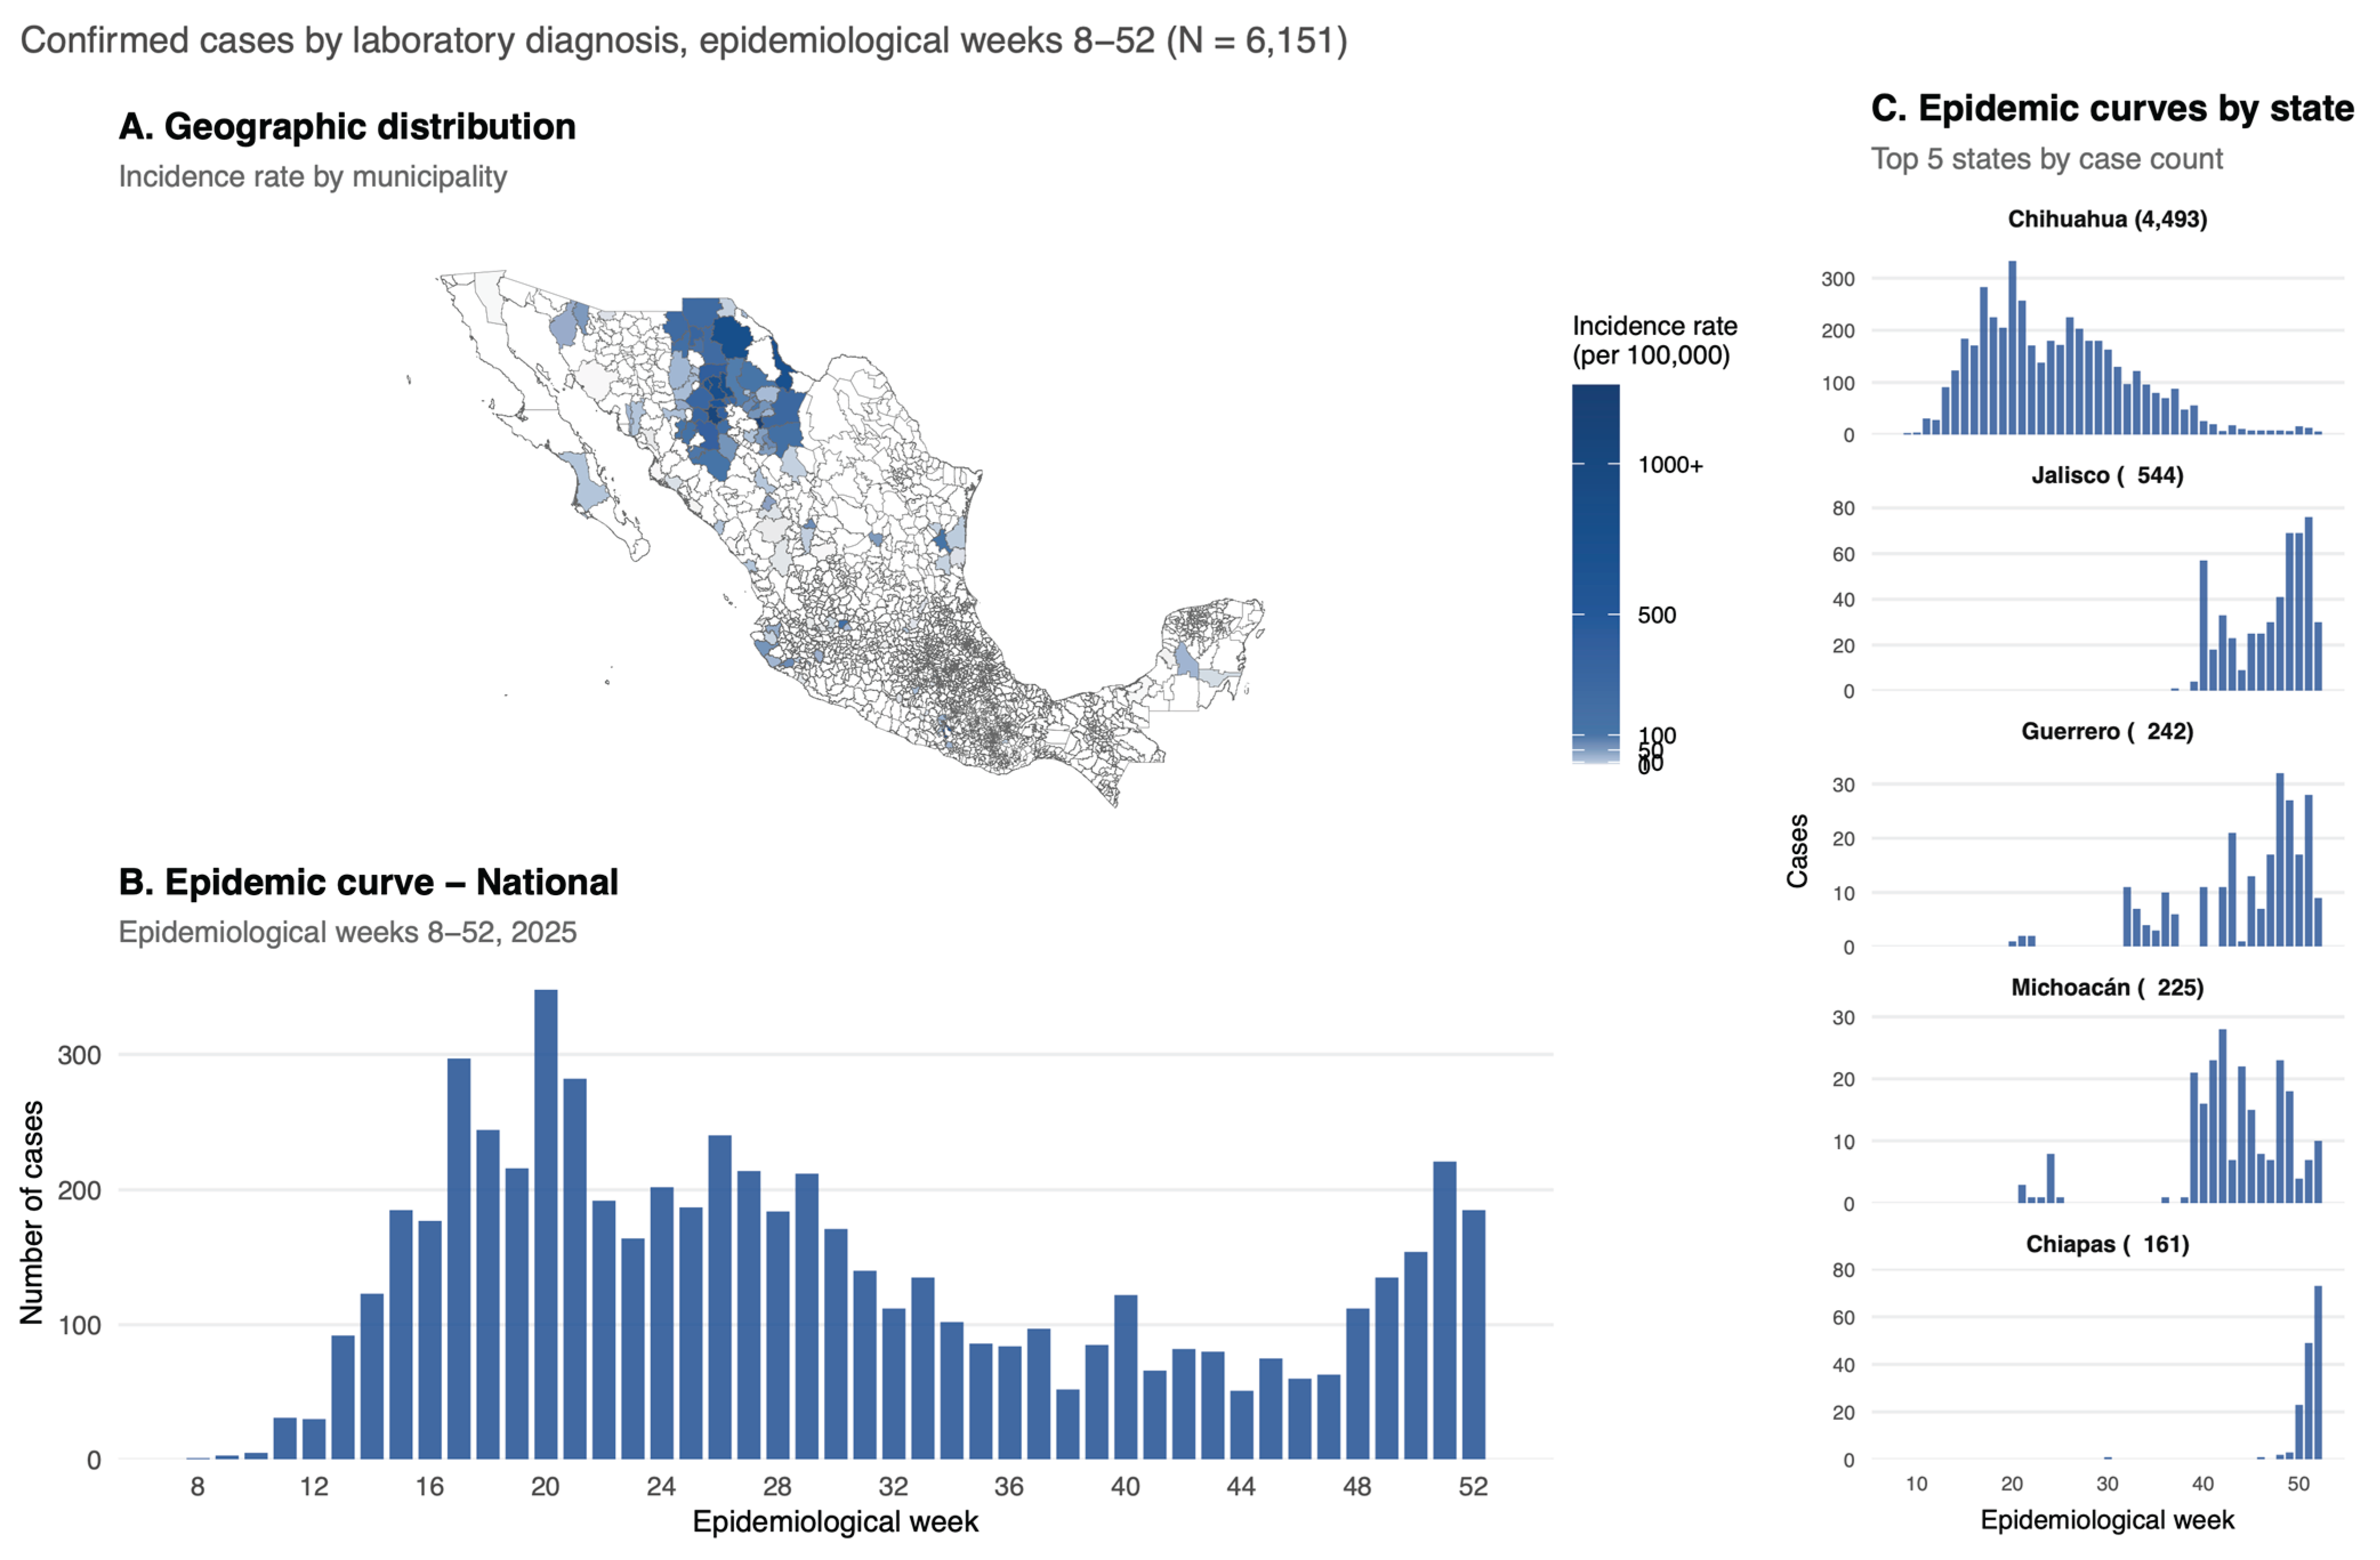
Figure 2.
Effective reproduction number (Rt) dynamics during the measles outbreak — Mexico, 2025. (A) National Rt estimates showing peak transmission in mid-March and subsequent decline below the epidemic threshold (dashed red line, Rt = 1). (B) Comparison of national and Chihuahua-specific Rt trajectories, demonstrating the dominant contribution of Chihuahua to overall epidemic dynamics. (C) State-level Rt estimates for the five most affected states, showing distinct temporal patterns of outbreak introduction and transmission. Shaded areas represent 95% credible intervals. Serial interval assumed at 11.7 days (SD: 2.0 days).
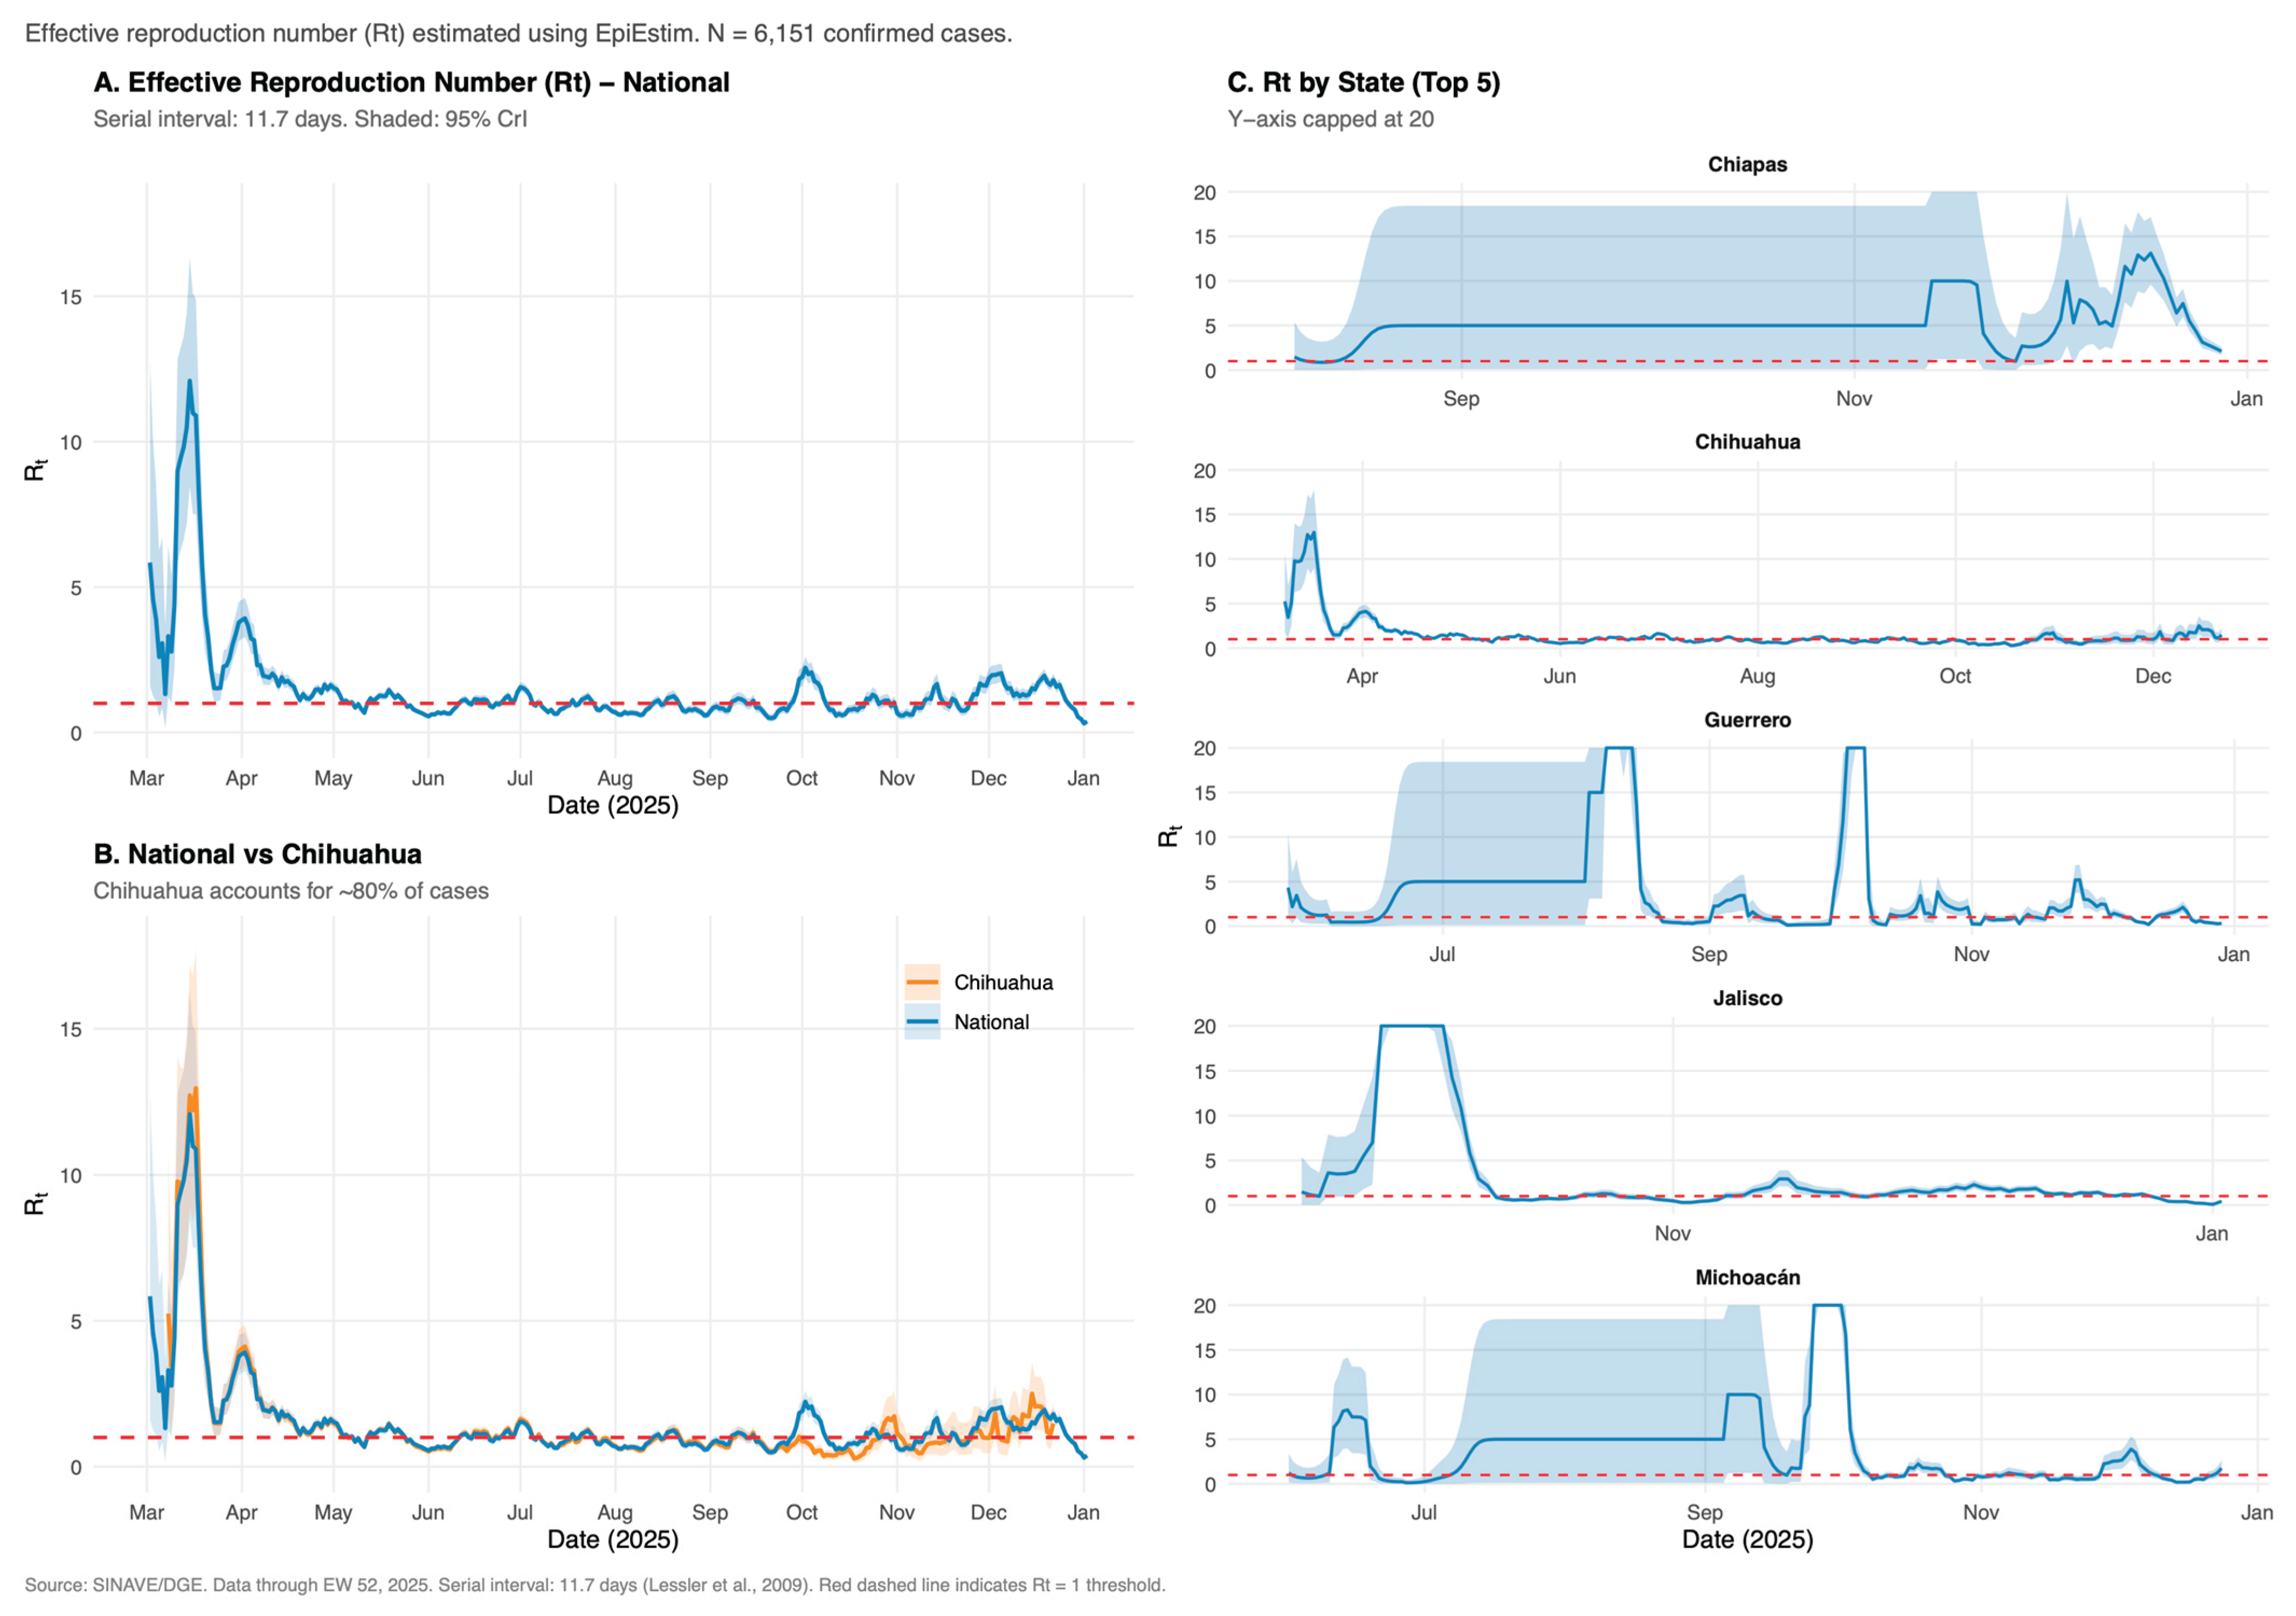
Figure 3.
Spatial analysis of measles outbreak — Mexico, 2025. (A) National map showing LISA cluster classification at municipal level. Hot spots (High-High clusters) shown in red; spatial outliers (Low-High) in orange. (B) Detail of Chihuahua state showing 43 hot spot municipalities concentrated in the Sierra Tarahumara region. (C) Moran scatter plot displaying relationship between municipal incidence rate and local spatial autocorrelation. (D) Temporal-spatial spread pattern showing relationship between epidemiological week of first case and distance from the outbreak epicenter.
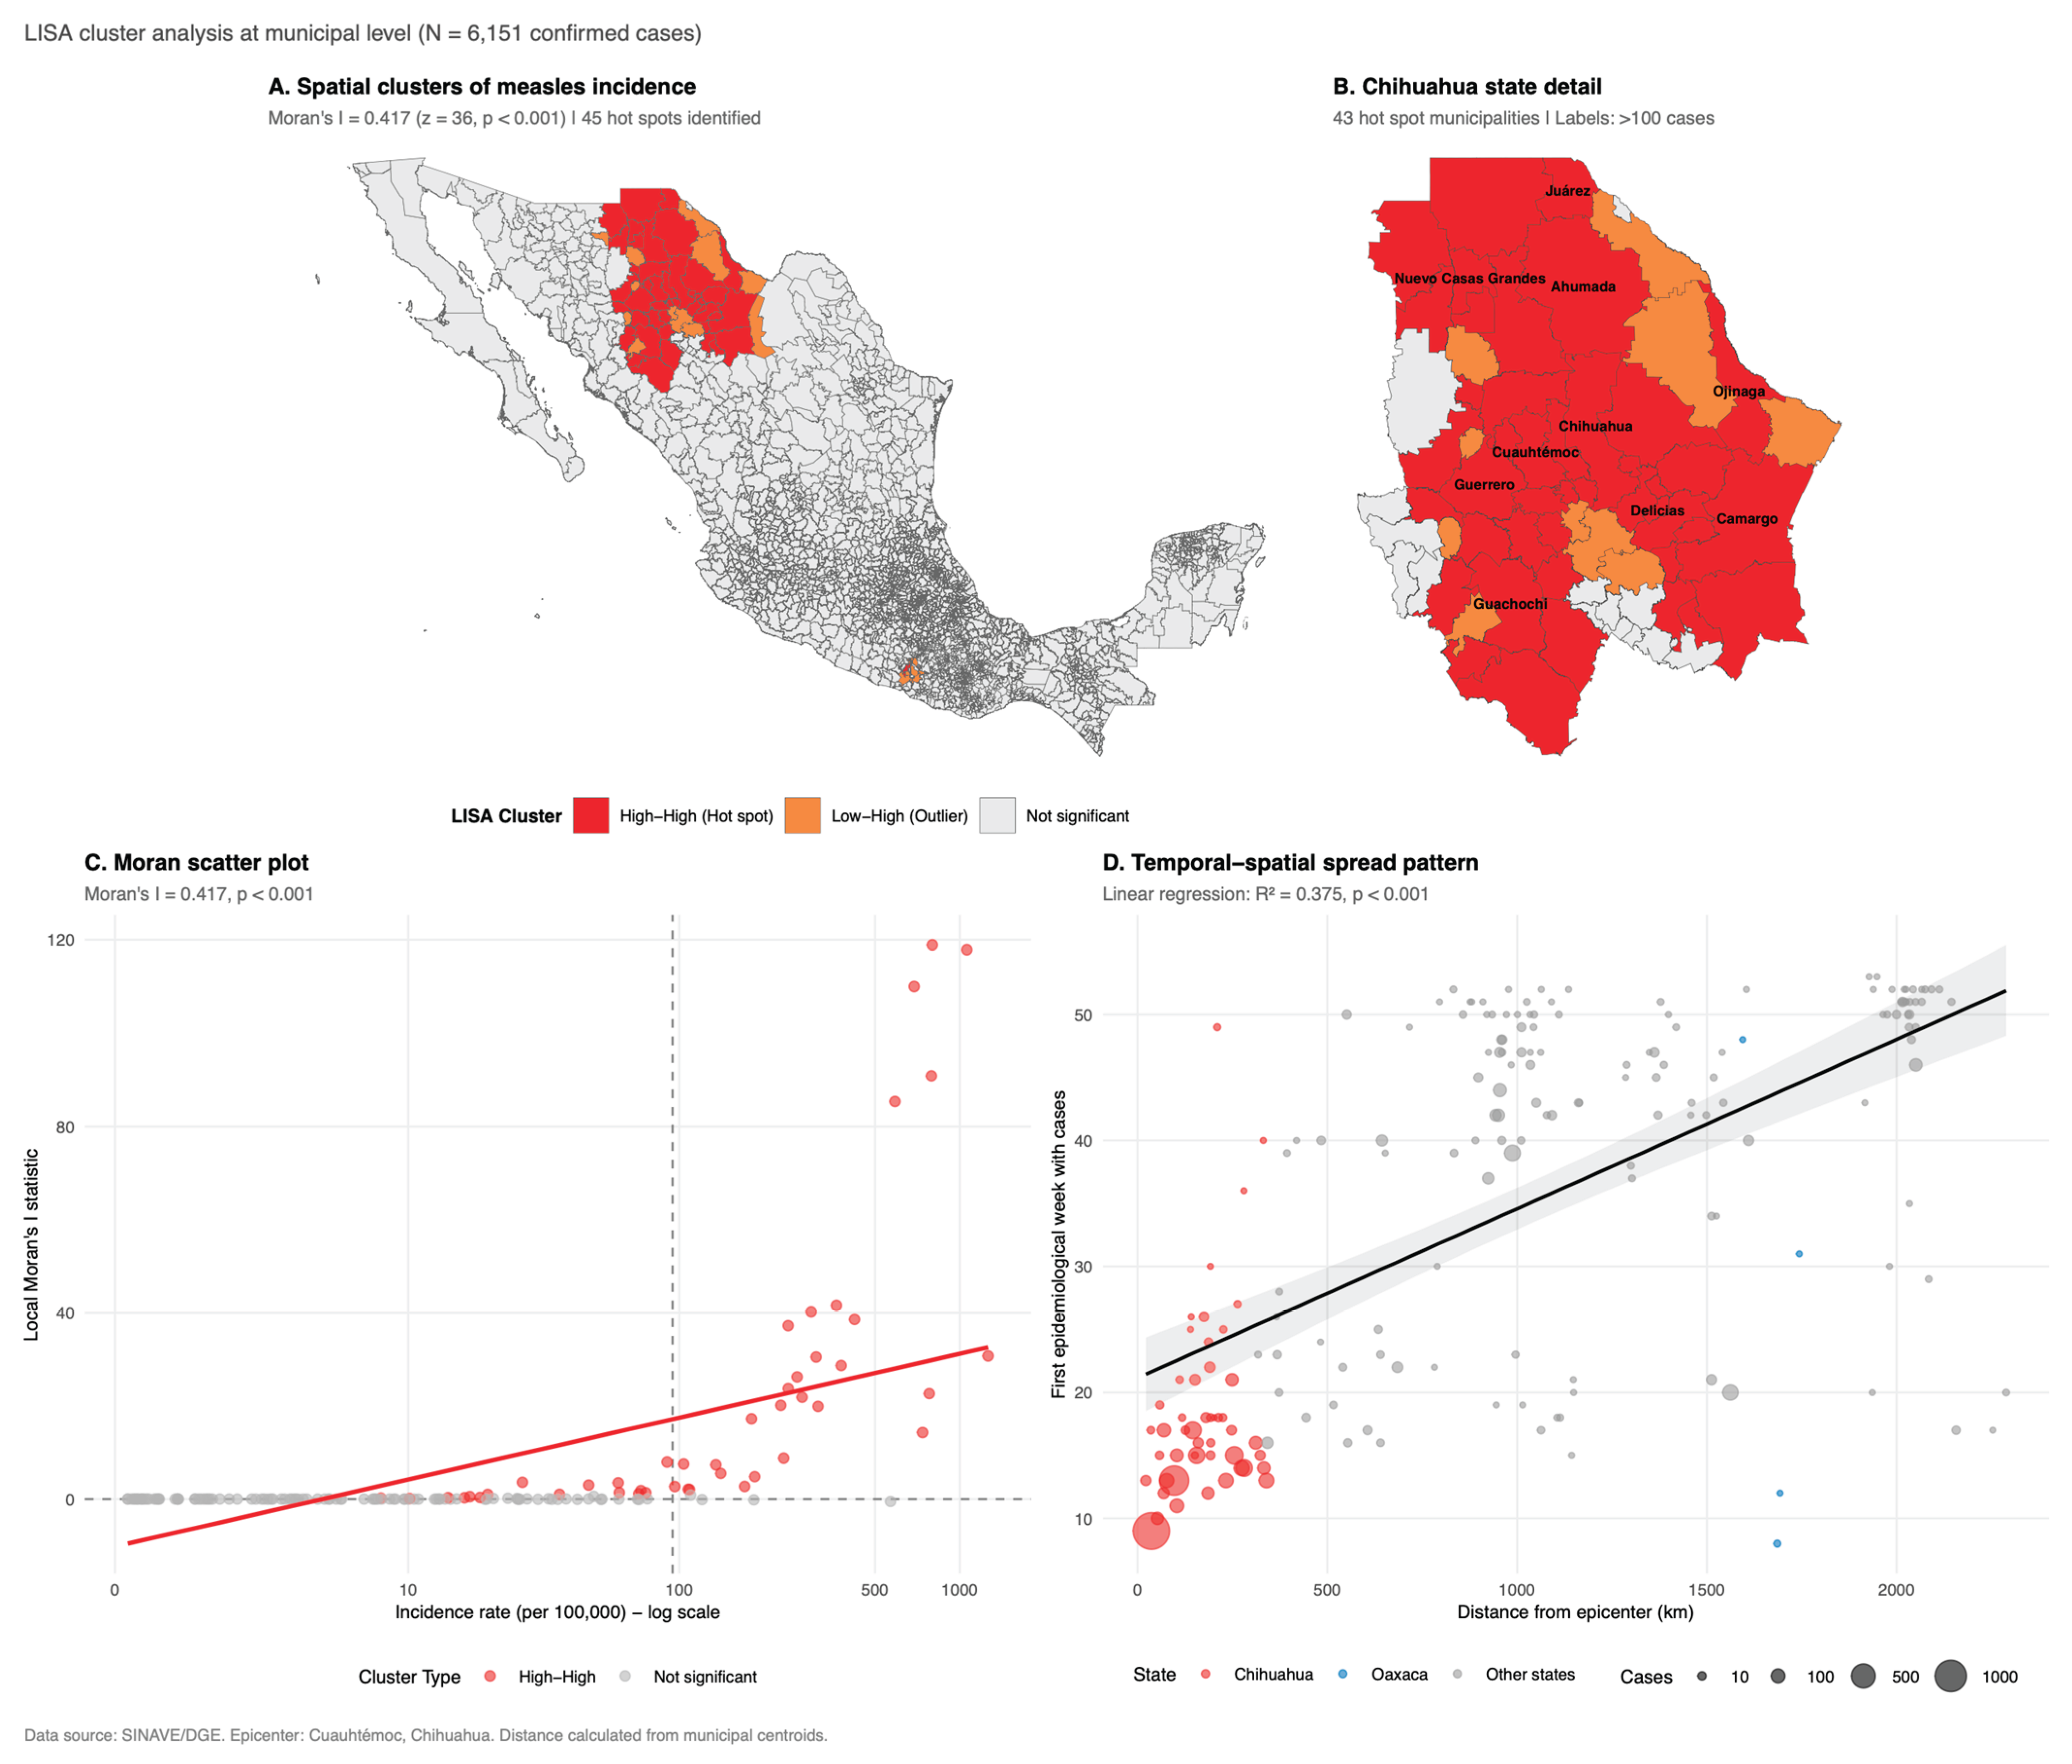
Figure 4.
Temporal dynamics of social determinants during the measles outbreak, Mexico 2025. (A) Weekly epidemic curve (blue bars) overlaid with LOESS-smoothed trends (95% CI shaded) for nine municipal-level social indicators by relative epidemiological week. Dashed vertical lines indicate outbreak phase boundaries. (B) Incidence rate ratios (IRR) with 95% confidence intervals from negative binomial regression; red points indicate p < 0.05; reference category: very low marginalization. (C) Mean percentage of agricultural production units employing seasonal workers (jornaleros) by relative week, showing a U-shaped pattern (Spearman ρ = 0.08, p = 0.67). (D) Percentage of indigenous cases by relative week (Spearman ρ = 0.90, p < 0.001). (E) Percentage of cases with complications by relative week (Spearman ρ = 0.73, p < 0.001). Relative week 1 = first confirmed case in each state.
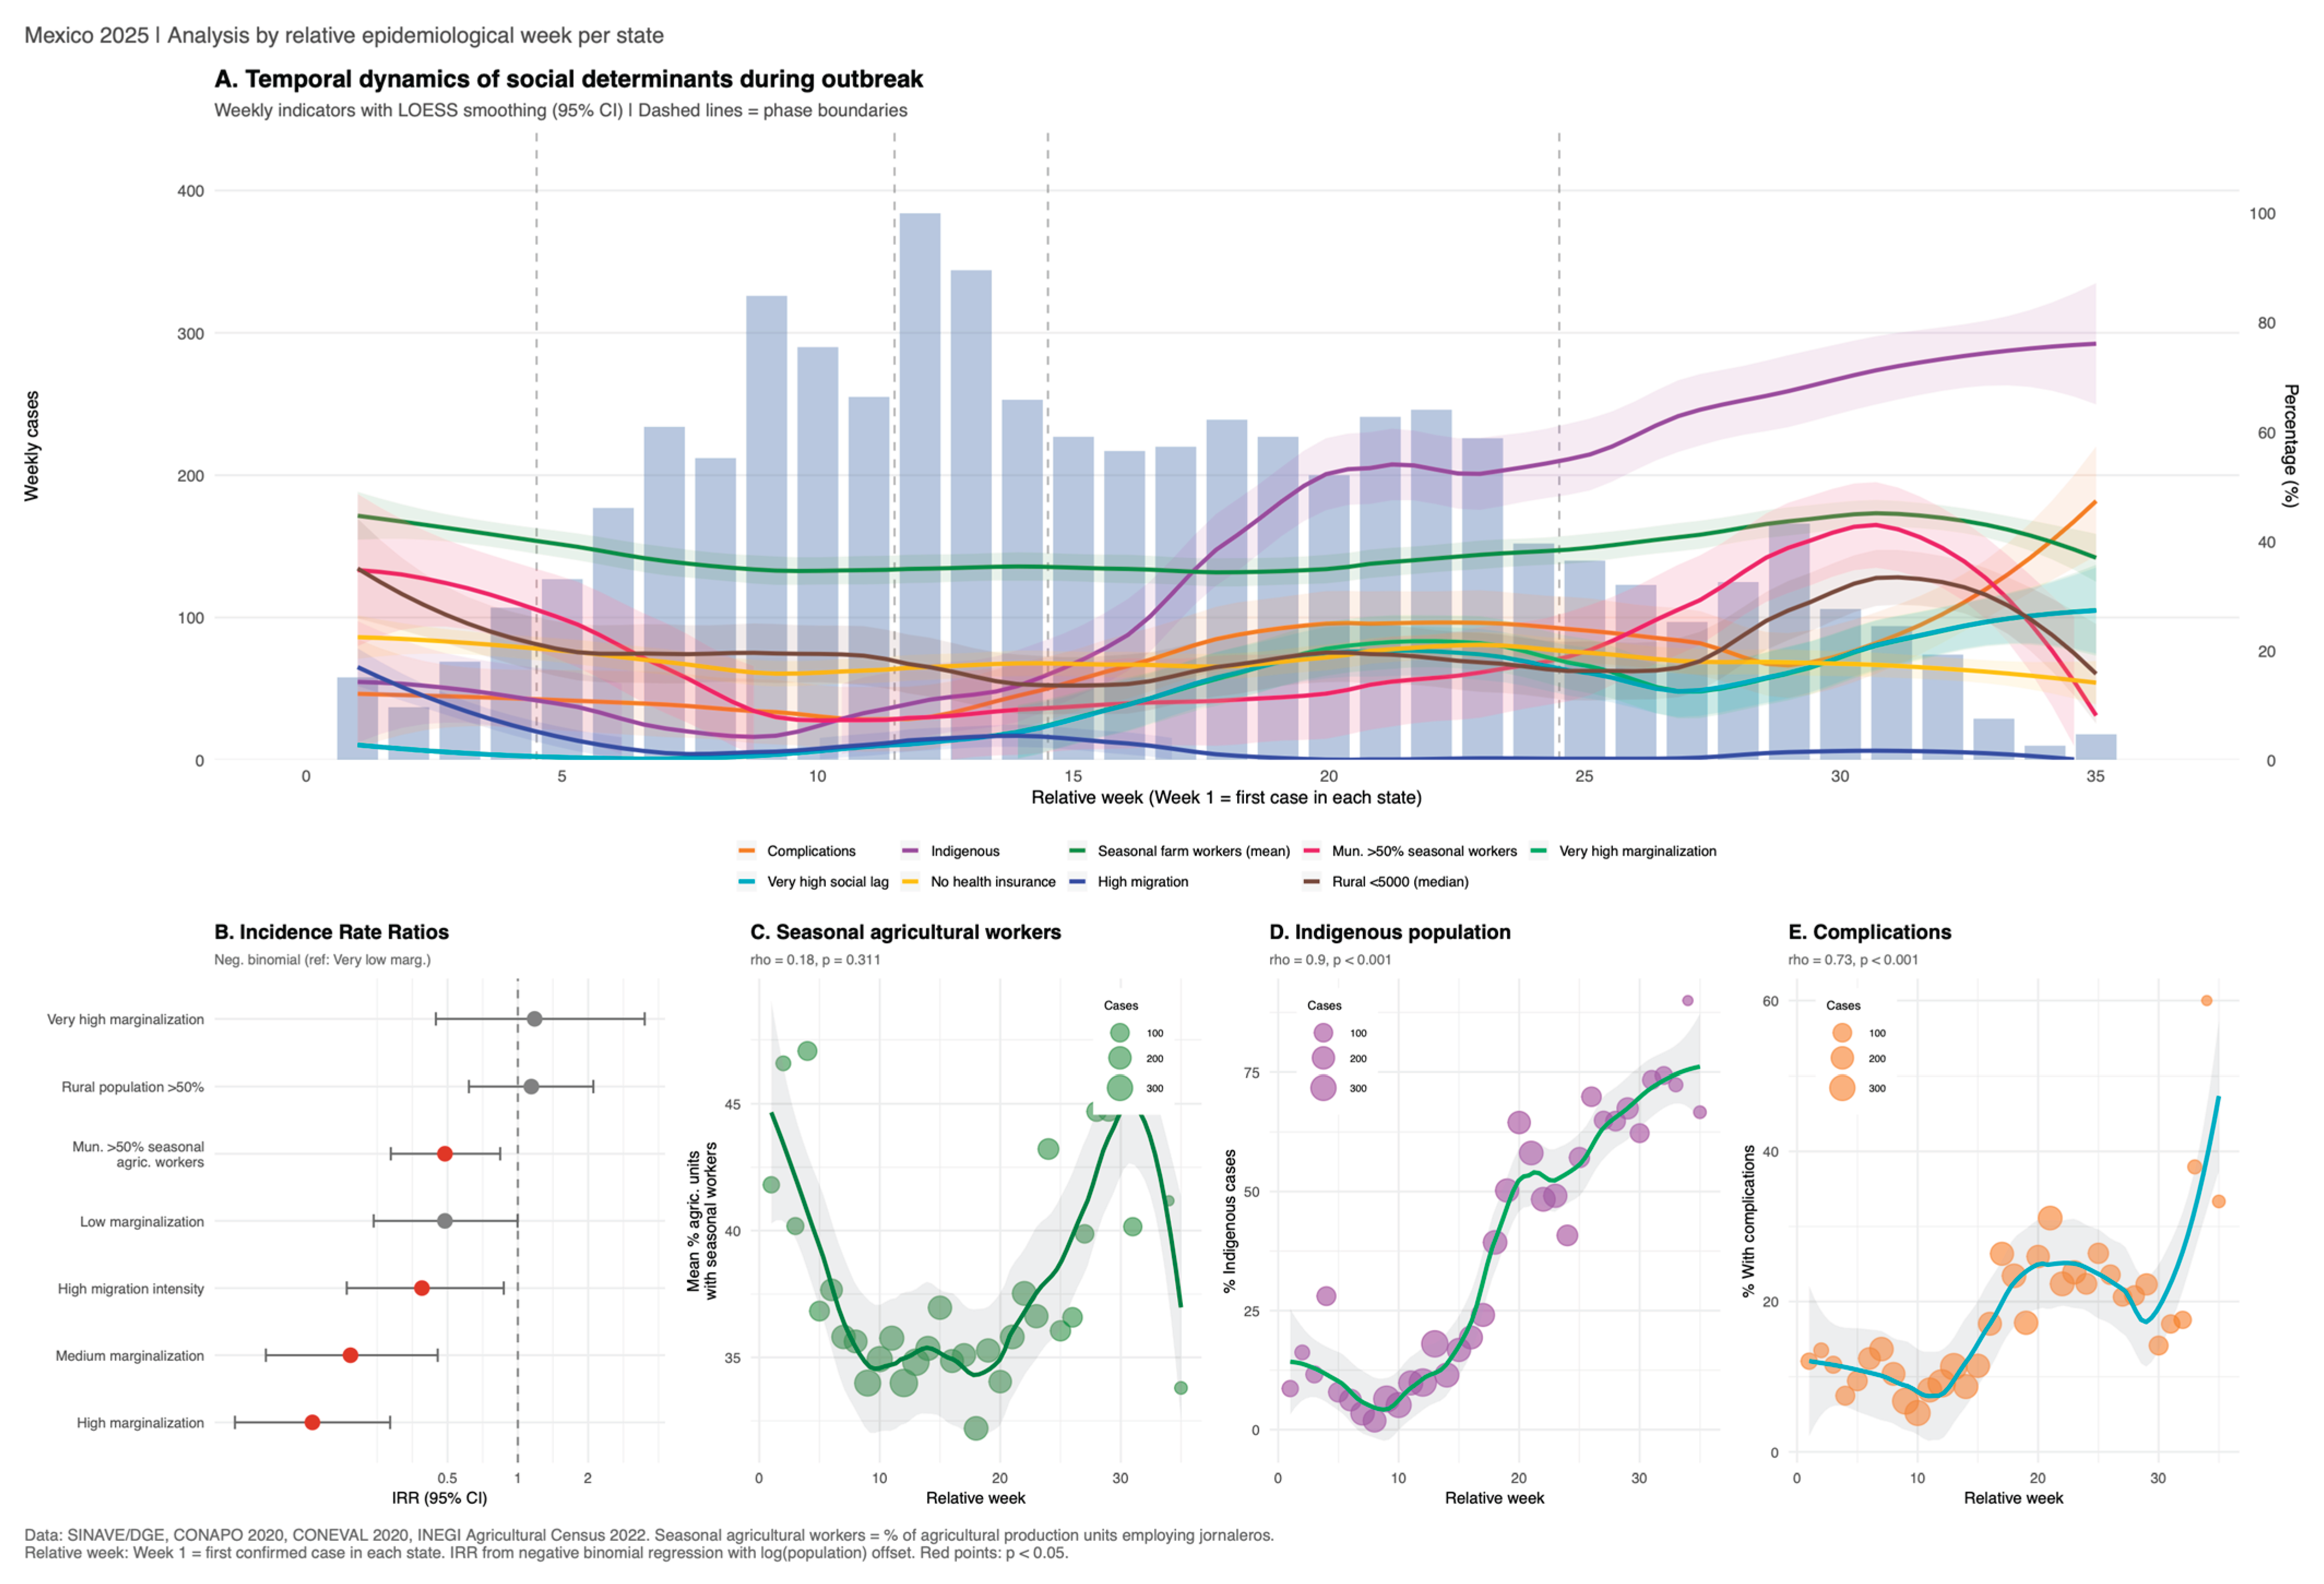
Figure 5.
Pockets of susceptibles: municipality-level vaccination gaps during the measles outbreak, Mexico 2025. (A) Distribution of confirmed cases by proportion of unvaccinated cases at the municipality level (municipalities with ≥10 cases; 83.1% of cases occurred in municipalities where ≥80% were unvaccinated). (B) Relationship between unvaccinated proportion and case count by municipality, with color indicating indigenous population proportion. (C) Top 15 municipalities ranked by case count, showing proportion of unvaccinated cases.

Figure 6.
Molecular epidemiology of the 2025 measles outbreak in Mexico. (A) Geographic distribution of circulating genotypes: D8 (98.1%) in blue, B3 (1.9%) in red (Oaxaca only). (B) Moran scatter plot demonstrating significant spatial autocorrelation of epidemiological week of onset (I = 0.562, p < 0.0001), confirming contagious diffusion. (C) Linear relationship between distance from epicenter (Chihuahua) and week of first case (R² = 0.754); Oaxaca (B3) appears as outlier. (D) Mean propagation speed by region showing faster spread in the North (291 km/week) compared to Central (156 km/week) and South (142 km/week). The national mean propagation speed for genotype D8 was 194.8 km/week, calculated as a population-weighted average across regions.
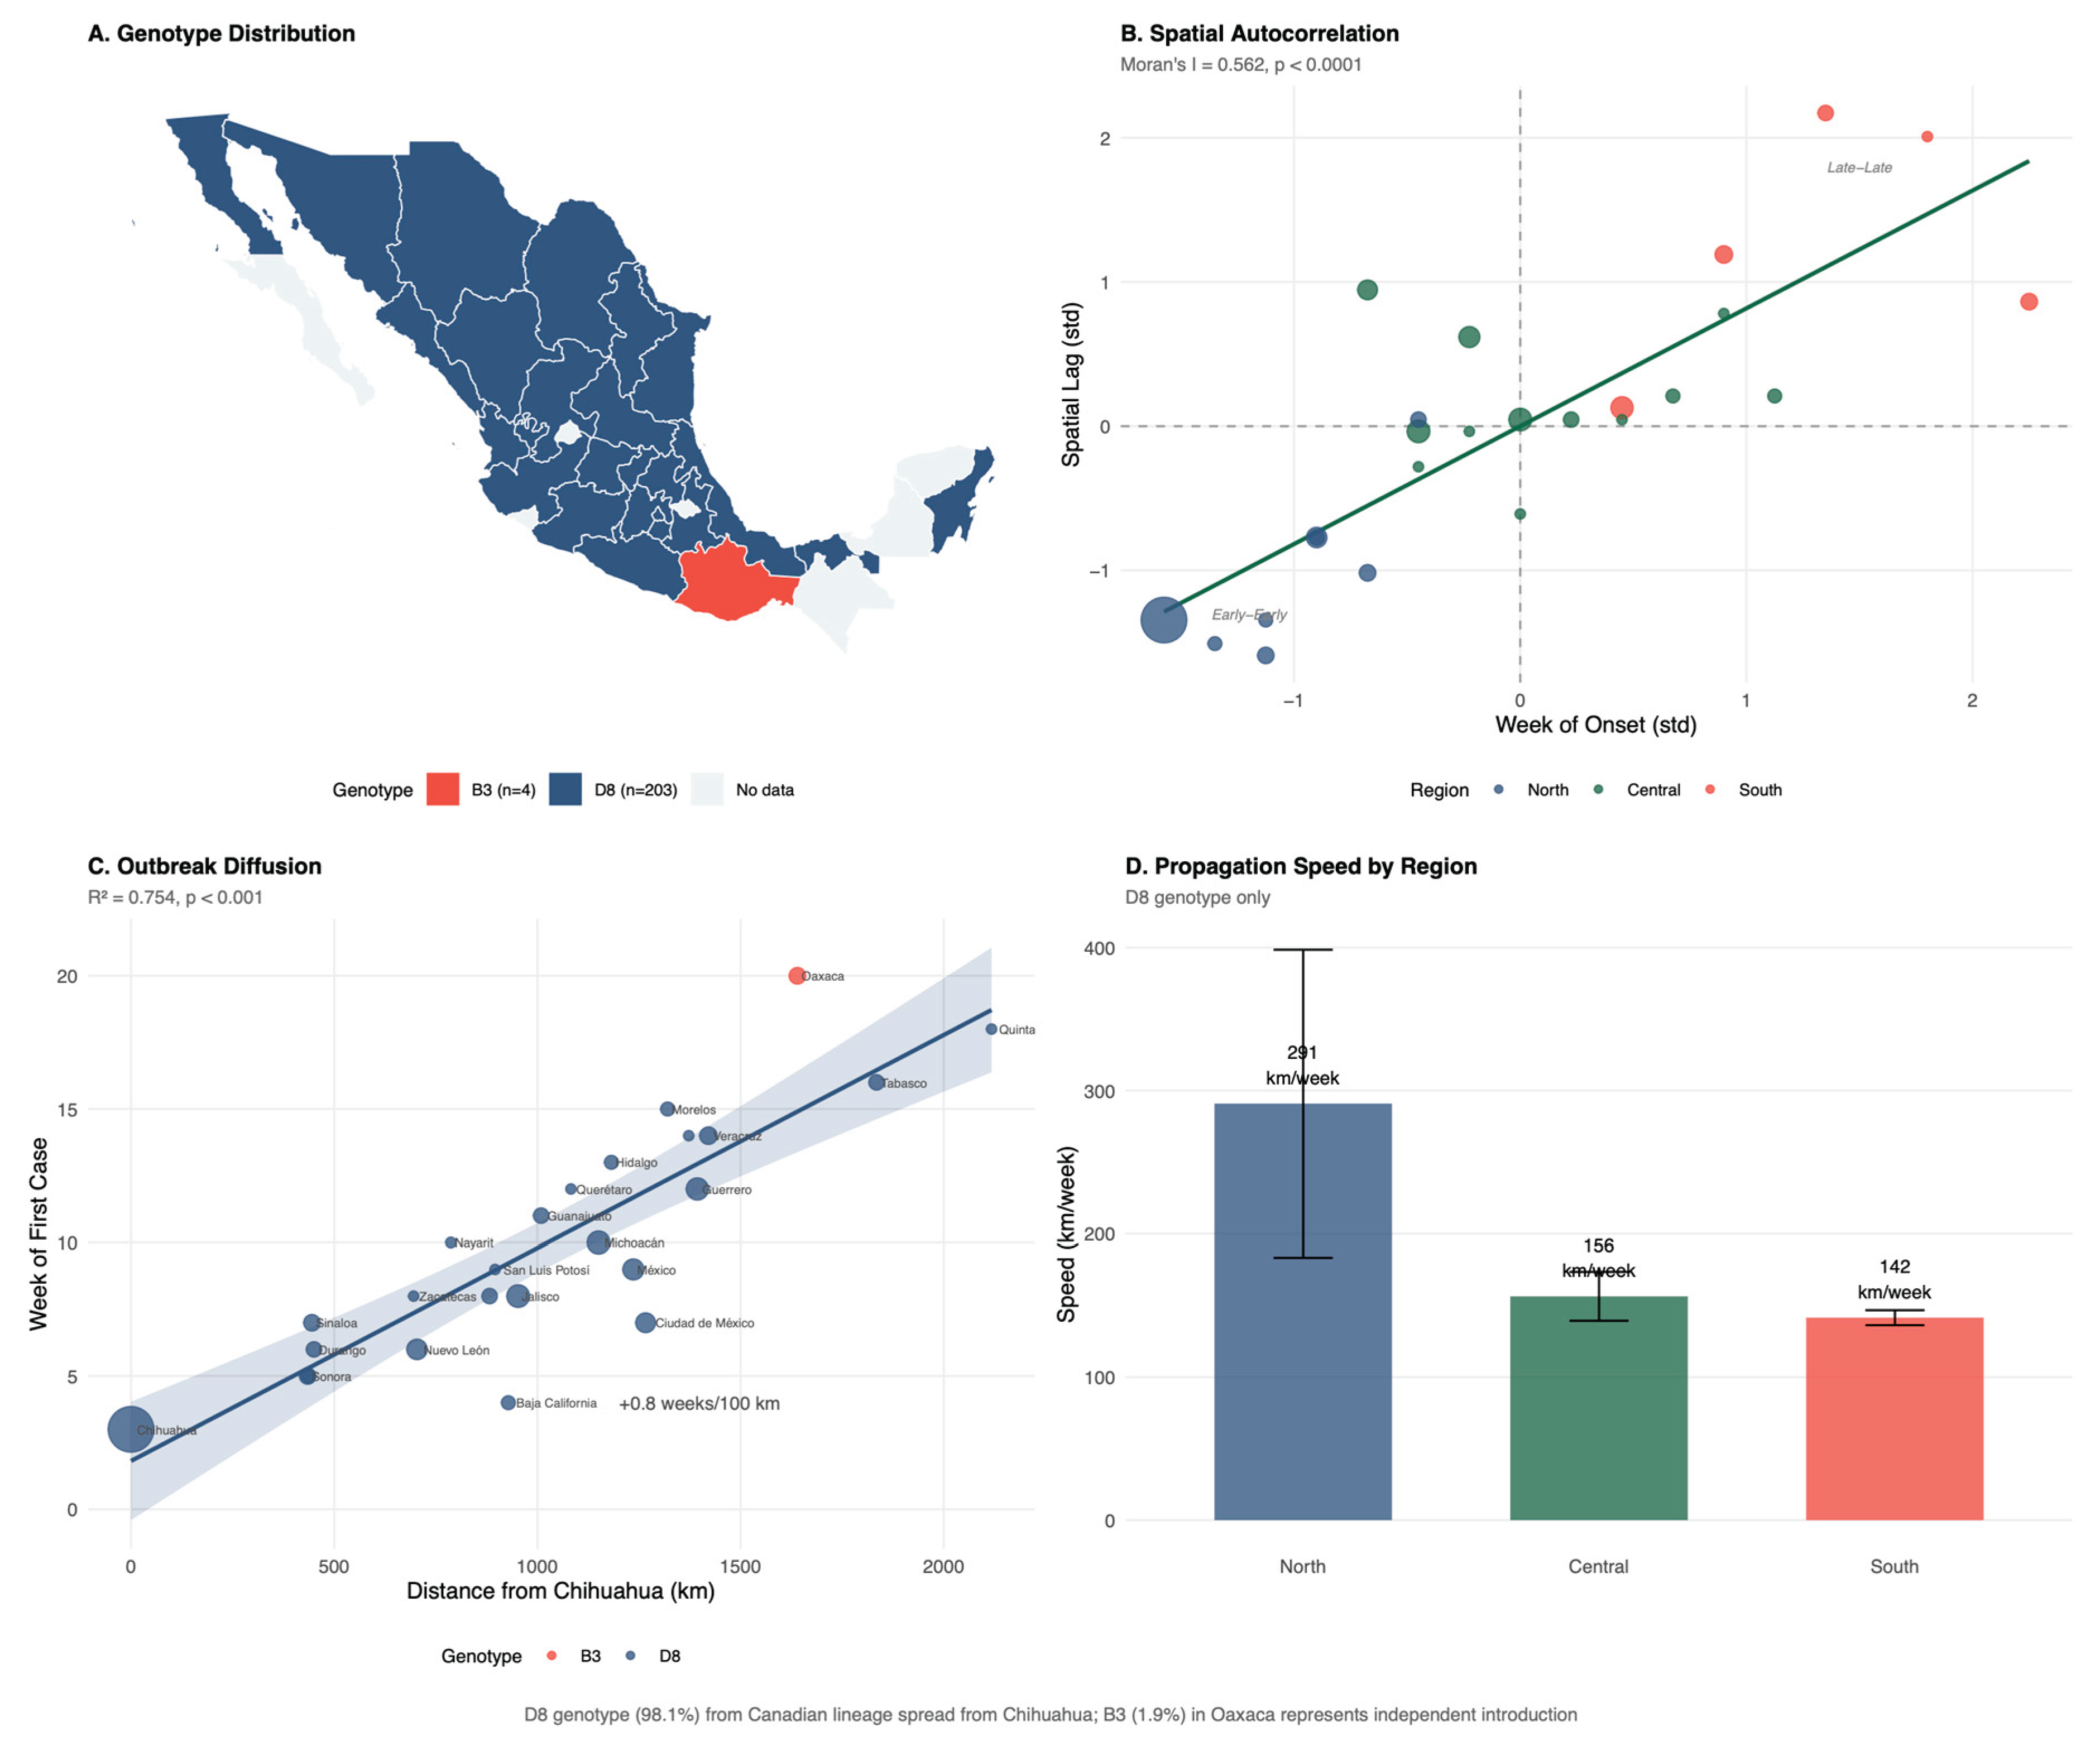

Table 1.
Demographic and clinical characteristics of confirmed measles cases by geographic concentration, Mexico, epidemiological weeks 8–52, 2025.
Table 1.
Demographic and clinical characteristics of confirmed measles cases by geographic concentration, Mexico, epidemiological weeks 8–52, 2025.
| Characteristic | Chihuahua N = 44931 |
Other States N = 16581 |
Total N = 61511 |
p-value2 |
|---|---|---|---|---|
| Age, years | 20 (4, 31) | 11 (4, 23) | 17 (4, 29) | <0.001 |
| Age group | <0.001 | |||
| <1 year | 490 (10.9%) | 151 (9.1%) | 641 (10.4%) | |
| 1-4 years | 642 (14.3%) | 300 (18.1%) | 942 (15.3%) | |
| 5-9 years | 381 (8.5%) | 299 (18.0%) | 680 (11.1%) | |
| 10-19 years | 683 (15.2%) | 411 (24.8%) | 1094 (17.8%) | |
| 20-39 years | 1865 (41.5%) | 414 (25.0%) | 2279 (37.1%) | |
| ≥40 years | 432 (9.6%) | 83 (5.0%) | 515 (8.4%) | |
| Sex | 0.036 | |||
| Female | 2158 (48.0%) | 847 (51.1%) | 3,005 (48.9%) | |
| Male | 2335 (52.0%) | 811 (48.9%) | 3,146 (51.1%) | |
| Vaccination status | <0.001 | |||
| Unvaccinated | 3907 (87.0%) | 1,376 (83.0%) | 5283 (85.9%) | |
| Vaccinated | 586 (13.0%) | 282 (17.0%) | 868 (14.1%) | |
| Indigenous status | 1246 (27.7%) | 639 (38.5%) | 1885 (30.6%) | <0.001 |
| Case origin | <0.001 | |||
| Import-related | 3515 (78.2%) | 386 (23.3%) | 3901 (63.4%) | |
| Imported | 9 (0.2%) | 209 (12.6%) | 218 (3.5%) | |
| Unknown source | 969 (21.6%) | 1,063 (64.1%) | 2032 (33.0%) | |
| Complications | 859 (19.1%) | 147 (8.9%) | 1006 (16.4%) | <0.001 |
| Death | 23 (0.5%) | 2 (0.1%) | 25 (0.4%) | 0.056 |
1Median (Q1, Q3); n (%), 2Wilcoxon rank sum test; Pearson's Chi-squared test.
Table 2.
Municipal-level social determinants in municipalities with and without confirmed measles cases, Mexico 2025.
Table 2.
Municipal-level social determinants in municipalities with and without confirmed measles cases, Mexico 2025.
| Municipality status | ||||
| Variable |
Overall N = 24691 |
No cases N = 22501 |
With cases N = 2191 |
p-value2 |
| Population | <0.001 | |||
| Median (Q1, Q3) | 13,552.0 (4489.0, 35,284.0) | 12,290.0 (4128.0, 30,639.0) | 39,656.5 (16,621.0, 149,684.5) | |
| Mean (SD) | 51,038.5 (146,990.7) | 39,476.0 (114,285.1) | 171,641.6 (308,543.3) | |
| Marginalization Index (0-100) | <0.001 | |||
| Median (Q1, Q3) | 0.9 (0.8, 0.9) | 0.8 (0.8, 0.9) | 0.9 (0.8, 0.9) | |
| Mean (SD) | 0.8 (0.1) | 0.8 (0.1) | 0.9 (0.1) | |
| Marginalization Degree | <0.001 | |||
| Very low | 655 (26.5%) | 544 (24.1%) | 111 (51.4%) | |
| Low | 530 (21.5%) | 493 (21.9%) | 37 (17.1%) | |
| Medium | 494 (20.0%) | 473 (21.0%) | 21 (9.7%) | |
| High | 586 (23.7%) | 567 (25.2%) | 19 (8.8%) | |
| Very high | 204 (8.3%) | 176 (7.8%) | 28 (13.0%) | |
| Illiteracy rate (%) | <0.001 | |||
| Median (Q1, Q3) | 8.2 (4.4, 13.8) | 8.4 (4.7, 13.9) | 5.1 (2.7, 10.4) | |
| Mean (SD) | 10.2 (7.6) | 10.3 (7.5) | 8.8 (9.1) | |
| No basic education (%) | <0.001 | |||
| Median (Q1, Q3) | 46.3 (35.7, 55.9) | 46.8 (36.2, 56.0) | 41.7 (28.9, 53.8) | |
| Mean (SD) | 45.9 (14.0) | 46.2 (13.6) | 42.6 (17.0) | |
| Income <2 min wages (%) | <0.001 | |||
| Median (Q1, Q3) | 84.6 (74.6, 91.6) | 85.5 (76.2, 91.9) | 73.8 (63.3, 82.9) | |
| Mean (SD) | 82.1 (11.8) | 83.0 (11.3) | 73.6 (14.0) | |
| No drainage (%) | <0.001 | |||
| Median (Q1, Q3) | 1.4 (0.7, 3.3) | 1.5 (0.7, 3.4) | 0.9 (0.3, 2.5) | |
| Mean (SD) | 3.2 (5.3) | 3.1 (5.0) | 3.6 (7.8) | |
| No electricity (%) | <0.001 | |||
| Median (Q1, Q3) | 0.8 (0.4, 1.7) | 0.8 (0.4, 1.7) | 0.5 (0.2, 1.3) | |
| Mean (SD) | 1.5 (2.8) | 1.4 (2.0) | 2.4 (6.6) | |
| No piped water (%) | <0.001 | |||
| Median (Q1, Q3) | 2.5 (0.9, 7.3) | 2.6 (0.9, 7.3) | 1.6 (0.5, 6.1) | |
| Mean (SD) | 6.1 (9.2) | 6.2 (9.3) | 5.4 (8.7) | |
| Dirt floor (%) | <0.001 | |||
| Median (Q1, Q3) | 4.7 (1.7, 11.0) | 4.9 (1.8, 11.2) | 2.4 (1.0, 7.2) | |
| Mean (SD) | 8.0 (9.0) | 8.1 (8.8) | 7.1 (10.5) | |
| No health insurance (%) | 0.142 | |||
| Median (Q1, Q3) | 22.6 (16.2, 30.6) | 22.7 (16.3, 30.7) | 20.7 (15.9, 29.3) | |
| Mean (SD) | 24.1 (10.8) | 24.2 (10.8) | 23.3 (10.6) | |
| Social Lag Index | <0.001 | |||
| Median (Q1, Q3) | -0.2 (-0.8, 0.5) | -0.2 (-0.7, 0.5) | -0.7 (-1.0, 0.0) | |
| Mean (SD) | 0.0 (1.0) | 0.0 (1.0) | -0.2 (1.4) | |
| Social Lag Degree | <0.001 | |||
| Very low | 677 (27.4%) | 568 (25.2%) | 109 (50.5%) | |
| Low | 893 (36.2%) | 836 (37.1%) | 57 (26.4%) | |
| Medium | 504 (20.4%) | 489 (21.7%) | 15 (6.9%) | |
| High | 243 (9.8%) | 233 (10.3%) | 10 (4.6%) | |
| Very high | 152 (6.2%) | 127 (5.6%) | 25 (11.6%) | |
| Rural population (%) | <0.001 | |||
| Median (Q1, Q3) | 100.0 (40.1, 100.0) | 100.0 (42.9, 100.0) | 43.5 (15.0, 93.7) | |
| Mean (SD) | 69.9 (35.3) | 71.9 (34.5) | 48.8 (35.9) | |
| Overcrowding (%) | <0.001 | |||
| Median (Q1, Q3) | 25.0 (18.7, 32.8) | 25.4 (19.2, 33.0) | 20.0 (14.0, 29.6) | |
| Mean (SD) | 26.6 (10.6) | 26.8 (10.3) | 23.7 (13.1) | |
| Households with remittances (%) | 0.176 | |||
| Median (Q1, Q3) | 5.8 (2.6, 12.9) | 5.8 (2.6, 13.2) | 5.6 (2.3, 10.9) | |
| Mean (SD) | 9.0 (8.7) | 9.1 (8.9) | 7.5 (6.3) | |
| Migration Intensity Index | 0.252 | |||
| Median (Q1, Q3) | 63.9 (62.2, 64.7) | 63.9 (62.1, 64.7) | 63.9 (62.6, 64.7) | |
| Mean (SD) | 63.1 (2.1) | 63.1 (2.2) | 63.5 (1.5) | |
| Migration Intensity Degree | 0.002 | |||
| None | 12 (0.5%) | 12 (0.5%) | 0 (0.0%) | |
| Very low | 861 (34.9%) | 789 (35.0%) | 72 (33.3%) | |
| Low | 686 (27.8%) | 610 (27.1%) | 76 (35.2%) | |
| Medium | 432 (17.5%) | 387 (17.2%) | 45 (20.8%) | |
| High | 341 (13.8%) | 320 (14.2%) | 21 (9.7%) | |
| Very high | 137 (5.5%) | 135 (6.0%) | 2 (0.9%) | |
| Agricultural units with day laborers (%) | <0.001 | |||
| Median (Q1, Q3) | 47.7 (36.4, 59.3) | 48.1 (37.0, 60.0) | 41.7 (32.2, 53.1) | |
| Mean (SD) | 47.6 (16.6) | 48.0 (16.6) | 42.8 (15.8) | |
| Day laborers tertile | <0.001 | |||
| T1 (Low) | 818 (33.3%) | 718 (32.0%) | 100 (47.4%) | |
| T2 (Medium) | 818 (33.3%) | 755 (33.7%) | 63 (29.9%) | |
| T3 (High) | 818 (33.3%) | 770 (34.3%) | 48 (22.7%) | |
| 1n (%).2Wilcoxon rank sum test; Pearson's Chi-squared test | ||||
Table 3.
Case characteristics and municipal determinants by outbreak phase (relative weeks), Mexico 2025 measles outbreak.
Table 3.
Case characteristics and municipal determinants by outbreak phase (relative weeks), Mexico 2025 measles outbreak.
| Outbreak phase (relative weeks per state) | |||||||
| Variable |
Overall N = 61511 |
Introduction (Rel Wk 1-4) N = 2721 |
Growth (Rel Wk 5-11) N = 16121 |
Peak (Rel Wk 12-14) N = 9801 |
Decline (Rel Wk 15-24) N = 21941 |
Late (Rel Wk 25+) N = 10931 |
p-value2 |
| Age (years) | <0.001 | ||||||
| Median (Q1, Q3) | 17.0 (4.0, 29.0) | 10.0 (3.0, 21.0) | 22.0 (8.0, 31.0) | 22.0 (7.0, 32.0) | 15.0 (3.0, 28.0) | 11.0 (2.0, 23.0) | |
| Mean (SD) | 18.1 (14.6) | 13.9 (13.0) | 21.2 (14.5) | 21.3 (15.0) | 16.9 (14.4) | 14.2 (13.3) | |
| Sex | 0.166 | ||||||
| Female | 3146 (51%) | 132 (48%) | 842 (52%) | 528 (54%) | 1116 (51%) | 528 (49%) | |
| Male | 3005 (49%) | 142 (52%) | 779 (48%) | 453 (46%) | 1079 (49%) | 552 (51%) | |
| Unvaccinated | 0.011 | ||||||
| FALSE | 868 (14%) | 40 (15%) | 228 (14%) | 171 (17%) | 277 (13%) | 152 (14%) | |
| TRUE | 5283 (86%) | 234 (85%) | 1393 (86%) | 810 (83%) | 1918 (87%) | 928 (86%) | |
| Indigenous | <0.001 | ||||||
| FALSE | 4,266 (69%) | 225 (82%) | 1527 (94%) | 852 (87%) | 1293 (59%) | 369 (34%) | |
| TRUE | 1885 (31%) | 49 (17.6%) | 94 (5.6%) | 129 (13.1%) | 902 (41.1%) | 711 (65.4%) | |
| Complications | <0.001 | ||||||
| FALSE | 5145 (84%) | 246 (90%) | 1475 (91%) | 885 (90%) | 1709 (78%) | 830 (77%) | |
| TRUE | 1006 (16%) | 28 (9.9%) | 146 (9.0%) | 96 (9.8%) | 486 (22%) | 250 (22.9%) | |
| Death | 0.068 | ||||||
| FALSE | 6126 (100%) | 274 (100%) | 1616 (100%) | 980 (100%) | 2185 (100%) | 1071 (99%) | |
| TRUE | 25 (0.4%) | 0 (0%) | 5 (0.3%) | 1 (0.1%) | 10 (0.5%) | 9 (0.8%) | |
| Marginalization Index (0-100)* | <0.001 | ||||||
| Median (Q1, Q3) | 0.9 (0.9, 0.9) | 0.9 (0.9, 0.9) | 0.9 (0.9, 0.9) | 0.9 (0.9, 0.9) | 0.9 (0.9, 0.9) | 0.9 (0.9, 0.9) | |
| Mean (SD) | 0.9 (0.1) | 0.9 (0.0) | 0.9 (0.0) | 0.9 (0.1) | 0.9 (0.1) | 0.9 (0.1) | |
| Marginalization Degree* | <0.001 | ||||||
| Very low | 4626 (75%) | 218 (80%) | 1505 (93%) | 859 (88%) | 1398 (64%) | 646 (60%) | |
| Low | 604 (9.8%) | 33 (12%) | 83 (5.1%) | 46 (4.7%) | 311 (14%) | 131 (12%) | |
| Medium | 105 (1.7%) | 13 (4.8%) | 7 (0.4%) | 3 (0.3%) | 17 (0.8%) | 65 (6.0%) | |
| High | 184 (3.0%) | 3 (1.1%) | 11 (0.7%) | 25 (2.5%) | 98 (4.5%) | 47 (4.4%) | |
| Very high | 629 (10%) | 4 (1.5%) | 15 (0.9%) | 48 (4.9%) | 371 (17%) | 191 (18%) | |
| Illiteracy rate (%)* | <0.001 | ||||||
| Median (Q1, Q3) | 1.9 (1.8, 4.8) | 3.0 (1.8, 6.4) | 1.8 (1.8, 3.0) | 1.8 (1.7, 2.6) | 2.6 (1.8, 9.1) | 3.0 (1.9, 9.7) | |
| Mean (SD) | 5.8 (8.7) | 4.7 (4.9) | 2.7 (2.8) | 3.8 (6.6) | 7.7 (10.2) | 8.8 (11.4) | |
| No basic education (%)* | <0.001 | ||||||
| Median (Q1, Q3) | 35.3 (25.5, 48.2) | 37.5 (32.3, 45.6) | 35.3 (28.5, 39.5) | 35.3 (24.0, 39.5) | 35.3 (26.9, 55.1) | 35.8 (24.2, 58.0) | |
| Mean (SD) | 38.0 (16.3) | 39.8 (14.8) | 35.6 (13.4) | 34.2 (13.6) | 40.4 (17.8) | 39.6 (18.6) | |
| Income <2 min wages (%)* | <0.001 | ||||||
| Median (Q1, Q3) | 63.0 (51.3, 77.0) | 66.0 (55.0, 76.1) | 51.3 (51.3, 66.0) | 51.3 (51.3, 69.3) | 68.9 (51.3, 81.6) | 70.3 (59.8, 81.9) | |
| Mean (SD) | 63.4 (15.5) | 66.5 (11.9) | 57.7 (12.2) | 58.7 (13.8) | 66.5 (16.7) | 68.9 (16.0) | |
| No drainage (%)* | <0.001 | ||||||
| Median (Q1, Q3) | 0.2 (0.1, 0.8) | 0.6 (0.2, 0.9) | 0.2 (0.2, 0.4) | 0.2 (0.1, 0.3) | 0.2 (0.1, 1.7) | 0.5 (0.2, 3.3) | |
| Mean (SD) | 3.2 (8.7) | 1.4 (3.7) | 0.7 (2.8) | 2.0 (6.5) | 4.6 (10.7) | 5.8 (10.9) | |
| No electricity (%)* | <0.001 | ||||||
| Median (Q1, Q3) | 0.2 (0.1, 0.4) | 0.3 (0.2, 0.4) | 0.1 (0.1, 0.3) | 0.1 (0.1, 0.2) | 0.2 (0.1, 1.0) | 0.3 (0.1, 2.0) | |
| Mean (SD) | 2.5 (7.4) | 0.5 (0.7) | 0.5 (2.2) | 1.3 (4.7) | 4.1 (9.5) | 3.7 (9.1) | |
| No piped water (%)* | <0.001 | ||||||
| Median (Q1, Q3) | 0.5 (0.4, 0.9) | 0.9 (0.4, 1.3) | 0.4 (0.4, 0.9) | 0.5 (0.4, 0.9) | 0.6 (0.4, 3.4) | 0.9 (0.3, 3.4) | |
| Mean (SD) | 3.2 (7.5) | 2.1 (5.4) | 0.9 (2.9) | 1.7 (5.3) | 5.4 (9.9) | 3.8 (7.1) | |
| Dirt floor (%)* | <0.001 | ||||||
| Median (Q1, Q3) | 0.5 (0.3, 2.1) | 0.7 (0.6, 1.9) | 0.5 (0.3, 0.6) | 0.5 (0.3, 1.3) | 0.6 (0.4, 5.1) | 0.7 (0.4, 7.0) | |
| Mean (SD) | 4.2 (9.0) | 1.9 (3.7) | 1.0 (2.9) | 2.4 (6.3) | 6.1 (10.7) | 7.3 (11.9) | |
| No health insurance (%)* | <0.001 | ||||||
| Median (Q1, Q3) | 13.2 (13.1, 19.0) | 19.8 (13.1, 39.9) | 13.1 (13.1, 17.8) | 13.1 (13.1, 19.0) | 15.4 (13.1, 19.7) | 14.1 (10.9, 18.3) | |
| Mean (SD) | 18.1 (10.0) | 24.3 (11.7) | 16.7 (7.8) | 17.0 (7.3) | 19.1 (11.3) | 17.5 (11.1) | |
| Social Lag Index* | <0.001 | ||||||
| Median (Q1, Q3) | -1.1 (-1.2, -0.6) | -0.9 (-1.1, -0.6) | -1.1 (-1.2, -0.9) | -1.1 (-1.2, -1.0) | -1.1 (-1.2, -0.2) | -1.0 (-1.3, -0.2) | |
| Mean (SD) | -0.5 (1.4) | -0.8 (0.6) | -1.0 (0.5) | -0.9 (1.0) | -0.2 (1.7) | -0.2 (1.7) | |
| Social Lag Degree* | <0.001 | ||||||
| Very low | 4484 (73%) | 202 (75%) | 1442 (89%) | 839 (86%) | 1373 (63%) | 628 (58%) | |
| Low | 846 (14%) | 62 (23%) | 151 (9.3%) | 69 (7.0%) | 351 (16%) | 213 (20%) | |
| Medium | 173 (2.8%) | 3 (1.1%) | 13 (0.8%) | 25 (2.5%) | 84 (3.8%) | 48 (4.4%) | |
| High | 38 (0.6%) | 0 (0%) | 0 (0%) | 0 (0%) | 38 (1.7%) | 0 (0%) | |
| Very high | 607 (9.9%) | 4 (1.5%) | 15 (0.9%) | 48 (4.9%) | 349 (16%) | 191 (18%) | |
| Rural population <5000 (%)* | <0.001 | ||||||
| Median (Q1, Q3) | 19.3 (5.6, 41.2) | 26.0 (19.3, 49.7) | 19.3 (7.0, 20.2) | 19.3 (3.3, 19.3) | 19.3 (5.6, 54.2) | 19.1 (10.3, 63.8) | |
| Mean (SD) | 29.8 (31.7) | 35.2 (28.0) | 24.6 (27.0) | 23.0 (28.1) | 32.8 (33.8) | 36.3 (35.6) | |
| Migration Intensity Index* | <0.001 | ||||||
| Median (Q1, Q3) | 63.4 (63.4, 64.0) | 63.9 (63.3, 64.3) | 63.4 (63.4, 63.7) | 63.4 (63.4, 63.7) | 63.7 (63.4, 64.3) | 63.7 (63.2, 64.1) | |
| Mean (SD) | 63.5 (0.9) | 63.4 (1.3) | 63.4 (0.8) | 63.3 (1.0) | 63.7 (0.9) | 63.5 (0.9) | |
| Migration Intensity Degree* | <0.001 | ||||||
| None | 0 (0%) | 0 (0%) | 0 (0%) | 0 (0%) | 0 (0%) | 0 (0%) | |
| Very low | 821 (13%) | 53 (20%) | 91 (5.6%) | 75 (7.6%) | 461 (21%) | 141 (13%) | |
| Low | 4254 (69%) | 151 (56%) | 1306 (81%) | 707 (72%) | 1397 (64%) | 693 (64%) | |
| Medium | 943 (15%) | 42 (15%) | 189 (12%) | 165 (17%) | 312 (14%) | 235 (22%) | |
| High | 125 (2.0%) | 23 (8.5%) | 33 (2.0%) | 34 (3.5%) | 24 (1.1%) | 11 (1.0%) | |
| Very high | 5 (<0.1%) | 2 (0.7%) | 2 (0.1%) | 0 (0%) | 1 (<0.1%) | 0 (0%) | |
| Agricultural day laborers (%)* | <0.001 | ||||||
| Median (Q1, Q3) | 32.2 (31.3, 40.0) | 45.8 (32.2, 53.6) | 32.2 (32.2, 34.4) | 32.2 (31.3, 33.7) | 32.2 (31.2, 39.9) | 33.3 (31.3, 51.5) | |
| Mean (SD) | 36.9 (13.0) | 44.1 (13.2) | 35.5 (9.0) | 34.6 (9.0) | 35.9 (14.1) | 41.2 (16.4) | |
| High day laborer municipality (>50%)* | <0.001 | ||||||
| FALSE | 5099 (84%) | 161 (60%) | 1422 (88%) | 886 (93%) | 1873 (86%) | 757 (70%) | |
| TRUE | 979 (16%) | 109 (40%) | 185 (12%) | 68 (7.1%) | 294 (14%) | 323 (30%) | |
| 1Median (Q1, Q3); Mean (SD); n (%). *Municipal-level indicator from residence municipality. Relative week: Week 1 = first week with cases in each state. 2Kruskal-Wallis rank sum test; Pearson's Chi-squared test | |||||||
Table 4.
Case characteristics and municipal determinants stratified by state, Mexico 2025 measles outbreak (states with ≥100 cases).
Table 4.
Case characteristics and municipal determinants stratified by state, Mexico 2025 measles outbreak (states with ≥100 cases).
|
Overall N = 57761 |
Chihuahua N = 44931 |
Jalisco N = 5441 |
Guerrero N = 2421 |
Michoacán N = 2251 |
Chiapas N = 1611 |
Sonora N = 1111 |
p-value2 | |
| Age (years) | <0.001 | |||||||
| Median (Q1, Q3) | 18.0 (4.0, 29.0) | 20.0 (4.0, 31.0) | 12.0 (5.0, 22.0) | 7.0 (3.0, 18.0) | 10.0 (3.0, 20.0) | 13.0 (5.0, 26.0) | 14.0 (4.0, 24.0) | |
| Unvaccinated | 4982 (86%) | 3907 (87%) | 422 (78%) | 207 (86%) | 202 (90%) | 151 (94%) | 93 (84%) | <0.001 |
| Indigenous | 1778 (31%) | 1246 (28%) | 154 (28%) | 144 (60%) | 137 (61%) | 84 (52%) | 13 (12%) | <0.001 |
| Complications | 981 (17%) | 859 (19%) | 24 (4.4%) | 47 (19%) | 12 (5.3%) | 32 (20%) | 7 (6.3%) | <0.001 |
| Marginalization Index* | <0.001 | |||||||
| Median (Q1, Q3) | 0.9 (0.9, 0.9) | 0.9 (0.9, 0.9) | 0.9 (0.9, 0.9) | 0.7 (0.7, 0.8) | 0.9 (0.9, 0.9) | 0.8 (0.8, 0.9) | 0.9 (0.9, 0.9) | |
| No health insurance (%)* | <0.001 | |||||||
| Median (Q1, Q3) | 13.1 (12.9, 19.0) | 13.1 (11.9, 15.4) | 29.7 (27.5, 39.9) | 7.9 (7.9, 28.0) | 53.4 (50.5, 53.4) | 40.7 (20.3, 44.7) | 17.9 (15.4, 21.8) | |
| Rural population (%)* | <0.001 | |||||||
| Median (Q1, Q3) | 19.3 (5.6, 41.2) | 19.3 (5.6, 28.2) | 13.3 (3.3, 26.0) | 100.0 (44.0, 100.0) | 17.4 (17.4, 29.7) | 32.8 (15.0, 82.8) | 8.7 (8.7, 18.4) | |
| Day laborers (%)* | <0.001 | |||||||
| Median (Q1, Q3) | 32.2 (31.3, 40.0) | 32.2 (31.3, 32.3) | 49.6 (42.1, 53.6) | 61.5 (61.5, 66.4) | 75.6 (71.8, 75.6) | 31.3 (31.3, 48.0) | 53.3 (53.3, 62.8) | |
| High day laborer mun.* | 873 (15%) | 93 (2.1%) | 226 (47%) | 242 (100%) | 203 (90%) | 25 (16%) | 84 (76%) | <0.001 |
| 1*Municipal-level indicator. 2Kruskal-Wallis rank sum test; Pearson's Chi-squared test | ||||||||
Table 5.
Sensitivity analysis: comparison of cases from first versus last 50 municipalities affected during the outbreak.
Table 5.
Sensitivity analysis: comparison of cases from first versus last 50 municipalities affected during the outbreak.
| Variable | First 50 mun. (Wk 8-19) N = 44001 |
Last 50 mun. (Wk 45-52) N = 1321 |
p-value2 |
|---|---|---|---|
| Age (years) | <0.001 | ||
| Median (Q1, Q3) | 20.0 (4.5, 31.0) | 9.5 (5.0, 22.0) | |
| Mean (SD) | 19.6 (15.0) | 13.6 (11.8) | |
| Unvaccinated | 3819 (87%) | 116 (88%) | 0.817 |
| Indigenous | 1102 (25%) | 68 (52%) | <0.001 |
| Complications | 778 (18%) | 11 (8.3%) | 0.007 |
| Death | 22 (0.5%) | 0 (0%) | 0.858 |
| Marginalization Index (0-100)* | <0.001 | ||
| Median (Q1, Q3) | 0.9 (0.9, 0.9) | 0.8 (0.8, 0.9) | |
| Mean (SD) | 0.9 (0.1) | 0.8 (0.1) | |
| Marginalization Degree* | <0.001 | ||
| Very low | 3761 (85%) | 48 (36%) | |
| Low | 222 (5.0%) | 13 (9.8%) | |
| Medium | 23 (0.5%) | 8 (6.1%) | |
| High | 77 (1.8%) | 21 (16%) | |
| Very high | 316 (7.2%) | 42 (32%) | |
| No health insurance (%)* | <0.001 | ||
| Median (Q1, Q3) | 13.1 (12.5, 15.6) | 27.5 (19.9, 29.8) | |
| Mean (SD) | 14.4 (4.0) | 26.9 (9.3) | |
| Rural population <5000 (%)* | <0.001 | ||
| Median (Q1, Q3) | 19.3 (5.6, 19.3) | 59.5 (14.9, 82.8) | |
| Mean (SD) | 25.8 (29.1) | 52.3 (36.5) | |
| Migration Intensity Index* | <0.001 | ||
| Median (Q1, Q3) | 63.4 (63.4, 63.7) | 64.9 (64.0, 65.0) | |
| Mean (SD) | 63.5 (0.8) | 64.3 (1.2) | |
| Agricultural day laborers (%)* | <0.001 | ||
| Median (Q1, Q3) | 32.2 (31.3, 32.3) | 48.0 (42.3, 51.2) | |
| Mean (SD) | 32.2 (6.6) | 47.2 (10.8) | |
| High day laborer municipality* | 104 (2.4%) | 44 (33%) | <0.001 |
| 1Median (Q1, Q3); Mean (SD); n (%). *Municipal-level indicator. | |||
| 2Wilcoxon rank sum test; Chi-squared test | |||
Table 6.
Risk factors for measles complications: multivariable logistic regression.
| Variable | Complications n/N (%) | aOR (95% CI) | p-value |
|---|---|---|---|
| Age group | |||
| 5-19 years (ref) | 259/1774 (14.6%) | 1.00 (ref) | - |
| <1 year | 234/641 (36.5%) | 3.59 (2.88-4.46) | <0.001 |
| 1-4 years | 287/942 (30.5%) | 2.69 (2.20-3.28) | <0.001 |
| >=20 years | 226/2792 (8.1%) | 0.66 (0.54-0.80) | <0.001 |
| Indigenous | |||
| No (ref) | 470/4264 (11%) | 1.00 (ref) | - |
| Yes | 536/1885 (28.4%) | 2.35 (1.99-2.77) | <0.001 |
| Vaccination status | |||
| Vaccinated (ref) | 75/868 (8.6%) | 1.00 (ref) | - |
| Unvaccinated | 931/5281 (17.6%) | 2.03 (1.57-2.63) | <0.001 |
| Outbreak phase | |||
| Early, weeks 1-14 (ref) | 209/1941 (10.8%) | 1.00 (ref) | - |
| Late, weeks >=15 | 797/4208 (18.9%) | 1.09 (0.90-1.32) | 0.366 |
| Municipality type | |||
| Urban (ref) | 614/4772 (12.9%) | 1.00 (ref) | - |
| Rural (>50% in localities <5000) | 392/1377 (28.5%) | 1.81 (1.55-2.13) | <0.001 |
Total: 6151 cases; Complications: 1006 (16.4%). Model fit: Pseudo R² = 0.132; AIC = 4773.6. aOR = adjusted Odds Ratio; CI = Confidence Interval; Rural municipality defined as >50% population in localities <5000 inhabitants.
Disclaimer/Publisher’s Note: The statements, opinions and data contained in all publications are solely those of the individual author(s) and contributor(s) and not of MDPI and/or the editor(s). MDPI and/or the editor(s) disclaim responsibility for any injury to people or property resulting from any ideas, methods, instructions or products referred to in the content. |
© 2026 by the authors. Licensee MDPI, Basel, Switzerland. This article is an open access article distributed under the terms and conditions of the Creative Commons Attribution (CC BY) license (http://creativecommons.org/licenses/by/4.0/).
Copyright: This open access article is published under a Creative Commons CC BY 4.0 license, which permit the free download, distribution, and reuse, provided that the author and preprint are cited in any reuse.


