Submitted:
13 January 2026
Posted:
14 January 2026
You are already at the latest version
Abstract
Over the past two decades, the world has experienced significant and relentless increase in environmental degradation, measured through carbon emissions (CO2). These emissions have been one of the persistent global concerns. South Africa boosts abundance of natural resources and some of the world’s most substantial mineral deposits endowment in the form of precious metals, diamonds and gold. The paper aims to examine impact of socio-economic and energy-related factors on environmental degradation from South African perspective. Using multivariate annual data spanning from 1991 to 2022, Autoregressive Distributed Lag Model (ADRL) was employed to determine both short-run and long-run impact of financial development (FD), renewable energy(RE), non-renewable energy (NRE), unemployment rate (UNE), economic growth (GDPPC), and population growth (PoPG) on CO2 emission. The results show that FD, RE, GDPPC, and PoPG promote environmental quality in the long run while NRE has opposite impact. The study thus calls for actions by relevant policymakers to stimulate economic growth and promote access to climate change finance, thereby encouraging investment in green energy technologies and consumption, to enhance and promote environmental quality in South Africa.
Keywords:
environmental degradation
; financial development
; renewable and non-renewable energy consumption
; South Africa
; ARDL approach
1. Introduction
Over the past two decades, the world has experienced significant and relentless increase in environmental degradation, measured through carbon emissions (CO2) [60]. These emissions have been one of the persistent global concerns. Notwithstanding substantial investments in green energy initiatives, evidence indicates that fossil fuel energy continues to dominate globally, accounting to more than 60% of total electricity production in 2024 [44]. The combustion of biomass and the consumption of fossil fuels, driven largely by human activities such as job creation, economic growth and development, have resulted in the emission of greenhouse gases (GHG) that disrupt the global climate system (Ali, et al., 2021). In a response to these challenges, countries have been developing and implementing environmental strategies and regulations aimed at altering consumption patterns and complying with cleaner environmental standards [60].
Although substantial investment has been made towards the energy sector, mainly into the renewable energy, to increase electricity supply in the country, the country is still crippled with the issue of unstable electricity supply, evident through persistent load shedding and load reductions since. Load shedding peaked in 2023, thus affirming the country's vulnerable and unstable energy supply, despite billions of rand worth of investment in the energy sector. The effects of the power cuts in the country are evident through their adverse impact on the country's economic performance, which is reflected in reduced productivity, increased business operating costs, declining foreign direct investment (FDI), and job losses. [81] highlights that load shedding has reduced the country's economic growth roughly by 1.1%. [8] notes that to overcome the load shedding crisis, Eskom, the country's state-owned entity responsible for generating electricity, should recover R10 billions of capital costs.
Given the high coal dependency and exacerbation of global warming and climate change challenges through GHG emissions, water and air pollution, call have been mounting towards clean and circular economy, aimed at affordable and clean energy as well as responsible production and consumption, aligned to Sustainable Development Goals (SDGs) 7 and 12 [80]. A multitude of policy-oriented studies have also been conducted to analyse the factors contributing to environmental degradation, to devise policies and strategies that reduce reliance on NRE sources, to promote the consumption of RE, and to enhance overall environmental sustainability (Abu-Goodman, Güngör & Usman [3]; Udeagha & Ngepah [78]; Kanayo et al. [46]; Shi & Smith [72]). Numerous studies have sought to identify the antecedents of environmental degradation, both globally and in South Africa (Rjoub et al. [63]; Hunjra et al. [41]). Economic indicators, including energy consumption, globalization, urbanization, population growth, and economic development, have been frequently cited in numerous studies such as those by [41,63]. However, the role of financial development in mitigating environmental degradation has not been sufficiently explored in the context of South Africa.
There has been a limited attention given to studying the role of socio-economy and energy factors in mitigating environmental degradation in developing economies, especially from Sub-Saharan region. Financial development (FD) and Gross domestic Product per Capita (GDPPC) which are considered economic variables hold a potential to lessen the environmental degradation impact through targeted polices aimed towards green energy production and consumption [76]. Socioeconomic factors have been repeatedly linked, both directly and indirectly, to environmental outcomes through capital investment allocation, sectoral composition changes relating to population and employment figures as well as technology diffusion.
On the backdrop of varying energy consumption patterns, renewable (RE) vs non-renewable (NRE), which are critically shaping environmental degradation through CO2 emission trends, [76] call for more support towards green energy investments. Given South Africa’s coal-dominant energy mix, developing renewable build-out, persistent and considerably high unemployment challenges, and sluggish and fluctuating in GDP per capita and steady growing population, a unified econometric assessment quantifying the longrun and -shortrun- effects of selected socioeconomic factors (i.e., Financial Development [FD], GDP per Capita [GDPPC], Population Growth [PoPG], Unemployment [UNE] and energy factors (Renewable Energy [RE] and Non-Renewable Energy [NRE] on environmental degradation. The paper thus aims to explore this association through ARDL approach, which critical for policy relevance in the South African context and enables testing for both immediate and long-term effects. Drawing from the aim of this paper, the following section presents an empirical literature review and theoretical framework that focuses on the perspectives of the EPC and EKC hypotheses.
2. Background
South Africa boosts abundance of natural resources and some of the world’s most substantial mineral deposits endowment in the form of precious metals, diamonds and gold. Although yet to be validated, [29] reported that the country’s shale gas is technically recoverable, and its reserves are also in abundance – ranking among the global largest reserves varying between 20 and 400 trillion cubic feet (Tcf). Apart from its natural gas and coal abundancy as popular sources of energy, renewable energy (NE) such as solar and wind are too, available on a large scale [30].
In 2020, coal constituted approximately 84% of the South Africa's total electricity production; however, this figure was projected to decline to 74% by 2025 [36], while the South African Energy Sector Report published in 2024 indicates that gas contributes a considerably low 2-3% to the country's energy mix. Crude oil and nuclear renewables each contribute 9% and 4% respectively [30]. In 2021, RE sources accounted for approximately 4.3% of the total electricity production [44]. The country is ranked 42nd among the largest emitters per capita economies and is among several developing countries that are soon likely to face imposed emissions restrictions [57].
Given the country's reliance on the exploitation of some of these minerals to produce electricity, its energy-intensive economic activity, industrialisation, and growing population put financial pressure on the cost of storing and transmitting these energy sources. South Africa is considered to be amongst the world's major contributors of CO2 emissions, mainly due to the country's heavy dependency on coal for energy production and liquid fuel conversion. This makes affordability a challenge, as prices are comparatively high, thereby exposing the country's vulnerability to energy reliability and sustainability issues. This implies a need for competitive and affordable energy sources. While the country's coal deposits are arguably relatively economical and a reliable source of energy, the carbon intensity of coal dependency could disadvantage its green energy interests, and advancements to mitigate climate change are introduced, drawing from global restrictions on carbon emissions.
The high consumption of non-renewable energy is counted amongst the major contributors to GHG emissions, with repercussions that extend to environmental degradation. According to the National Development Plan (NDP) 2030 of South Africa, this has an adverse impact on major sectors, including agriculture, industry, manufacturing, and water [57]. In most developing economies, CO2 emissions have been increasing as energy demand continues to surge. Countries such as China, Indonesia, Egypt, and India, to name a few, continue to rely heavily on fossil fuel sources, including coal, gas, and oil, as their primary sources of energy [32]. South Africa is no exception; a review by [53] of the African continent's transition from non-renewable to renewable energy consumption places the country among the continent's top five economies, alongside Algeria, Nigeria, Morocco, and Egypt.
Issues of environmental sustainability and efforts towards clean energy are not new. The Kyoto Protocol Summit in 1997 and the subsequent 2015 Paris Agreement are among notable conventions that provided accords for countries to align their efforts and economic activities to combat increasing global temperatures. In essence, these protocols urged both developing and developed nations, including South Africa, to reduce carbon emissions by transitioning from non-renewable to renewable energy sources. Despite the impetus provided by these legislative frameworks, carbon emissions have stubbornly continued to increase. Such a development raises a question of whether measures taken towards the green energy transition are adequate. [44] reports that since 2000, South Africa’s CO2 emissions have risen by 30%, primarily due to the country's heavy reliance on coal for energy production and the high cost of converting liquid fuels.
Figure Figure 1 depicts the trend analysis of South Africa's CO2 emissions since the 1980s. The country's energy-related CO2 emissions are reported to be 365 Mt, thus constituting 1.05% of the global emissions. According to the 2020 Climate Transparency Report [27], the country's per capita GHG emissions were reported to be 8.85 tonnes, compared to 7.32 tonnes (t CO2 emission/capita), which represents a 41% increase since 1990. Examining the 5-year trend from 2012 to 2017, GHG emissions increased by 10.3%, while the G20 average was reported to have increased by a marginal 2.3%. In 2020, the CO2 emissions started to decline. This could be attributed to a shift in the government's focus towards diversified energy sources by 2030. In 2020, the NPC focused its attention on monitoring the implementation of NDP initiatives related to energy production. Through the NDP, the energy position paper by NPC highlighted the government's aims for improving the energy grid and infrastructure to ensure its reliability, affordability, and sustainability [56].
South Africa is purported to be one of the leading investors in RE in Africa; however, its energy sector is still undergoing critical transformation amid challenges of accessibility, environmental sustainability, and modernization [12,79]. Over the years, a variety of initiatives, programs, and policies have been implemented to attract investments in RE technologies. Notably, the Renewable Energy Independent Power Producers Programme (REIPPP), introduced over a decade ago, has successfully attracted domestic and foreign investment amounting to billions of Rands [31]. However, more than ten years after the program's inception, it is evident that the REIPPP has not fully realized several of its key objectives, including job creation, as the country still faces high unemployment and slow economic growth. While substantial funds have been allocated to renewable energy production to reduce reliance on coal-generated electricity and increase the supply of RE, the overall contribution of RE to the energy mix remains significantly lower than that of NRE sources. Figure Figure 2 illustrates South Africa's total energy mix, which is composed of 82% coal, 9% crude oil, 4% nuclear energy, 3% natural gas, and 1% renewable energy.
3. Literature Review and Theoretical Framework
3.1. Energy Consumption and Environmental Degradation: Environmental Phillips Curve Hypothesis (EPC)
Review of the literature accentuates that while RE sources are on the sluggish rise, wind and solar contribution persistently remains considerably a low double-digit at 3.1%, with coal on the other hand continuing to be a dominant player in anchoring installed capacity and primary energy production reportedly at 93.7%. Strategic transition studies forecast that, under least-cost probabilities, RE sources will likely account for more than one-third of electricity generation by 2030. However, these studies highlight that capital investment and system adequacy pose significant constraints towards green energy transition.
Theories such as the Decoupling hypothesis proposes that to promote environmental sustainability, economic growth should be decoupled and de-linked from environmental flaws by moving away from the consumption of NRE to RE. However, while such a measure comes at a risk as NRE is in most cases positively associated with economic growth as supported by studies such as those by [6,59,70]. [45] proposed a theory which proposes that environmental degradation can be reduced by increasing unemployment rate. This theory implies that measures aimed to reduce environmental degradation require high unemployment rate as the latter is closely linked to economic and production activities that drives pollution. This theory is known as the EPC and is derived from the Okun’s law and Phillips curve, and it emphasizes the de-economizing of human activities to achieve a desirable environmental quality [13].
Although several scholars criticise the EPC theory and argue that it is not applicable, several studies have tested the applicability of the theory over the years. While other scholars find evidence which supports the theory, others find evidence which contradicts it. For instance, studies by [2,17,39,64,74,75] validate the applicability of the theory while [55] find evidence which does not validate the applicability of the theory. A panel study by [16] shows that the EPC is not applicable in the case of high-income countries in both short-run and long-run, while it the theory is applicable in upper and lower middle-income countries. Such contradictory results imply that income level plays in crucial role on affecting the influence that changes in unemployment rate have on environmental quality.
[28,48] on the other hand, finds a positive relationship between unemployment rate and environmental degradation, highlighting that increase in unemployment rate is associated with increase in CO2 emissions and environmental degradation. While this seems unusual, several factors such as technology-driven production and environmental laws significantly play a crucial role in determining the impact of changes in unemployment on environmental degradation. Employees can be replaced with capital and technology to increase production. While UNE increases in this situation and production increases due to the use of technology and capital, CO2 emission will rise due to increased production. This trade-off between human capital and physical capital thus explains the possible positive correlation between UNE and environmental degradation. Another factor which can explain the varying results is the methodological approach that the scholars usually apply.
Instead of using a linear approach to test the applicability of the EPC theory, scholars such as [62] determine the asymmetric impact of unemployment rate on environmental degradation to determine whether the relationship between unemployment rate and CO2 emissions is asymmetric or not. This helps to fill the theoretical gap which assumes a linear relationship.
3.2. Environmental Kuznets Curve (EKC) Hypothesis
The EKC hypothesis was first introduced by Grossman and Krueger, and its postulation is that a relationship between environmental degradation and income is inverted-U-shaped. This hypothesis thus implies that as environmental pressure increases up to a certain level, income goes up and reaches a point to which it starts to decline (Dinda, 2004). In the initial stage of development, countries focus mostly on industrial production and employment creation, while inconsiderate of the pressure that is exerts on the environment and atmosphere. At this stage, environmental sensitivity is often neglected. The second stage of EKC is characterised by high income and economic prosperity; at this stage, the welfare level of individuals and societies increases and environmental degradation declines [68]. In short, environmental degradation first increases as income increases then as income reaches a certain stage where it is high, environmental degradation then starts to decline [73].
Over the years, the EKC framework has been scrutinised and tested by different scholars such as to determine its applicability. [54] conducted a study from Pakistani, aimed at determining the impact of GDP per capita, trade openness, financial development, energy consumption, and FDI, on CO2 emissions. The study revealed a positive relationship between GDP per capita and CO2 emissions in the short run. The study further reveals a negative association between CO2 emissions and financial development, denoting that financial development promotes environmental quality. In support of Kuznets curve hypothesis, these findings supported the applicability of EKC in the context of Pakistani, thus signifying FD’s crucial influence in improving environmental quality. Similarly, [10,18,76,86], validate the EKC framework.
3.3. Review of Empirical Literature on Socio-Economic and Energy-Related Factors
Several economic factors contribute to environmental degradation, other than economic growth. Amongst these factors, the consumption of NRE is the most studied antecedent. According to [37], NRE, especially coal energy, is the largest and most significant contributor to CO2 emissions in the energy sector in most countries. Studies have shown how the consumption of NRE impacts environmental quality. Most of these studies have discovered a positive correlation between NRE consumption and environmental degradation. However, [15,19,25] are amongst authors who found a negative relationship between environmental quality and NRE consumption.
On the other hand, [24,65] determined the asymmetric relationship between NRE consumption and environmental degradation. Synthesis of results from the studies shows that positive shocks in NRE consumption are associated with positive shocks in environmental degradation, while negative shocks in NRE consumption promote environmental quality. The results by [65] reveal that both positive and negative shocks in RE consumption reduce carbon emissions. These results collectively highlight the impact of NRE on the environment and environmental sustainability.
Examining 44 Sub-Saharan African countries over a period spanning 1998-2017, [58] investigated the impact of FDI and financial inclusion on CO2 emission and clean energy. Consistent in both low-income and middle-income countries in the region, findings suggest that FD has a significant positive impact on clean energy consumption. However, FD was found to be significantly negative with carbon emissions in the case of middle-income countries. Furthermore, the relationship was only positive in low-income countries. [63] sought to determine the role of FD on environmental sustainability, revealing a negative correlation between FD and environmental sustainability. This highlights that growth and development in the financial and banking sector, which offers access to finance, have a positive impact on reducing CO2 emissions and promoting environmental sustainability. These results are consistent with those by [11,68,76]. In a nutshell, these findings suggest that the implementation of financial reforms, including FD, can be beneficial in preserving environmental quality.
Population growth has been extensively studied as one of the factors with a significant impact on environmental degradation. Studies by [33,69,84] are among the few that have found a negative relationship between population growth and environmental quality. Environmental degradation is a pressing issue; while economic growth and development are crucially important for most economies, it is important to ensure that such is not achieved at the cost of environmental quality. Amongst the factors which affect environmental degradation, financial development is the least explored factor, especially in the South African context. According to [5], many analysists suggest that financial development has the potential of promoting the twin goals of enhancing economic growth and promoting environmental quality. Hence, it is thus imperative to explore the role that financial development has on environmental degradation in South Africa
4. Materials and Methods
To examine effect of socio-economic and energy-related factors on environmental degradation from South African perspective, an Autoregressive Distributed Lag Model (ADRL) approach guided by the previous literature [61] for FD and economic growth variables, [41] for population growth and renewable energy variables, [14] for renewable and non-renewable energy variables, and [21] for the GDP variable was performed. Guided by the positivist research philosophy (Saunders et al. 2015), multivariate annual data spanning from 1991 to 2022. Table Table 1 depicts how the variables were operationalized. Environmental degradation, proxied through CO2 emissions as well as RE and NRE were sourced from the Our World in Data repository, which is recognized as a reliable data source and is widely used. The data for UNE and PoPG were collected from the World Bank, while the FD and GDPPC were collected from the South African Reserve Bank (SARB).
4.1. Model Specification
Guided by the multivariate nature of the relationship between environmental degradation and socio-economic and energy-related factors, environmental degradation can be explained as a function of the following factors presented by equation (1:
CO2 is the dependent variable, and it denotes environmental degradation. Equation (2 below is an econometric function, describing environmental degradation as a dynamic function of FD, RE, NRE, GDPPC, and PoPG:
The beta (β) denotes the parameters, t stands for time period while ε denotes the error-term.
4.2. Unit Root Test
Time-series models are prone to shocks that can cause permanent fluctuations, thus leading to biased estimates [51]. It is thus crucial to test for variables’ stationarity to avoid biased and spurious estimates [82]. For this paper, Phillips Peron and Augmented Dickey-Fuller (ADF) tests were relied upon to test the variables’ stationarity. Following [83], a representation of unit root test performed in this study can be specified as follows:
Y indicates the variable being examined for unit root; T denotes the linear trend while ΔYt-1 indicates the lag difference. indicates the intercept while t indicates the time period. The null and alternative hypotheses for the unit root tests can be given as follows:
H0 denotes the null hypothesis while H1 denotes the alternative hypothesis. The null hypothesis is rejected in place of the alternative hypothesis when the p-value is less than the level of significance.
4.3. Autoregressive Distributed Lag (ARDL) Model
The ARDL approach is employed to determine both short-run and long-run impact of FD, RE, NRE, UNE, GDPPC, and PoPG, on CO2 emission. Compared to other co-integrations, the ARDL method has a couple of advantages, such as it can be used irrespective of whether the series is purely integrated at the I(1), I(0), or mutually [23]. The ARDL model for this study can be presented as follows:
The betas (β) are the long-run parameters, is the constant term, Δ is the first difference operator, and the epsilon (ε) represents the error-term. The bounds test is used to determine whether the variables are co-integrated or not. To confirm the existence of a cointegration between the variables, this study uses the ARDL bounds test to establish the long-run relationship between the variables. Following [7], the ARDL bounds test null, and alternative hypotheses can be given as follows:
; implies no cointegration between the variables.
; indicates the presence of cointegration between the variables.
Incorporating the short-run dynamics and the error-correction term in equation 4, the ARDL model which includes both short-run dynamics and error-correction term can be given as follows:
Where ….. indicates the short-run parameters. is the error-correction term and presents the speed of adjustment to long-run equilibrium.
5. Results
5.1. Descriptive Statistics
Table Table 2 presents the descriptive statistics results, among the variables used in natural logs, CO2 had the highest mean compared to the other variables, potentially indicating a higher central tendency. Between the two energy sources, NRE had the highest mean compared to RE, signifying that most of the energy used in South Africa comes from non-renewable sources. This is consistent with data provided by the Department of Mineral Resources and Energy [18], which indicates that most of South Africa's energy comes from non-renewable resources. FD has the second-highest mean, followed by GDPPC, with RE having the lowest mean among all the variables.
The CO2 ranges from 19.532 to 20.019, RE ranges from -0.840 to 3.916, NRE ranges from 6.645 to 6.700, FD ranges from 7.995 to 12.955, GDPPC ranges from 9.241 to 11.604, UNE ranges from 2.827 to 3.535, and PoPG ranges from -0.425 to 0.826. FD and RE are the most volatile variables in the model compared to other variables. At the same time, NRE is the least volatile variable among the rest, indicating that it is steadier. Such volatility of RE can be attributed to several environmental factors, such as, but not limited to, the dependency of solar PVs and wind turbines, which are subject to seasonal changes and geographical dependencies. For FD, the volatility can be attributed to sudden or untimely changes in policies within the financial and banking sector
5.2. Unit Root Results
Table Table 3 below presents the unit root test results for Augmented Dickey-Fuller (ADF). The variables were tested for stationarity, both at level and first difference. The ADF tests results show that NRE and UNE are all stationary after first difference (I(0)). RE, FD, GDPPC, and PoPG, are all stationary at level as well as after first difference. The variables are therefore integrated at mixed orders.
Table Table 4 below presents the Phillips Perron (PP) unit root test results and variables NRE and UNE are integrated at I(0) while variables RE, FD, GDPPC, and PoPG, are all integrated at I(0) and I(1). Such integration order is an essential requirement, especially when conducting the ARDL bounds test to establish whether there is a long-run equilibrium relationship between the variables [61].
5.3. Co-Integration Test
Table Table 5 presents the ARDL bounds test results. The null hypothesis of no cointegration is thus rejected as the F-statistic value is greater than the upper-bound and lower-bound critical values, both at 1% and 5% level of significance. This suggests that the investigated variables have a long-run relationship.
5.4. Long-Run ARDL Results
Drawing on the results of the cointegration test, a long-run relationship between the investigated explanatory variables and the target variable has been established, and such long-run results are presented in Table Table 6 below. The results indicate a statistically significant and positive correlation between RE and CO2 emissions. Such a positive correlation diminishes after a one-year lag period, indicating that in the early stages of RE consumption, CO2 emissions initially rise but ultimately decline after at least a period of one year. Notwithstanding these results, the observed decline in the positive impact following a lagged period is sufficient to conclude that RE consumption contributes to improved environmental quality as reduces CO2 emissions. These results are consistent with previous discourse in the literature, such as [78] from the South African context, [1] from Thailand's context, [38] from Jordan's context, and [20] from Saudi Arabia's context. On the contrary, other parts of the literature, such as [24,85], find evidence that suggests that RE positively affects CO2. Several factors, such as the kind of methodological approach used, the countries' economic characteristics, or the processes used in the production of RE technologies, may be attributable to such contradictory results.
The long-run results further show that FD contributes to a reduction in CO2 emissions, albeit with a lagged effect of one year. Notably, the impact increases after a two-year lag, underscoring the crucial role of FD in reducing CO2 emissions and improving environmental quality. Such can be promoted by facilitating access to finance for innovative green technologies and sustainable energy projects. These findings are consistent with those by [22,43,76]. Conversely, [4,35,67] report contradictory results. While these differing findings warrant careful consideration, it is important to acknowledge that variations in regulatory frameworks governing financial institutions across countries can significantly influence the relationship between FD and CO2 emissions. Furthermore, the differing sizes of economies also play a crucial role in shaping the effects of financial development on environmental quality. In larger economies, FD can stimulate economic growth through increased production, potentially resulting in increased CO2 emissions and thus exacerbating environmental degradation in the long run.
As shown in Table Table 6 above, UNE is negatively correlated with CO2, supporting the EPC hypothesis, suggesting that an increase in unemployment rate is associated with improved environmental quality. However, such a relationship is not statistically significant. PoPG is found to be positively correlated with CO2 emissions in the long run, as shown in Table 6 above. This is however after a 2-year lagged period and could denote that, as the population grows, new measures to protect the environment get developed and implemented. The results further reveal a positive long run correlation between NRE consumption and CO2. These findings align with those by [9,15,50], highlighting the necessity of reducing dependency on fossil fuels to enhance environmental quality.
Furthermore, the findings of this study support the EKC, which posits that economic growth initially leads to increased CO2 emissions and environmental degradation, followed by a subsequent decrease in CO2 emissions and an improvement in environmental quality. This is supported by the coefficients in Table Table 6, which show that the coefficient for GDPPC declines from 1.2016 to -0.4347 (after a 1-year lag) and then to -0.1944 (after a 2-year lag). This narrative aligns with the work by [21,52,87,88].
5.5. Short-Run Results
Table Table 7 presents the short-run results, which shows a positive relationship between RE consumption, FD (after one-year lagged period), PoPG (after one-year lagged period), GDPPC (after one-year lagged period), and CO2. The short-run positive relationship between GDP per capita and CO2 is consistent with short-run findings by [61], while the positive short-run relationship between FD and CO2 is consistent with findings by [40]. While PoPG and RE consumption initially lead to an increase in CO2 emissions in the short run, the relationship changes in the long run, and both promote environmental quality, as demonstrated in the results presented in Table 6. This long-run equilibrium is confirmed by the error-correction term (ECM), which is negative and statistically significant, as shown below in Table Table 7. From the ECM value, it can be interpreted that approximately 89.4% of disequilibrium in the current period or short run is corrected in the long run. This implies that the variables adjust to long-run equilibrium.
Table Table 8 below presents the results of diagnostic tests, which confirm the validity and reliability of the model results. The p-values for the Breusch-Pagan-Godfrey test, Breusch-Godfrey LM test, and the normality test show that the model does not suffer from heteroskedasticity, serial correlation, and non-normality, respectively. The recursive sum test assesses model stability, and based on the p-value, the results confirm that the model is stable.
6. Discussion
The ARDL results complement the dynamic nature of the relationship between variables over time, revealing that both the long-run and short-run dynamics that shape CO2 emissions imply environmental degradation. From an equilibrium relationship perspective, the long-run results illustrate how changes in the explanatory variables over time consistently influence CO2 emissions. The positive and statistically significant RE coefficients lagged 0 and 1 imply that consumption of RE increases CO2 emissions in the long run. Whilst these results may sound counterintuitive, they thus highlight the dependence on inadequate or partially ineffective clean renewable technologies or policies. These are consistent with prior literature where [16] in their examination of RE consumption and environmental-related technologies and sustainability through a time-varying approach surprisingly found that RE's mitigating effect on CO2 emissions remains statistically insignificant or weak in South Africa's context, thus calling for ramifications of policies towards the reduction of CO2 emissions. However, as the coefficient size changes or declines after a one-year lagged period, it is sufficient to conclude that RE consumption reduces CO2 emissions and improves environmental quality in the long run.
The statistically significant positive impact of NRE and GDPPC, along with the delayed but negative effect of FD on emissions, implies continuing structural interactions. These interactions are reflected through long-run coefficients, which capture the steady-state influence following temporary shocks dissipate. Furthermore, these results, particularly on GDPPC with no lag, may be attributable to a weak or early-stage EKC trend where initial growth is associated with increased emissions but later reduces them at high income levels. This is in line with most macroeconomic models [49], which in turn reflect the greater impact of economic or technological adjustments, thereby suggesting that the observed long-run association between the variables through ARDL is not instantaneous.
The mixed signs however negative and significant impact of PoPG at lag two and the insignificant impact of UNE association suggest complex nature of the dynamic association of socio-economic variables on energy consumption, which could be attributed to changes in demographic structure of the population and economic conditions where factors such as migration, employment status and urbanisation trends with environmental consequences could be playing an influential role. Therefore, the long-term effects can be attributed to the role played by underlying structural influences resulting from changes in technology and economic structure over time. The mixed nature of the findings is consistent with previous literature, for example, [47], who argue that the nexus between finance and emission literature often provides conflicting results and therefore advocate for watertight policies and processes aimed at encouraging allocation of capital infrastructure to environmentally friendly projects.
Contrastingly, the short-run results imply an immediate reaction of CO2 emissions to changes in the explanatory variables, thereby highlighting that adjustment processes and temporary fluctuations in emissions are immediate. Likewise, RE and FD both positively influence CO2 emissions, albeit to a lesser extent in the long run. This interaction suggests transitional phases where benefits associated with the impacts of green financing or energy shifts, such as the JET, are starting to emerge and are yet to be complete. The role of the error-correction term (ECT), as guided by [26], is significant in confirming a rapid adjustment toward the long-run equilibrium following short-term deviations.
Both the short-run and long-run results underscore the dynamic nature of the relationship between the environmental impact of socio-economic and energy variables in South Africa. There is therefore a need for intentional policies to promote responsible energy production and consumption aligned with Sustainable Development Goal (SDG) 12, JET, and green financing, aimed at addressing immediate mitigation impacts and promoting sustained structural shifts. The lagged adverse effect of FD on CO2 emissions in the long run suggests that policy should focus on enhancing the financial system's capacity to support sustainable capital and infrastructure expenditure, while strengthening RE infrastructure to achieve CO2 emission reductions in a short period.
7. Conclusions
The recent empirical research South African perspective has increasingly been focusing on the interplay between socioeconomic and energy-related factors in shaping environmental outcomes, precisely CO2 emissions. Through the work of [78], it is thus evidently affirmed that RE sources such as hydro and nuclear significantly reduce CO2 emissions, meanwhile coal, oil, and gas remain major contributors to environmental degradation. These results support the EKC hypothesis. Extending this perspective, [3] established asymmetric effects, showing that both positive and negative shocks in RE consumption reduce the emissions, whereas globalization shocks tend to worsen environmental pressures. Similarly, [77] draw attention to the critical role of technological innovation in mitigating emissions, contrasting with the adverse impacts of energy consumption, FDI, and industrial economic activities, further supporting the dynamics EKC. [46] underscore the persistent dominance of coal in South Africa’s energy mix and reveal that environmental tax revenues have not effectively curbed emissions, pointing to misalignment between fiscal instruments and sustainability objectives. At a broader level, results by [72] confirm that adoption of RE sources and governance reforms significantly reduce emissions, thereby affirming that income growth alone cannot guarantee environmental sustainability. These studies collectively signify the necessity of integrated strategies combining RE expansion, technological innovation, and effective policy instruments to achieve long-term environmental goals.
The current paper drew on South African socio-economic and environmental data spanning 30 years (1980-2022), using ARDL approach to expound the influence of selected socio-economic and energy related proxied as explanatory variables, on the target variable - environmental degradation measured through CO2. Both FD and RE possess transformative potential to lessen environmental degradation in South Africa, however their effectiveness depends on the strengths and efficacy of the country’s policy frameworks, technological advancements, and as well economic conditions. The ARDL-based empirical results therefore affirm a long-term relationship among these variables, thus signifying those intentional reforms in the financial sector, especially funding of capital projects towards green investment can potentially lead to reduction in environmental degradation and ecological preservation.
On the other hand, however, RE alone, may possess limited immediate impact, if broader systemic changes, are not considered. Sustainable economic growth, which signify the health condition of the economy need integrated approaches through strong and intentional policy and regulatory framework to promote clean technology, financial innovation, and circular economy towards green investment and responsible energy consumption and production, thus responding to SDG 12 and ecological sustainability.
The ARDL results reveal important insights into the long-run and short-run dynamics shaping environmental degradation in South Africa. In the long run, the evidence shows a strong and significant positive impact of NRE consumption and economic growth measured through GDPPC on carbon emissions, underscoring the persistence of carbon-intensive development patterns. The FD exhibits a negative but lagged effect, indicating its potential role in fostering sustainable investment and environmental improvement over time. The positive coefficient on RE in the long run invites further scrutiny, suggesting that the current scale or integration of renewables may be insufficient to offset the emissions significantly.
Short-run findings indicate more immediate influences where RE and economic growth drive emissions upward, and financial development's benefits manifest with some delay, consistent with the adjustment process. The significant and large negative error correction term confirms rapid convergence to long-run equilibrium after short-term shocks, validating the model's stability and the dynamic interplay of variables. These findings make both empirical and theoretical contribution theoretically by supporting the EPC's non-linear economic growth-emissions relationship and empirically reinforce the critical need to enhance financial sector mechanisms for green finance to realize sustainable environmental benefits. The findings also call for a more robust RE transition to effectively reduce emissions.
This research opens avenues for deepening understanding of the financial and energy sectors’ role in South Africa’s environmental sustainability trajectory and provides a solid empirical foundation for integrated policy development Drawing from the limitations presented by the ARDL models, future studies should explore nonlinear and asymmetric effects of FD components, including institutional and market dimensions, on diverse environmental quality indicators beyond CO2 emissions. More granular research into RE types, adoption barriers, and their localized environmental impacts is necessary. Incorporating social, institutional, and government policy interaction terms in ARDL models could provide deeper comprehension of mechanisms linking FD, RE vs NRE, and environmental degradation. Additionally, dynamic causality assessments over different sub-periods may reveal evolving relationships impacted by policy shifts, technological progress, and external shocks, guiding adaptive and robust environmental policymaking. From the perspective of regional and cross-country comparison, comparative panel ARDL studies involving other emerging and developing economies to generalize findings and reveal heterogeneity could benefit future research. Lastly, extending future research into institutional quality, governance, and policy variables could better help understand the mediating or moderating role regulatory environment into energy transition.
Author Contributions
Conceptualization, L.G.M, A.M, and R.N.T; methodology, L.G.M and R.N.T; data curation , L.G.M; formal analysis, L.G.M. and R.N.T; writing-original draft preparation, L.G.M, writing-review and editing, L.G.M and R.N.T. All authors have read and agreed to the published version of the manuscript.
Funding
This research received no external funding.
Data Availability Statement
The data that this study use, which was obtained from multiple data repository, can be found on the following links: https://ourworldindata.org/energy-production-consumption (for renewable and non-renewable energy), https://data.worldbank.org/indicator/SL.UEM.TOTL.ZS (for unemployment rate), https://data.worldbank.org/indicator/SP.POP.GROW (for population growth), and https://www.resbank.co.za/en/home/what-we-do/statistics (for financial development and gross domestic product per capita).
Conflicts of Interest
The authors declare no conflicts of interest.
References
- Abbasi, K. R.; Adedoyin, F. F.; Abbas, J.; Hussain, K. The Impact of Energy Depletion and Renewable Energy on CO2 Emissions in Thailand: Fresh Evidence from the Novel Dynamic ARDL Simulation. Renewable Energy 2021, 180, 1439–1450. [Google Scholar] [CrossRef]
- Abbas, M.; Yang, L. Measuring the Long-run Effect of Economic Growth, Population Aging, and Unemployment on Carbon Emissions in South Asia. Pakistan Journal of Commerce and Social Sciences 2024, 18, 113–133. [Google Scholar] [CrossRef]
- Abu-Goodman, A.; Güngör, H.; Usman, M. Are Impacts of Renewable Energy and Globalization on Carbon Neutrality Targets Asymmetric in South Africa? A Reconsideration using Nonlinear ARDL Approach. Environmental Science and Pollution Research 2022, 29, 51345–51359. [Google Scholar] [CrossRef]
- Acar, S.; Altintas, N.; Haziyev, V. The Effect of Financial Development and Economic Growth on Ecological Footprint in Azerbaijan: an ARDL Bound Test Approach with Structural Breaks. Environmental and Ecological Statistics 2023, 30, 41–59. [Google Scholar] [CrossRef]
- Adams, S.; Klobodu, E.K.M. Financial Development and Environmental Degradation: Does Political Regime Matter? Journal of Cleaner Production 2018, 197, 1472–1479. [Google Scholar] [CrossRef]
- Aghayeva, I.; Zortuk, M. The Impact of Renewable and Non-renewable Energy Consumption on Economic Growth in Azerbaijan: FB-ARDL and A-ARDL Cointegration Approachs. Green Economics 2024, 2, 119–133. [Google Scholar] [CrossRef]
- Ahmed, Z.; Zhang, B.; Gary, M. Linking Economic Globalization, Economic Growth, Financial Development, and Ecological Footprint: Evidence from Symmetric and Asymmetric ARDL. Ecological Indicators 2021, 121, 107060. [Google Scholar] [CrossRef]
- Alexandra, J. The Science and Politics of Climate Risk Assessment in Australia’s Murray Darling Basin. Environmental Science and Policy 2020, 112, 17–27. [Google Scholar] [CrossRef]
- Ali, U.; Guo, Q.; Kartal, M.T.; Nurgazina, Z.; Khan, Z.A.; Sharif, A. The Impact of Renewable and Non-renewable Energy Consumption on Carbon Emission Intensity in China: Fresh Evidence from Novel Dynamic ARDL Simulations. Journal of Environmental Management 2022, 320, 115782. [Google Scholar] [CrossRef]
- Al-Mulali, U.; Ozturk, I. The Investigation of Environmental Kuznets Curve Hypothesis in the Advanced Economies: The Role of Energy Prices. Renewable and Sustainable Energy Reviews 2016, 54, 1622–1631. [Google Scholar] [CrossRef]
- Al-Mulali, U.; Solarin, S. A.; Ozturk, I. Investigating the Presence of the Environmental Kuznets Curve (EKC) Hypothesis in Kenya: An Autoregressive Distributed Lag (ARDL) Approach. Natural Hazards 2016, 80, 729–1747. [Google Scholar] [CrossRef]
- Anekwe, I.M.; Akpasi, S.O.; Mkhize, M.M.; Zhou, H.; Moyo, R.T.; Gaza, L. Renewable energy Investments in South Africa: Potentials and Challenges for a Sustainable Transition: A Review. Science Progress 2024, 107, 00368504241237347. [Google Scholar] [CrossRef] [PubMed]
- Anser, M. K.; Apergis, N.; Syed, Q. R.; Alola, A. A. Exploring a New Perspective of Sustainable Development Drive Through Environmental Phillips Curve in the Case of the BRICST Countries. Environmental Science and Pollution Research 2021, 28, 48112–48122. [Google Scholar] [CrossRef] [PubMed]
- Apergis, N.; Kuziboev, B.; Abdullaev, I.; Rajabov, A. Investigating the Association Between CO2 Emissions, Renewable and Non-renewable Energy Consumption in Uzbekistan: An ARDL Approach. Environmental Science and Pollution Research 2023, 30, 39666–39679. [Google Scholar] [CrossRef] [PubMed]
- Arshad, Z.; Robaina, M.; Botelho, A. Renewable and Non-renewable Energy, Economic Growth and Natural Resources Impact on Environmental Quality: Empirical Evidence from South and Southeast Asian Countries with CS-ARDL Modelling. International Journal of Energy Economics and Policy 2020, 10, 368–383. [Google Scholar]
- Atakmak, T. K.; Beayar, M. K.; Alola, A. A. Environmental Effect of High-, Upper, and Lower Middle-income Economies Energy Mix: Is there a Trade-off Between Unemployment andEnvironmental Quality? Energy and Environment 2025, 36, 851–869. [Google Scholar]
- Ayad, H.; Djedaiet, A. Does the Unemployment Rate Matter for Environmental Issues in the G7 Nations? New Testing for the Environmental Phillips Curve Using the Load Capacity Factor. Environment, Development and Sustainability 2024, 1–13. [Google Scholar] [CrossRef]
- Aziz, N.; Sharif, A.; Raza, A.; Rong, K. Revisiting the Role of Forestry, Agriculture, and Renewable Energy in Testing Environment Kuznets Curve in Pakistan: Evidence from Quantile ARDL Approach. Environmental Science and Pollution Research 2020, 27, 10115–10128. [Google Scholar] [CrossRef]
- Belaid, F.; Zrelli, M. H. Renewable and Non-renewable Electricity Consumption, Environmental Degradation and Economic Development: Evidence from Mediterranean Countries. Energy Policy 2019, 133, 110929. [Google Scholar] [CrossRef]
- Ben-Ahmed, K.; Melebary, S. J.; Bawazir, T. K. Environmental Degradation, Renewable Energy, and Non-Renewable Energy Consumption in Saudi Arabia: An ARDL Bound Testing Approach. Sustainability 2025, 17, 4970. [Google Scholar] [CrossRef]
- Boluk, G.; Mert, M. The Renewable Energy, Growth, and Environmental Kuznets Curve in Turkey: An ARDL Approach. Renewable and Sustainable Energy Reviews 2015, 52, 587–595. [Google Scholar] [CrossRef]
- Cenit, M.; Aslan, A.; Sariqul, S. S. Analysis of the Dynamics of Environmental Degradation for 18 Upper Middle-income Countries: The Role of Financial Development. Environmental Science and Pollution Research 2022, 29, 64647–64664. [Google Scholar] [CrossRef]
- Chandio, A.A.; Jiang, Y.; Fatima, T.; Ahmad, F.; Ahmad, M.; Li, J. Assessing the Impacts of Climate Change on Cereal Production in Bangladesh: Evidence from ARDL Modelling Approach. International Journal of Climate Change Strategies and Management 2022, 14, 125–147. [Google Scholar] [CrossRef]
- Chaouali, I.; Jebli, M. B.; Gam, I. An Assessment of the Influence of Clean Energy and Service Development on Environmental Degradation: Evidence for a Non-linear ARDL Approach for Tunisia. Environmental Science and Pollution Research 2023, 30, 80364–80377. [Google Scholar] [CrossRef] [PubMed]
- Chien, F. How Renewable Energy and Non-renewable Energy Affect Environmental Excellence in N-11 Economies? Renewable Energy 2022, 196, 526–534. [Google Scholar] [CrossRef]
- Chudik, A.; Mohaddes, K.; Pesaran, M.H.; Raissi, M. Essays in Honor of Aman Ullah; Emerald Group Publishing Limited: Leeds, England, 2016; pp. 85–135. [Google Scholar]
- Climate, Transparency. Climate transparency report 2022. 2020. Available online: https://climate-transparency.org/g20-climate-performance/the-climate-transparency-report-2020 (accessed on 02 December 2025).
- Cui, Y.; Wang, G.; Irfan, M.; Wu, D.; Cao, J. The Effect of Green Finance and Unemployment Rate on Carbon Emissions in China. Frontiers in Environmental Science 2022, 10, 887341. [Google Scholar] [CrossRef]
- Council for Geoscience. Karoo Deep Drilling Project. 2023. Available online: https://www.geoscience.org.za/project/karoo-deep-drilling-project/#:~:text=South%20Africa%20has%20an%20estimated,of%20the%20country's%20petroleum%20regulations (accessed on 20 December 2025).
- Department of Mineral Resources and Energy. South African Energy Sector Report. 2024. Available online: https://www.dmre.gov.za/Portals/0/Resources/Publications/Reports/Energy%20Sector%20Reports/SA%20Energy%20Sector%20Report/2023-South-African-Energy-Sector-Report.pdf?ver=6TOu3ZWrjDaMhxVQWcR3vQ%3D%3D (accessed on 21 December 2025).
- Department of Mineral Resources and Energy. Coal. 2025. Available online: https://www.dmre.gov.za/energy-resources/energy-sources/coal/overview (accessed on 21 December 2025).
- Depren, S.K.; Kartal, M.T.; Çelikdemir, N.Ç.; Depren, Ö. Energy Consumption and Environmental Degradation Nexus: A Systematic Review and Meta-analysis of Fossil Fuel and Renewable Energy Consumption. Ecological Informatics 2022, 70, 101747. [Google Scholar] [CrossRef]
- Dimnwobi, S. K.; Ekesiobi, C.; Madichie, C. V.; Asongu, S. A. Population Dynamics and Environmental Quality in Africa. Science of the Total Environment 2021, 797, 149172. [Google Scholar] [CrossRef]
- Dinda, S. Environmental Kuznets Curve Hypothesis: A Survey. Ecological Economics 2004, 49, 431–455. [Google Scholar] [CrossRef]
- Esquivias, M. A.; Hassan, O. I.; Sheikh, A. Evidence-based Examination of the Consequences of Financial Development on Environmental Degradation in the Indian Setting, Using the ARDL Model. International Journal of Energy Economics and Policy 2023, 13, 281–290. [Google Scholar] [CrossRef]
- Green Building Africa [GBA]. GBA. 2025. Available online: https://www.greenbuildingafrica.co.za/coal-drops-to-74-31-of-south-africas-electricity-generation-mix/ (accessed on 6 August 2025).
- Ghose, T. K.; Islam, M. R.; Aruka, K.; Jannat, A. Disaggregated Impact of Non-Renewable Energy Consumption on the Environmental Sustainability of the United States: A Novel Dynamic ARDL Approach. Sustainability 2024, 16, 8434. [Google Scholar] [CrossRef]
- Guo, B.; Guo, Q.; Amri, F.; Abbas, S.; Nghiem, X.H. Powering Environmental Sustainability through Renewable Energy and Natural Resources: A Dynamic ARDL Simulation Approach. Environmental Science and Pollution Research 2023, 30, 90906–90923. [Google Scholar] [CrossRef] [PubMed]
- Haciimamoglu, T. A New Approach to Sustainable Development: Analysis of theEnvironmental Phillips Curve Hypothesis. Sosyoekonomi 2023, 31, 11–25. [Google Scholar] [CrossRef]
- Hafiza, N. S.; Sheikh, S. M.; Sadiq, A.; Rahman, S. U. Effect of Financial Development, Economic Growth on Environment Pollution: Evidence from G-7 Based ARDL Cointegration Approach. Pakistan Journal of Humanities and Social Sciences 2023, 11, 68–79. [Google Scholar] [CrossRef]
- Hunjra, A.I.; Hassan, M.K.; Zaied, Y.B.; Managi, S. Nexus between Green Finance, Environmental Degradation, and Sustainable Development: Evidence from Developing Countries. Resources Policy 2023, 81, 103371. [Google Scholar] [CrossRef]
- Hussain, I.; Rahman, A. Exploring the Dynamic Interaction of CO2 Emission on Population Growth, Foreign Investment, and Renewable Energy by Employing ARDL Bounds Testing Approach. Environmental Science and Pollution Research 2021, 28, 39387–39397. [Google Scholar] [CrossRef]
- Hussain, M.; Rehman, R. U.; Bashir, U. Environmental Pollution, Innovation, and Financial Development: An Empirical Investigation in Selected Industrialized Countries Using the Panel ARDL Approach. Environment, Development, and Sustainability 2024, 26. [Google Scholar] [CrossRef]
- International Energy Agency[IEA. Energy System of South Africa. 2025. Available online: https://www.iea.org/countries/south-africa (accessed on 19 November 2025).
- Kashem, M.A.; Rahman, M.M. Environmental Phillips Curve: OECD and Asian NICs Perspective. Environmental Science and Pollution Research 2020, 27, 31153–31170. [Google Scholar] [CrossRef]
- Kanayo, O.; Maponya, L.; Semenya, D. Evaluating the Dynamic Effects of Environmental Taxation and Energy Transition on Greenhouse Gas Emissions in South Africa: An Autoregressive Distributed Lag (ARDL) Approach. Sustainability 2025, 17, 5531. [Google Scholar] [CrossRef]
- Khoza, S.; Biyase, M. The Symmetric and Asymmetric Effect of Financial Development on Ecological Footprint in South Africa: ARDL and NARDL Approach. Frontiers in Environmental Science 2024, 12, 1347977. [Google Scholar] [CrossRef]
- Kinnunen, J.; Georgescu, I.; Nica, L. Evaluating the Environmental Phillips Curve Hypothesis in the STIRPAT Framework for Finland. Sustainability 2024, 16, 4381. [Google Scholar] [CrossRef]
- Kohlscheen, E.; Nakajima, J. Steady-state Growth. International Finance 2021, 24, 40–52. [Google Scholar] [CrossRef]
- Kuo, Y.; Maneengam, A.; The, C.P.; An, N.B.; Nassani, A.A.; Haffar, M.; Qadus, A. Fresh Evidence on Environmental Quality Measures using Natural Resources, Renewable Energy, Non-renewable Energy and Economic Growth for 10 Asian Nations from CS-ARDL Technique. Fuel 2022, 320, 123914. [Google Scholar] [CrossRef]
- Malik, M.Y.; Latif, K.; Khan, Z.; Butt, H.D.; Hussain, M.; Nadeem, M.A. Symmetric and asymmetric impact of oil price, FDI and economic growth on carbon emission in Pakistan: Evidence from ARDL and non-linear ARDL approach. Science of the Total Environment 2020, 726, 138421. [Google Scholar] [CrossRef]
- Musibau, H. O.; Shittu, W. O.; Ogunlani, F. O. The Relationship Between Environmental Degradation, Energy Use and Economic Growth in Nigeria: New Evidence from Non-linear ARDL. International Journal of Energy Sector Management 2021, 15, 81–100. [Google Scholar] [CrossRef]
- Mutezo, G.; Mulopo, J. A review of Africa's Transition from Fossil Fuels to Renewable Energy using Circular Economy Principles. Renewable and Sustainable Energy Reviews 2021, 137, 110609. [Google Scholar] [CrossRef]
- Nazir, M. I.; Nazir, M. R.; Hashmi, S. H.; Ali, Z. Environmental Kuznets Curve Hypothesis for Pakistan: Empirical Evidence Form ARDL Bound Testing and Causality Approach. International Journal of Green Energy 2018, 15, 947–957. [Google Scholar] [CrossRef]
- Ng, C.F.; Yii, K.J.; Lau, L.S.; Go, Y.H. Unemployment Rate, Clean Energy, and Ecological Footprint in OECD Countries. Environmental Science and Pollution Research 2023, 30, 42863–42872. [Google Scholar] [CrossRef]
- National Planning Commission [NPC. Energy. 2019. Available online: https://www.gov.za/sites/default/files/gcis_document/201802/npc-energy-paper.pdf (accessed on 02 December 2025).
- National Planning Commission [NPC. Energy. 2023. Available online: https://www.nationalplanningcommission.org.za/assets/Documents/Energy%20Position%20Paper_.pdf (accessed on 02 December 2025).
- Nyeadi, J.D. The Impact of Financial Development and Foreign Direct Investment on Environmental Sustainability in Sub-Saharan Africa: Using PMG-ARDL Approach. Economic research-Ekonomska istraživanja 2023, 36. [Google Scholar] [CrossRef]
- Okumus, I.; Guzel, A.E.; Destek, M.A. Renewable, Non-renewable Energy Consumption and Economic Growth Nexus in G7: Fresh Evidence from CS-ARDL. Environmental Science and Pollution Research 2021, 28, 56595–56605. [Google Scholar] [CrossRef]
- Osuntuyi, B.V.; Lean, H.H. Economic Growth, Energy Consumption and Environmental Degradation Nexus in Heterogeneous Countries: Does Education Matter? Environmental Sciences Europe 2022, 34, 48. [Google Scholar] [CrossRef]
- Rahman, H.; Ghazali, A.; Bhatti, G. A.; Khan, S. U. Role of Economic Growth, Financial Development, Trade, Energy and FDI in Environmental Kuznets Curve for Lithuania: Evidence from ARDL Bounds Testing Approach. Inzinerine Ekonomika-Engineering Economics 2020, 31, 39–49. [Google Scholar] [CrossRef]
- Rahman, Z. U.; Ahmad, S.; Khan, A. Bridging the EPC and IPAT in the Rresence of Natural Resources in China: Considering Asymmetries in Environmental-related Technologies andUnemployment. Resources Policy 2025, 103, 105523. [Google Scholar] [CrossRef]
- Rjoub, H.; Odugbesan, J.A.; Adebayo, T.S.; Wong, W.K. Sustainability of the Moderating Role of Financial Development in the Determinants of Environmental Degradation: Evidence from Turkey. Sustainability 2021, 13, 1844. [Google Scholar] [CrossRef]
- Sahin, G.; Naimoglu, M.; Kavaz, I.; Sahin, A. Examining the Environmental Phillips Curve Hypothesis in the Ten Most Polluting Emerging Economies: Economic Dynamics and Sustainability. Sustainability 2025, 17, 920. [Google Scholar] [CrossRef]
- Sanli, M. D.; Songur, M.; Ugurlu, E. The Asymmetric Effect of Renewable and Non-renewable Energy on Carbon Emissions in OECD: New Evidence from Non-linear Panel ARDL Model. Frontiers in Environmental Science 2023, 11, 1228296. [Google Scholar] [CrossRef]
- Saunders, M.; Bristow, A.; Lewis, P.; Thornhill, A. Research Methods for Business Students (Chapter 4). Understanding research philosophy and approaches to theory development 2015, 122–161. [Google Scholar]
- Sehrawat, M.; Giri, A.K.; Mohapatra, G. The Impact of Financial Development, Economic Growth and Energy Consumption on Environmental Degradation: Evidence from India. Management of Environmental Quality: An International Journal 2015, 26, 666–682. [Google Scholar] [CrossRef]
- Shahbaz, M.; Sharma, R.; Sinha, A.; Jiao, Z. Analyzing Nonlinear Impact of Economic Growth Drivers on CO2 Emissions: Designing an SDG Framework for India. Energy Policy 2021, 148, 111965. [Google Scholar] [CrossRef]
- Shah, A. A.; Hussain, M. S.; Nawar, M. A.; Iqbal, M. Nexus of Renewable Energy Consumption, Economic Growth, Population Growth, FDI, and Environmental Degradation in South Asian Countries: New Evidence from Driscoll-Kraay Standard Error Approach. iRASD Journal of Economics 2021, 3, 200–211. [Google Scholar] [CrossRef]
- Shastri, S.; Mohapatra, G.; Giri, A.K. Economic Growth, Renewable and Non-renewable Energy Consumption Nexus in India: Evidences from Nonlinear ARDL Approach and Asymmetric Causality Analysis. International Journal of Energy Sector Management 2020, 14, 777–792. [Google Scholar] [CrossRef]
- Shehzad, K.; Zaman, U.; Ahmad, M.; Kocak, E. Governance, Financial Development, and Environmental Degradation: Evidence from Symmetric and Asymmetric ARDL. Environment, Development and Sustainability 2023, 25, 14643–14660. [Google Scholar] [CrossRef]
- Shi, S.; Smith, L. Decoupling growth from degradation: a CS-ARDL and MMQR panel analysis of ecological footprints and sustainable economic growth. Frontiers in Environmental Science 2025, 13, 1604011. [Google Scholar] [CrossRef]
- Stern, D. I. The Environmental Kuznets Curve, 1st Ed. ed; Routledge: Oxfordshire, England, 2018; pp. 49–54. [Google Scholar]
- Tanveer, A.; Song, H.; Faheem, M.; Chaudhry, I.S. Validation of Environmental Philips curve in Pakistan: A Fresh Insight through ARDL Technique. Environmental Science and Pollution Research 2022, 29, 25060–25077. [Google Scholar] [CrossRef] [PubMed]
- Tariq, S.; Mehmood, U.; Haq, Z. U.; Mariam, A. Exploring the Existence of Environmental Phillips Curve in South Asian Countries. Environmental Science and Pollution Research 2022, 29, 35396–35407. [Google Scholar] [CrossRef]
- Udeagha, M. C.; Breitenbach, M. C. Exploring the Moderating Role of Financial Development in Environmental Kuznets Curve for South Africa: Fresh Evidence from the Novel Dynamic ARDL Simulations Approach. Financial Innovation 2023, 9, 5. [Google Scholar] [CrossRef]
- Udeagha, A.; Ngepah, N. A roadmap to a Green Economy in South Africa: Modelling Technological Innovation and Energy Consumption in the Novel Dynamic ARDL Simulations Framework. Environmental Science and Pollution Research 2024, 31, 6789–6808. [Google Scholar] [CrossRef]
- Udeagha, M. C.; Ngepah, N. Disaggregating the Environmental Effects of Renewable and Nonrenewable Energy Consumption in South Africa: Fresh Evidence from the Novel Dynamic ARDL Simulations Approach. Economic Change and Restructuring 2021, 55, 1767–1814. [Google Scholar] [CrossRef]
- Ukoba, K.; Jen, T.C.; Yusuf, A.A. Transformation of South Africa’s Energy Landscape: Policy Implications, Opportunities, and Technological Innovations in the Fourth Industrial Revolution. Energy Strategy Reviews 2025, 9, 11. [Google Scholar] [CrossRef]
- Lacovidou, E.; Hahladakis, J.N.; Purnell, P. A Systems Thinking Approach to Understanding the Challenges of Achieving the Circular Economy. Environmental Science and Pollution Research 2021, 28, 24785–24806. [Google Scholar] [CrossRef]
- Vermeulen, C. On the Mandate, Ownership and Independence of the South African Reserve Bank. South African Journal of Economic and Management Sciences 2020, 23, 1–11. [Google Scholar] [CrossRef]
- Voumik, L. C.; Ridwan, M. Impact of FDI, Industrialization, and Education on the Environment in Argentina: ARDL Approach. Heliyon 2023, 9, 1–12. [Google Scholar] [CrossRef]
- Wang, H. Role of Environmental Degradation and Energy Use for Agricultural Economic Growth: Sustainable Implications Based on ARDL Estimation. Environmental Technology and Innovation 2022, 25, 1–12. [Google Scholar] [CrossRef]
- Yahaya, N. S.; Hussaini, M.; Bashir, A. B. Population Growth and Environmental Degradation in Nigeria. Academic Journal of Economic Studies 2020, 6, 31–35. [Google Scholar]
- Yurtkuran, S. The Effect of Agriculture, Renewable Energy Production, and Globalization on CO2 Emissions in Turkey: A Bootstrap ARDL Approach. Renewable Energy 2021, 171, 1236–1245. [Google Scholar] [CrossRef]
- Zambrano-Monseratte, M. A.; Fernandez, M. A. An Environmental Kuznets Curve for N2O Emissions in Germany: An ARDL Approach. Natural Resources Forum 2017, 41, 119–127. [Google Scholar] [CrossRef]
- Zhang, L.; Godil, D.I.; Bibi, M.; Khan, M.K.; Sarwat, S.; Anser, M.K. Caring for the environment: How human capital, natural resources, and economic growth interact with environmental degradation in Pakistan? A dynamic ARDL approach. Science of the Total Environment 2021, 774, 145553. [Google Scholar] [CrossRef]
- Zambrano-Monserrate, M.; Valverde-Bajana, I.; Aguilar-Bohorquez, J.; Mendoza-Jimenez, M. J. Relationship between Economic Growth and Environmental Degradation: Is there Evidence of an Environmental Kuznets Curve for Brazil? International Journal of Energy Economics and Policy 2016, 6, 208–216. [Google Scholar]
Figure 1.
Trend analysis of CO2 emissions in South Africa. Source: Compiled from data collected for Our World in Data.
Figure 1.
Trend analysis of CO2 emissions in South Africa. Source: Compiled from data collected for Our World in Data.
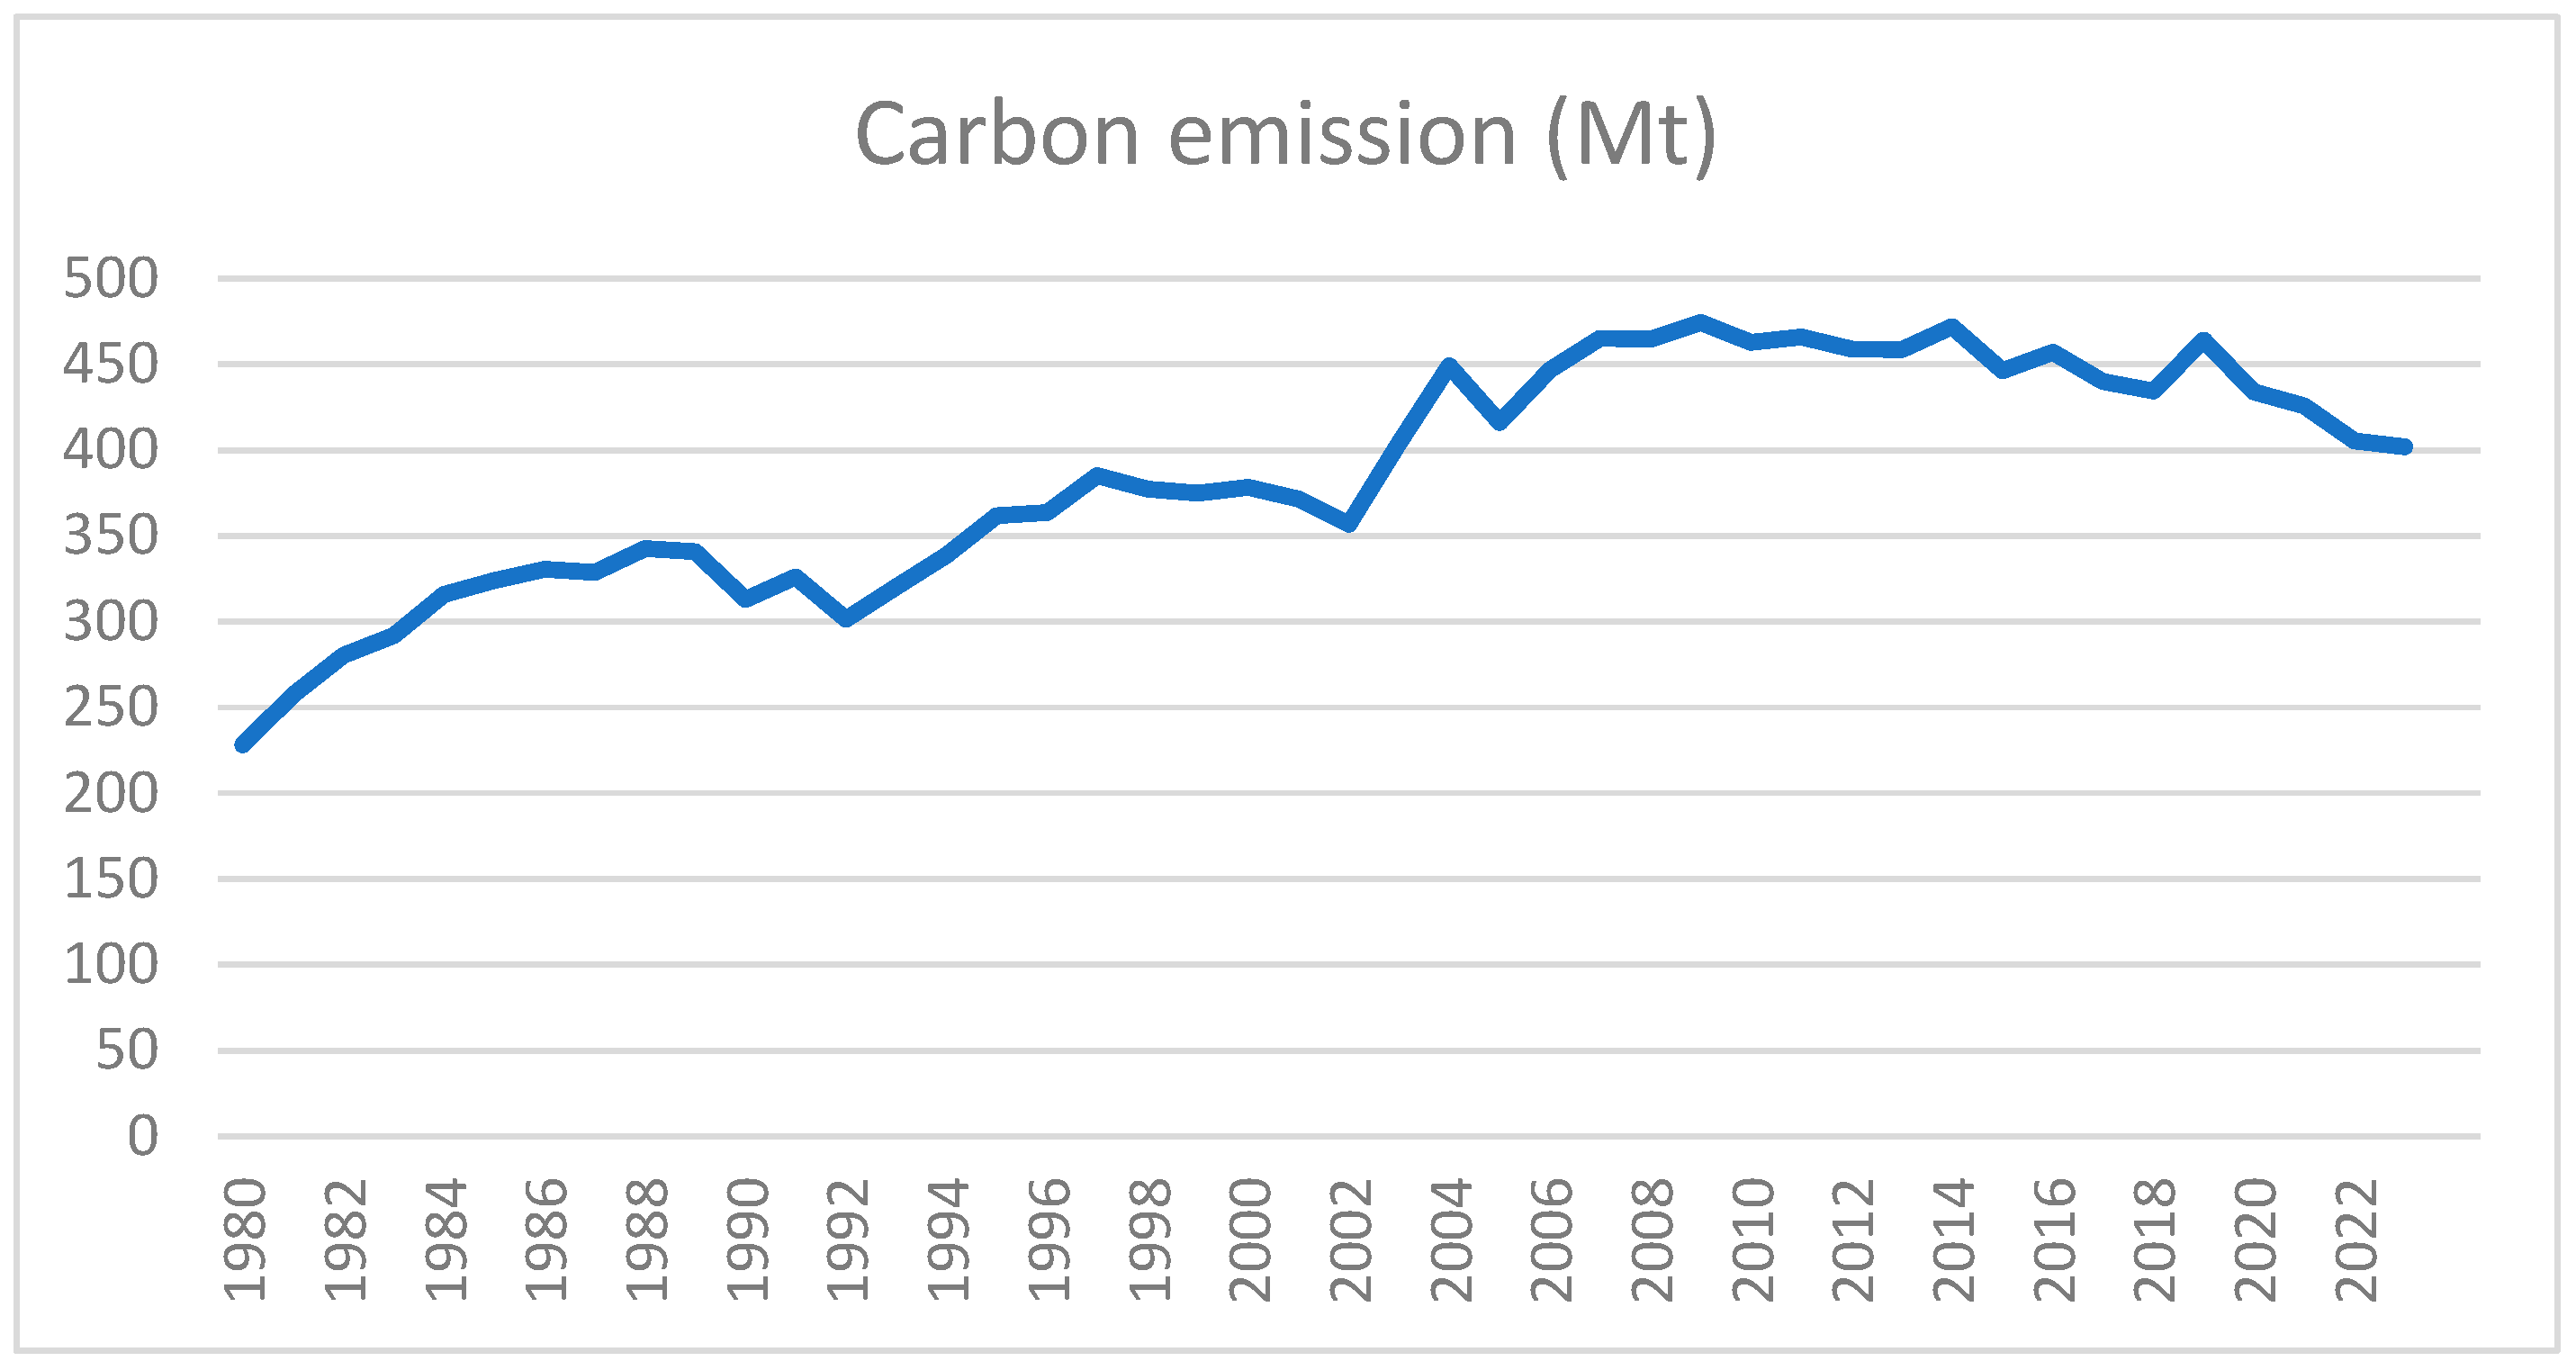
Figure 2.
Total share of electricity by source, South Africa. Source: Department of Minerals Resources and Energy (DMRE) (2024).
Figure 2.
Total share of electricity by source, South Africa. Source: Department of Minerals Resources and Energy (DMRE) (2024).
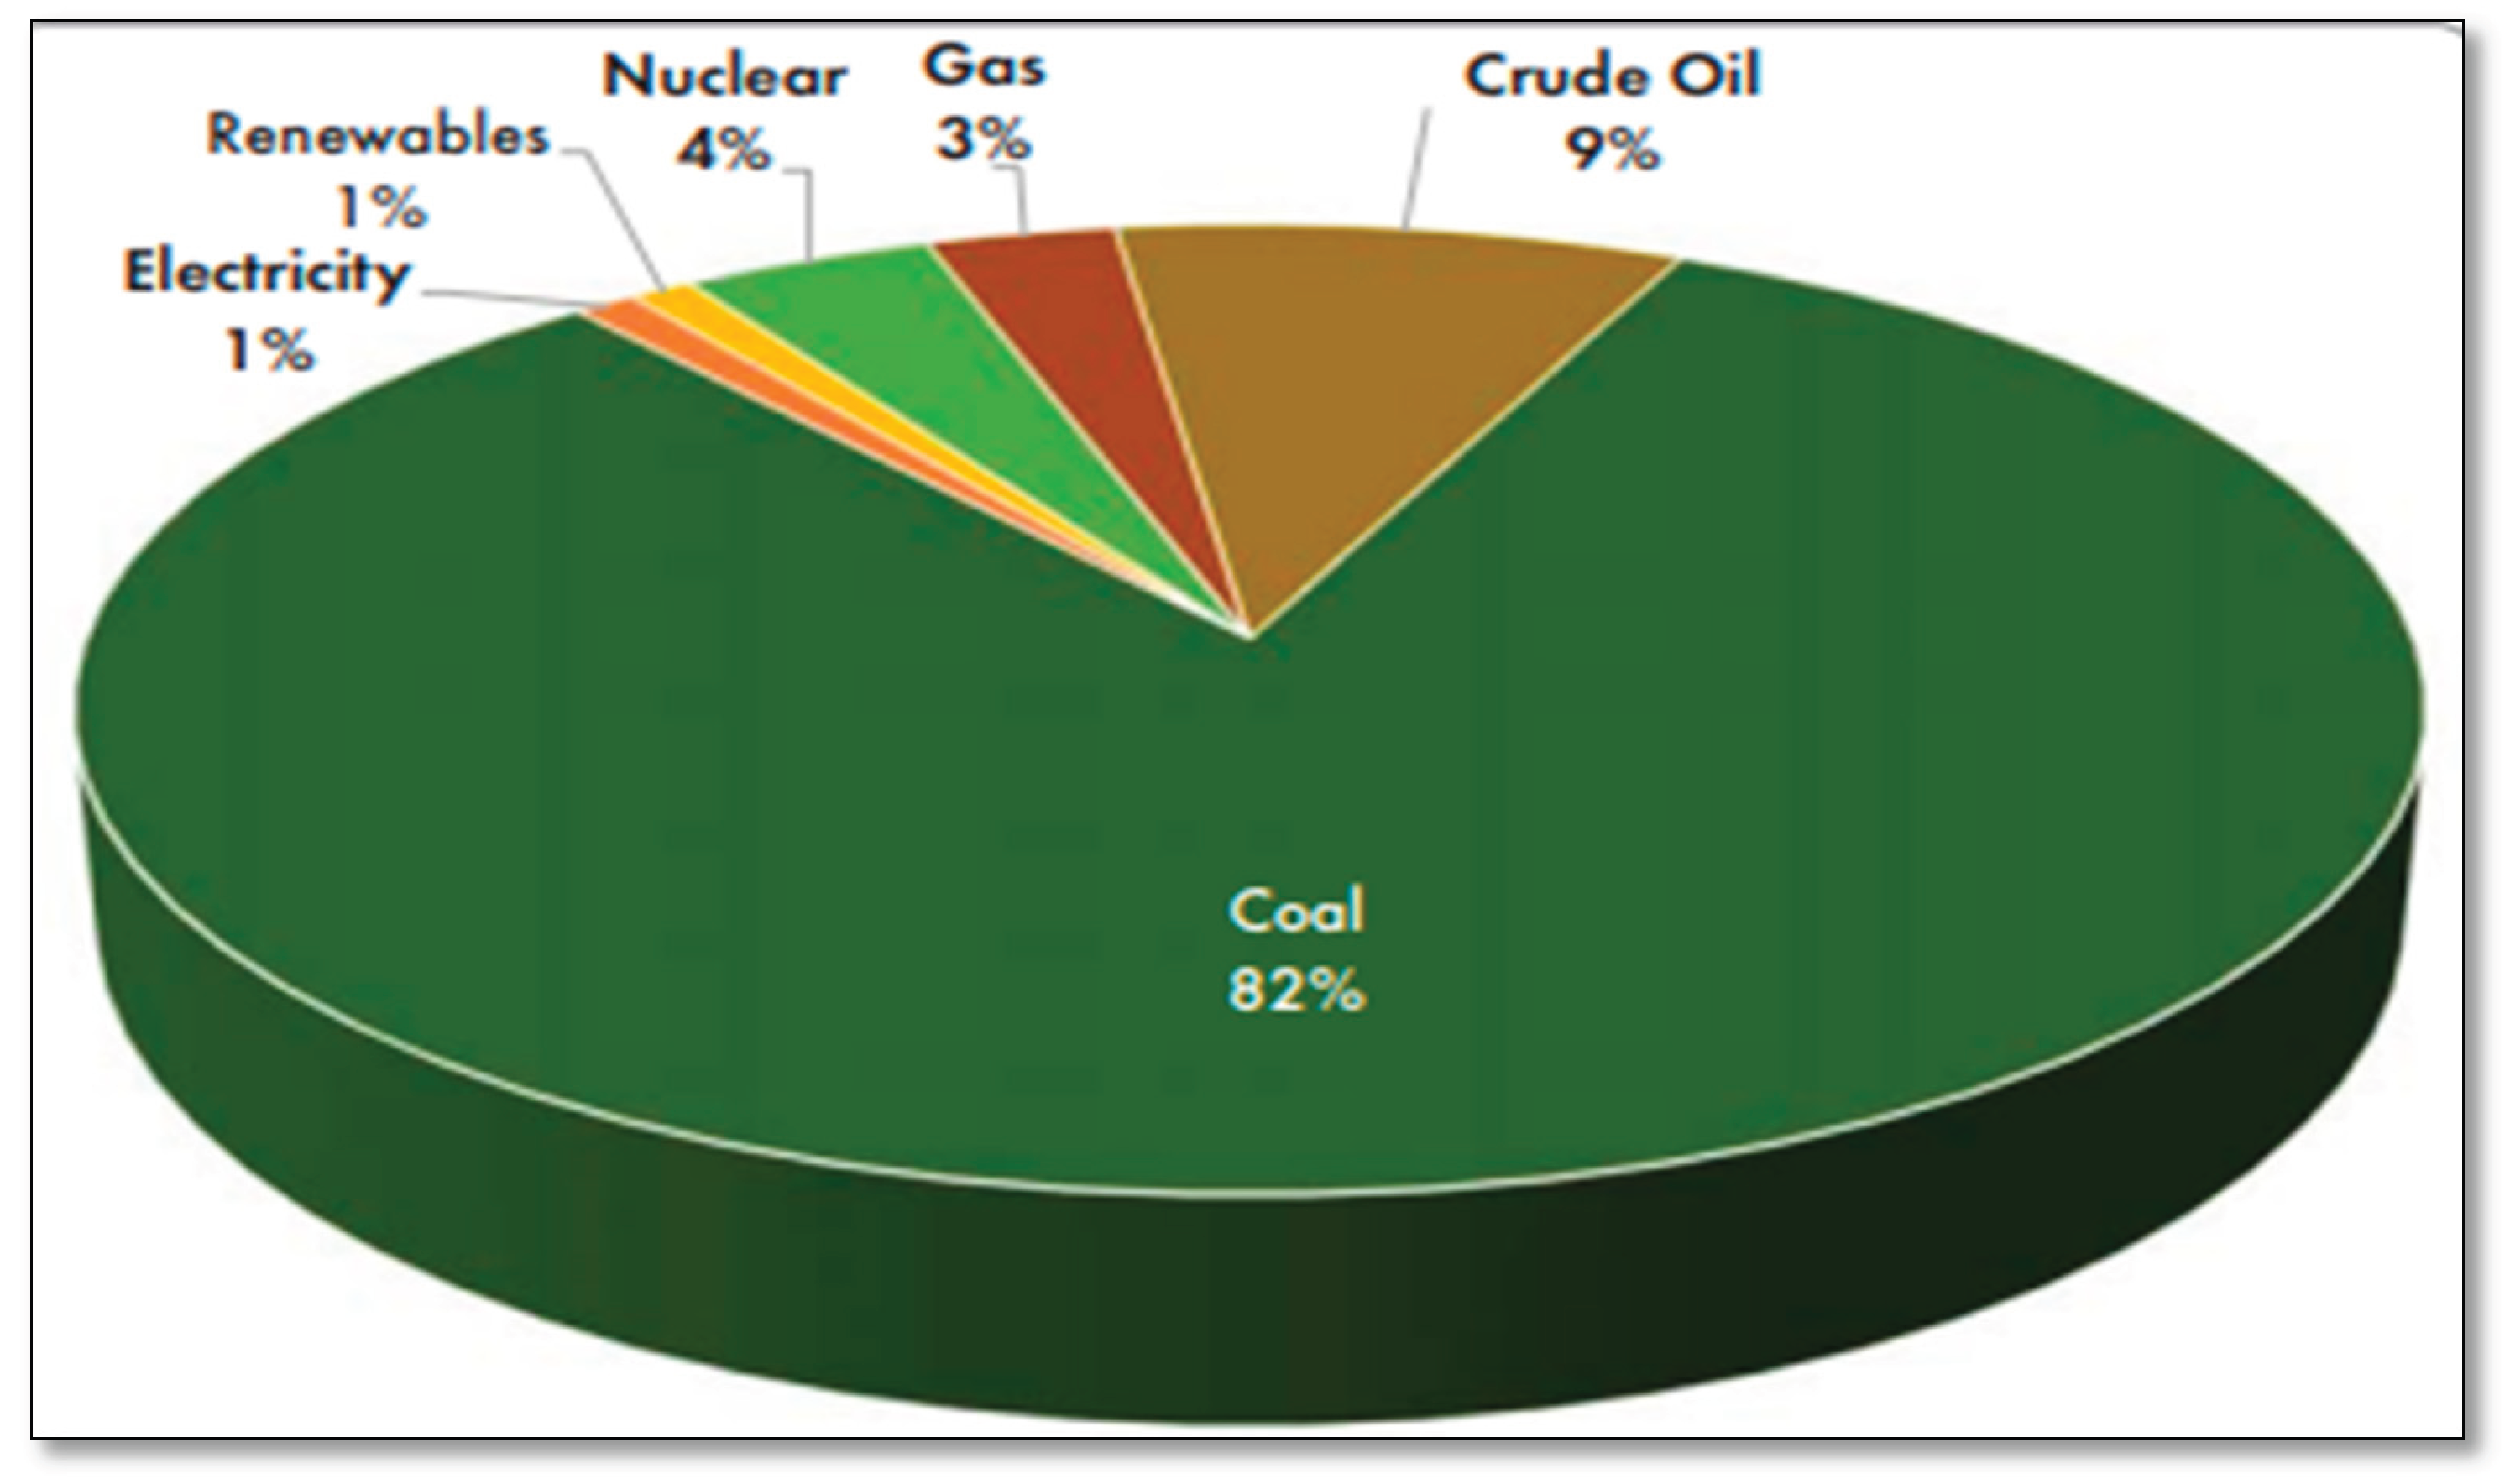

Table 1.
Operationalization of variables.
| Variable | Denotation | Measurement |
|---|---|---|
| Environmental degradation | CO2 | Emissions from the consumption of fossil fuels (coal, oil, gas, & flaring) and cement manufacturing, measured in millions of tons. |
| Financial development | FD | proxied by total credit extended to the domestic private sector. Measured in thousands of thousands of rands. |
| Renewable energy | RE | sum of energy produced by solar, wind, hydro, and biomass, measured in terawatt-hours (Twh). |
| non-renewable energy | NRE | sum of energy produced from coal, gas, nuclear, and oil, measured in terawatt-hours (Twh). |
| Unemployment rate | UNE | % of the labour force without job and is actively seeking employment. Number of Unemployed Individuals / Total Labor Force) x 100. |
| Gross domestic product per capita | GDPPC | GDPPC = . Measured in thousands of rands. |
| Population growth | PoPG | Population growth = ( is the population for current year while is the previous year’s population. Measured in percentages. |
Table 2.
Descriptive statistics.
| lnCO2 | lnRE | lnNRE | lnFD | lnGDPPC | lnUNE | lnPoPG | |
|---|---|---|---|---|---|---|---|
| Mean | 19.83199 | 1.905622 | 6.842393 | 11.10335 | 10.59556 | 3.204458 | 0.193221 |
| Maximum | 20.01946 | 3.916582 | 6.995005 | 12.95522 | 11.60443 | 3.535145 | 0.826218 |
| Minimum | 19.53270 | -0.839977 | 6.644770 | 7.995307 | 9.240870 | 2.827314 | -0.424896 |
| Std. Dev | 0.132203 | 1.101700 | 0.110610 | 1.347595 | 0.736088 | 0.141324 | 0.303079 |
| Skewness | -0.651467 | 0.138099 | -0.356087 | -0.587482 | -0.312028 | -0.077501 | 0.070162 |
| Kurtosis | 2.365489 | 2.868652 | 1.809568 | 2.316204 | 1.773277 | 4.115382 | 2.412554 |
| Jarque-Bera | 2.800322 | 0.124717 | 2.565759 | 2.464155 | 2.525729 | 1.690802 | 0.486377 |
| Probability | 0.246557 | 0.939546 | 0.277238 | 0.291686 | 0.282843 | 0.429385 | 0.784124 |
Source: EViews output.
Table 3.
ADF stationarity test results.
| ADF | ||||||
|---|---|---|---|---|---|---|
| Variables | Level | 1st diff | ||||
| Intercept | Trend & Intercept | None | Intercept | Trend & Intercept | None | |
| lnCO2 | 0.3514 | 0.9223 | 0.8655 | 0.0000*** | 0.0000*** | 0.0000*** |
| lnRE | 0.5870 | 0.0120** | 0.6103 | 0.0000*** | 0.0000*** | 0.0000*** |
| lnNRE | 0.3135 | 0.8167 | 0.8647 | 0.0000*** | 0.0001*** | 0.0000*** |
| lnFD | 0.0524* | 0.0815* | 0.9994 | 0.0000*** | 0.0004*** | 0.0000*** |
| lnUNE | 0.8256 | 0.5164 | 0.8906 | 0.0006*** | 0.0026*** | 0.0021*** |
| lnGDPPC | 0.0010*** | 0.9953 | 0.9697 | 0.0212** | 0.0011*** | 0.2784 |
| lnPoPG | 0.0512* | 0.1532 | 0.0190** | 0.2573 | 0.0001*** | 0.0321** |
Source: EViews output. *, **, & *** denote significance at 10%, 5%, and 1%, respectively.
Table 4.
Phillips-Perron stationarity test results.
| Phillips-perron | ||||||
|---|---|---|---|---|---|---|
|
Variable |
Level | 1st diff | ||||
| Intercept | Trend & Intercept | None | Intercept | Trend & Intercept | None | |
| lnCO2 | 0.3587 | 0.9630 | 0.8729 | 0.0000*** | 0.0000*** | 0.0000*** |
| lnRE | 0.6966 | 0.0120** | 0.7987 | 0.0000*** | 0.0000*** | 0.0000 |
| lnNRE | 0.3225 | 0.9115 | 0.9014 | 0.0000*** | 0.0000*** | 0.0000*** |
| lnFD | 0.0300** | 0.0858* | 0.9993 | 0.0000*** | 0.0000*** | 0.0000*** |
| lnUNE | 0.8217 | 0.4905 | 0.9481 | 0.0003*** | 0.0006*** | 0.0000*** |
| lnGDPPC | 0.0013*** | 0.9953 | 1.0000 | 0.0196** | 0.0011*** | 0.2678 |
| lnPoPG | 0.0643* | 0.3145 | 0.0246** | 0.0000*** | 0.0000*** | 0.0000*** |
Source: EViews output. *, **, & *** denote significance at 10%, 5%, and 1%, respectively.
Table 5.
ARDL Bounds test results.
| Test Statistic | Value | Signif. | I(0) | I(1) |
|---|---|---|---|---|
| F-statistic K |
22.79664 6 |
1% | 2.88 | 3.99 |
| 5% | 2.27 | 3.28 |
Source: EViews output.
Table 6.
Long-run ARDL results.
| Variable | Coefficient | Std.err | t-statistic | P-value |
|---|---|---|---|---|
| LnCO2 | 0.105412 | 0.084163 | 1.252482 | 0.2296 |
| lnRE | 0.020549 | 0.006607 | 3.110070 | 0.0072*** |
| lnRE(-1) | 0.015475 | 0.005510 | 2.808407 | 0.0132** |
| lnFD | 0.011651 | 0.016167 | 0.720642 | 0.4822 |
| lnFD(-1) | -0.028079 | 0.014275 | -1.962798 | 0.0685* |
| lnFD(-2) | -0.037080 | 0.015582 | -2.379735 | 0.0310** |
| lnUNE | -0.032371 | 0.044564 | -0.726403 | 0.4788 |
| lnPoPG | 0.015751 | 0.014553 | 1.082343 | 0.2962 |
| lnPoPG(-1) | -0.018175 | 0.016712 | -1.087546 | 0.2940 |
| lnPoPG(-2) | -0.074021 | 0.020399 | -3.682708 | 0.0025*** |
| lnNRE | 0.744821 | 0.100766 | 7.391614 | 0.0000*** |
| lnGDPPC | 1.201628 | 0.192998 | 6.226118 | 0.0000*** |
| lnGDPPC(-1) | -0.434713 | 0.227808 | -1.908239 | 0.0757* |
| lnGDPPC(-2) | -0.193472 | 0.165226 | -1.170956 | 0.2599 |
| Cons | 6.878929 | 1.398905 | 4.917367 | 0.0002*** |
Source: EViews output. *, **, & *** denote significance at 10%, 5%, and 1%, respectively.
Table 7.
Short-run ARDL results.
| Variables | Coefficient | Std. err | t-statistic | P-value |
|---|---|---|---|---|
| lnRE | 0.020549 | 0.003877 | 5.300566 | 0.0001*** |
| lnFD | 0.011651 | 0.008910 | 1.307549 | 0.2107 |
| LnFD(-1) | 0.037080 | 0.007493 | 4.948363 | 0.0002*** |
| lnPoPG | 0.015751 | 0.009486 | 1.660519 | 0.1176 |
| LnPoPG(-1) | 0.074021 | 0.011615 | 6.372838 | 0.0000*** |
| lnGDPPC | 1.201628 | 0.114179 | 10.52405 | 0.0000*** |
| LnGDPPC(-1) | 0.193472 | 0.093596 | 2.067106 | 0.0564* |
| ECM | -0.894588 | 0.054699 | -16.35483 | 0.0000*** |
Source: EViews output. *, **, & *** denote significance at 10%, 5%, and 1%, respectively.
Table 8.
Diagnostic tests.
| Test | F-statistic | P-value |
|---|---|---|
| Breusch-Pagan-Godfrey test | 0.8516 | 0.6156 |
| Breusch-Godfrey LM test | 0.2389 | 0.7909 |
| Jarque-Bera | P-value | |
| Normality | 0.9003 | 0.6375 |
| T-statistic | P-value (5%) | |
| Recursive sum test (CUSUM) | 0.2894 | 0.9479 |
Source: EViews.
Disclaimer/Publisher’s Note: The statements, opinions and data contained in all publications are solely those of the individual author(s) and contributor(s) and not of MDPI and/or the editor(s). MDPI and/or the editor(s) disclaim responsibility for any injury to people or property resulting from any ideas, methods, instructions or products referred to in the content. |
© 2026 by the authors. Licensee MDPI, Basel, Switzerland. This article is an open access article distributed under the terms and conditions of the Creative Commons Attribution (CC BY) license (http://creativecommons.org/licenses/by/4.0/).
Copyright: This open access article is published under a Creative Commons CC BY 4.0 license, which permit the free download, distribution, and reuse, provided that the author and preprint are cited in any reuse.


