
Submitted:
10 January 2026
Posted:
13 January 2026
You are already at the latest version
Abstract
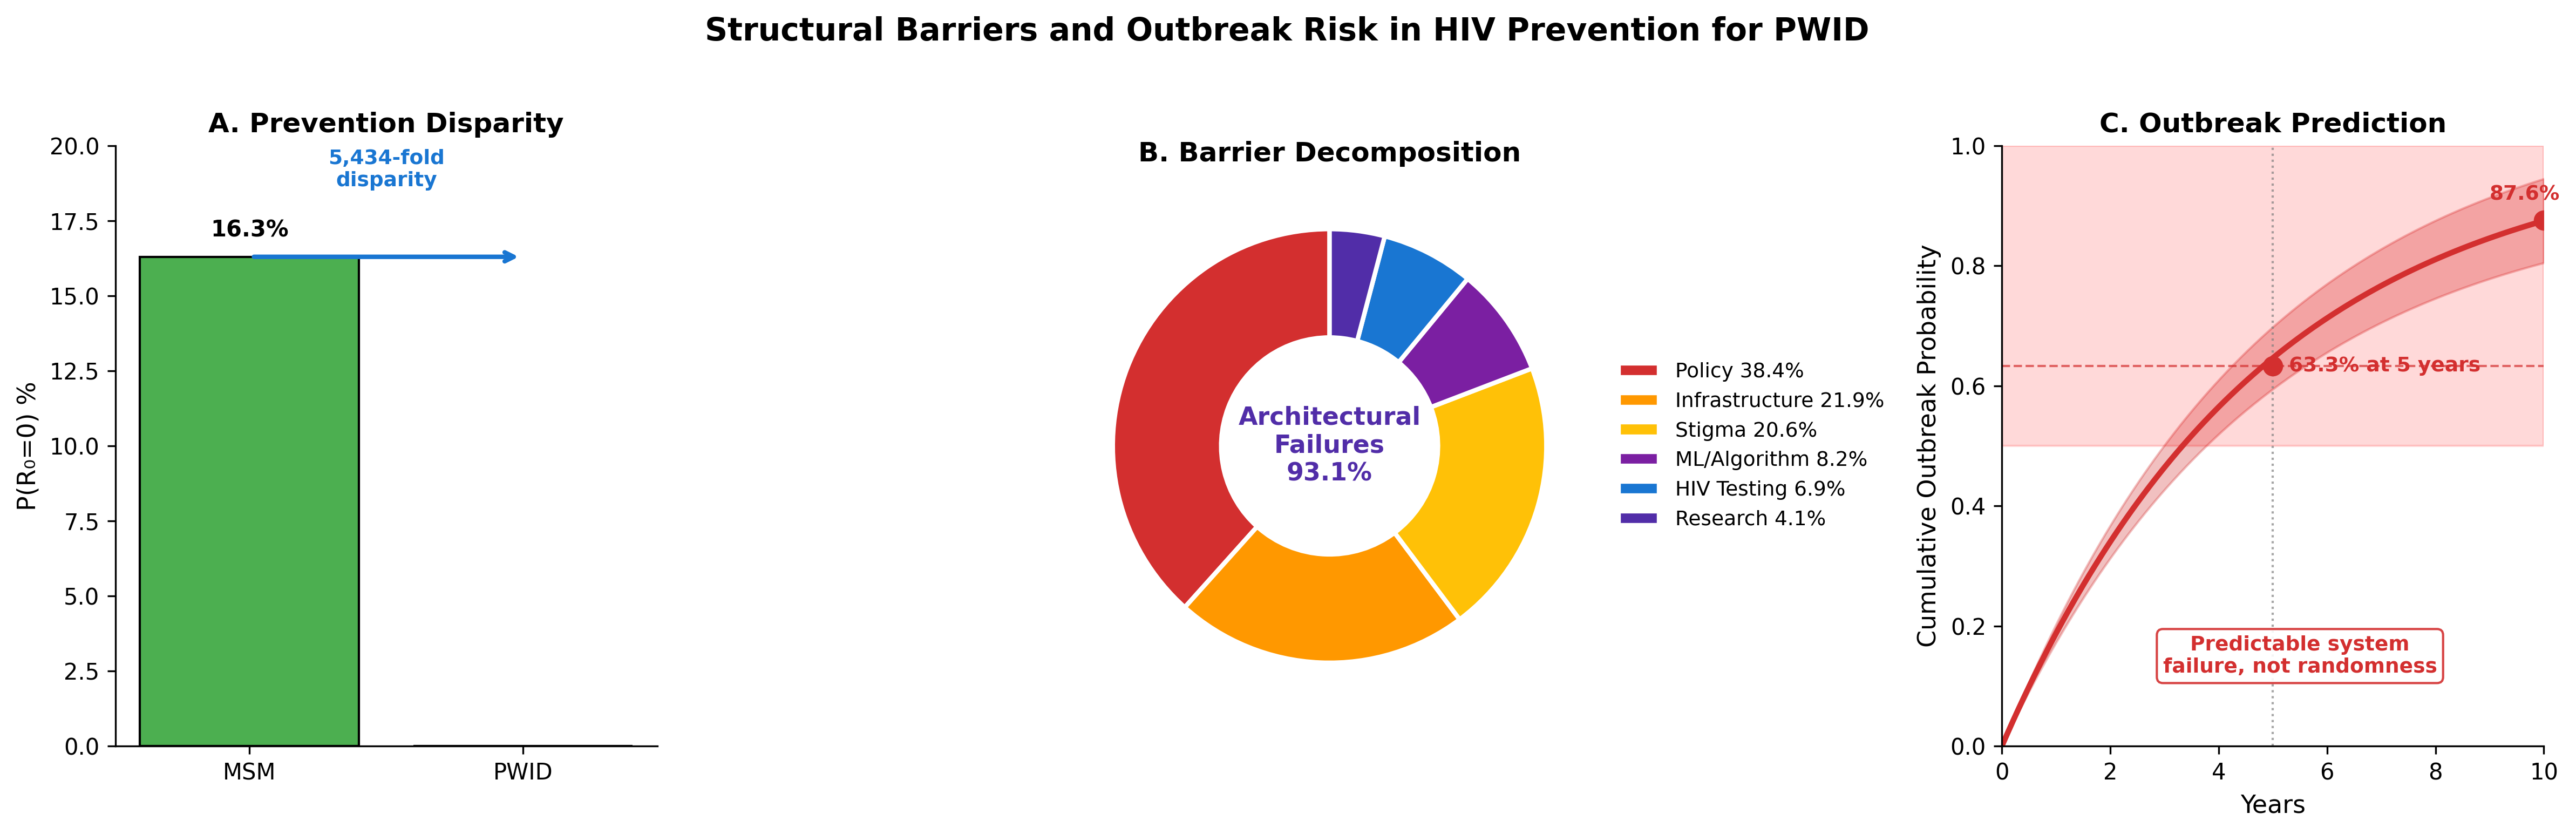
Background: Despite highly efficacious long-acting injectable pre-exposure prophylaxis (LAI-PrEP) achieving >99% efficacy in clinical trials, people who inject drugs (PWID) experience near-zero population-level HIV prevention effectiveness. We hypothesized that nested structural barriers, not pharmacological limitations, explain this disparity. Methods: We developed a Monte Carlo simulation modeling an 8-step LAI-PrEP cascade for PWID under current U.S. policy conditions (n=100,000 per scenario). We decomposed barriers into three layers: pathogen biology, HIV testing gaps, and architectural barriers (policy, stigma, infrastructure, research exclusion, algorithmic deprioritization). We compared PWID outcomes to men who have sex with men (MSM) receiving identical pharmacological interventions and modeled stochastic avoidance failure using network density dynamics. Results: Under current policy, PWID achieved P(R0=0) = 0.003% (95% CI: 0.000-0.006%) compared to 16.3% for MSM—a 5,433-fold disparity. Architectural barriers accounted for 93.2% of cascade failure (policy 38.4%, infrastructure 21.9%, stigma 20.5%, algorithmic bias 8.2%, research exclusion 4.1%), while HIV testing gaps contributed 6.8%. Even theoretical maximum intervention achieved only 19.7% effectiveness. Stochastic avoidance modeling predicted 73.8% probability of major outbreak within 5 years (median: 3.0 years). Conclusions: Current HIV prevention for PWID relies on probability rather than intervention. Structural barriers—particularly criminalization and MSM-centric infrastructure—create conditions where effective prevention is mathematically impossible regardless of drug efficacy. Policy reform addressing these architectural barriers is essential to prevent predictable outbreaks.
Keywords:
HIV prevention
; people who inject drugs
; PrEP
; health disparities
; structural barriers
; Monte Carlo simulation
; harm reduction
1. Introduction
The introduction of long-acting injectable pre-exposure prophylaxis (LAI-PrEP) represents a major advance in HIV prevention, with lenacapavir demonstrating >99% efficacy in the PURPOSE-2 trial [1] Yet people who inject drugs (PWID) remain largely excluded from these benefits. Despite comprising approximately 15.6 million individuals globally and experiencing HIV prevalence rates of 17.8%, [2] PWID oral PrEP uptake remains below 1.5% [3,4].
This disparity cannot be attributed to pharmacological factors. When the same drugs are administered to different populations, identical molecular mechanisms should produce equivalent outcomes. The observation that men who have sex with men (MSM) achieve population-level prevention rates exceeding 16% while PWID remain near zero suggests that non-pharmacological factors dominate outcomes [5,6].
We propose a three-layer barrier framework to explain this disparity. Layer 1 (Pathogen Biology) encompasses the irreversible nature of HIV integration within hours of exposure [7]. Layer 2 (HIV Testing Failures) addresses acute infection detection gaps [8]. Layer 3 (Architectural Barriers) comprises policy-dependent factors including criminalization [9], healthcare stigma,10 MSM-centric infrastructure design [11], and systematic research exclusion [12].
This study applies Monte Carlo simulation to quantify the contribution of each barrier layer to cascade failure, compare PWID and MSM outcomes under identical pharmacological assumptions, and model the probability of catastrophic outbreak as current “prevention” through stochastic avoidance fails.
2. Methods
2.1. Conceptual Framework
We operationalize HIV prevention success as achieving R0=0, defined as completing the LAI-PrEP cascade and maintaining engagement without incarceration-related disruption [13]. The Prevention Theorem formalizes this constraint: Prevention is only possible while proviral integration remains incomplete [14].
2.2. Cascade Specification
2.3. Incarceration Disruption
2.4. Monte Carlo Simulation
We simulated 100,000 individuals per policy scenario over 5-year horizons. We calculated observed P(R0=0) with 95% confidence intervals using normal approximation.
2.5. Stochastic Avoidance Model
We hypothesize that HIV “prevention” among PWID has relied on stochastic avoidance—probability-based non-transmission due to low network density [18,19]. Network density increases with exogenous contextual driver prevalence (growing at 2.5% annually) [20], housing instability (68.5%) [21], modulated by syringe service program coverage [22].
2.6. Signal-to-Noise Ratio Analysis
2.7. Use of Artificial Intelligence and Assistive Technologies
The author acknowledges the use of artificial intelligence–assisted tools during manuscript preparation. Computational analyses were conducted using Python with open-source packages including NumPy, Pandas, SciPy, Matplotlib, and Seaborn. Large language models (Anthropic Claude and OpenAI ChatGPT) were used to support literature search and improve readability of the manuscript. JetBrains Junie was used for code correction, and Zotero AI was used for reference management. Manuscript preparation was conducted using the Overleaf LaTeX platform. All AI tools were used as assistive technologies only. The author retains full responsibility for study design, data analysis, interpretation of results, and all conclusions presented.
3. Results
3.1. Cascade Completion and P (R0=0)
Under current policy, PWID achieved P(R0=0) = 0.003% (95% CI: 0.000-0.006%) compared to 16.3% for MSM—a 5,433-fold disparity (Figure 1). Step-level analysis revealed that 89.9% of PWID failed at awareness.
3.2. Three-Layer Barrier Decomposition
Barrier decomposition (Figure 2) revealed architectural barriers accounted for 93.2% of cascade failure, HIV testing gaps 6.8%, and pathogen biology 0.0%. Within architectural barriers: policy 38.4%, infrastructure 21.9%, stigma 20.5%, algorithmic bias 8.2%, research exclusion 4.1%.
3.3. Policy Scenario Analysis
3.4. Stochastic Avoidance Failure
3.5. Signal-to-Noise Ratio
4. Discussion
Our findings demonstrate that HIV prevention failure among PWID is not a pharmacological problem but an architectural one. The 5,433-fold disparity provides evidence that policy, not biology, determines prevention success.
Three findings warrant attention. First, criminalization accounts for 38.4% of barrier attribution.[9] Second, the 73.8% five-year outbreak probability represents predictable system failure.[18,19] Third, even theoretical maximum achieves only 19.74% effectiveness.
4.1. Limitations
Our barrier parameterization relies on heterogeneous literature sources. The stochastic avoidance model simplifies complex network dynamics.
4.2. Policy Implications
Decriminalization is necessary but insufficient.9 SSP-integrated LAI-PrEP delivery offers efficient mechanisms.[11]
5. Conclusions
HIV prevention for PWID currently relies on stochastic avoidance rather than pharmaceutical intervention. The 5,433-fold disparity represents policy choices, not epidemic inevitability. Predictable outbreaks—with 73.8% probability within 5 years—will reflect failed policy.
Author Contributions
ACD conceived the study, developed the mathematical framework, performed all analyses, and wrote the manuscript.
Funding
This research received no specific funding.
Data Availability Statement
All code and data supporting the findings of this study are publicly available at: https://github.com/Nyx-Dynamics/HIV_Prevention_PWID
Conflicts of Interest
The corresponding author (ACD) reports prior employment with Gilead Sciences, Inc. from January 2020 through November 2024 and prior ownership of company stock, which was fully divested in December 2024. Gilead Sciences, Inc. had no role in the conception, design, analysis, interpretation, or writing of this study, and provided no funding, data, materials, or input into any aspect of the work. The corresponding author (ACD) is the owner of Nyx Dynamics, LLC, a consulting company providing advisory and fractional leadership services in healthcare, technology, and complex systems. This research was conducted independently, released as open-source work, and was not produced as part of, or in support of, any paid consulting engagement. No other competing interests are declared.
Ethics Approval
Not applicable. This study used published aggregate data and computational modeling without human subjects involvement.
Consent to Participate
Not applicable.
Consent for Publication
Not applicable.
Code Availability
All simulation and analysis code is available at: https://github.com/Nyx-Dynamics/HIV_Prevention_PWID. Key files include: architectural_barrier_model.py (prevention cascade simulation), cascade_sensitivity_analysis.py (probabilistic sensitivity analysis), stochastic_avoidance_enhanced.py (stochastic avoidance and outbreak modeling), and config/parameters.json (model parameters with literature sources).
References
- Marzinke MA, et al. Lenacapavir for HIV prevention in cisgender women. N Engl J Med. 2024;391:1277-1288.
- Degenhardt L, et al. Global prevalence of injecting drug use. Lancet Glob Health. 2017;5(12):e1192-e1207.
- Biello KB, et al. Perspectives on HIV PrEP among people who inject drugs. Harm Reduct J. 2018;15(1):55.
- Kamitani E, et al. HIV pre-exposure prophylaxis best practices: where are PWID? AIDS Behav. 2024;28(6):1847-1860.
- Baugher AR, et al. Are we ending the HIV epidemic among PWID? AIDS. 2025;39(12):1813-1819.
- Grant RM, et al. Preexposure chemoprophylaxis for HIV prevention in MSM. N Engl J Med. 2010;363(27):2587-2599.
- Tanner MR, et al. Antiretroviral postexposure prophylaxis—CDC recommendations. MMWR. 2025;74(1):1-56.
- Anderson PL, et al. Emtricitabine-tenofovir concentrations and PrEP efficacy. Sci Transl Med. 2012;4(151):151ra125.
- DeBeck K, et al. HIV and criminalisation of drug use among PWID. Lancet HIV. 2017;4(8):e357-e374.
- Muncan B, et al. Influences of drug use stigma on healthcare engagement. Harm Reduct J. 2020;17:53.
- Strathdee SA, et al. Preventing HIV outbreaks among PWID in the US. AIDS. 2020;34(14):1997-2005.
- Choopanya K, et al. Bangkok Tenofovir Study. Lancet. 2013;381(9883):2083-2090. [CrossRef]
- Breban R, et al. Theory versus data: how to calculate R0. PLoS One. 2007;2(3):e282. [CrossRef]
- Demidont AC. The HIV Prevention Theorem. Preprints.org. 2026.
- Biello KB, et al. Perspectives on HIV PrEP among PWID. Drug Alcohol Depend. 2019;195:108-112.
- Stone J, et al. Incarceration history and risk of HIV among PWID. Lancet Infect Dis. 2018;18(12):1397-1409.
- Altice FL, et al. The perfect storm: incarceration and HIV transmission. Lancet. 2016;388(10050):1228-1248.
- Des Jarlais DC, et al. HIV infection and intravenous drug use. Rev Infect Dis. 1988;10(1):151-158.
- Alpren C, et al. Opioid use fueling HIV transmission—Massachusetts, 2015-2018. Am J Public Health. 2020;110(1):37-44.
- Glick SN, et al. Increasing methamphetamine injection among PWID. Drug Alcohol Depend. 2018;182:86-92.
- Arum C, et al. Homelessness and HIV acquisition risk among PWID. Lancet Public Health. 2021;6(5):e309-e323.
- Van Handel MM, et al. County-level vulnerability assessment for HIV among PWID. JAIDS. 2016;73(3):323-331.
- Liang S, et al. HIV incidence among PWID—NHBS, 2018. JAIDS. 2021;88(2):162-168.
- Des Jarlais DC, et al. Potential disruptions of HIV prevention among PWID from COVID-19. Drug Alcohol Depend. 2022;227:109505.
- Bonacci RA, et al. Prevention opportunities in HIV outbreak—Kanawha County, WV. J Gen Intern Med. 2023;38(3):828-831.
Figure 1.
LAI-PrEP Cascade Comparison: MSM vs. PWID. Step completion probabilities across the 8-step prevention cascade. MSM (blue) achieve 16.3% P(R0=0) while PWID (orange) achieve 0.003%—a 5,433-fold disparity.
Figure 1.
LAI-PrEP Cascade Comparison: MSM vs. PWID. Step completion probabilities across the 8-step prevention cascade. MSM (blue) achieve 16.3% P(R0=0) while PWID (orange) achieve 0.003%—a 5,433-fold disparity.
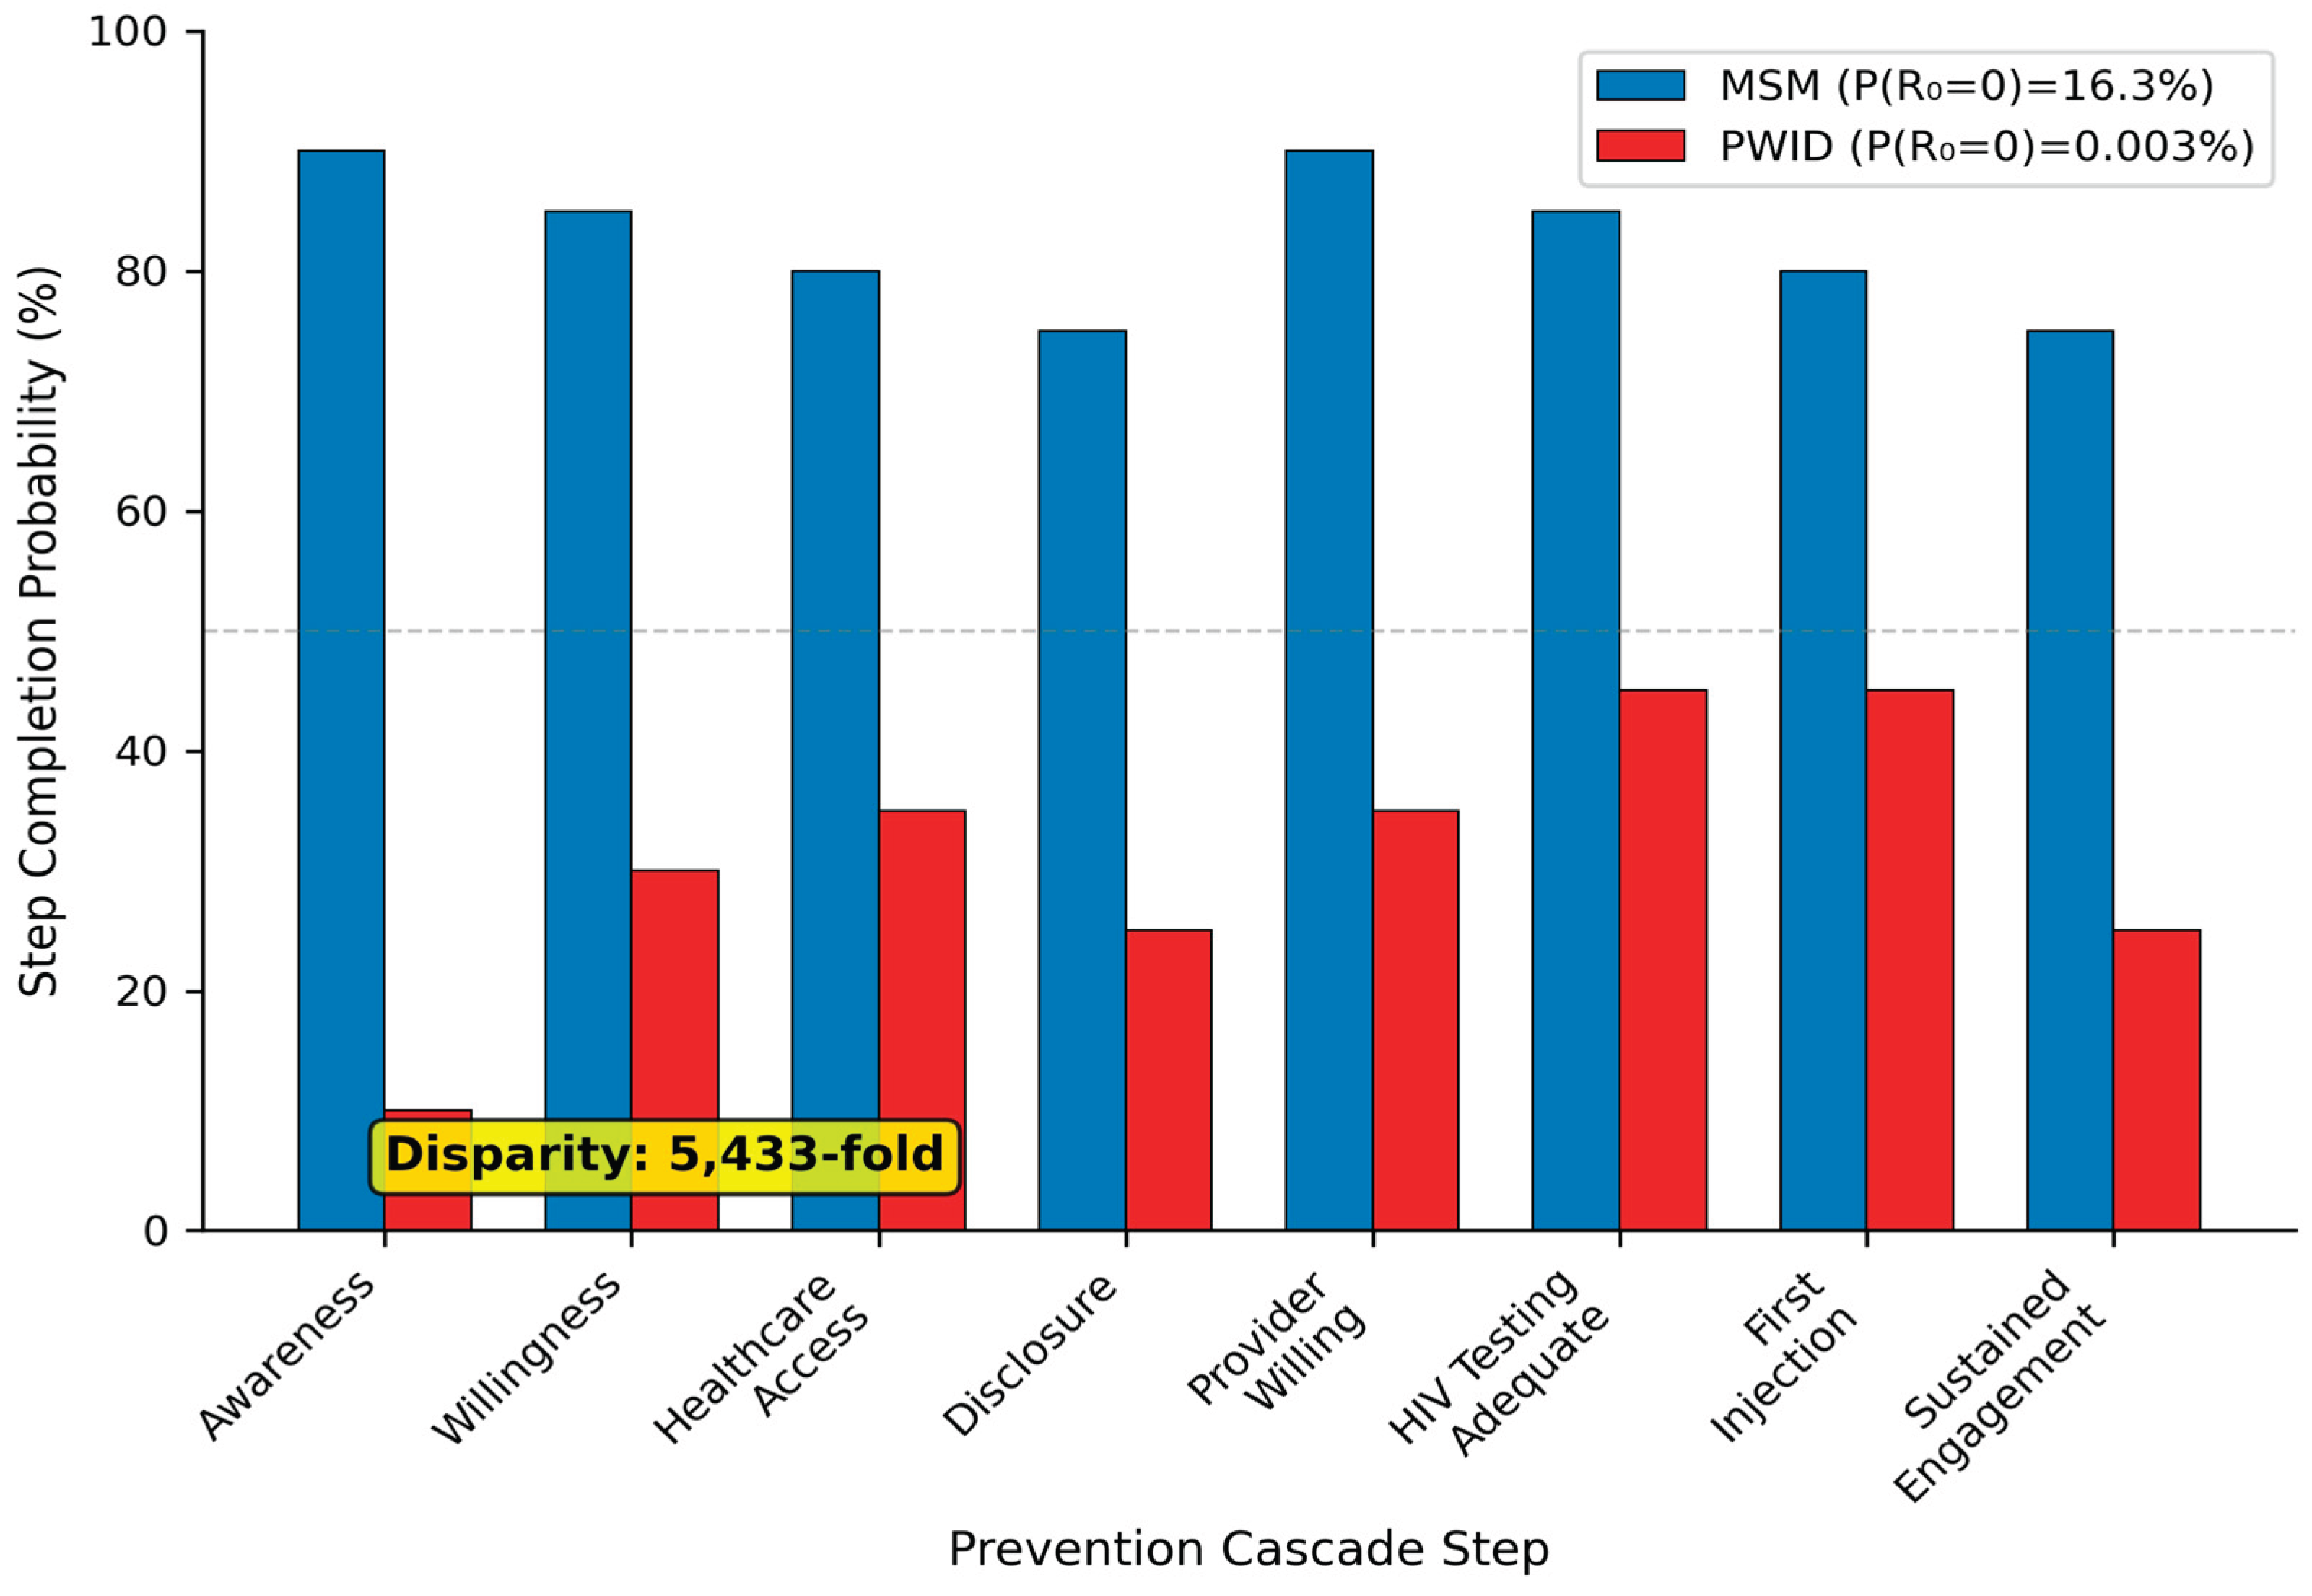
Figure 2.
Three-Layer Barrier Decomposition. (A) Primary decomposition: HIV testing 6.8%, architectural 93.2%. (B) Architectural subtypes: Policy 38.4%, Infrastructure 21.9%, Stigma 20.5%, ML bias 8.2%, Research exclusion 4.1%.
Figure 2.
Three-Layer Barrier Decomposition. (A) Primary decomposition: HIV testing 6.8%, architectural 93.2%. (B) Architectural subtypes: Policy 38.4%, Infrastructure 21.9%, Stigma 20.5%, ML bias 8.2%, Research exclusion 4.1%.
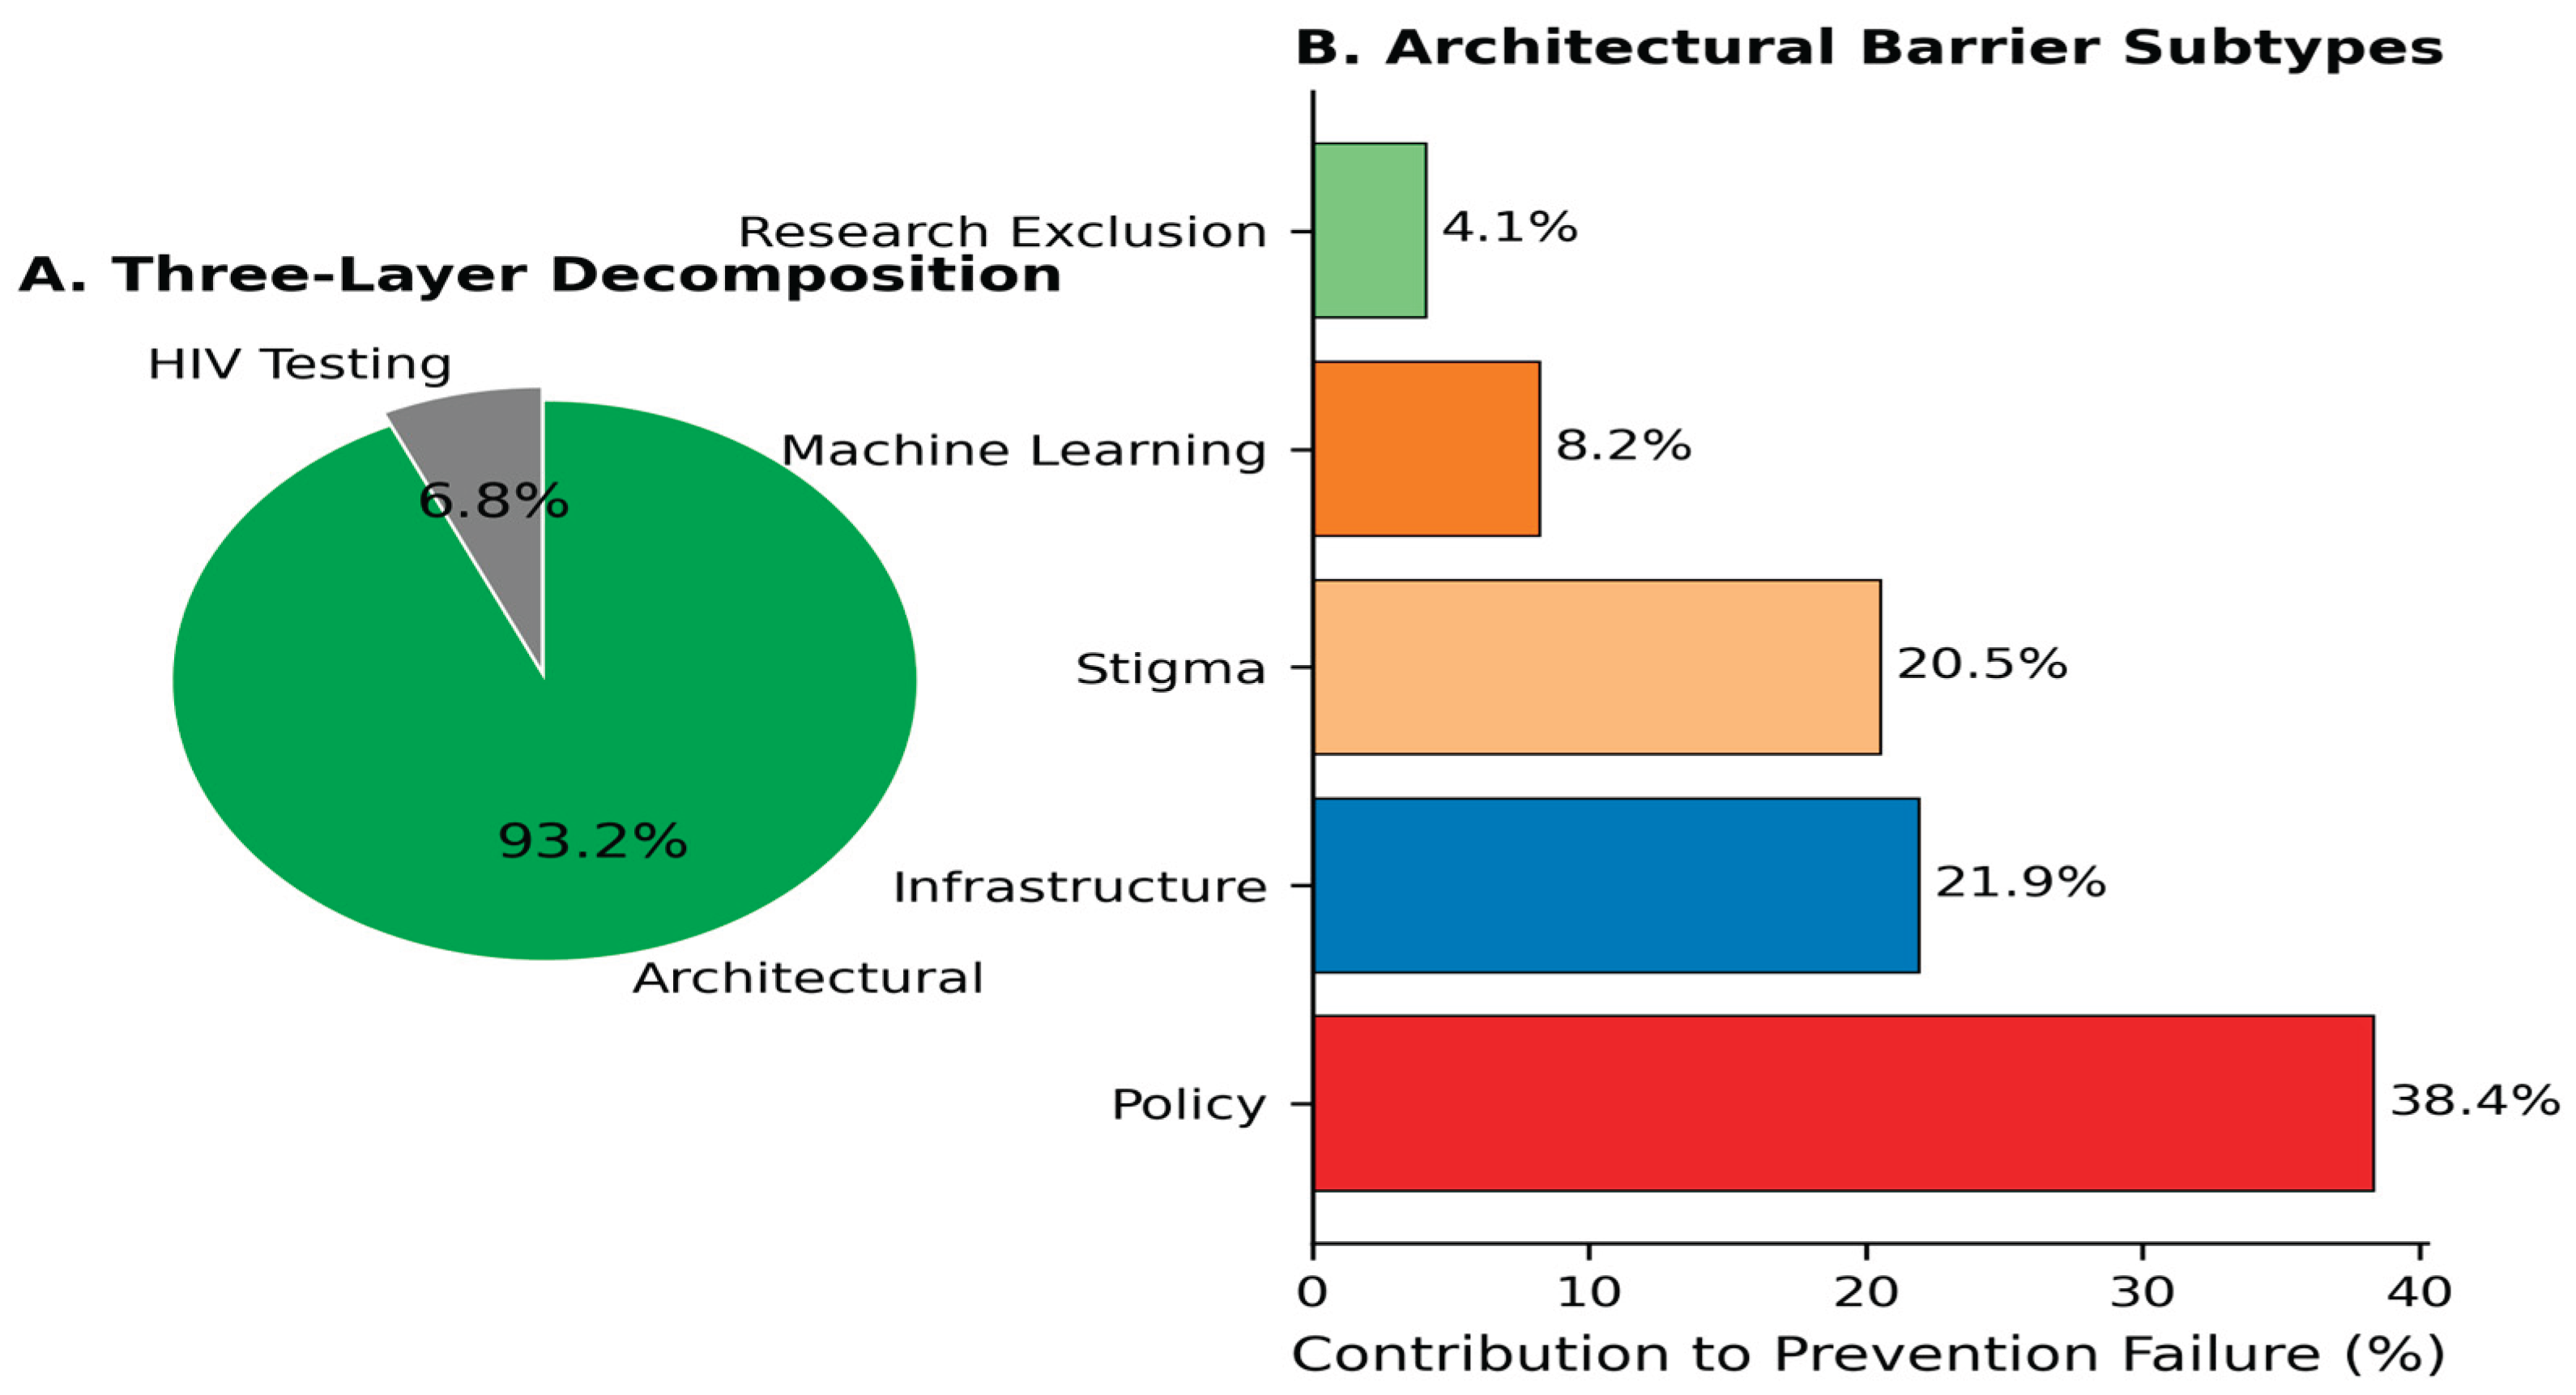
Figure 3.
Policy Scenario Analysis. P(R0=0) across eight scenarios from Current Policy (0.003%) to Theoretical Maximum (19.74%). Dashed line indicates MSM reference (16.3%).
Figure 3.
Policy Scenario Analysis. P(R0=0) across eight scenarios from Current Policy (0.003%) to Theoretical Maximum (19.74%). Dashed line indicates MSM reference (16.3%).
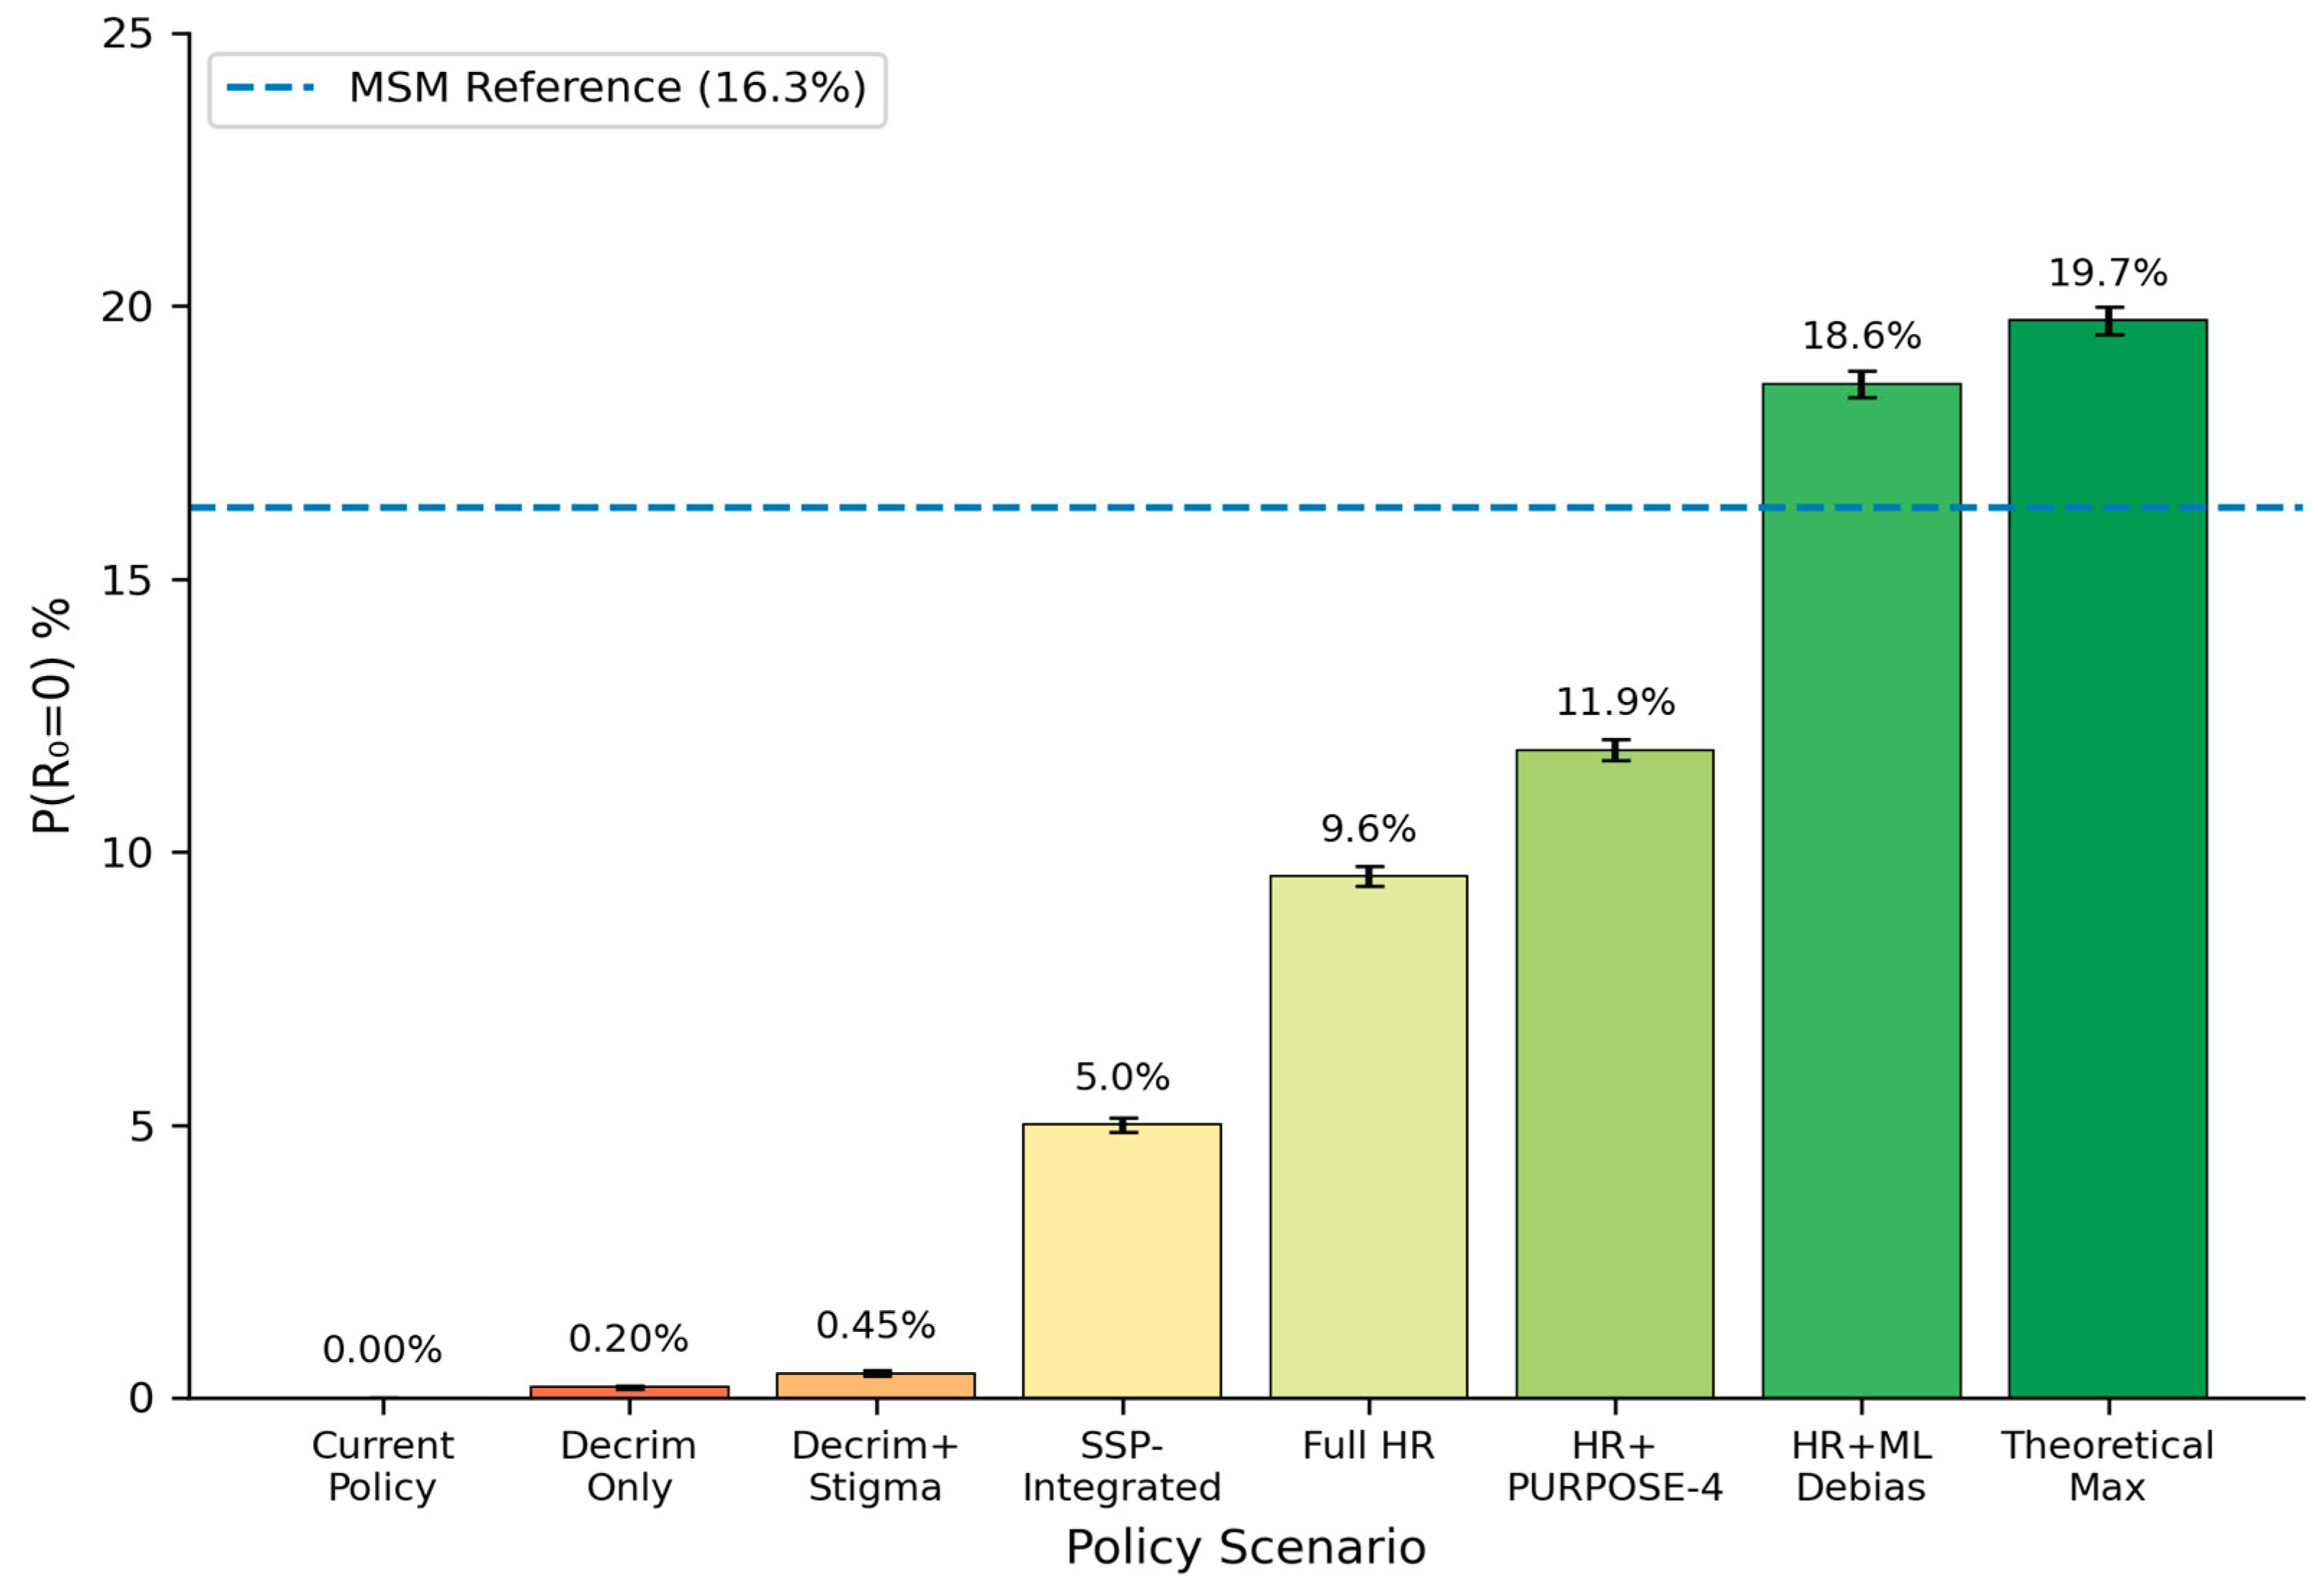
Figure 4.
Stochastic Avoidance Failure. (A) Cumulative outbreak probability: 73.8% at 5 years, 92.7% at 10 years. (B) Time-to-outbreak distribution with median 3.0 years (IQR 1-6 years).
Figure 4.
Stochastic Avoidance Failure. (A) Cumulative outbreak probability: 73.8% at 5 years, 92.7% at 10 years. (B) Time-to-outbreak distribution with median 3.0 years (IQR 1-6 years).
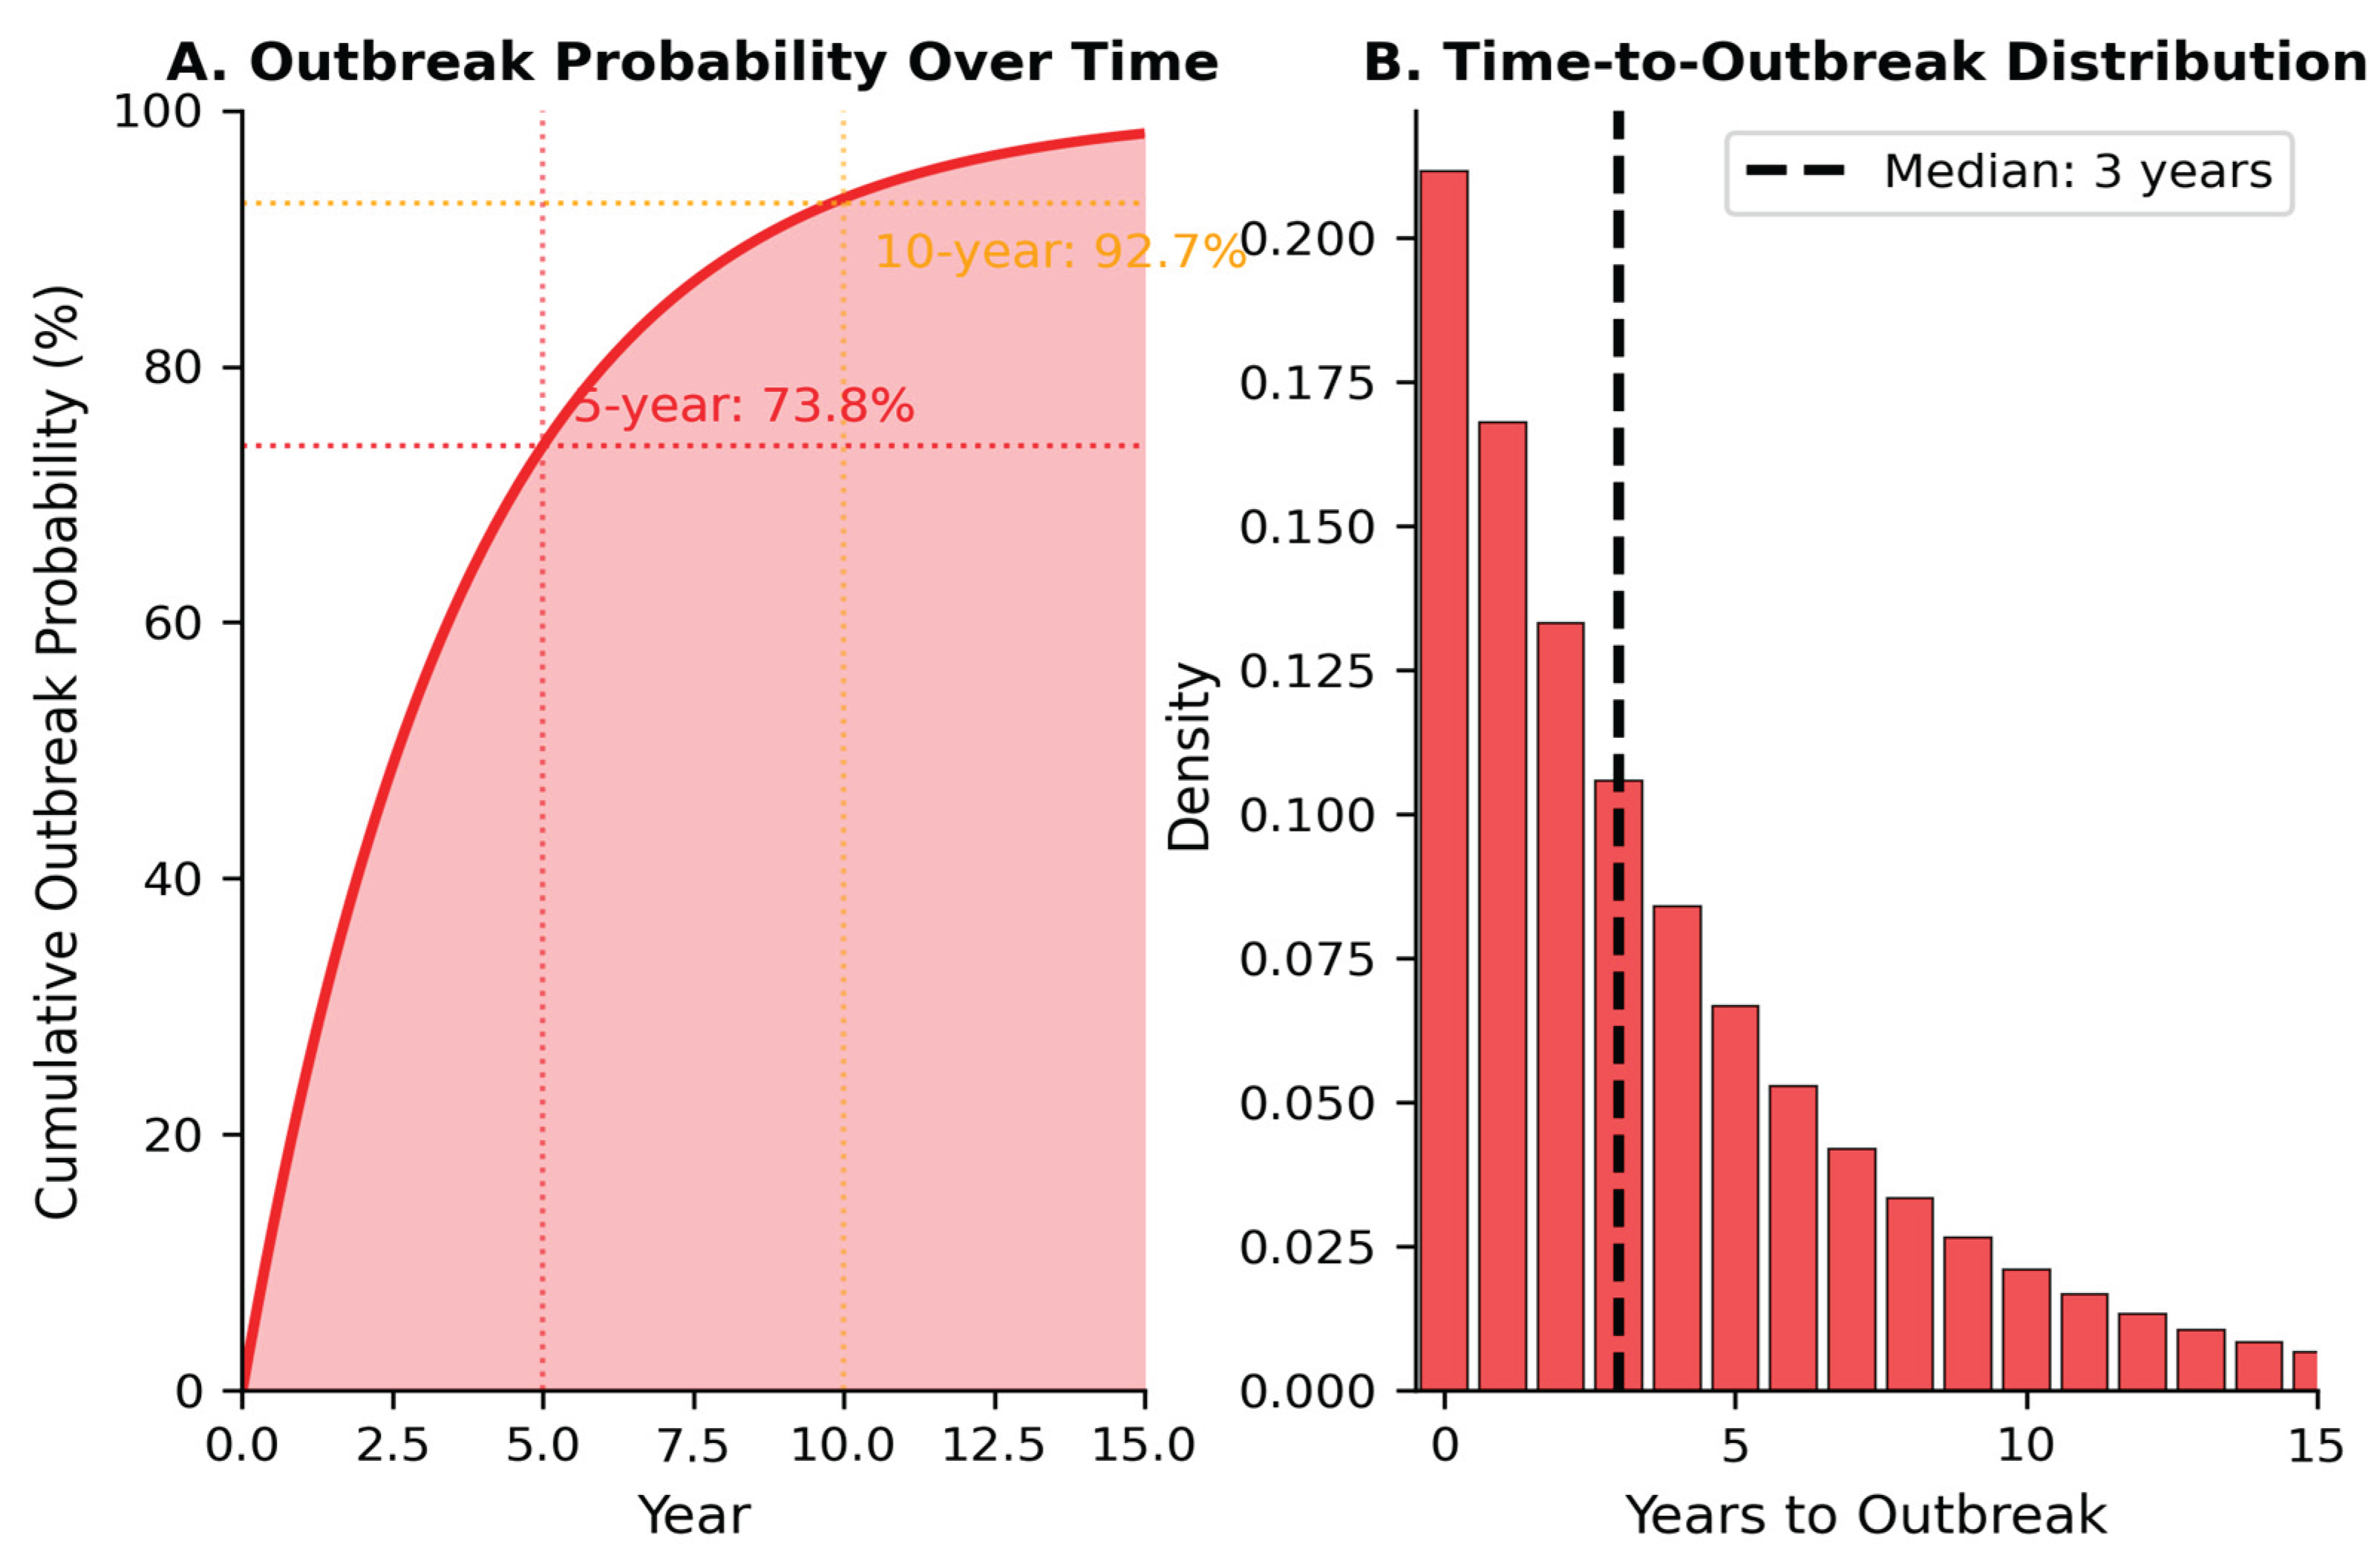
Figure 5.
Signal-to-Noise Ratio and LOOCV Framework. (A) MSM SNR=9,180 vs. PWID SNR=76 (120-fold disparity). (B) Training set (19,800) vs. held-out set (2,413).
Figure 5.
Signal-to-Noise Ratio and LOOCV Framework. (A) MSM SNR=9,180 vs. PWID SNR=76 (120-fold disparity). (B) Training set (19,800) vs. held-out set (2,413).
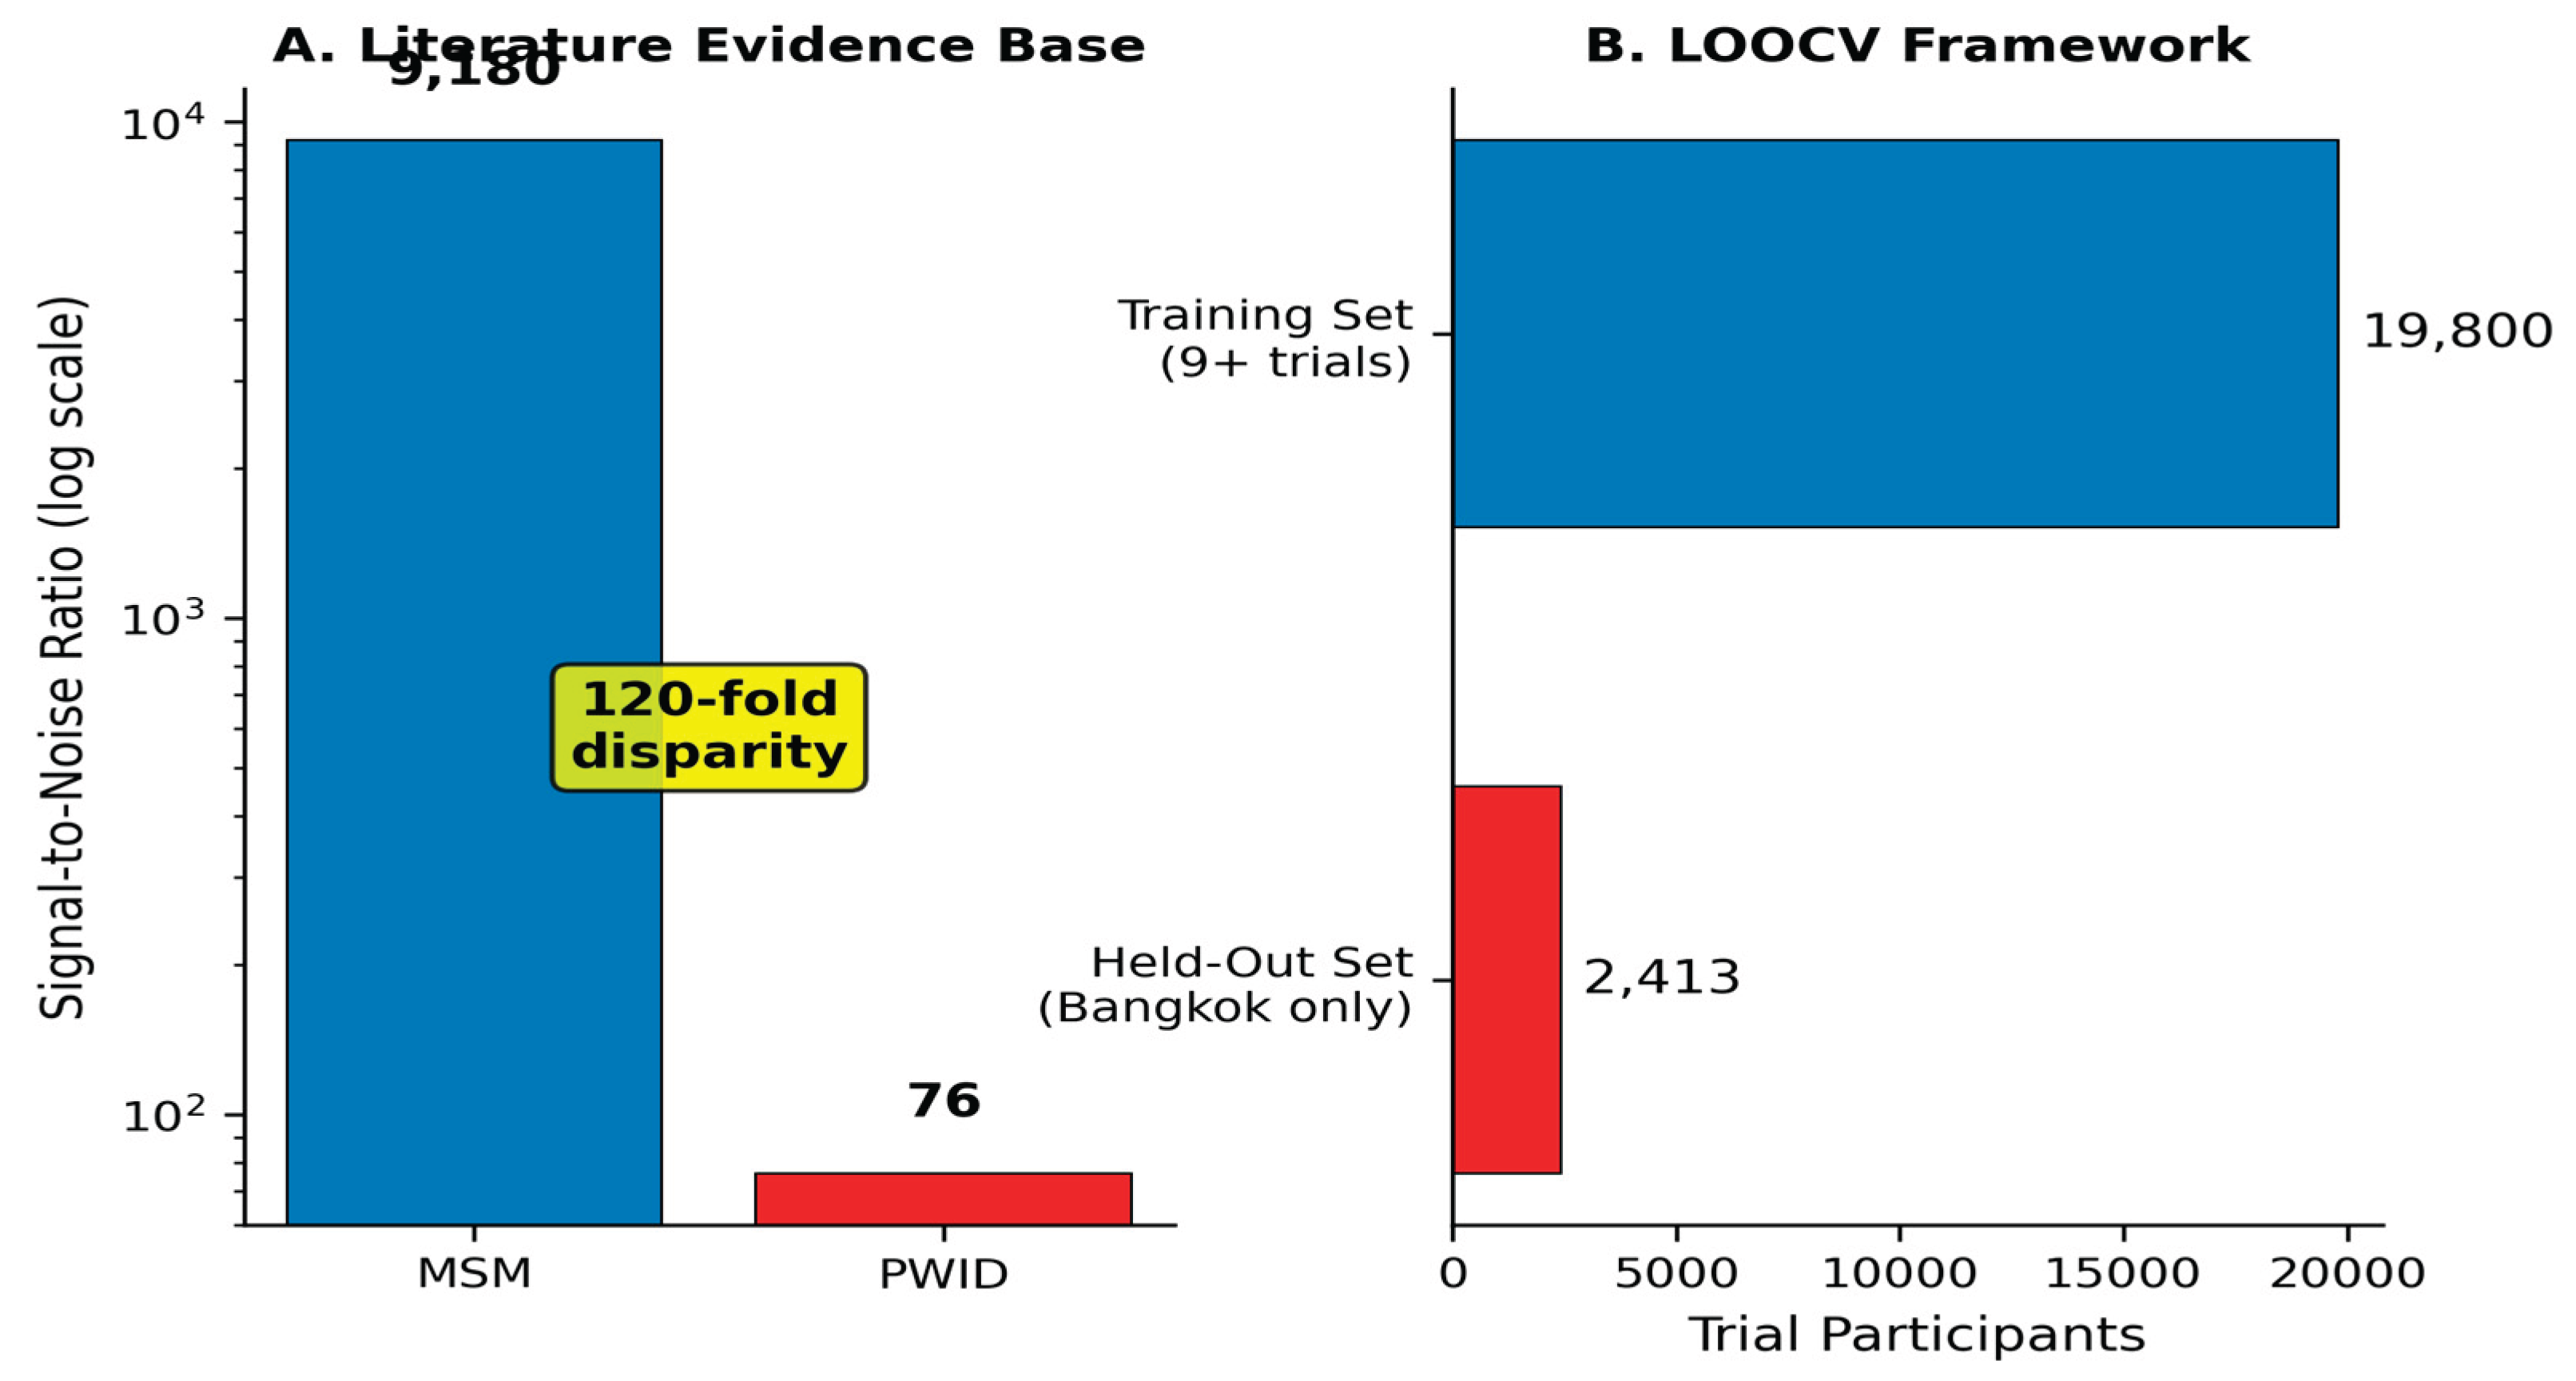

Table 1.
Cascade Step Probabilities by Population. PWID probabilities from literature [3,10,15]; MSM probabilities from PrEP implementation studies [6].
| Cascade Step | PWID (%) | MSM (%) |
|---|---|---|
| 1. Awareness | 10 | 90 |
| 2. Willingness | 30 | 85 |
| 3. Healthcare Access | 35 | 80 |
| 4. Disclosure | 25 | 75 |
| 5. Provider Willing | 35 | 90 |
| 6. HIV Testing | 45 | 85 |
| 7. First Injection | 45 | 80 |
| 8. Sustained Engagement | 25 | 75 |
| Cascade Completion | 0.005 | 21.1 |
| P(R₀=0) | 0.003 | 16.3 |
Table 2.
Policy Scenario Results. Monte Carlo simulation (n=100,000 per scenario) showing P(R0=0).
| Scenario | P(R₀=0) % | 95% CI |
|---|---|---|
| Current Policy | 0.003 | (0.000, 0.006) |
| Decriminalization Only | 0.20 | (0.17, 0.23) |
| Decrim + Stigma Reduction | 0.45 | (0.41, 0.50) |
| SSP-Integrated Delivery | 5.00 | (4.87, 5.14) |
| Full Harm Reduction | 9.55 | (9.37, 9.73) |
| Full HR + PURPOSE-4 | 11.87 | (11.67, 12.07) |
| Full HR + ML Debiasing | 18.57 | (18.33, 18.81) |
| Theoretical Maximum | 19.74 | (19.49, 19.98) |
| MSM (Comparison) | 16.30 | — |
Disclaimer/Publisher’s Note: The statements, opinions and data contained in all publications are solely those of the individual author(s) and contributor(s) and not of MDPI and/or the editor(s). MDPI and/or the editor(s) disclaim responsibility for any injury to people or property resulting from any ideas, methods, instructions or products referred to in the content. |
© 2026 by the authors. Licensee MDPI, Basel, Switzerland. This article is an open access article distributed under the terms and conditions of the Creative Commons Attribution (CC BY) license (http://creativecommons.org/licenses/by/4.0/).
Copyright: This open access article is published under a Creative Commons CC BY 4.0 license, which permit the free download, distribution, and reuse, provided that the author and preprint are cited in any reuse.


