
Submitted:
12 January 2026
Posted:
13 January 2026
You are already at the latest version
Abstract
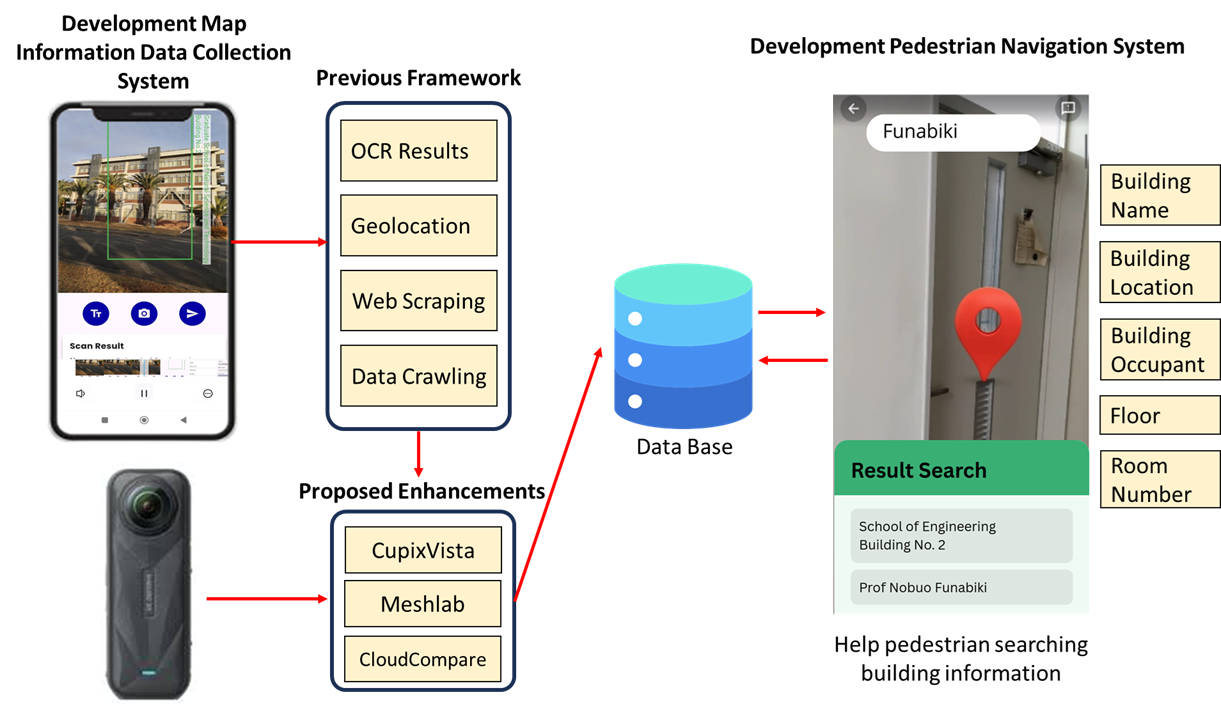
Nowadays, pedestrian navigation systems using smartphones have become common in daily activities. For their ubiquitous, accurate, and reliable services, the map information collection is essential for constructing a comprehensive spatial database. Previously, we have developed a map information collection tool to extract building information using Google Maps, optical character recognition (OCR), geolocation, and web scraping with smartphones. However, indoor navigation often suffers from inaccurate localization coming from degraded GPS signals inside buildings and Simultaneous Localization and Mapping (SLAM) estimation errors, causing position errors and confusing augmented reality (AR) guidance. In this paper, we present an improved map information collection tool to address this problem. It captures 360° panoramic images to build 3D models, apply photogrammetry-based mesh reconstruction to correct geometry, and georeference point clouds to refine latitude-longitude coordinates. For evaluations of the proposal, we conducted experiments with indoor scenarios and assessed the performance based on positional accuracy with Haversine distance, geometric accuracy (RMSE), AR drift, task completion rates, completion time, and the System Usability Scale (SUS). The results demonstrate significant enhancements of reliability and user satisfaction compared with the previous one.
Keywords:
map information collection
; indoor navigation
; 360° panoramic image
; photogrammetry
; georeference
; SLAM
; augmented reality
1. Introduction
Nowadays, pedestrian navigation systems using smartphones have evolved into an integral component of daily life, offering convenient and rapid access to location and routing information. The demand for these services continues to grow, particularly within urban areas where environments are characterized by complex spatial layouts [1,2]. A comprehensive and well-maintained map database is essential for providing seamless, accurate, and reliable navigation services. Consequently, the effective collection of geospatial information plays a critical role in developments of the high-quality spatial datasets required for this purpose [3,4]. In turn, this foundational data directly enables navigation systems to provide more precise route guidance and enhanced localization performance to users [5,6].
To meet the specialized demands of indoor environments, we have previously developed a four-step map information collection pipeline for pedestrian navigation systems. This process begins with the manual capture of building and room images, followed by the extraction of textual information using Google ML Kit Optical Character Recognition (OCR). Subsequently, web scraping with Scrapy and crawling via Apache Nutch are employed to enrich room-level and occupant-level metadata. Finally, all collected information is stored in a centralized database for the system integration [7].
This approach contrasts with our established outdoor navigation methods, which commonly utilize Visual Simultaneous Localization and Mapping (VSLAM) combined with Google Street View to provide augmented reality (AR) based guidance [8,9,10], Conversely, our dedicated indoor systems leverage smartphone-based SLAM and object recognition to improve positioning accuracy [11,12]. While both paradigms rely on visual data, they are fundamentally designed for operations in distinct environments.
Indoor navigation systems continue to face persistent technical challenges. A primary issue is the degradation of Global Positioning System (GPS) signals within buildings, which forces a reliance on alternative methods like SLAM. This reliance, in turn, introduces the problem of accumulated SLAM drift over time. Consequently, these factors lead to poor landmark-level localization and cause errors in AR guidance, especially when the geometric representation of the navigation model does not precisely match the physical environment. Such inaccuracies can result in receiving incorrect directions by users, which ultimately undermines trust in AR-based navigation systems [13,14,15].
In this paper, to address these limitations, we present an improved map information collection tool by introducing a focused and automated pipeline designed to enhance indoor map fidelity and AR guidance. It reconstructs building geometry in three dimensions and refines geographic coordinates. The primary contributions of this work are as follows: (1) an automated data collection workflow utilizing an Insta360 X5 camera to acquire high-resolution 360° panoramic images; (2) an initial 3D reconstruction process implemented with CupixVista an AI-powered platform that leverages cloud-based photogrammetry to generate spatial digital twins; (3) photogrammetry-based mesh reconstruction and refinement using MeshLab an open-source system for processing and editing unstructured 3D triangular meshes to correct geometric distortions and remove artifacts; (4) point cloud georeferencing and registration via CloudCompare a specialized 3D point cloud processing software designed for high-precision model alignment and coordinate transformation to align the reconstructed models with real-world coordinates; and (5) integration of the corrected and georeferenced 3D models into an obstacle-aware routing and AR overlay pipeline. This final stage employs ARCore for rendering and spatial anchor management, thereby establishing a robust framework for accurate pedestrian guidance.
To evaluate the proposed pipeline, we conducted experiments across multiple indoor scenarios within Engineering Building No. 2 at Okayama University, Japan. The assessment employed a dual-focus methodology, spatial precision was quantitatively measured using the Haversine distance for geolocation accuracy, the geometric Root Mean Square Error (RMSE) of the reconstructed 3D models, and AR drift metrics [16,17]. Concurrently, user-centered performance was evaluated based on task completion rates, completion times, and the System Usability Scale (SUS) [18]. The collective experimental results demonstrate a marked improvement in navigation accuracy and a significant increase in user satisfaction when compared to the performance of the previous map information collection tool.
This paper is structured as follows. Section 2 provides a review of related work in indoor navigation and 3D reconstruction. Section 3 details the design of the proposed pipeline. Section 4 elaborates on its implementation. Section 5 presents experimental results for evaluations. Section 6 concludes the paper and discusses potential directions for future research.
2. Related Works
In this section, we introduce relevant works in literature.
2.1. Map Information Collection and Indoor Mapping
In [19], Wang et al. presented a 3D semantic mapping system that integrates ORB-SLAM2 with multi-object tracking for operation in dynamic indoor environments. Although such conventional SLAM-based methods perform effectively in dynamic settings, they remain fundamentally limited by a narrow field of view. Conversely, the adoption of 360° panoramic imagery in our study enables complete scene coverage, which mitigates tracking loss in areas with limited texture or visually repetitive patterns indoors.
In [20], Tsiamitros et al. addressed dynamic crowd analytics by utilizing Wi-Fi signals to infer indoor occupancy levels. While effective for population-level monitoring, their method relies on Received Signal Strength Indicators (RSSI), which does not provide visual context or detailed geometric data. As a result, the sensing is inadequate for generating the high-resolution 3D spatial databases necessary for accurate and detailed indoor navigation.
In [21], Wan et al. introduced a map-assisted localization framework that fuses crowd-sensed inertial data with Wi-Fi fingerprinting via deep learning. Nevertheless, its dependence on low-cost inertial sensors and two-dimensional floor plans constrains geometric fidelity. The absence of detailed three-dimensional structure renders the approach unsuitable for applications requiring drift-free Augmented Reality (AR) guidance, which depends on accurate visual reconstruction and metric consistency.
2.2. 360° Panoramic Capture and Photogrammetry
In [22], Kafataris et al. demonstrated that consumer-grade 360° cameras can achieve geometric accuracy comparable to Terrestrial Laser Scanning (TLS) for offline heritage documentation. While it is significant for static digital preservation, their work does not explore the integration of such high-fidelity data into real-time immersive or navigation-oriented systems. In contrast, our approach utilizes 360° panoramic imagery not only for environmental modeling but also for active geometric correction and the mitigation of Augmented Reality (AR) drift.
In [23], Yang et al. presented the DSSAC-RANSAC algorithm to reduce dynamic object mismatches in visual SLAM, consequently lowering pose estimation errors. Although this enhances tracking robustness, SLAM-based frameworks remain inherently constrained in delivering the global geometric fidelity necessary for stable AR alignment. Conversely, our method employs panoramic image-based photogrammetry to ensure comprehensive scene coverage and to produce metrically accurate 3D models, thereby enabling reliable and persistent AR registration.
In [24], Vacca et al. reported that 360° panoramic photogrammetry offers an efficient and cost-effective alternative to TLS for surveying complex indoor heritage environments. However, their application remains confined to static geometric documentation. By contrast, our study adapts 360° photogrammetry for the collection of indoor mapping information in real-time navigation scenarios, which offers further optimizations for precise georeferencing and the mitigation of Augmented Reality (AR) drift.
2.3. 3D Reconstruction and Mesh Processing
In [25], Liu et al. presented Spatial/Spectral-Frequency Adaptive Network (SSFAN), a method designed to reconstruct hyperspectral 3D information from compressed two-dimensional inputs by leveraging frequency-domain features. This technique prioritizes the spectral fidelity of dynamic objects, with less emphasis on geometric precision. In contrast, our methodology is centered on photogrammetric mesh reconstruction from 360° imagery, which is specifically aimed at recovering dense, metrically accurate surface geometry, a critical requirement for robust indoor mapping and navigation applications.
In [26], Zhu et al. developed a deep learning framework to reconstruct eddy-resolving three-dimensional physical fields from satellite data. Although this approach is effective for modeling dynamic environmental changes, it does not address the extraction of static architectural geometry. Conversely, our system is specifically designed to derive precise spatial coordinates and structural details from panoramic imagery to construct reliable, metric-accurate models for indoor navigation.
In [27], Lv et al. introduced a voxel-based optimization method for generating high-fidelity meshes from noisy point clouds. While this approach attains a high degree of accuracy, its computational complexity limits its use to offline processing workflows. In contrast, our pipeline employs a streamlined combination of mesh decimation, noise filtering, and geometric cleanup to produce lightweight, yet accurate models that are suitable for real-time georeferencing and seamless system integration.
2.4. Point Cloud Registration and Georeferencing
In [28], Tresnawati et al. presented a museum AR navigation system that employs Bluetooth Low Energy (BLE) beacons and ESP32 microcontrollers to trigger location-based content. While it is effective for fixed points of interest, this hardware-dependent approach escalates deployment and maintenance overhead. Conversely, our method implements an infrastructure-free visual localization strategy, relying exclusively on smartphone cameras and thereby obviating the need for any external sensor deployment.
In [29], Bash et al. proposed a hierarchical registration method based on a modified Iterative Closest Point (ICP) algorithm to align terrestrial point clouds without physical Ground Control Points (GCPs). However, their method relies on a pre-existing reference model, an assumption often impractical in dynamic indoor settings. In contrast, our system autonomously reconstructs and georeferences the indoor environment using 360° photogrammetry, thereby eliminating dependence on external reference scans.
In [30], Kong et al. introduced a cost-effective rigid registration method for aligning multi-temporal point clouds without GCPs or Global Navigation Satellite System (GNSS) data. While suitable for relative change detection, this approach lacks the absolute spatial georeferencing required for location-based services. Our pipeline explicitly establishes a global coordinate frame, providing the geospatial accuracy essential for robust AR navigation.
In [31], Barnea et al. presented a deep learning framework to reconstruct room layouts and object placements from a single 360° image. Although it is efficient, such single-view methods heavily depend on learned priors and often lack the metric precision required for navigation. Conversely, our method leverages photogrammetry on panoramic image sequences to explicitly compute depth and geometry, thereby ensuring the high-fidelity accuracy necessary for detailed indoor navigation.
2.5. AR-Based Indoor Navigation and Localization
In [32], Elghayesh et al. proposed a self-contained mobile AR navigation system that relies on on-device localization utilizing heuristic algorithms and ORB visual features. While this architecture improves user privacy and minimizes reliance on network connectivity, its scalability is inherently limited by the processing power and storage constraints of mobile hardware. To overcome this limitation, our framework implements an edge-cloud architecture, offloading computationally demanding processes to enable scalable navigation across extensive, multi-building indoor complexes.
In [33], Kamala et al. developed AR GuideX, an indoor navigation solution that combines ARCore, Mapbox, and Bluetooth beacon technology. Nevertheless, this method necessitates considerable pre-deployment of physical hardware, increasing both cost and susceptibility to environmental signal interference. Our methodology, by contrast, adopts a purely vision-based, infrastructure-free paradigm, performing robust localization solely through visual features captured via standard smartphone cameras.
In [34], Messi et al. conducted an evaluation of six-degree-of-freedom (6-DoF) AR registration accuracy within infrastructure-free settings. Although this research delivers valuable insights into localization precision, it does not extend to a fully operational navigation system. Our contribution advances this field by fusing high-accuracy visual localization with a real-time, interactive pathfinding engine developed in Unity, thereby providing a comprehensive solution for dynamic, turn-by-turn AR navigation guidance.
3. Proposed System Architecture
In this section, we present the overall architecture of the proposed indoor map information collection system and the adopted software tools and technologies.
3.1. System Overview
The proposed system is hierarchically structured into four layers to facilitate robust and accurate indoor visual positioning. As depicted in Figure 1, the workflow commences within the Data Acquisition Layer, where high-resolution environmental data are captured using panoramic imaging devices integrated with inertial sensors to generate a comprehensive raw visual dataset. This data is subsequently processed in the Modeling Layer, which implements a multi-stage photogrammetric pipeline. The initial structure-from-motion (SfM) reconstruction is performed using CupixVista, followed by geometric refinement in MeshLab and precise georeferencing with CloudCompare.
The resulting metrically accurate spatial database serves as the foundational map for the subsequent Navigation Engine. This engine integrates visual feature-based localization with Google ARCore’s inertial odometry to achieve robust, real-time 6-Degree-of-Freedom (6-DoF) pose tracking. Finally, the User Interface Layer, developed using the Unity AR Foundation framework, renders intuitive navigation cues and path overlays directly onto the user’s physical viewport via AR visualization.
3.2. Data Acquisition Layer
The Data Acquisition Layer is responsible for capturing high-fidelity environmental data that constitutes the foundational dataset for constructing the three-dimensional indoor map.
3.2.1. Panoramic Image Capture
Visual data acquisition is performed using an Insta360 X5 omnidirectional camera [35], which features dual 1/1.28-inch CMOS sensors. The device operates in 360° video mode at an 8K resolution (7680 × 3840 pixels) to ensure adequate texture detail for reliable feature extraction during subsequent photogrammetric processing. To mitigate motion-induced artifacts inherent in handheld scanning, the camera’s integrated six-axis gyroscope and electronic image stabilization functionalities are actively employed. This configuration provides stable and geometrically consistent visual input, which is essential for high-quality three-dimensional reconstruction.
3.2.2. Sensor Data Integration
Concurrent with visual acquisition, inertial measurements are recorded by the camera’s integrated Inertial Measurement Unit (IMU). The IMU logs tri-axial linear acceleration and angular velocity data, which are precisely synchronized with the image timestamps. These inertial readings serve a critical function in the initial reconstruction pipeline by correcting for camera orientation drift and establishing a stable global gravity reference, thereby enhancing the geometric fidelity of the 3D model.
3.3. Data Processing and Modeling Layer
The acquired raw sensor and image data are processed through a multi-stage computational pipeline to generate a lightweight yet semantically rich 3D model optimized for mobile navigation and AR visualization.
3.3.1. Processing Workstation
All computational tasks for reconstruction, mesh processing, and georeferencing are performed on a dedicated workstation. The system is powered by an Intel ® Core ™Ultra 7 265KF processor and an NVIDIA GeForce RTX 4070 graphics processing unit (GPU) with 12 GB of dedicated video memory (VRAM). The GPU architecture is leveraged to accelerate computationally intensive stages, specifically dense point cloud generation and mesh optimization. The configuration is supplemented with 32 GB of the system memory to ensure stable performance during large-scale photogrammetric processing and model refinement. The operating environment is Windows 11 Pro (64-bit).
3.3.2. 3D Reconstruction and Point Cloud Generation
Raw panoramic images are processed using CupixVista, a cloud-based photogrammetry platform selected for its optimized support for sequential equirectangular imagery. The platform automatically extracts distinctive visual keypoints and estimates precise camera poses via Structure-from-Motion (SfM) algorithms, subsequently generating a dense, textured point cloud and a corresponding 3D mesh. This process effectively transforms two-dimensional pixel information into a coherent three-dimensional structural representation, which serves as the foundational geometric baseline for subsequent refinement stages [36].
3.3.3. Mesh Refinement and Optimization
The initial mesh generated from the reconstruction stage often contains surface noise, artifacts, and excessive geometric detail. To address these issues, the geometric refinement is performed using meshLab, an open-source mesh processing framework. The refinement pipeline includes the application of noise reduction filters to suppress outliers and artifacts, followed by topology repair operations to fill holes and correct non-manifold geometry. Subsequently, the mesh decimation is applied to reduce polygon complexity, thereby ensuring the model is lightweight enough for efficient real-time rendering on mobile devices while retaining critical geometric fidelity [37].
3.3.4. Georeferencing and Classification
The optimized mesh is imported into CloudCompare for final spatial alignment and semantic enrichment. During this stage, the model’s local coordinate system is transformed into a real-world global reference frame through a georeferencing procedure. Concurrently, the semantic classification is applied to differentiate navigable surfaces, such as floors, from architectural obstacles, including walls and fixed furnishings. The output is a structured, georeferenced, and semantically tagged spatial database, which serves as the core digital map for subsequent navigation and augmented reality applications [38].
3.4. Visual Localization and Navigation Engine
The Navigation Engine functions as the core computational module responsible for estimating the user’s precise six-degree-of-freedom (6-DoF) position and orientation within the reconstructed indoor environment.
3.4.1. Visual Pose Estimation
The Visual Localization (VL) module calculates the user’s global pose by matching feature descriptors extracted from the live smartphone camera stream against the pre-constructed 3D map database. This approach inherently solves the kidnapped robot problem, allowing the system to localize the user from arbitrary initial positions within the mapped environment without dependency on external positioning infrastructure, such as GPS or Bluetooth beacons.
3.4.2. Sensor Fusion with ARCore
Following initial localization, continuous 6-degree-of-freedom (6-DoF) pose tracking is maintained through Google ARCore’s Visual-Inertial Odometry (VIO) framework. ARCore fuses visual feature tracking from the camera with high-frequency inertial measurements from the device’s IMU to estimate the device’s position and orientation in real time. This sensor fusion strategy ensures robust, smooth, and low-latency tracking, which remains stable during periods of rapid device movement or temporary visual occlusion.
3.5. AR Visualization and User Interface
The user interface is developed using the Unity AR Foundation framework, which provides the core infrastructure for AR visualization. This layer receives both the calculated path from the routing module and real-time pose estimates from the Navigation Engine. It subsequently renders three-dimensional navigational elements, including directional arrows, path indicators, and virtual waypoints, directly onto the live smartphone camera view. This integration ensures that the virtual guidance cues remain persistently registered to the physical environment, offering the user intuitive, and real-time navigation assistance [39].
4. Implementation
In this section, we present the deployment and validation of the proposed system within Engineering Building No. 2 at Okayama University, Japan. This building is a four-story academic facility, selected as a real-world testbed to evaluate the enhanced indoor navigation performance of our methodology.
4.1. Data Acquisition
To ensure high spatial accuracy and data consistency, environmental data were captured using an Insta360 X5 omnidirectional camera integrated with an Inertial Measurement Unit (IMU). For the hardware setup, a head-mounted configuration was employed: the camera was vertically affixed to a safety helmet worn by the operator, as depicted in Figure 2.
This head-mounted configuration was selected to mitigate visual noise and motion blur, which are prevalent in handheld acquisition. The elevated and stabilized camera position significantly reduces occlusions caused by the operator’s body and ensures consistent geometric viewpoints across sequential frames. Furthermore, this setup facilitates natural, continuous movement along the intended mapping path, enabling hands-free operation and improving data acquisition efficiency.
The acquisition process generated a dataset of equirectangular panoramic images, automatically captured at regular spatial intervals along the designated navigation routes. Representative samples of the collected imagery from Floor 1 through Floor 4 are presented in Figure 3.
The captured imagery has a resolution of 5.7K, which delivers superior sharpness and dynamic range. This high level of visual fidelity is crucial for robust feature detection and matching, facilitating the reliable identification of distinctive environmental keypoints, such as notice board corners, floor textures, and door frames, even under varying indoor lighting conditions.
4.2. Data Processing and Modelling
4.2.1. 3D Reconstruction and Point Cloud Generation
Following data acquisition, the equirectangular panoramic image dataset captured by the Insta360 X5 was processed using the cloud-based CupixVista photogrammetry platform. This platform was selected as its integrated AI-powered processing engine, which automatically performs image alignment and executes Structure-from-Motion (SfM) algorithms to reconstruct three-dimensional geometry from the two-dimensional image sequences.
The reconstruction process generates a dense 3D point cloud and a corresponding textured mesh model, effectively creating a geometrically accurate digital twin of the physical environment. A key advantage of the CupixVista pipeline is its robustness to illumination variations and its capability to mitigate geometric distortions in architecturally complex transitional spaces, such as staircases and corridor intersections.
As illustrated in Figure 4, the reconstruction results validate the system’s capability to accurately model the building’s complex topology. On Floor 1 (Figure 4(a)), the base area, lobby, and connecting staircases are reconstructed with high point density, preserving fine architectural details. The model of Floor 2 (Figure 4(b)) captures a long corridor with multiple branching rooms, demonstrating seamless spatial connectivity and minimal positional drift. Similarly, Floor 3 (Figure 4(c)) exhibits consistent reconstruction quality, with sharply defined wall boundaries and door structures that facilitate subsequent spatial segmentation. Finally, the reconstruction of Floor 4 (Figure 4(d)) confirms the stability of the processing pipeline, maintaining geometric consistency even at the uppermost level of the building.
4.2.2. Mesh Refinement, Cleaning, and Decimation Using MeshLab
Following individual floor-level reconstructions, a spatial integration process merges the partial models into a single, unified representation of the building. This involves vertically aligning the structures from Floor 1 to Floor 4 within a common global coordinate framework. The resultant merged geometry, which often contains excessive vertex density and photogrammetric noise artifacts, is subsequently processed in MeshLab to enhance its quality and usability.
A systematic mesh refinement pipeline is applied. Initially, the statistical outlier filtering is employed to remove erroneous points and floating artifacts that do not correspond to real-world surfaces. This is followed by the application of the Laplacian smoothing to reduce surface noise while preserving the overall geometric volume and major structural boundaries. Finally, the polygon count is substantially reduced using the Quadric Edge Collapse Decimation algorithm. This decimation step is critical for generating a lightweight mesh that remains compatible with the computational limits of mobile devices while retaining essential architectural features, such as sharp wall edges and door frames.
Figure 5 presents the final integrated and optimized 3D model of the four-story building. The model exhibits clean geometry and calibrated coordinate axes (X, Y, Z), confirming its suitability for subsequent georeferencing and AR application without imposing prohibitive rendering overhead.
4.2.3. Classification and Georeferencing Using CloudCompare
Following geometric optimization, the refined model is imported into CloudCompare for georeferencing. This process transforms the model from its local, relative coordinate system into a global geospatial reference frame. Since the initial reconstruction lacks proper cardinal orientation, a rigid transformation is applied using the point pairs picking method. This involves selecting corresponding anchor points, such as distinct structural corners in the model, and matching them to surveyed Ground Control Points (GCPs) with known latitude and longitude values.
To maintain metric consistency in the Cartesian processing environment, the geographic coordinates of the GCPs are converted into the Universal Transverse Mercator (UTM) coordinate system. Accurate georeferencing is critical in the AR navigation system, as it ensures the precise horizontal and vertical alignment required for the stable registration of virtual elements, such as directional cues and landmarks, thereby preventing visual drift and unrealistic floating artifacts during AR visualization. Furthermore, surface normal vectors (Nx, Ny, Nz) are validated to confirm correct wall and floor orientations, which is essential for accurate occlusion handling in AR rendering.
As depicted in Figure 6, the selected control points serve as reference correspondences for calculating the requisite rotation and translation matrices. These transformations are applied to the entire point cloud, resulting in a model that is simultaneously geometrically accurate and geographically aligned, thereby making it suitable for direct integration into the navigation engine.
4.3. AR User Interface Validation
The AR user interface evaluated in this study was developed by adapting a framework previously introduced by the authors in [7]. The core navigation logic and visual layout are based on the methodology detailed in Figure 14 of the referenced work [7]. For clarity, a schematic of the foundational AR interface employed in the present validation is reproduced in Figure 7.
A field validation was conducted to evaluate system robustness across varying elevations and spatial layouts, using four distinct target locations, one on each floor of the building. Figure 8 presents a comparative visualization of AR navigation performance before and after the application of the proposed method. The quantitative outcomes for each floor are summarized as follows:
- Floor 1: As illustrated in Figure 8(a), the uncorrected system produced a misaligned navigation path that erroneously directed users toward a corridor wall, with the destination landmark incorrectly positioned within an adjacent kitchen area. Following correction, the path was accurately aligned with the physical corridor, and the landmark was correctly placed directly in front of the intended office entrance.
- Floor 2:As in Figure 8(b), the initial coordinate drift caused the destination marker to appear as a floating artifact near the Student Laboratory. Post-correction, the navigation arrow correctly aligned with the corridor axis, and the marker was accurately repositioned at the laboratory entrance.
- Floor 3: An adjacency ambiguity was identified on Floor 3 as in Figure 8(c), where the system incorrectly associated the destination with a neighboring office door. The corrected implementation successfully resolved this spatial ambiguity, placing the landmark precisely at the targeted professor’s office.
- Floor 4: As in Figure 8(d), the uncorrected AR interface rendered a navigation arrow facing a solid wall, accompanied by a floating destination marker. After applying the correction parameters, the AR guidance conformed accurately to the corridor geometry and terminated at the correct room entrance.
Overall, the validation results confirm that the proposed correction pipeline effectively mitigates a broad spectrum of spatial registration errors, including orientation mismatches and destination point offsets, across all tested building floors.
5. Performance Evaluation
In this section, to comprehensively assess the effectiveness of the proposal, we adopt a multi-faceted evaluation strategy, and conduct a quantitative analysis of geometric accuracy and statistical error distribution, complemented by a qualitative assessment of system usability from an end-user perspective.
5.1. Geometric Accuracy and Drift Analysis
This subsection evaluates the system’s capability to correct positional drift originating from initial sensor readings. The deviation distance (d) between an initial estimated position and its corresponding corrected position is quantified using the Haversine formula.
The calculation, based on the standard Haversine computational logic, proceeds in three steps. First, the differences in latitude and longitude are converted to radians. Second, the square of half the chord length (a) and the angular distance (c) between the two points are computed as defined in Equation 1:
Finally, the geodesic distance d (in meters) ) is obtained by multiplying the angular distance by the Earth’s radius, as expressed in 1:
The experimental results in Table 2 validate the efficacy of the proposed map information collection tool. The system successfully identified and corrected positional discrepancies at all 12 sample points, with drifts ranging from 2.53 meters to 3.66 meters.
The average corrected drift across all points is approximately 3.15 meters. This result has practical significance for indoor navigation. The physical distance between adjacent room entrances typically exceeds 3.5 meters. While a maximum drift of 3.66 meters was observed in one case, the overall average of 3.15 meters indicates that the system reliably corrects the user’s position to within immediate proximity of the target. This level of accuracy is sufficient to position the user within the visual line-of-sight of the correct entrance, thereby resolving the spatial ambiguity inherent in uncorrected GNSS-based positioning, which can exhibit errors exceeding 5–10 meters indoors.
5.2. Statistical Error Validation (RMSE)
While the arithmetic mean of positional drift provides a general indicator of accuracy, the Root Mean Square Error (RMSE) offers a more robust statistical measure by heavily penalizing larger deviations. This metric is essential for evaluating the overall stability and reliability of the system’s positioning performance across diverse locations. The RMSE is calculated using Equation 2:
where n n represents the total number of sample points () and denotes the deviation distance (drift) at the i-th point.
Based on the empirical data in Table 2, the Root Mean Square Error (RMSE) for the proposed cartographic data collection instrument is calculated as follows:
The calculated Root Mean Square Error (RMSE) of 3.17 meters demonstrates the close correspondence with the arithmetic mean positional drift of (3.15 meters). This alignment indicates a low variance in the error distribution, which is characteristic of a stable system. The absence of a significant disparity between these two metrics suggests that the error structure is not dominated by extreme outliers, thereby supporting the conclusion of consistent system performance and a mitigated risk of severe navigational disruption.
5.3. User Experience and Usability Assessment
This subsection presents an evaluation of the proposed navigation system’s usability, employing a dual-method approach consisting of a pre/post-test design and the standardized System Usability Scale (SUS).
5.3.1. Pre-Test and Post-Test Methodology
A pre-test screening question ("Have you ever used this navigation system before?") was administered to participants prior to the experimental task to control the potential confounding effects of prior familiarity. This served to segment the sample for subsequent analysis. Following their practical engagement with the system to complete an indoor wayfinding task, a comprehensive usability assessment was conducted using a post-test questionnaire based on the validated System Usability Scale (SUS) [40]. As detailed in Table 3, the questionnaire was designed to evaluate five critical usability dimensions, including: (1) interface learnability, (2) operational efficiency, (3) system error management, (4) perceived usefulness, and (5) overall user satisfaction with the 360° image-based navigation paradigm.
5.3.2. Pre-Test Result
A sample of 10 participants from the Okayama University was recruited for the usability evaluation. The pre-test screening results for the question: “Have you ever used this system before?”, which are summarized in Table 4, indicate that 100% of participants (n = 10) reported no prior usage of the navigation system. This established a homogeneous baseline of zero prior experience across the entire test group, thereby ensuring that subsequent usability assessments of initial learnability and interface characteristics were not confounded by pre-existing familiarity.
5.3.3. System Usability Scale Result
The system’s overall usability was quantitatively evaluated using the standardized System Usability Scale (SUS). Following the completion of practical indoor wayfinding tasks using the proposed application, all 10 participants responded to a 10-item SUS questionnaire. This instrument employs a 5-point Likert scale for each statement (1 = "strongly disagree" to 5 = "strongly agree") [18]. The standard SUS statements were contextually adapted to specifically assess the user experience of the navigation system. The calculation of an individual’s overall SUS score adheres to the established protocol [41], as follows:
- 1.
- For each odd-numbered item (), compute:
- 2.
- For each even-numbered item (), compute:where is the respondent’s score for item i.
- 3.
- Sum all adjusted scores:
- 4.
- Multiply the total score by 2.5 to obtain the final SUS score for that respondent:
- 5.
- Finally, calculate the average SUS score across n participants:
The data in Table 5 presents the individual usability scores obtained from the experiment. The results indicate that the proposed tool is effective in the collection of cartographic data and provides a functional user interface, thereby supporting its practical application for pedestrian navigation systems.
The analysis of the SUS responses (n=10) generated an exceptionally high mean usability score of 96.5, with individual scores ranging from 92.5 to 100. According to established normative benchmarks, this aggregate score categorizes the navigation system’s usability within the "Excellent" to "Best Imaginable" range. The narrow distribution and the absence of low scores indicate a consistently positive user experience across all participants. This finding substantiates the effectiveness of the system in delivering an intuitive and satisfactory navigation interface. Consequently, the results provide strong empirical support for technical readiness and user-acceptance of the proposed system for real-world deployment in complex pedestrian environments, such as university campuses.
5.4. Discussion
This subsection synthesizes the performance evaluation of the proposed cartographic data collection tool and its integrated indoor navigation system, focusing on geometric precision and qualitative user experience. The results of the positional drift analysis confirm the system’s efficacy in mitigating sensor-based localization errors. The average correction of 3.15m, corroborated by a closely aligned Root Mean Square Error (RMSE) of 3.17m, indicates stable and uniform error compensation. This achieved level of the positional accuracy is operationally significant, especially when compared to the typical 5-10 m errors associated with conventional GNSS-based positioning in indoor environments. Critically, within the experimental setting, where the physical distance between adjacent room entrances consistently exceeds 3.5m, the system’s sub-3.5 m accuracy ensures that users are reliably positioned within the direct visual corridor of their target destination. This effectively bridges the gap between raw positional data and functional navigational guidance.
This operational stability is directly reflected in the positive user perception captured by the System Usability Scale (SUS) evaluation, which yielded a mean score of 96.5. Benchmarking against established norms classifies this result within the "Excellent" to "Best Imaginable" usability range, validating that the 360° image-based navigation interface provides a highly intuitive experience, even for novice users. Collectively, the demonstrated synergy between robust positional accuracy and exceptional usability underscores the technical maturity and practical viability of the proposed system. These complementary findings strongly support its readiness for deployment in complex, real-world indoor environments such as university campuses.
6. Conclusions
In conclusion, this study successfully validated the efficacy of the proposed 360° panoramic image-based cartographic data collection tool as a robust solution for indoor navigation. The tool integrates photogrammetric 3D reconstruction with a dedicated post-processing pipeline to address the inherent limitations of GNSS signal degradation in enclosed spaces. Key findings demonstrate its capability to achieve an average positional correction of 3.15m, with a closely aligned Root Mean Square Error (RMSE) of 3.17m, confirming strong geometric stability and uniform error distribution.
The metric accuracy translates directly to reliable room-level localization, which in turn underpins an outstanding user experience, quantified by a mean System Usability Scale (SUS) score of 96.5. Collectively, these results substantiate that the proposed methodology effectively bridges the gap between high-fidelity digital twin modeling and operational geospatial requirements, establishing its technical feasibility for deployment in complex indoor environments such as university campuses.
Future work will concentrate on enhancing the system’s scalability by automating critical components of the mesh cleaning and optimization workflow, thereby facilitating efficient large-scale implementation across diverse infrastructural settings
Author Contributions
Conceptualization, K.S.B. and N.F.; methodology, K.S.B. and N.F.; software, K.S.B., A.A.S.P and I.N.D.K.; visualization, K.S.B., I.N.D.K., K.C.B and A.A.S.P; investigation, K.S.B. and A.A.S.P; writing—original draft, K.S.B.; writing review and editing, N.F.; supervision, N.F. All authors have read and agreed to the published version of this manuscript.
Funding
This research received no external funding.
Institutional Review Board Statement
Not applicable.
Data Availability Statement
All data are contained within article.
Acknowledgments
The authors thank the reviewers for their thorough reading and helpful comments and all their colleagues at the Distributed System Laboratory, Okayama University, who were involved in this study.
Conflicts of Interest
The authors declare no conflicts of interest.
References
- Ma, S.; Wang, P.; Lee, H. An Enhanced Hidden Markov Model for Map-Matching in Pedestrian Navigation. Electronics 2024, 13. [Google Scholar] [CrossRef]
- Wang, Q.; Luo, H.; Wang, J.; Sun, L.; Ma, Z.; Zhang, C.; Fu, M.; Zhao, F. Recent Advances in Pedestrian Navigation Activity Recognition: A Review. IEEE Sensors Journal 2022, 22, 7499–7518. [Google Scholar] [CrossRef]
- Asrat, K.T.; Cho, H.J. A Comprehensive Survey on High-Definition Map Generation and Maintenance. ISPRS International Journal of Geo-Information 2024, 13. [Google Scholar] [CrossRef]
- Al-Bakri, M. Enhancing spatial accuracy of OpenStreetMap data: A geometric approach. Mathematical Modelling of Engineering Problems 2023, 10, 2171–2178. [Google Scholar] [CrossRef]
- Kango, V.; Eraqi, H.M.; Moustafa, M. High Precision Map Conflation of Fleet Sourced Traffic Signs. Proceedings of the IGARSS 2024 - 2024 IEEE International Geoscience and Remote Sensing Symposium 2024, 4648–4648. [Google Scholar] [CrossRef]
- Chaure, A.S.; Santosh Malloli, R.; Malave, M.S.; Basagonda Vhananavar, S.; Borse, S. Enhancing Navigation Systems: A Comprehensive Survey with Proposed Innovations for Improved User Experience. Proceedings of the 2024 8th International Conference on Computing, Communication, Control and Automation (ICCUBEA) 2024, 1–4. [Google Scholar] [CrossRef]
- Batubulan, K.S.; Funabiki, N.; Brata, K.C.; Kotama, I.N.D.; Kyaw, H.H.S.; Hidayati, S.C. A Map Information Collection Tool for a Pedestrian Navigation System Using Smartphone. Information 2025, 16. [Google Scholar] [CrossRef]
- Brata, K.C.; Funabiki, N.; Panduman, Y.Y.F.; Fajrianti, E.D. An Enhancement of Outdoor Location-Based Augmented Reality Anchor Precision through VSLAM and Google Street View. Sensors 2024, 24. [Google Scholar] [CrossRef]
- Brata, K.C.; Funabiki, N.; Riyantoko, P.A.; Panduman, Y.Y.F.; Mentari, M. Performance Investigations of VSLAM and Google Street View Integration in Outdoor Location-Based Augmented Reality under Various Lighting Conditions. Electronics 2024, 13. [Google Scholar] [CrossRef]
- Brata, K.C.; Funabiki, N.; Panduman, Y.Y.F.; Mentari, M.; Syaifudin, Y.W.; Rahmadani, A.A. A Proposal of In Situ Authoring Tool with Visual-Inertial Sensor Fusion for Outdoor Location-Based Augmented Reality. Electronics 2025, 14. [Google Scholar] [CrossRef]
- Fajrianti, E.D.; Funabiki, N.; Sukaridhoto, S.; Panduman, Y.Y.F.; Dezheng, K.; Shihao, F.; Surya Pradhana, A.A. INSUS: Indoor Navigation System Using Unity and Smartphone for User Ambulation Assistance. Information 2023, 14. [Google Scholar] [CrossRef]
- Fajrianti, E.D.; Panduman, Y.Y.F.; Funabiki, N.; Haz, A.L.; Brata, K.C.; Sukaridhoto, S. A User Location Reset Method through Object Recognition in Indoor Navigation System Using Unity and a Smartphone (INSUS). Network 2024, 4, 295–312. [Google Scholar] [CrossRef]
- Lu, M.; Arikawa, M.; Oba, K.; Ishikawa, K.; Jin, Y.; Utsumi, T.; Sato, R. Indoor AR Navigation Framework Based on Geofencing and Image-Tracking with Accumulated Error Correction. Applied Sciences 2024, 14. [Google Scholar] [CrossRef]
- Nwankwo, L.; Rueckert, E. Understanding Why SLAM Algorithms Fail in Modern Indoor Environments. In Proceedings of the Advances in Service and Industrial Robotics; Petrič, T., Ude, A., Žlajpah, L., Eds.; Cham, 2023; pp. 186–194. [Google Scholar] [CrossRef]
- Lahemer, E.S.; Rad, A. HoloSLAM: a novel approach to virtual landmark-based SLAM for indoor environments. Complex & Intelligent Systems 2024, 10, 4175–4200. [Google Scholar] [CrossRef]
- Schoovaerts, M.; Li, R.; Niu, K.; Poorten, E.V. Quantitative Assessment of Calibration Motion Profiles in Robotic-assisted Ultrasound System. In Proceedings of the 2022 International Symposium on Medical Robotics (ISMR), 2022; pp. 1–7. [Google Scholar] [CrossRef]
- Jalal, A.J.; Mohd Ariff, F.; Razali, F.; Wong, R.; Wook, A.; Idris, I. Assessing Precision and Dependability of Reconstructed Three-Dimensional Modeling for Vehicles at Crash Scenes using Unmanned Aircraft System. Journal of Advanced Geospatial Science & Technology 2023, 3, 129–144. [Google Scholar] [CrossRef]
- Kotama, I.N.D.; Funabiki, N.; Panduman, Y.Y.F.; Brata, K.C.; Pradhana, A.A.S.; Noprianto; Desnanjaya, I.G.M.N. Implementation of Sensor Input Setup Assistance Service Using Generative AI for SEMAR IoT Application Server Platform. Information 2025, 16. [Google Scholar] [CrossRef]
- Wang, W.; Wu, R.; Dong, Y.; Jiang, H. Research on Indoor 3D Semantic Mapping Based on ORB-SLAM2 and Multi-Object Tracking Licensed under CC BY 4.0. Applied Sciences 2025, 15, 10881. Available online: https://creativecommons.org/licenses/by/4.0/. [CrossRef]
- Tsiamitros, N.; Mahapatra, T.; Passalidis, I.; Kailashnath, K.; Pipelidis, G. Pedestrian Flow Identification and Occupancy Prediction for Indoor Areas Licensed under CC BY 4.0. Sensors 2023, 23, 4301. [Google Scholar] [CrossRef]
- Wan, Q.; Yu, Y.; Chen, R.; Chen, L. Map-Assisted 3D Indoor Localization Using Crowd-Sensing-Based Trajectory Data and Error Ellipse-Enhanced Fusion. Remote Sensing 2022, 14. [Google Scholar] [CrossRef]
- Kafataris, G.; Skarlatos, D.; Vlachos, M.; Agapiou, A. Investigating the Accuracy of a 360° Camera for 3D Modeling in Confined Spaces: 360° Panorama vs 25-Rig Compared to TLS. ISPRS Annals of the Photogrammetry, Remote Sensing and Spatial Information Sciences 2025, X-M-2-2025, 139–146. [Google Scholar] [CrossRef]
- Yang, Z.; Zhao, K.; Yang, S.; Xiong, Y.; Zhang, C.; Deng, L.; Zhang, D. Research on a Density-Based Clustering Method for Eliminating Inter-Frame Feature Mismatches in Visual SLAM Under Dynamic Scenes. Sensors 2025, 25. [Google Scholar] [CrossRef] [PubMed]
- Vacca, G.; Vecchi, E. Integrated Geomatic Approaches for the 3D Documentation and Analysis of the Church of Saint Andrew in Orani, Sardinia. Remote Sensing 2025, 17. [Google Scholar] [CrossRef]
- Liu, H.; Yuan, Y.; Yin, X.; Su, L. Spatial/Spectral-Frequency Adaptive Network for Hyperspectral Image Reconstruction in CASSI. Remote Sensing 2025, 17. [Google Scholar] [CrossRef]
- Zhu, Q.; Li, H.; Sun, H.; Xia, T.; Wang, X.; Han, Z. 3DV-Unet: Eddy-Resolving Reconstruction of Three-Dimensional Upper-Ocean Physical Fields from Satellite Observations. Remote Sensing 2025, 17. [Google Scholar] [CrossRef]
- Lv, C.; Lin, W.; Zhao, B. Voxel Structure-Based Mesh Reconstruction From a 3D Point Cloud. IEEE Transactions on Multimedia 2022, 24, 1815–1829. [Google Scholar] [CrossRef]
- Tresnawati, D.; Mulyani, A.; Nugraha, C.; Fitriani, L.; Lestari, N.; Nugraha, D. An Augmented Reality Technology in Indoor Navigation for Smart Museum Using Bluetooth Low Energy Communication. In Proceedings of the 2024 International Conference on ICT for Smart Society (ICISS), 2024; pp. 1–5. [Google Scholar] [CrossRef]
- Bash, E.A.; Wecker, L.; Rahman, M.M.; Dow, C.F.; McDermid, G.; Samavati, F.F.; Whitehead, K.; Moorman, B.J.; Medrzycka, D.; Copland, L. A Multi-Resolution Approach to Point Cloud Registration without Control Points. Remote Sensing 2023, 15. [Google Scholar] [CrossRef]
- Kong, X. Identifying Geomorphological Changes of Coastal Cliffs through Point Cloud Registration from UAV Images. Remote Sensing 2021, 13. [Google Scholar] [CrossRef]
- Barnea, S.; Filin, S. 3D Model Generation From Single 360° Images. ISPRS Annals of the Photogrammetry, Remote Sensing and Spatial Information Sciences 2022, X-3-W1-2022, 17–24. [Google Scholar] [CrossRef]
- Elghayesh, A.; Mekawey, H. MSA University Campus Indoor Navigation and positioning System Using Augmented Reality. In Proceedings of the 2025 Intelligent Methods, Systems, and Applications (IMSA), 2025; pp. 152–156. [Google Scholar] [CrossRef]
- B, K.; Sankar, S.; R, S.; Ranjani, J. AR GuideX: Indoor Wayfinder. Proceedings of the 2024 International Conference on Power, Energy, Control and Transmission Systems (ICPECTS) 2024, 1–6. [Google Scholar] [CrossRef]
- Messi, L.; Spegni, F.; Vaccarini, M.; Corneli, A.; Binni, L. Infrastructure-Free Localization System for Augmented Reality Registration in Indoor Environments: A First Accuracy Assessment. Proceedings of the 2024 IEEE International Workshop on Metrology for Living Environment (MetroLivEnv) 2024, 110–115. [Google Scholar] [CrossRef]
- Insta360. Insta360 X5 8K 360º Action Camera. 2025. Available online: https://www.insta360.com/product/insta360-x5.
- Cup, Inc. CupixVista: AI-Powered 3D Digital Twin Platform. Accessed. 2025. [Google Scholar]
- Visual Computing Lab - ISTI - CNR. MeshLab Open Source Mesh Processing Tool. Accessed. 2025.
- Girardeau-Montaut, D. CloudCompare, 2025. GPL Software. Version 2.14 (Alpha).
- Google Developers. ARCore: Google’s Platform for Building Augmented Reality Experiences, 2025. Software Development Kit (SDK). Accessed. 10 12 2025.
- Glomb, D.; Wolff, C. User Experience and Multimodal Usability for Navigation Systems. Proceedings of the Annals of Computer Science and Information Systems. Polish Information Processing Society 2022, Vol. 30, 207–210. [Google Scholar] [CrossRef]
- Harwati, T.S.; Nendya, M.B.; Dendy Senapartha, I.K.; Lukito, Y.; Tjahjono, F.N.; Jovan, K.I. Usability Evaluation of Augmented Reality Indoor Navigation: A System Usability Scale Approach. Proceedings of the 2024 2nd International Conference on Technology Innovation and Its Applications (ICTIIA) 2024, 1–5. [Google Scholar] [CrossRef]
Figure 1.
System architecture with four layers.
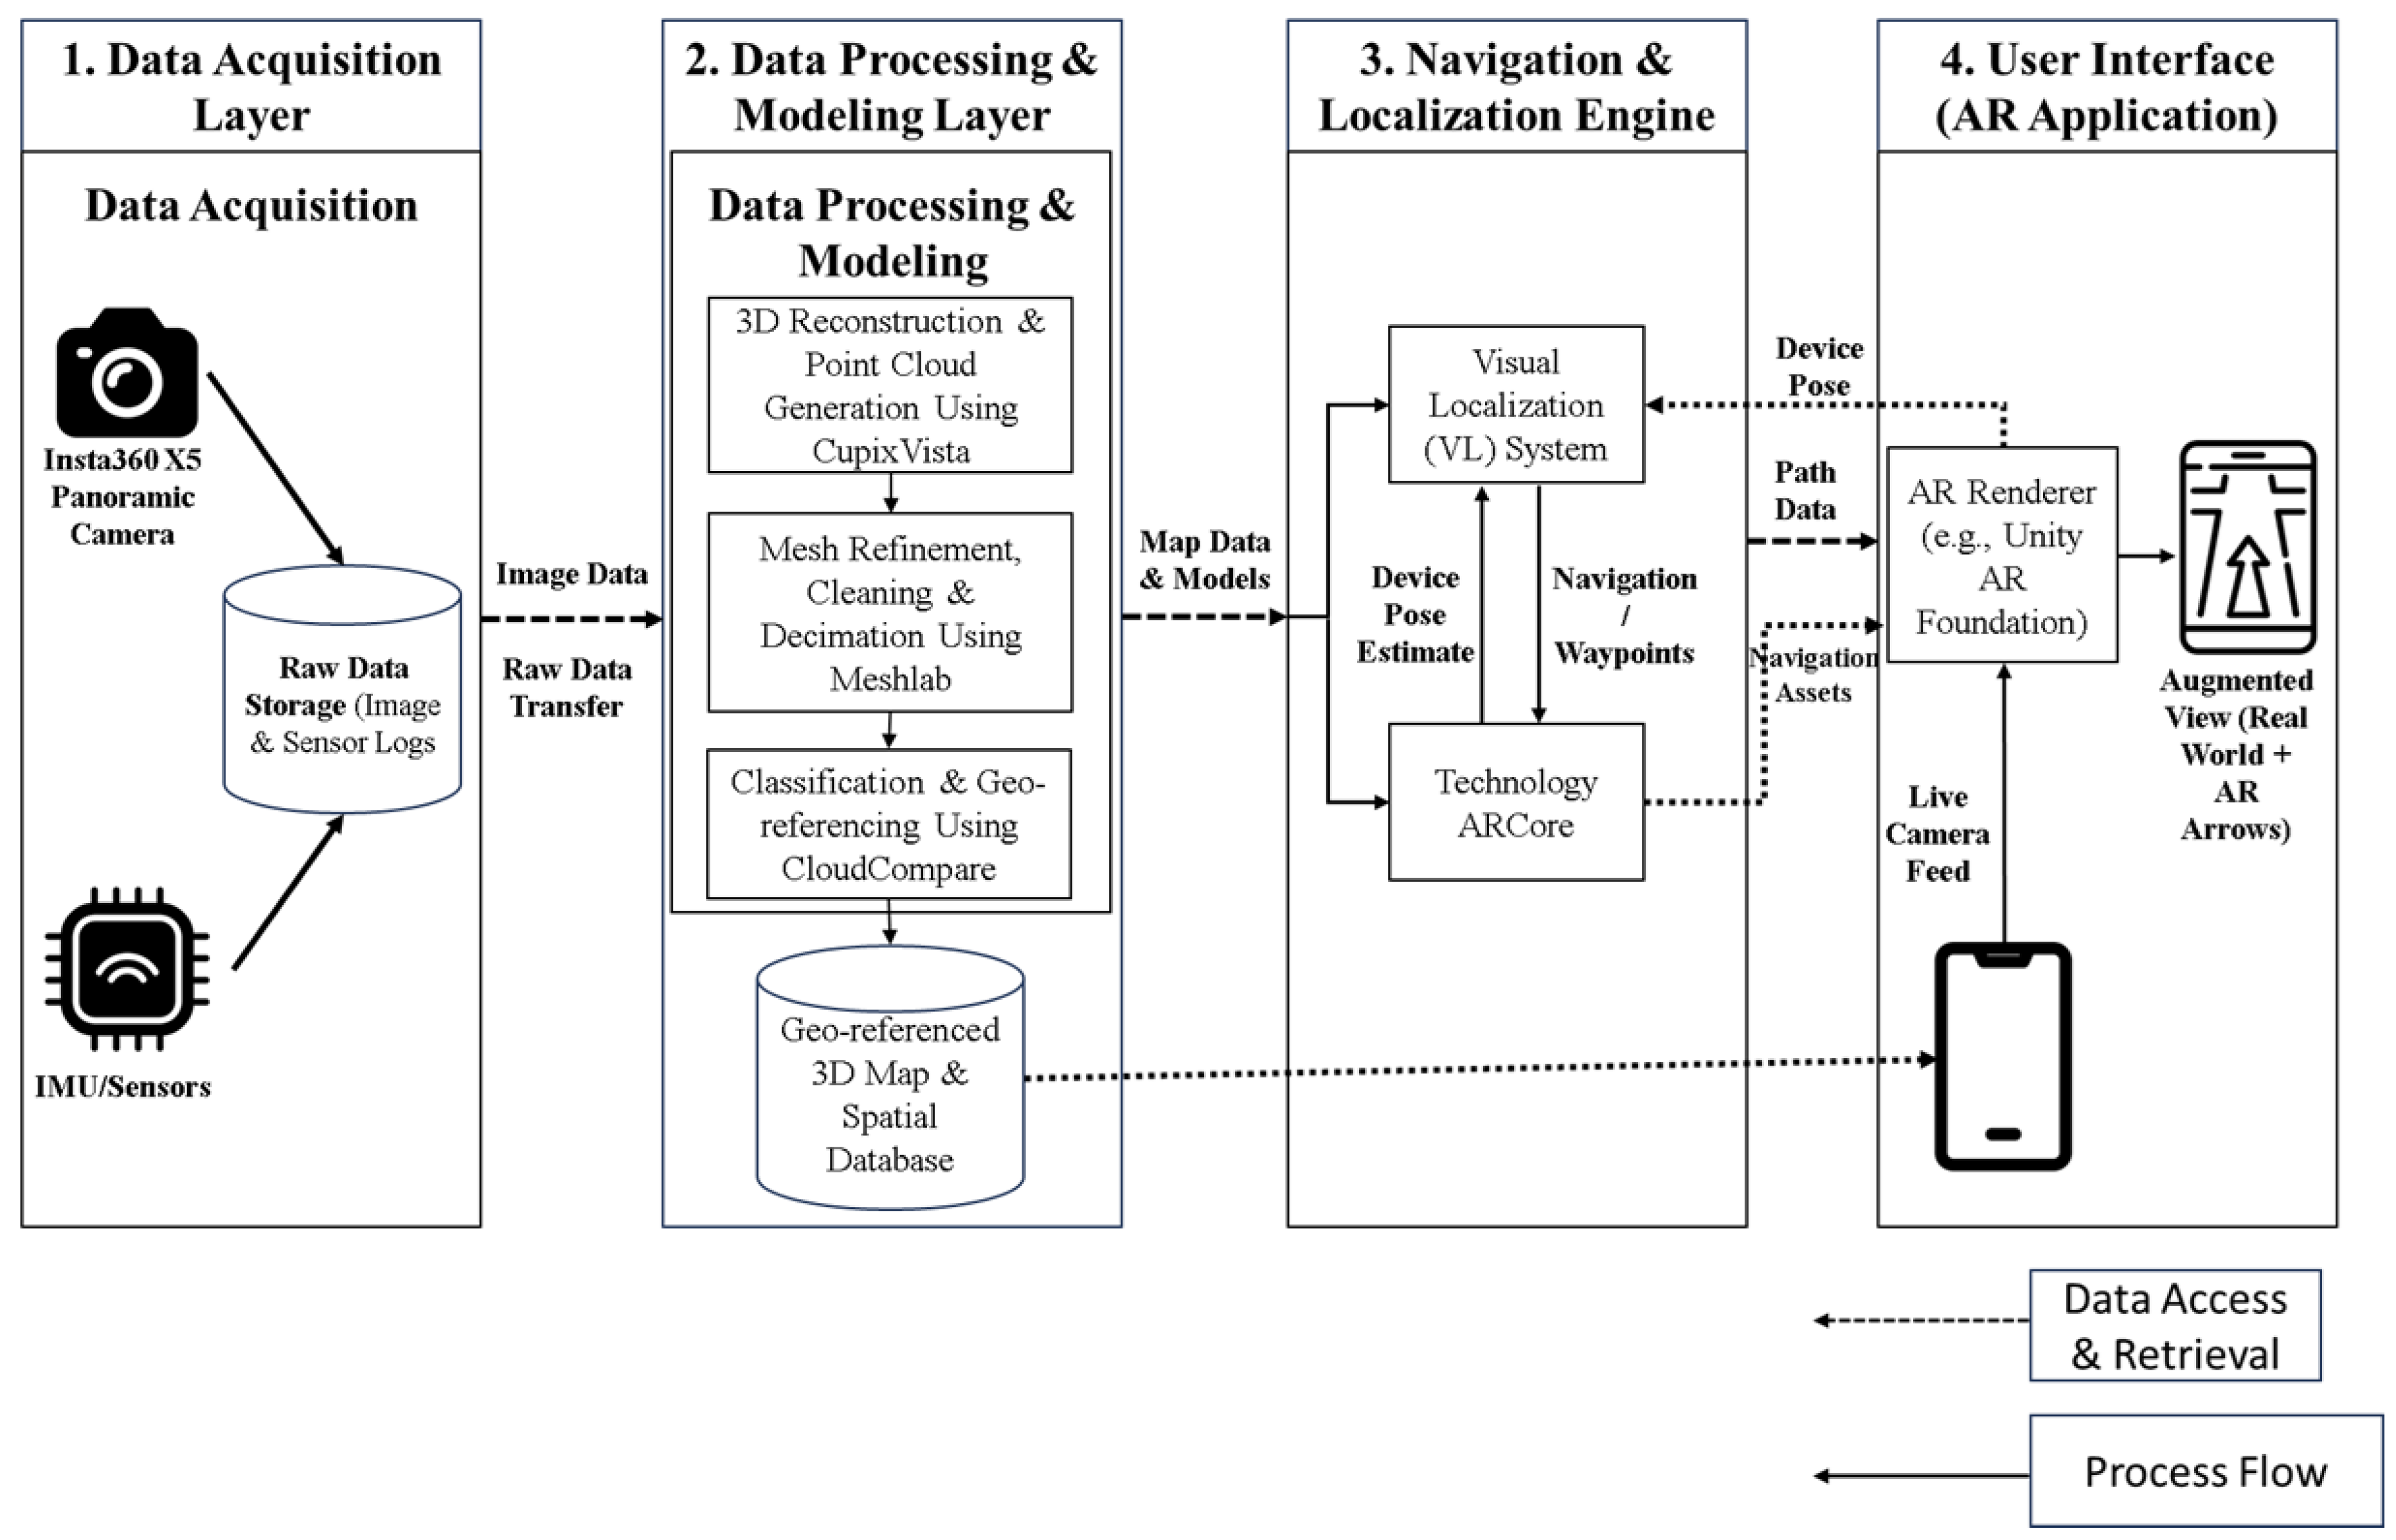
Figure 2.
Hardware configuration for 360° data acquisition.
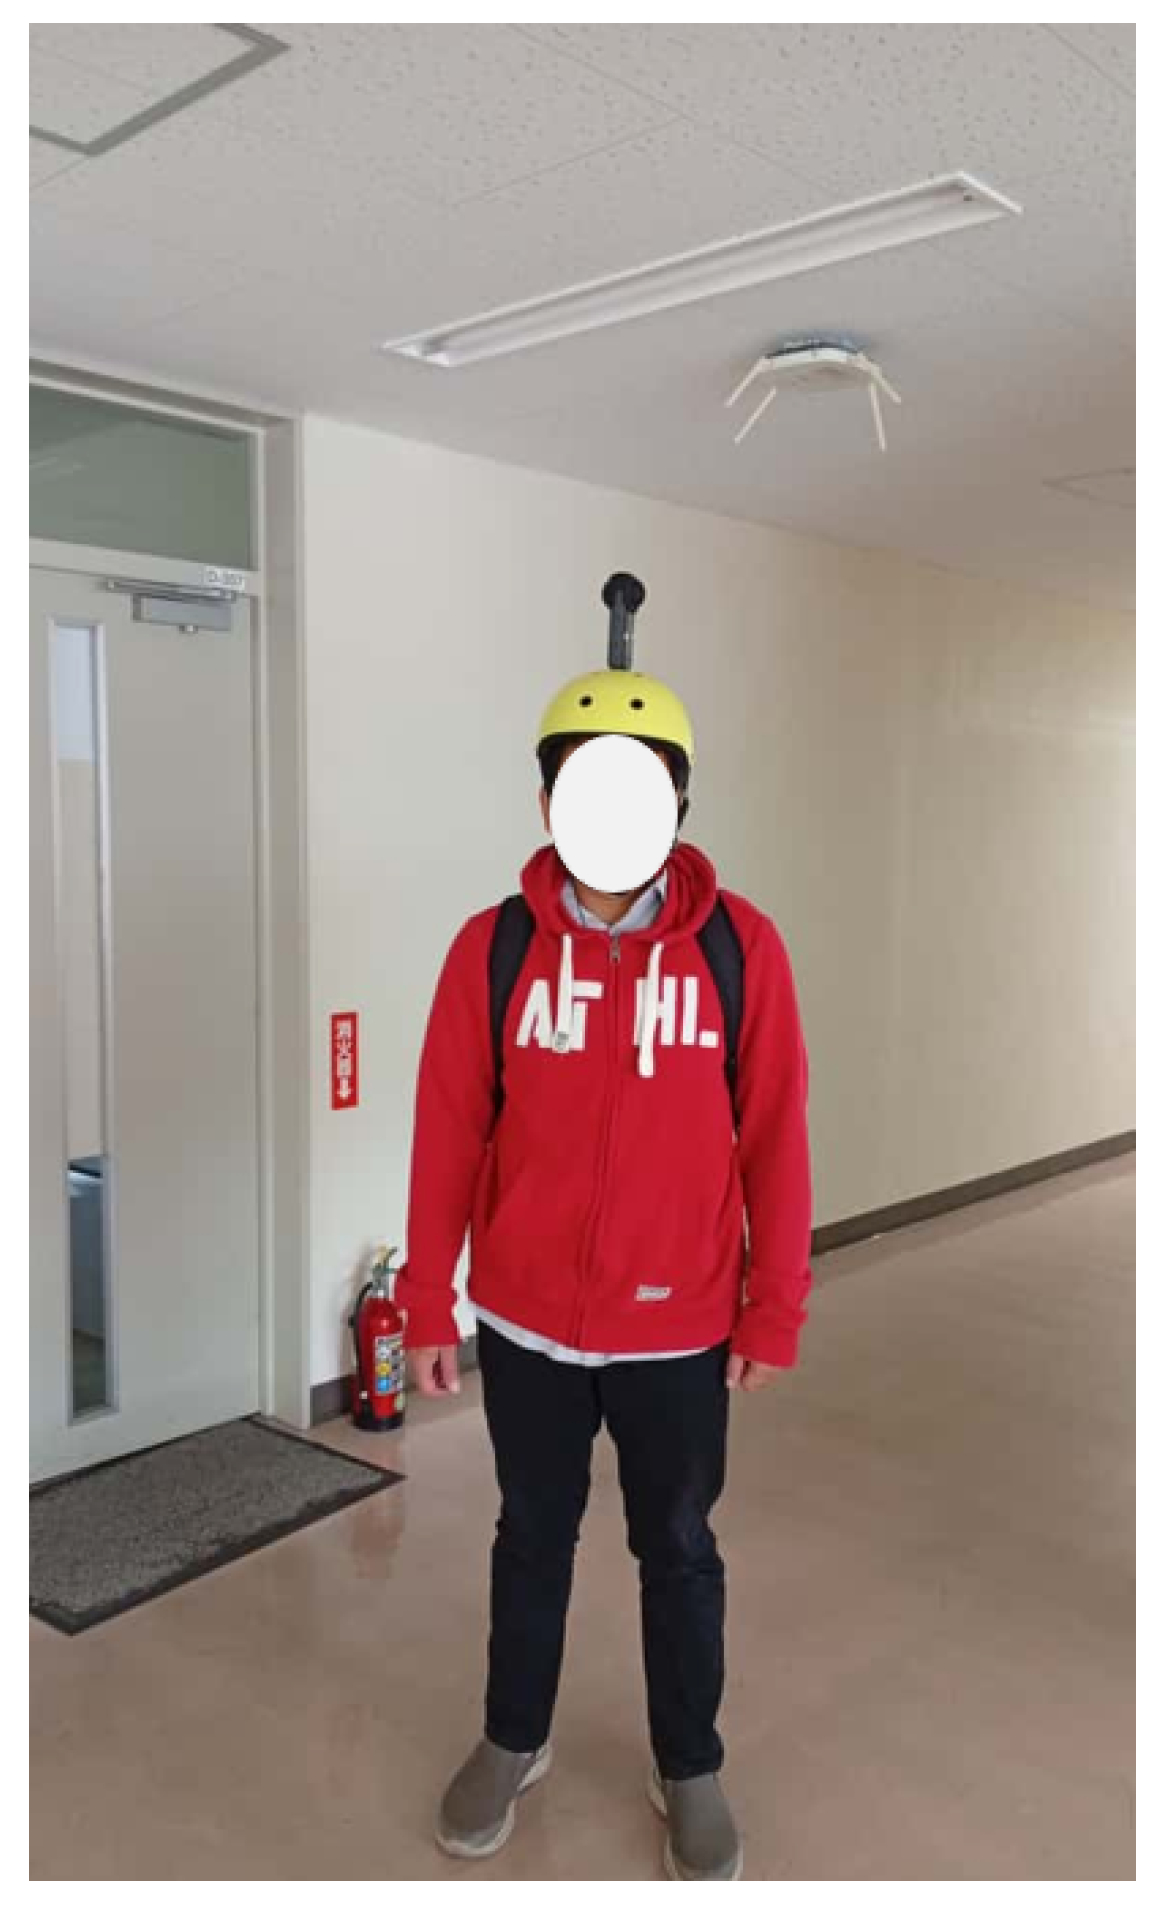
Figure 3.
Samples of 360° panoramic dataset: (a) Floor 1 staircase area; (b) Floor 2 corridor; (c) Floor 3 corridor; and (d) Floor 4 corridor.
Figure 3.
Samples of 360° panoramic dataset: (a) Floor 1 staircase area; (b) Floor 2 corridor; (c) Floor 3 corridor; and (d) Floor 4 corridor.
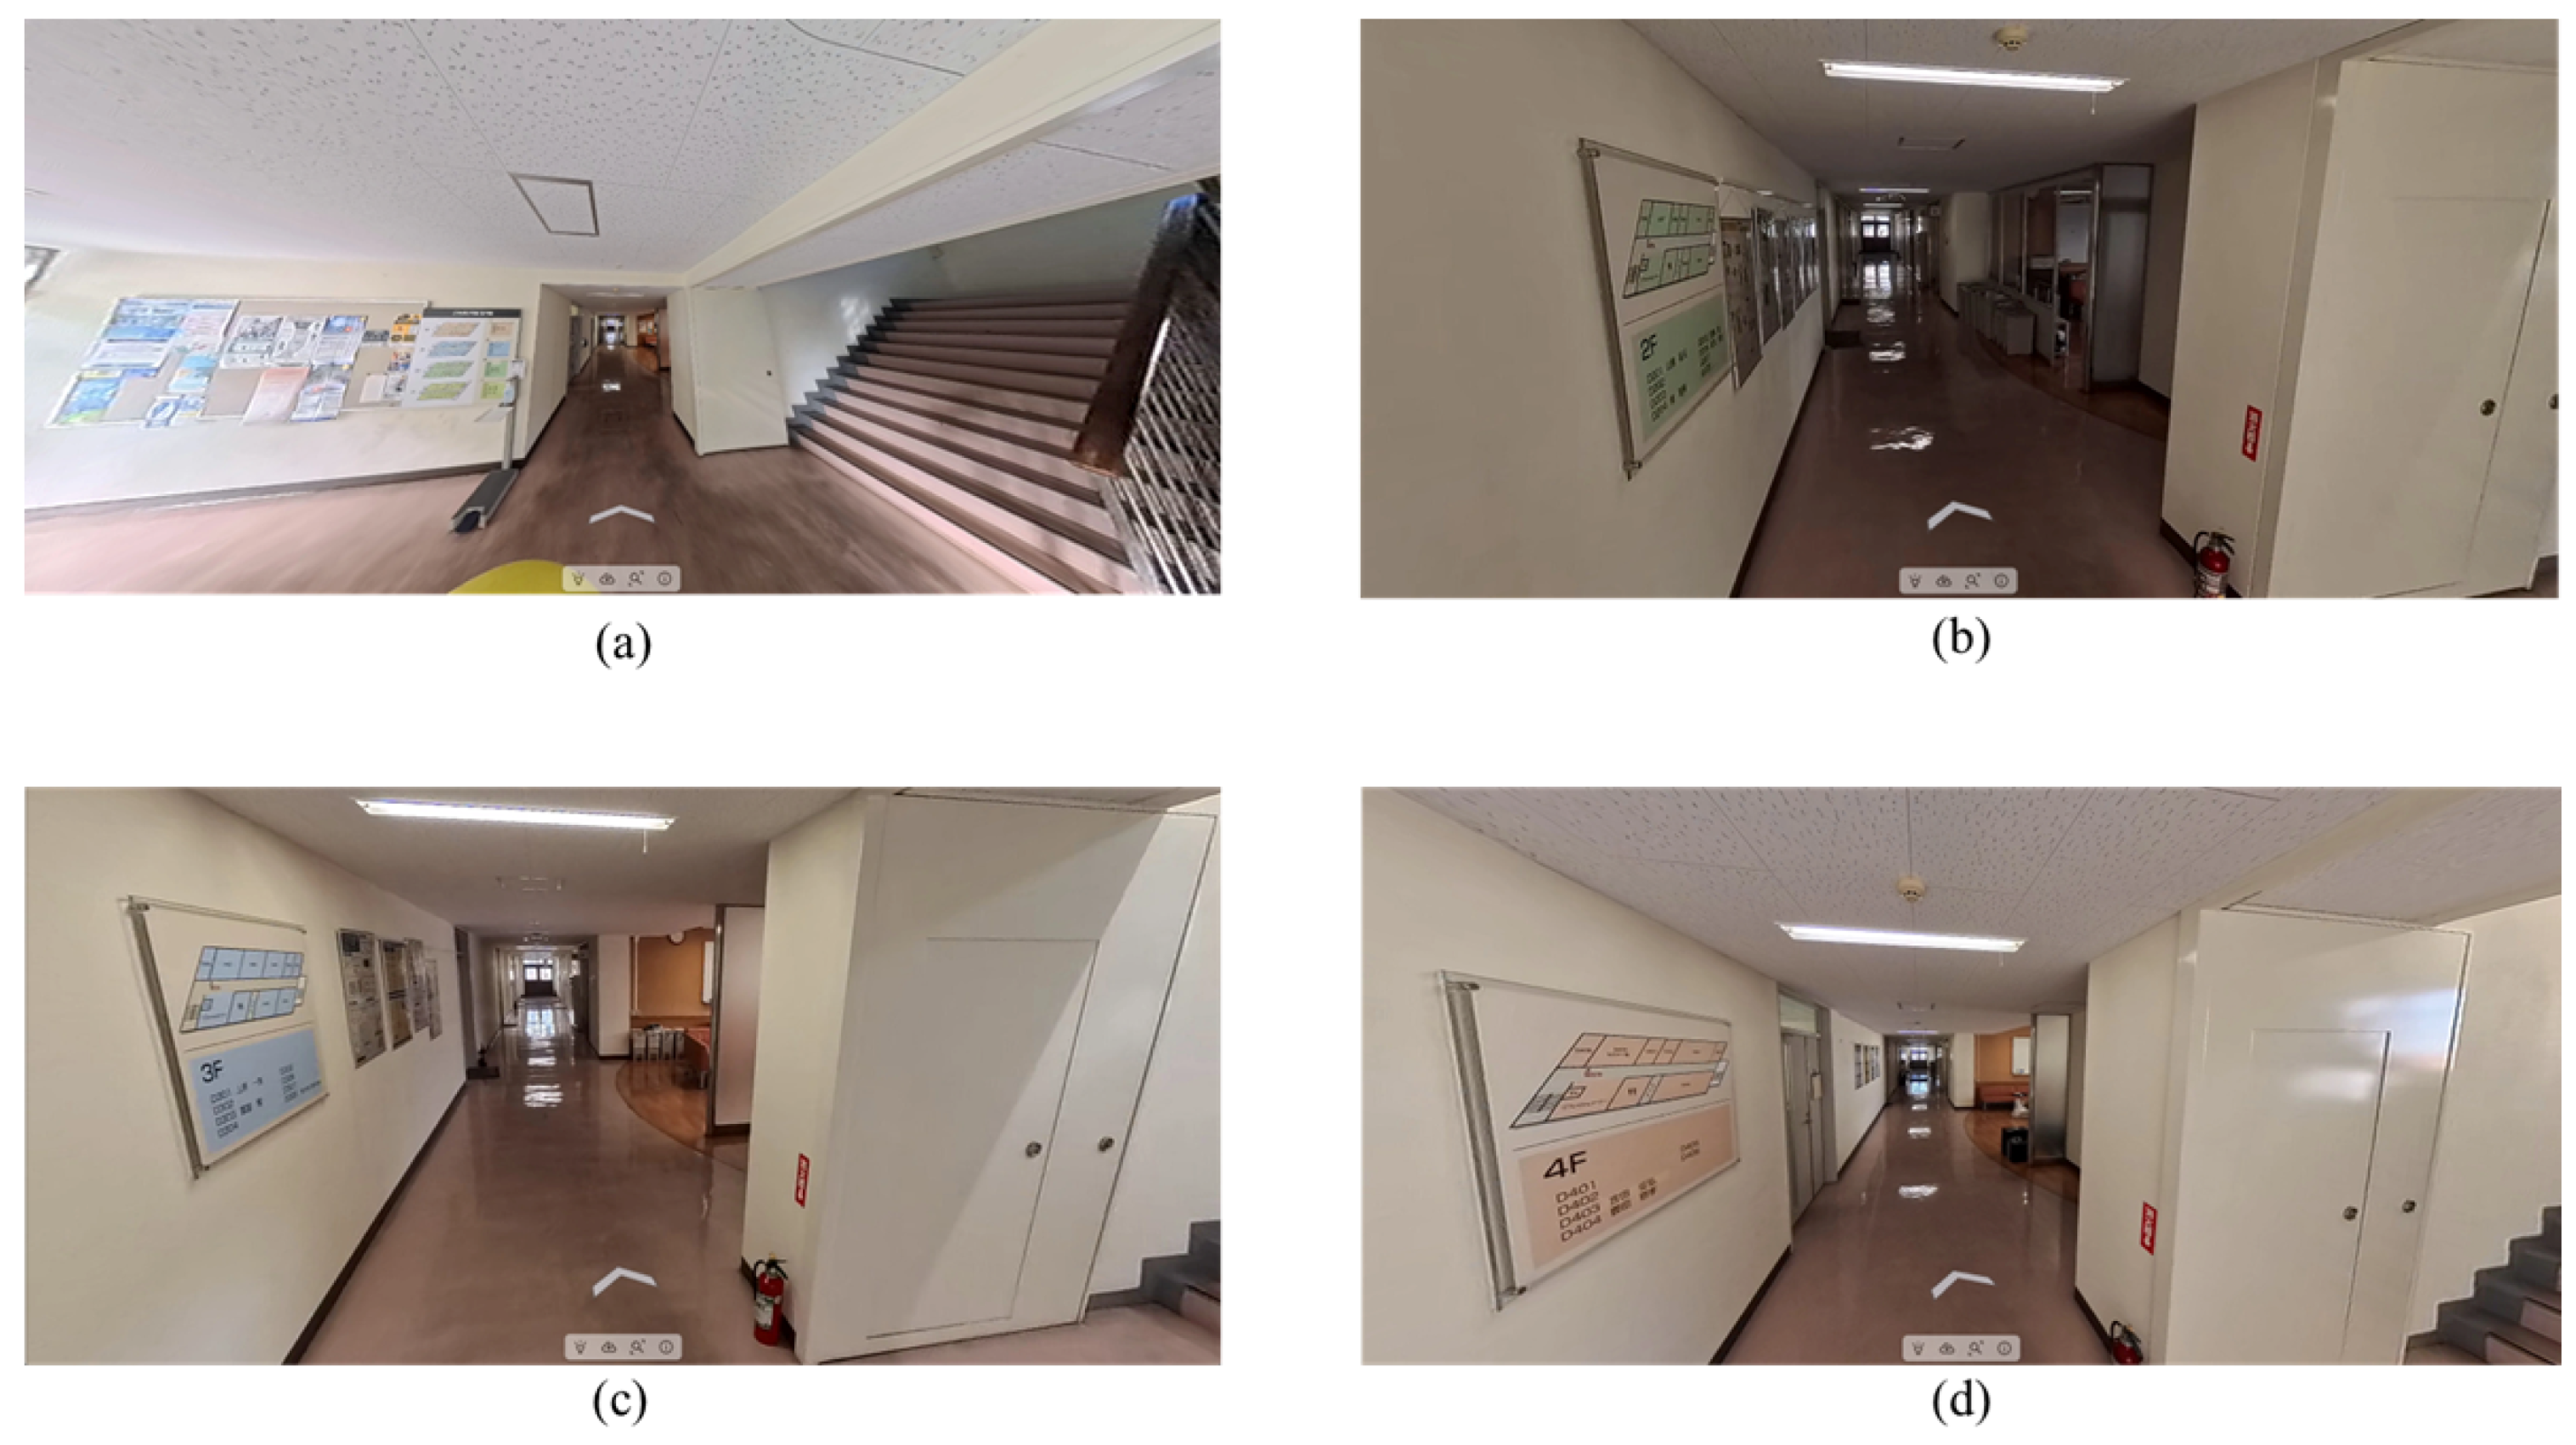
Figure 4.
3D reconstruction and point cloud generation results by CupixVista: (a) Floor 1 structure; (b) Floor 2 corridor layout; (c) Floor 3 layout; and (d) Floor 4 layout.
Figure 4.
3D reconstruction and point cloud generation results by CupixVista: (a) Floor 1 structure; (b) Floor 2 corridor layout; (c) Floor 3 layout; and (d) Floor 4 layout.
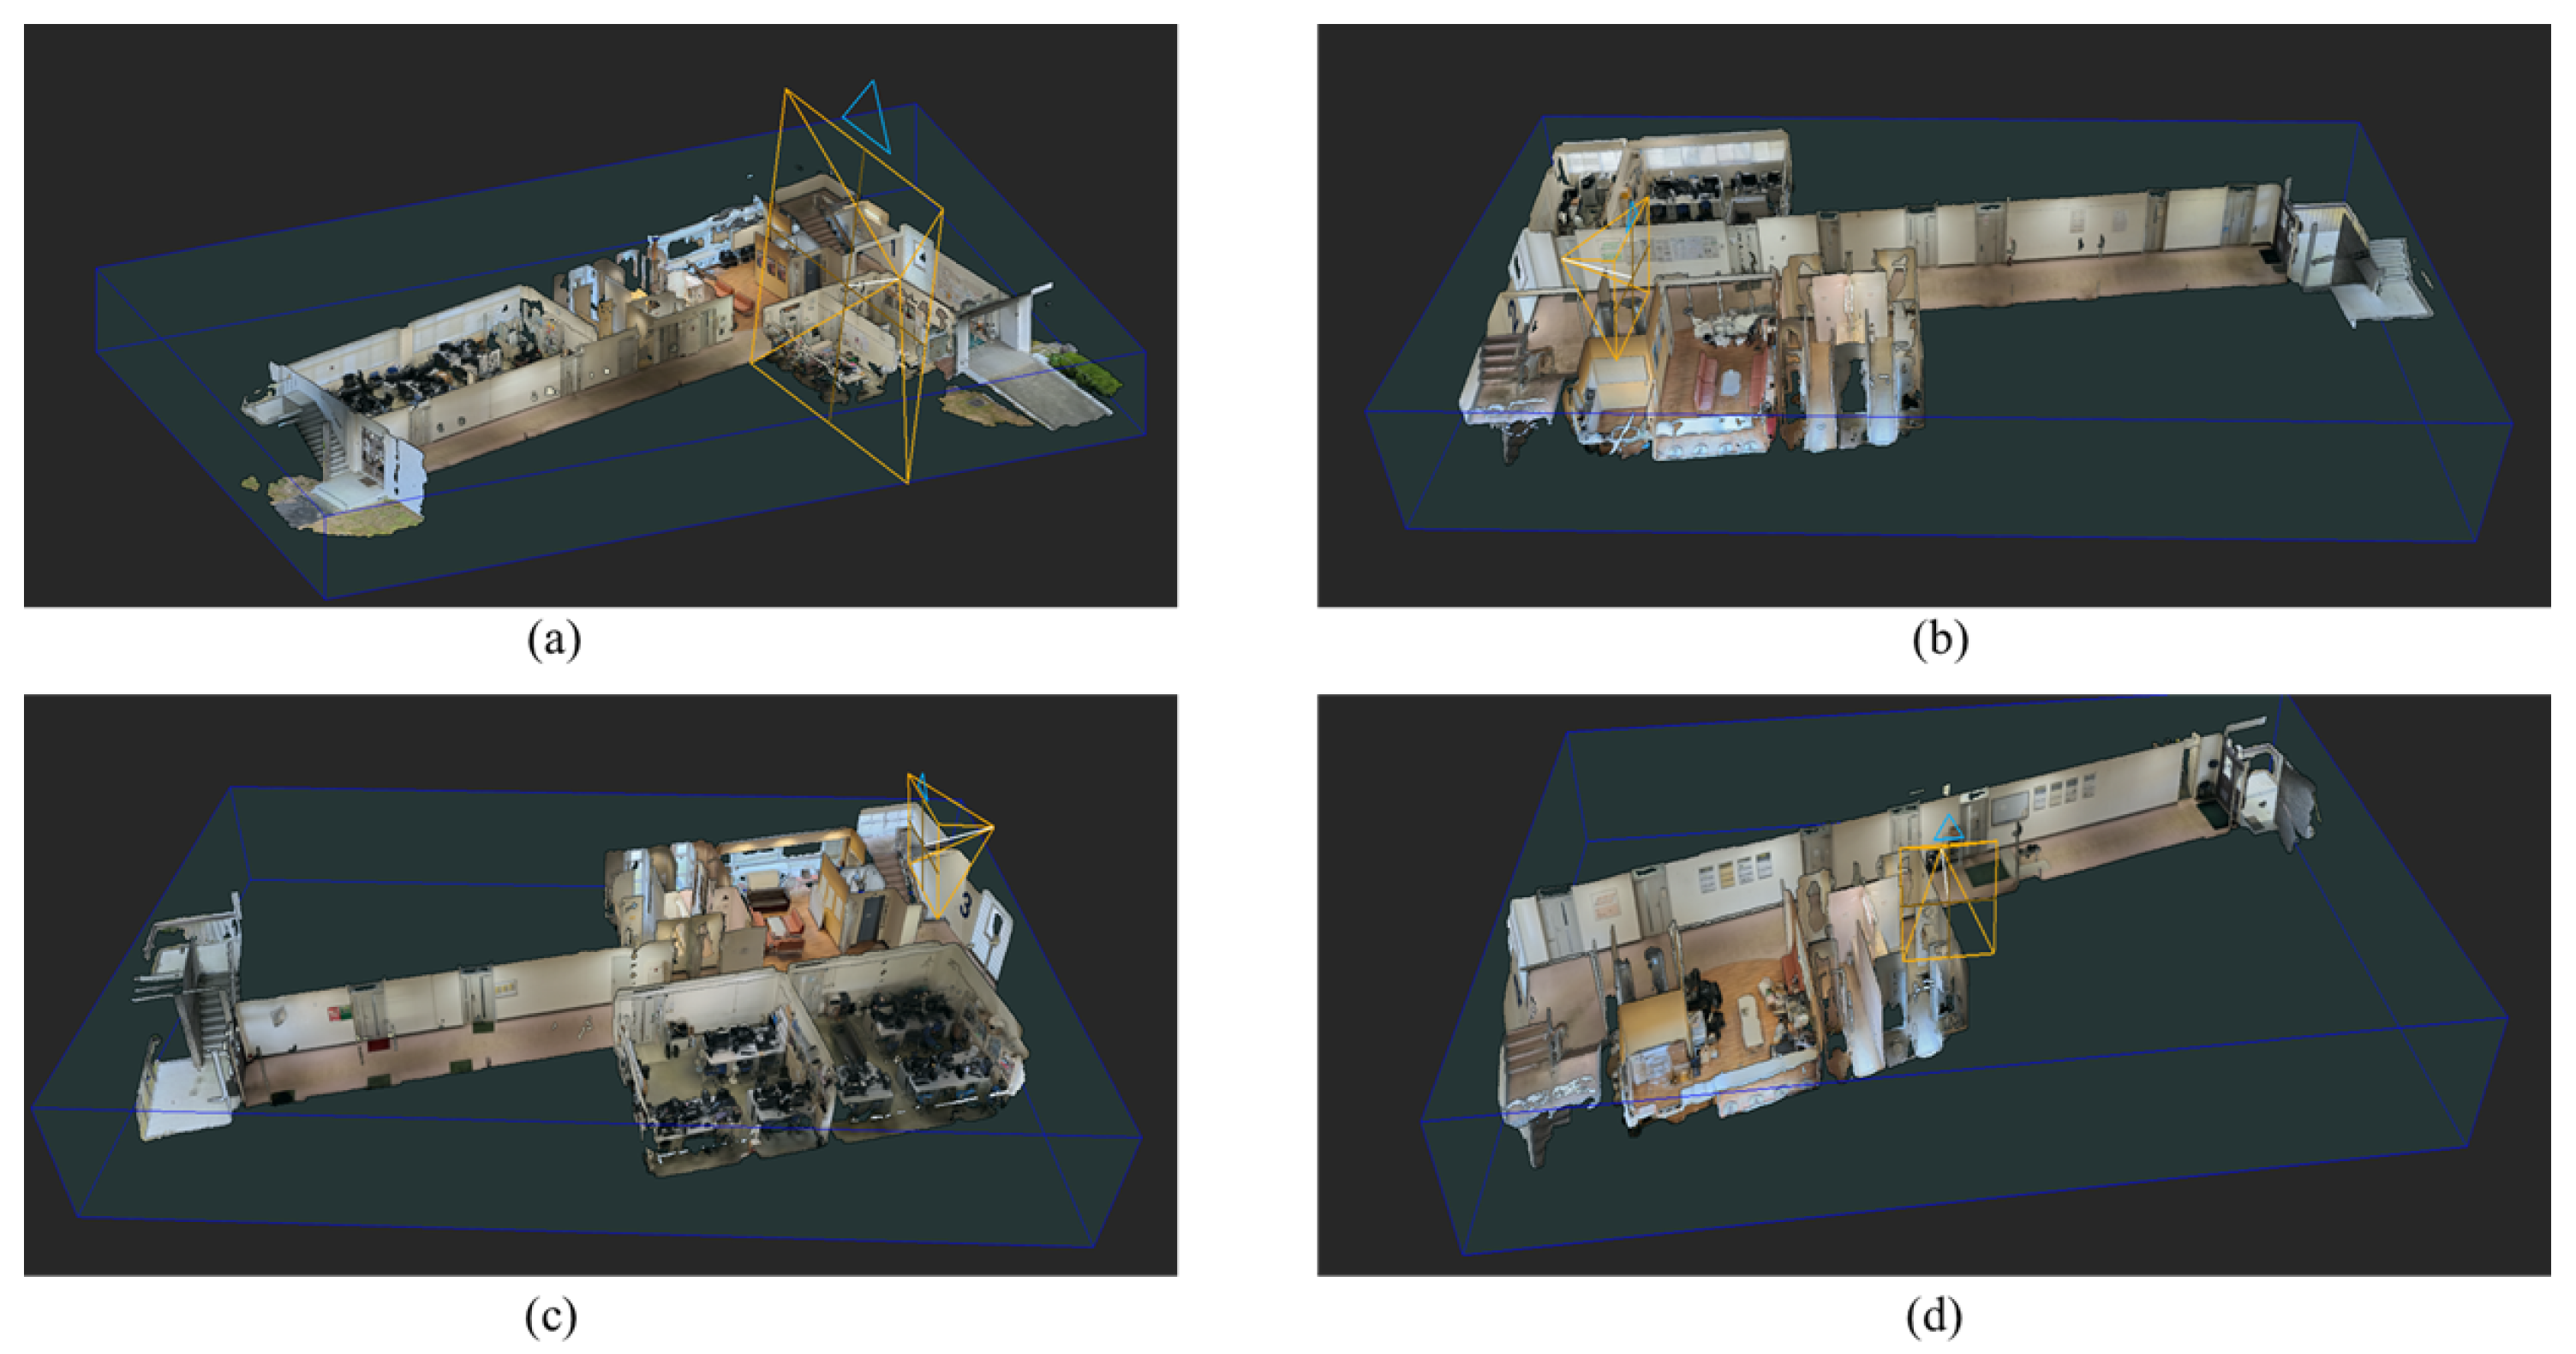
Figure 5.
Integrated 3D building model by MeshLab.
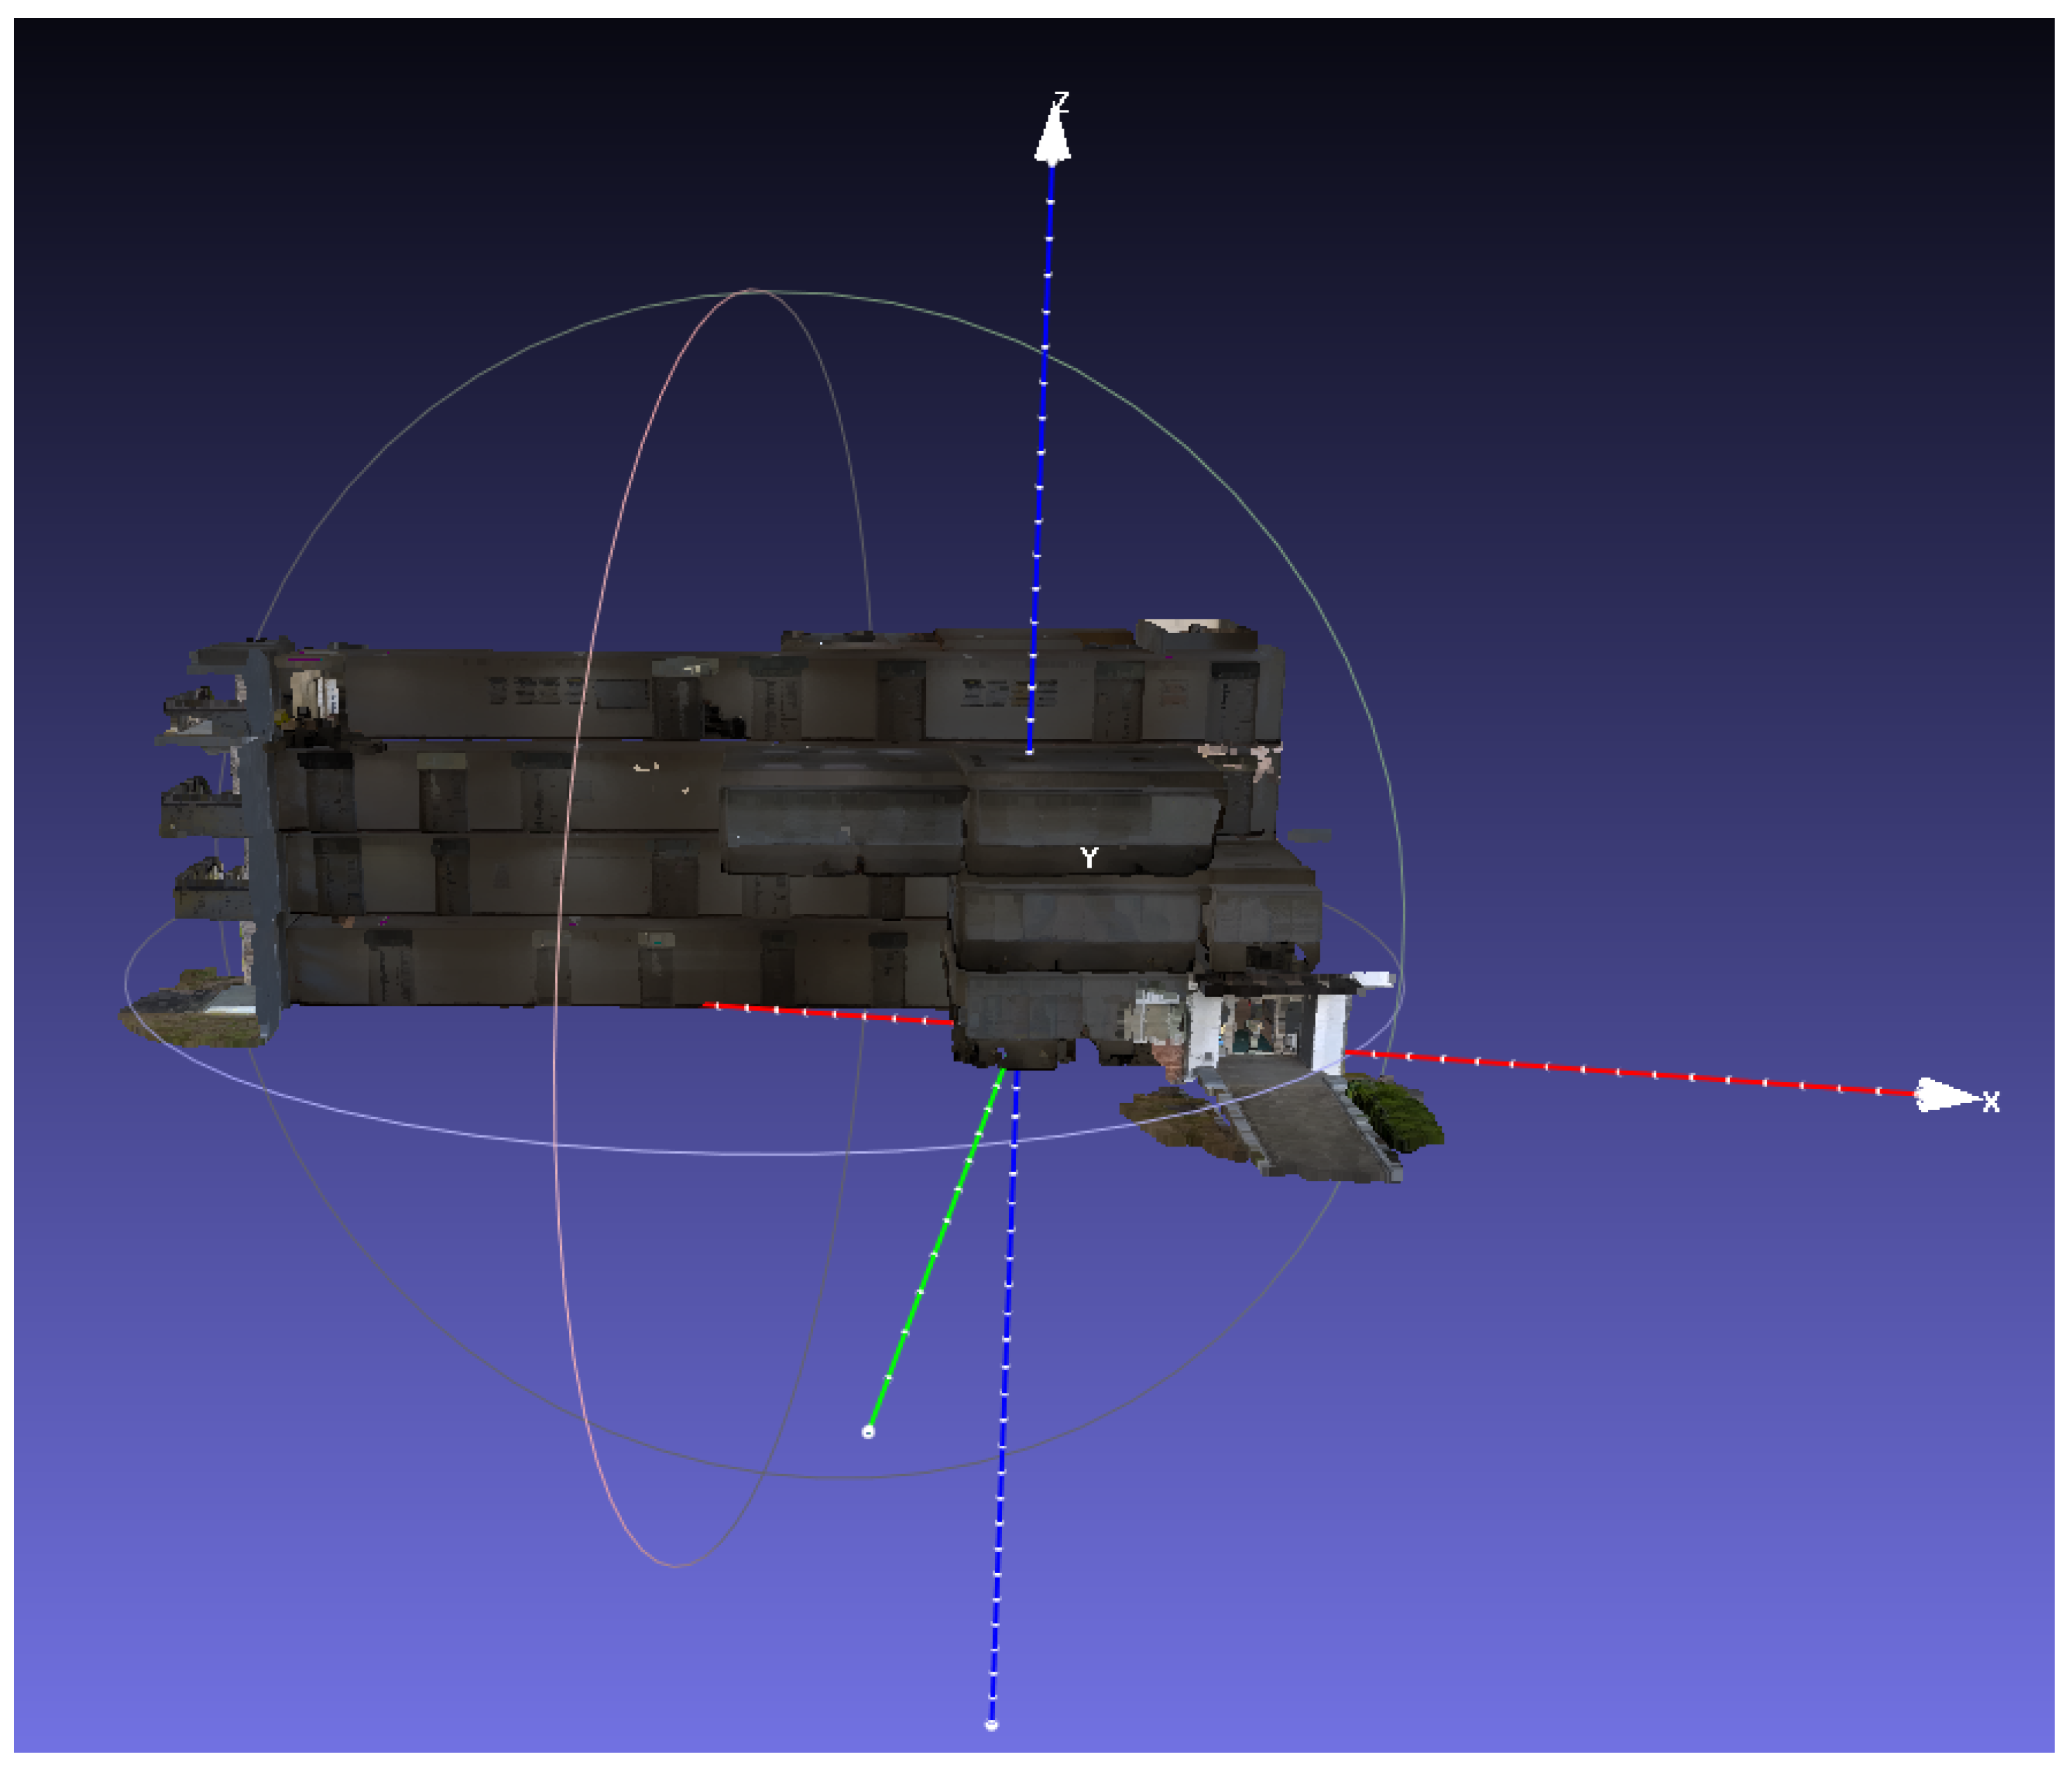
Figure 6.
Georeferencing process in CloudCompare.
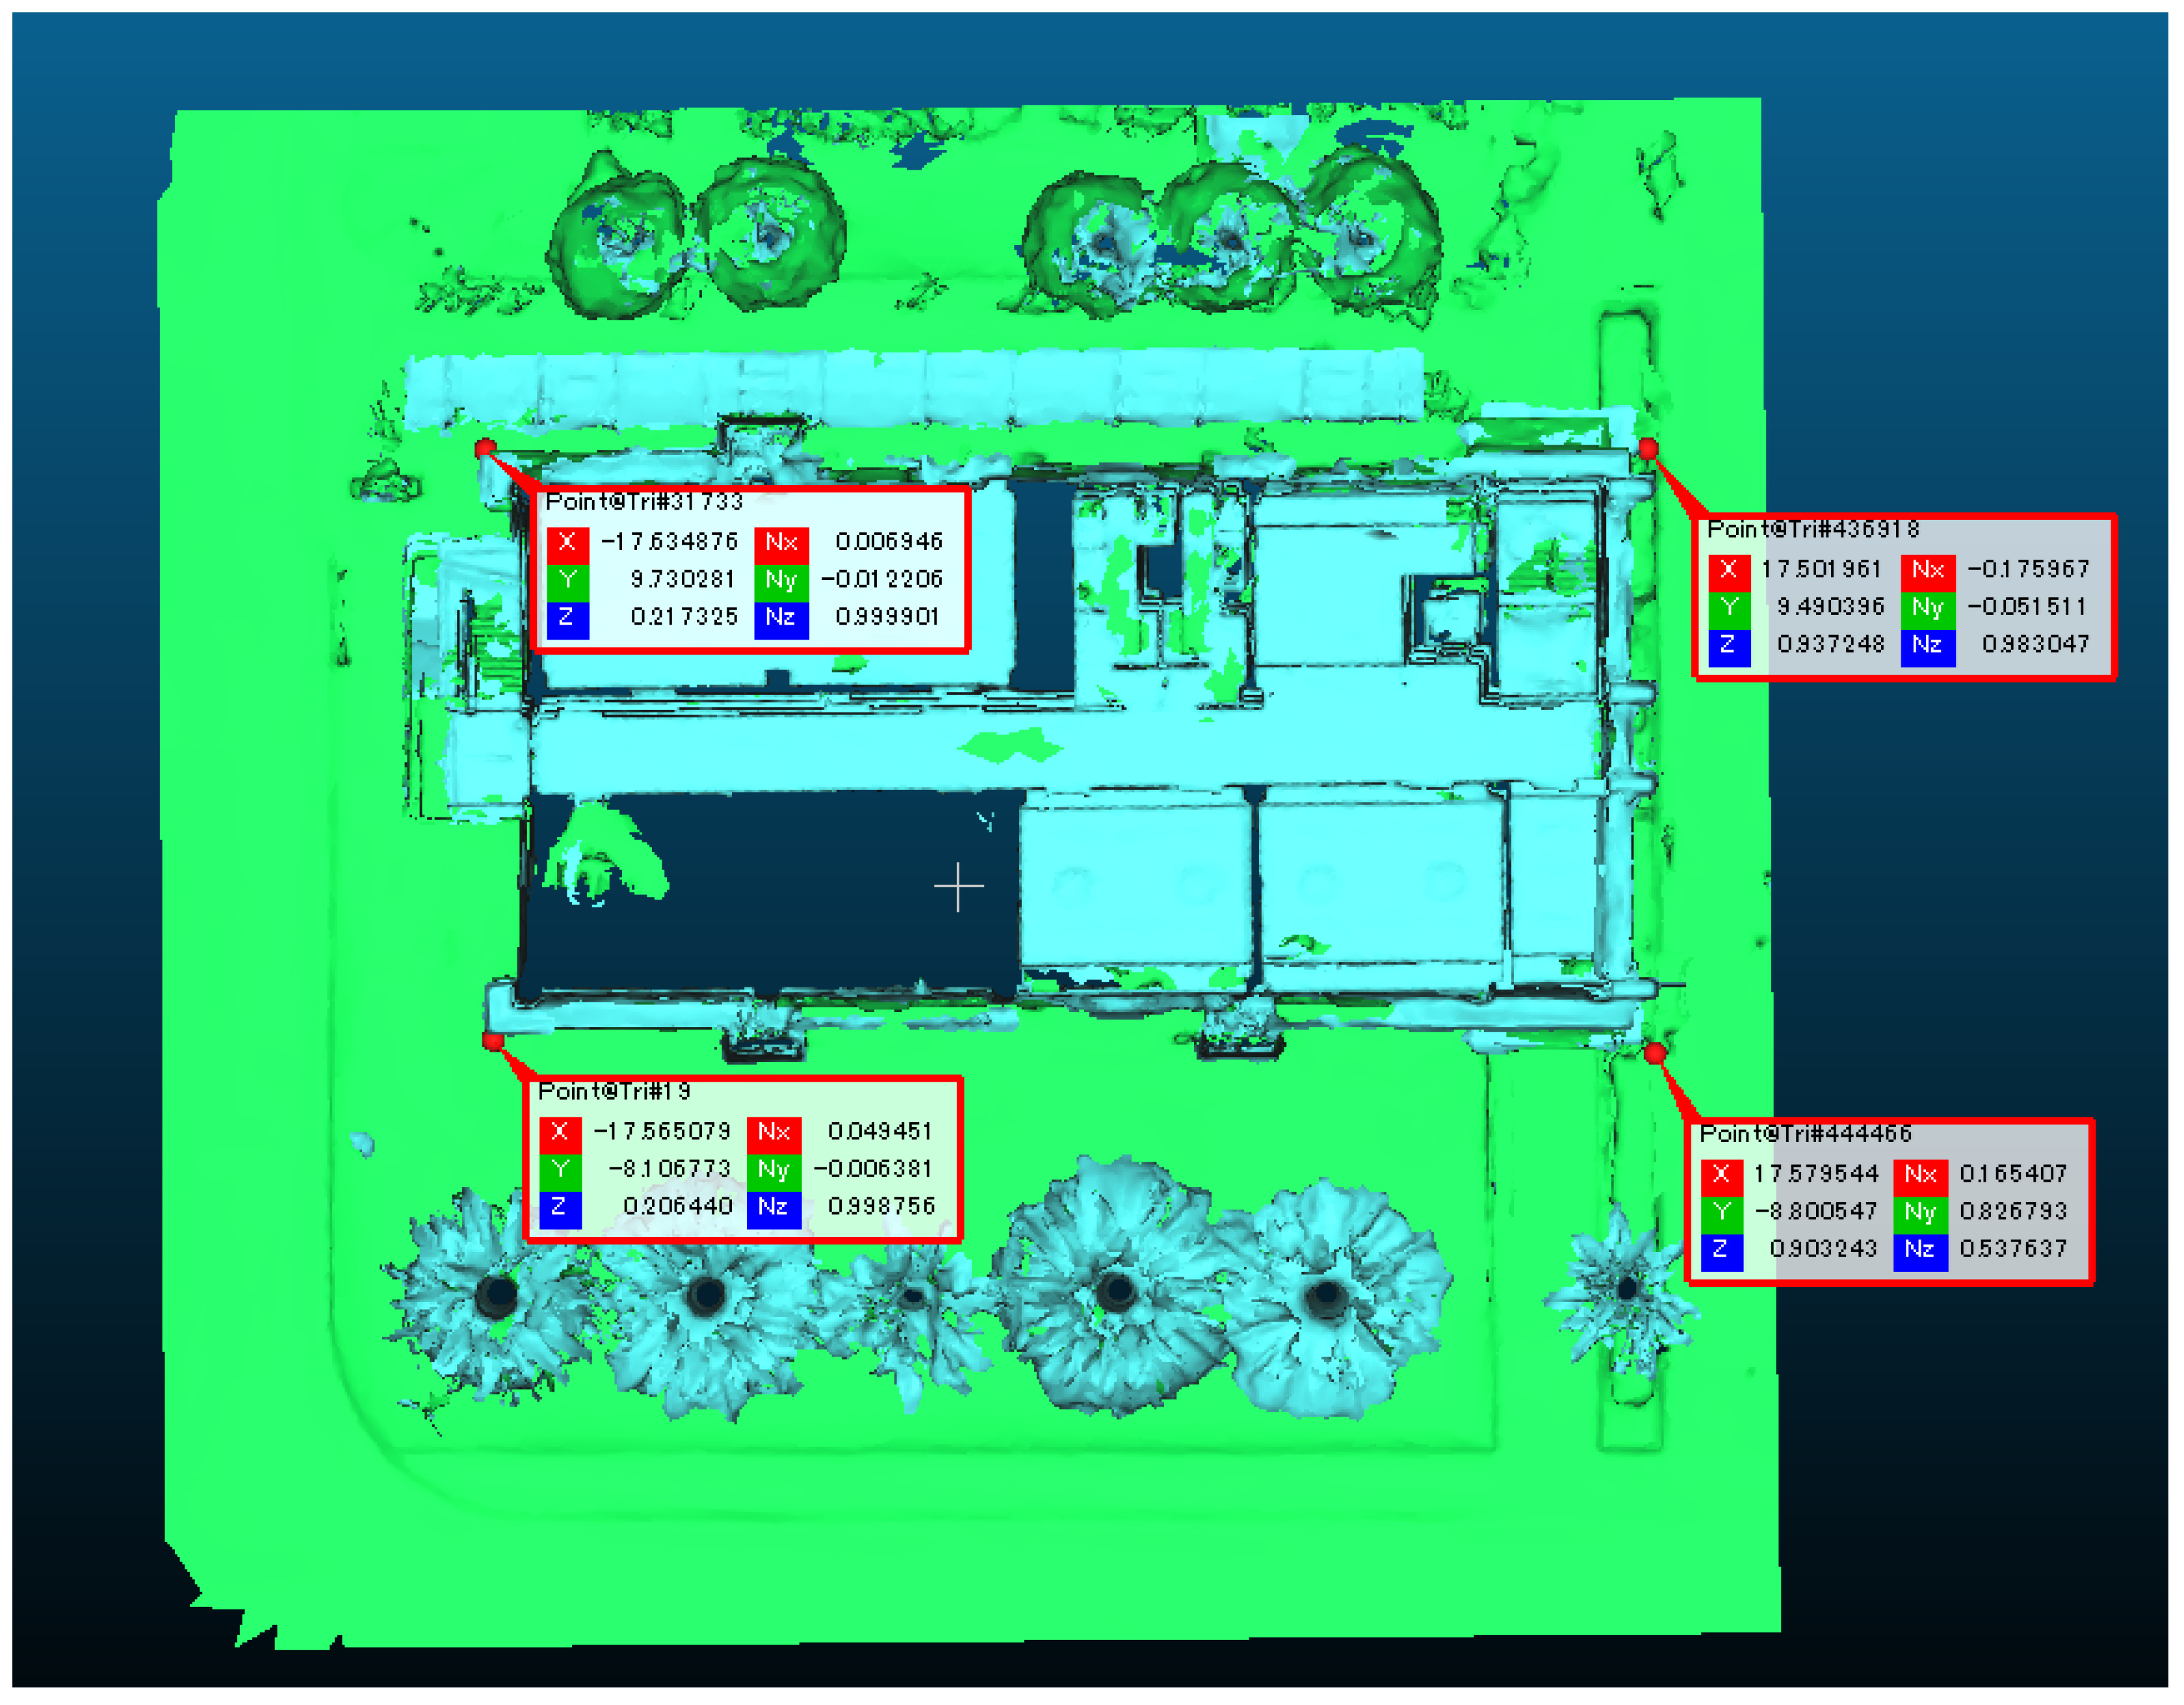
Figure 7.
Baseline AR user interface for field validation from [7].
Figure 7.
Baseline AR user interface for field validation from [7].
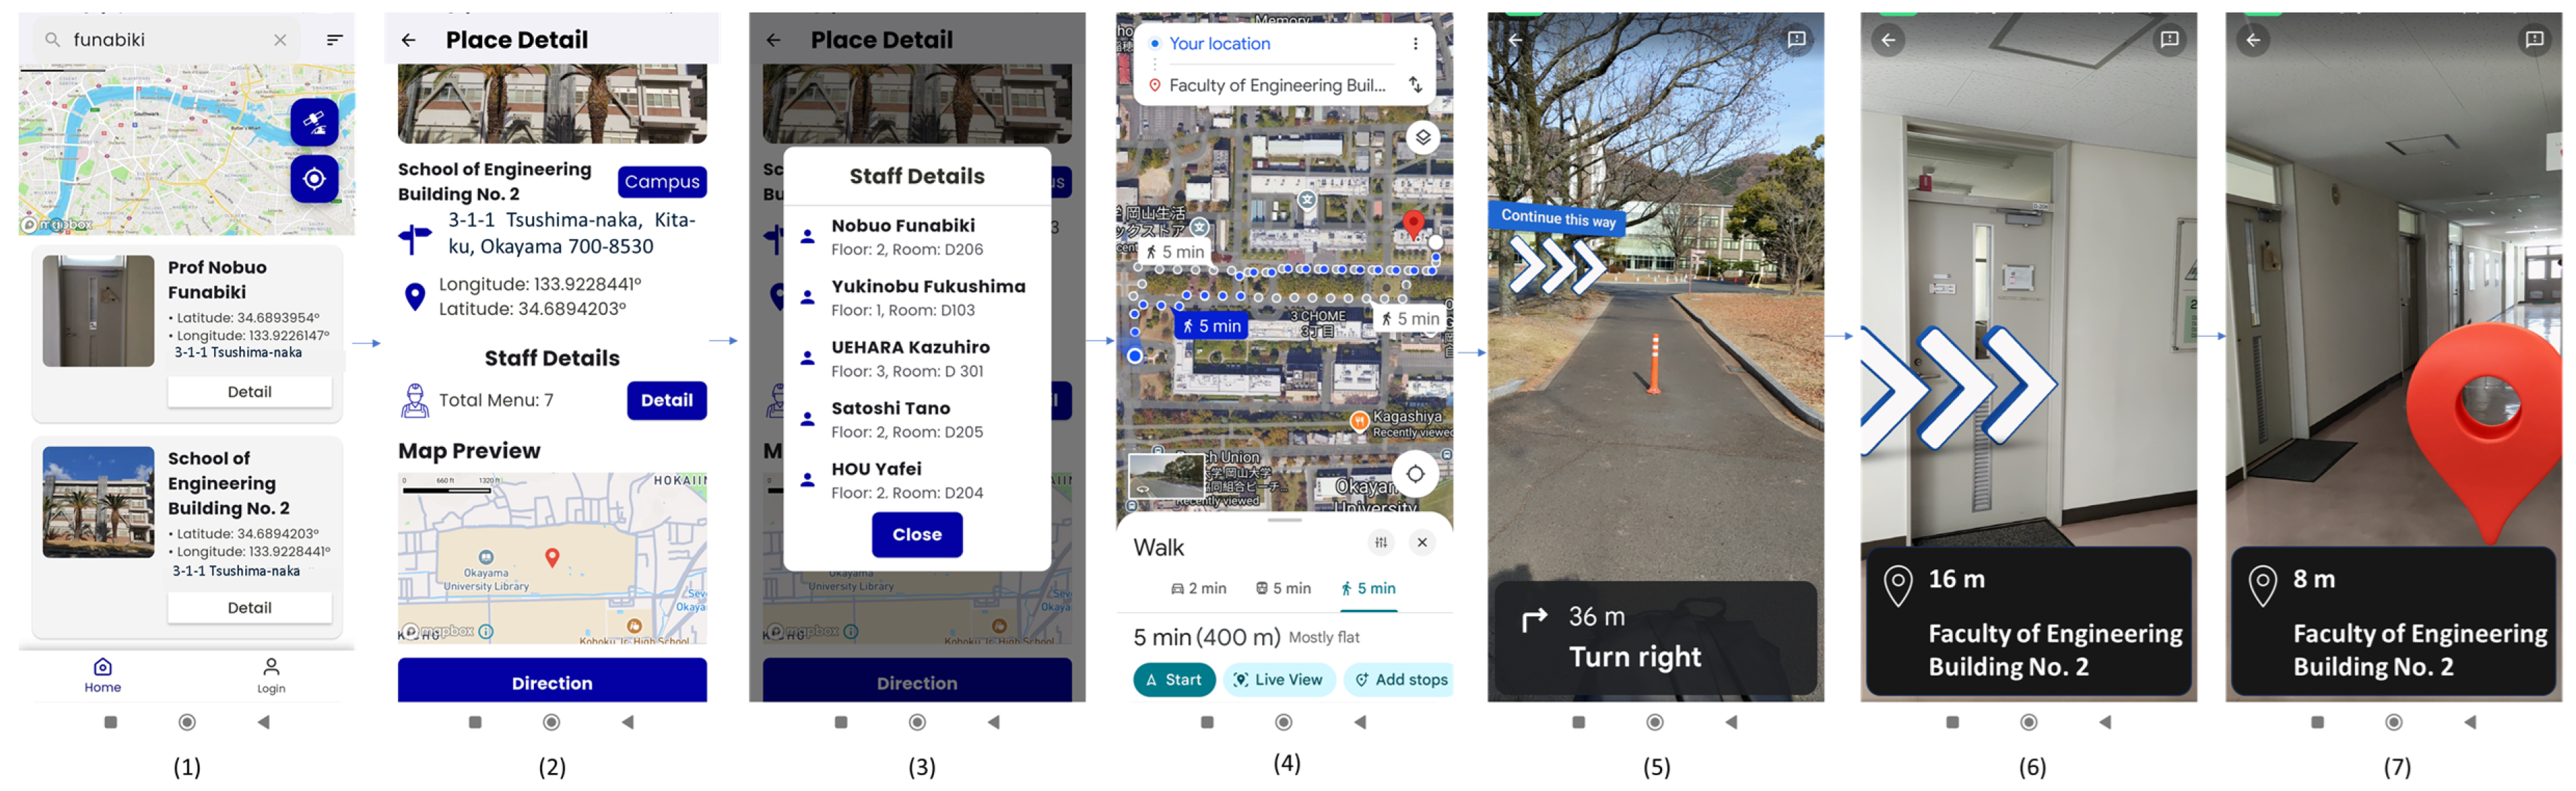
Figure 8.
Field validation of AR navigation: (a) Floor 1; (b) Floor 2; (c) Floor 3; and (d) Floor 4.
Figure 8.
Field validation of AR navigation: (a) Floor 1; (b) Floor 2; (c) Floor 3; and (d) Floor 4.
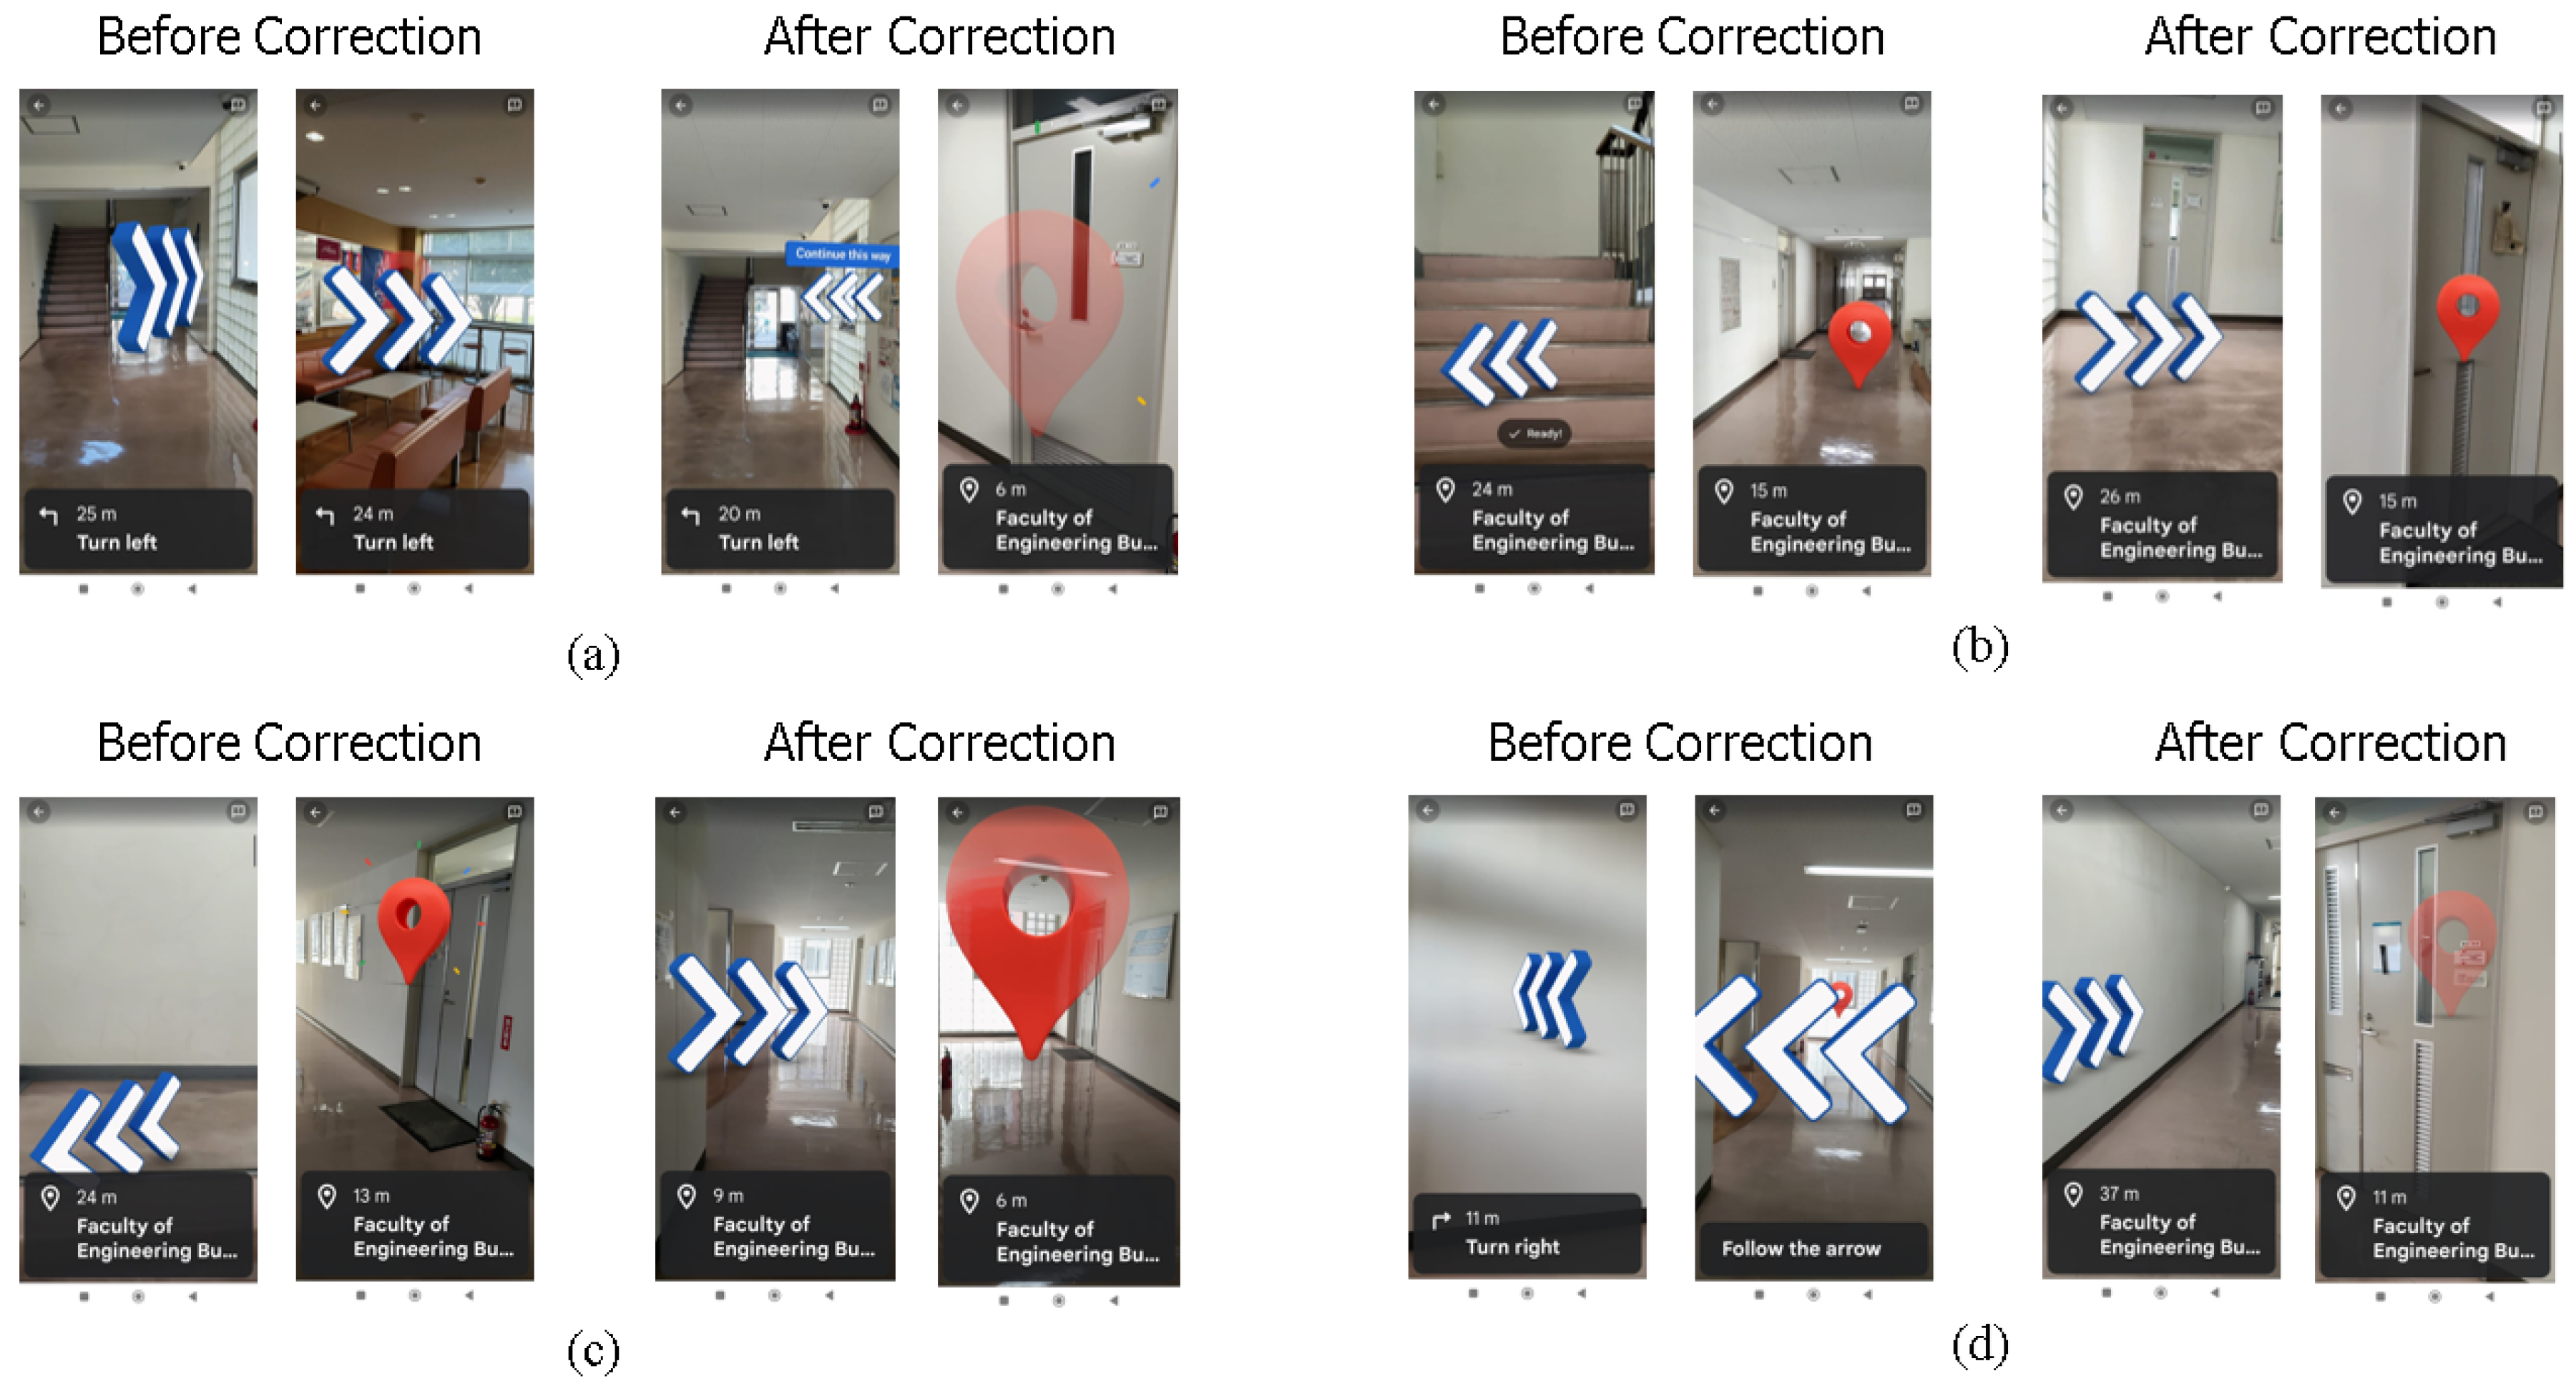

Table 1.
Input, processing, and output specifications for each layer.
| Layer | Input | Process | Output |
|---|---|---|---|
| Data Acquisition (Section 3.2) |
|
|
|
| Modeling Layer (Section 3.3) |
|
|
|
| Navigation Engine (Section 3.4) |
|
|
Real time 6 DoF device pose (Position & Orientation) |
| User Interface (Section 3.5) |
|
|
Augmented guidance view on smartphone screen |
Table 2.
Coordinate correction data and deviation distance calculation.
| Occupant Room | Before Correction | After Correction |
Drift (m) |
||
|---|---|---|---|---|---|
| Long (∘) | Lat (∘) | Long (∘) | Lat (∘) | ||
| Yukinobu Fukushima | 133.922635 | 34.689415 | 133.922629 | 34.689385 | 3.33 |
| Hideyoshi Miura | 133.922663 | 34.689387 | 133.922632 | 34.689383 | 2.86 |
| Yokohiro Tokumi | 133.922596 | 34.689365 | 133.922630 | 34.689379 | 3.46 |
| Nobumoto Yamane | 133.922503 | 34.689455 | 133.922470 | 34.689473 | 3.66 |
| Yafei Hou | 133.922565 | 34.689455 | 133.922540 | 34.689473 | 3.05 |
| Nobuo Funabiki | 133.922622 | 34.689459 | 133.922597 | 34.689473 | 2.78 |
| Satoshi Denno | 133.922590 | 34.689457 | 133.922570 | 34.689473 | 2.53 |
| Kazuhiro Uehara | 133.922432 | 34.689412 | 133.922442 | 34.689441 | 3.34 |
| Shigeru Tomisato | 133.922553 | 34.689421 | 133.922569 | 34.689442 | 2.79 |
| Htoo Htoo Sandy Kyaw |
133.922764 | 34.689471 | 133.922762 | 34.689439 | 3.55 |
| Masahiro Yoshida | 133.922525 | 34.689446 | 133.922562 | 34.689456 | 3.55 |
| Hirotaka Toyota | 133.922603 | 34.689511 | 133.922576 | 34.689496 | 2.94 |
| Average | - | - | 3.15 | ||
Note: The drift indicates the positional correction magnitude calculated via the Haversine formula.
Table 3.
Post-test questions for SUS.
| No | Question | Category |
|---|---|---|
| 1 | I think I would like to use this navigation system frequently for finding rooms inside the building. | Usefulness |
| 2 | I found the navigation system unnecessarily complex when trying to understand the 3D visual guidance. | Ease of Use |
| 3 | I thought the system was easy to use when navigating through the indoor environment. | Ease of Use |
| 4 | I think I would need technical support to use this navigation tool effectively. | Learning Curve |
| 5 | I found the system’s features, such as the 360° views and spatial directions, were well integrated. | Efficiency |
| 6 | I noticed inconsistencies in the system, such as mismatched visuals or unclear location info. | Error Handling |
| 7 | I believe most people would quickly learn how to use this 360° navigation system. | Learning Curve |
| 8 | I found the system cumbersome to use when following the virtual path. | Ease of Use |
| 9 | I felt confident using this system to locate specific rooms using the panoramic display. | Usefulness |
| 10 | I had to learn a lot before I could start effectively using the system for wayfinding. | Learning Curve |
Table 4.
Pre-test result.
| Answer | Participants | Rate |
|---|---|---|
| Yes | 0 | 0% |
| No | 10 | 100% |
Table 5.
SUS Scores from 10 Participants.
| Participant | Responses (Q1–Q10) | SUS Score |
|---|---|---|
| 1 | 4, 1, 5, 1, 5, 1, 5, 2, 5, 1 | 95.0 |
| 2 | 5, 1, 5, 1, 5, 1, 5, 2, 4, 1 | 95.0 |
| 3 | 4, 1, 5, 1, 5, 1, 5, 1, 4, 1 | 95.0 |
| 4 | 5, 1, 5, 1, 5, 1, 5, 1, 5, 1 | 100.0 |
| 5 | 5, 1, 4, 1, 5, 2, 5, 1, 5, 1 | 95.0 |
| 6 | 5, 1, 5, 1, 5, 1, 5, 1, 5, 1 | 100.0 |
| 7 | 4, 2, 5, 1, 5, 1, 5, 1, 5, 2 | 92.5 |
| 8 | 5, 1, 5, 1, 5, 1, 5, 1, 5, 1 | 100.0 |
| 9 | 5, 2, 5, 1, 5, 1, 4, 1, 5, 1 | 95.0 |
| 10 | 4, 1, 5, 1, 5, 1, 5, 1, 5, 1 | 97.5 |
Disclaimer/Publisher’s Note: The statements, opinions and data contained in all publications are solely those of the individual author(s) and contributor(s) and not of MDPI and/or the editor(s). MDPI and/or the editor(s) disclaim responsibility for any injury to people or property resulting from any ideas, methods, instructions or products referred to in the content. |
© 2026 by the authors. Licensee MDPI, Basel, Switzerland. This article is an open access article distributed under the terms and conditions of the Creative Commons Attribution (CC BY) license (http://creativecommons.org/licenses/by/4.0/).
Copyright: This open access article is published under a Creative Commons CC BY 4.0 license, which permit the free download, distribution, and reuse, provided that the author and preprint are cited in any reuse.


