Preprint
Article

This version is not peer-reviewed.

Phase Engineering of Molybdenum Carbide via Vanadium Doping for Boosted Hydrogen Evolution Reaction in Water Electrolysis

Submitted:

12 January 2026

Posted:

14 January 2026

You are already at the latest version

Abstract

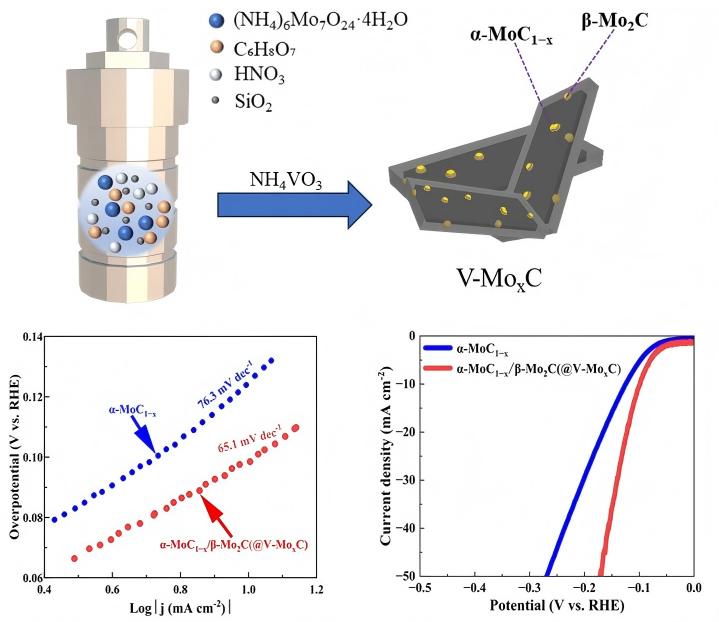
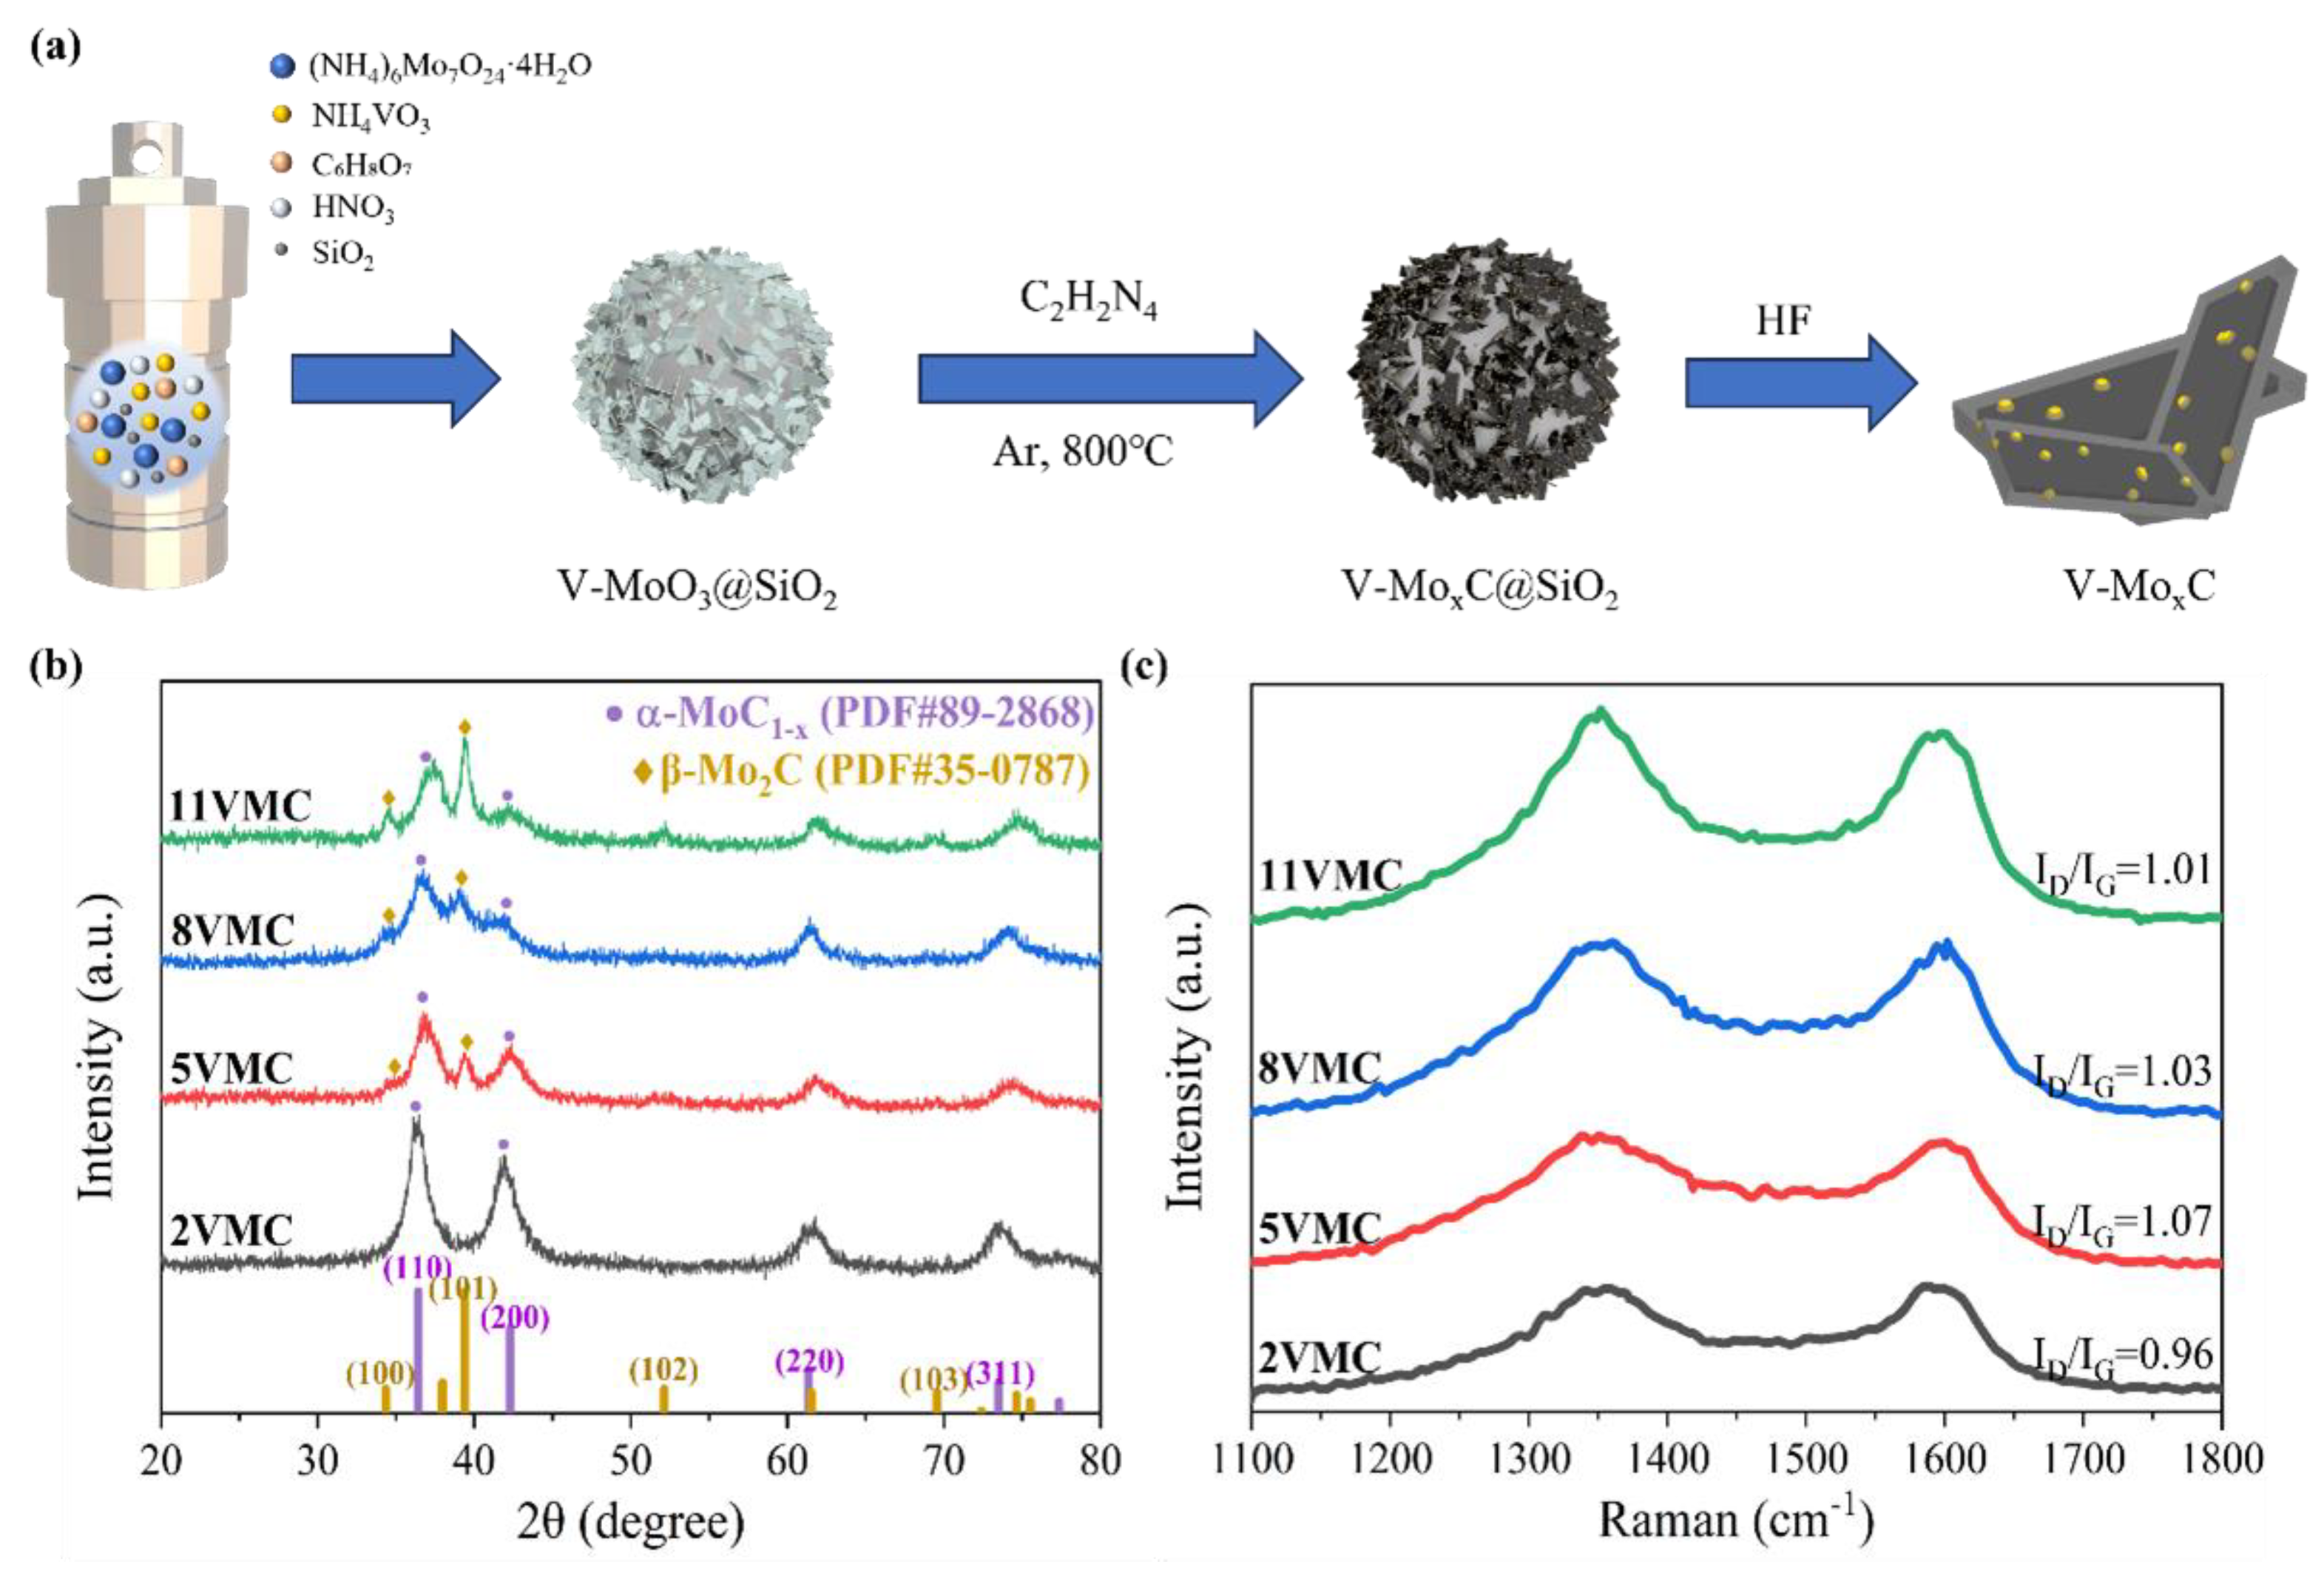
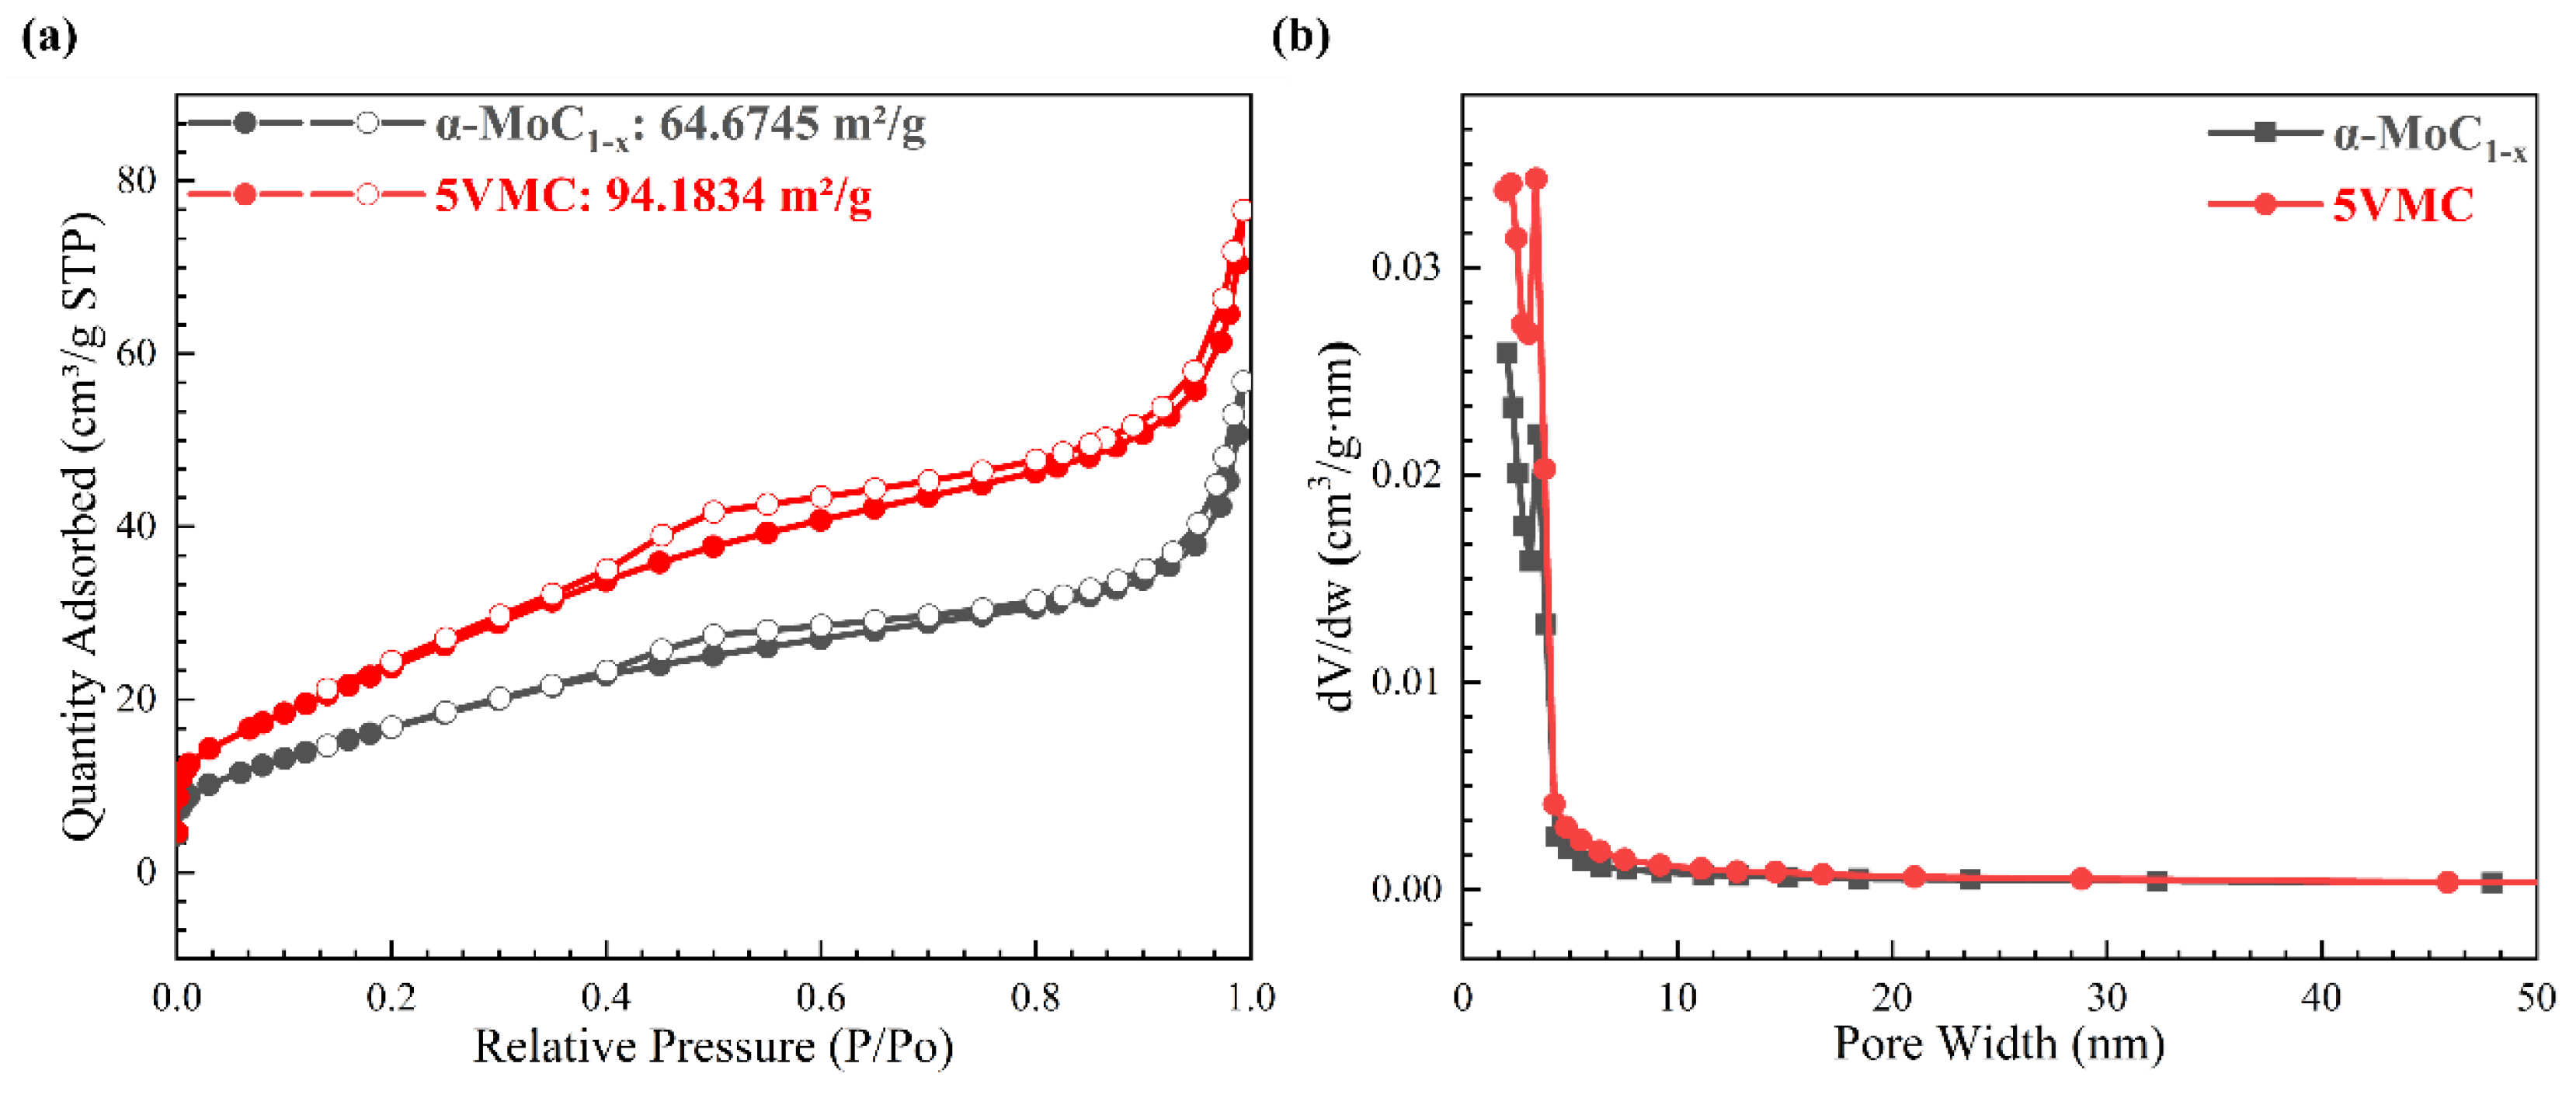
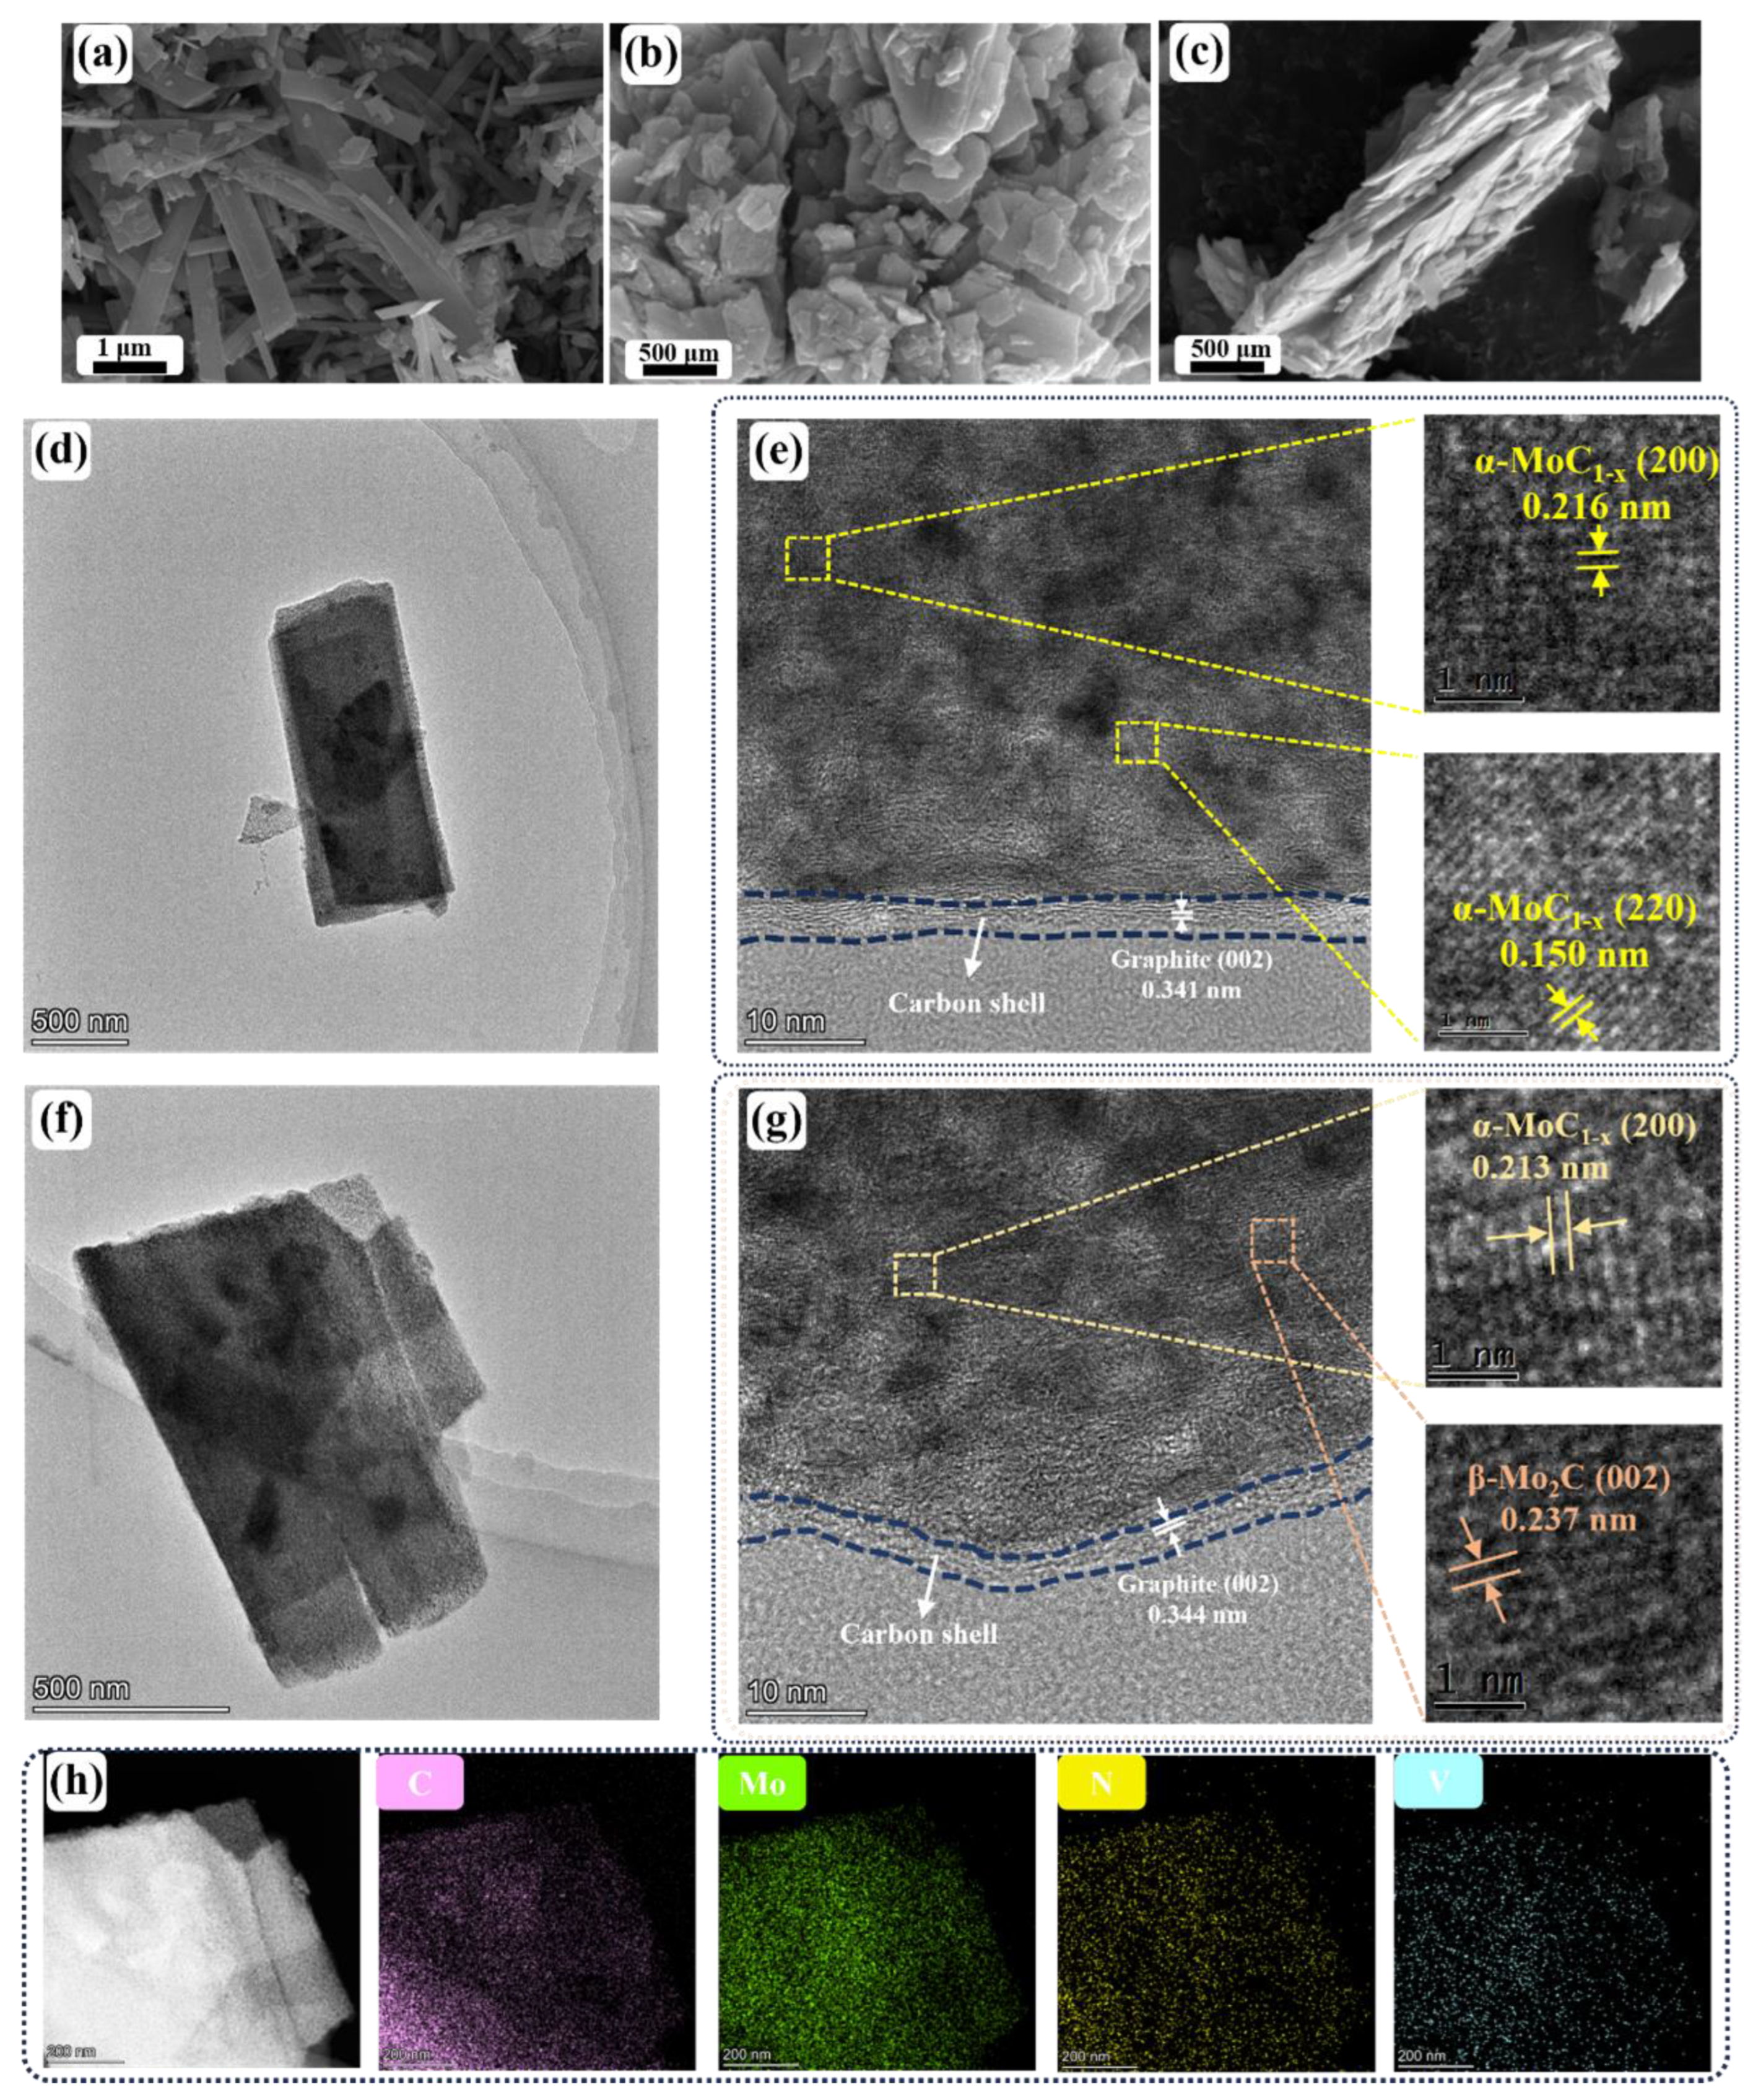
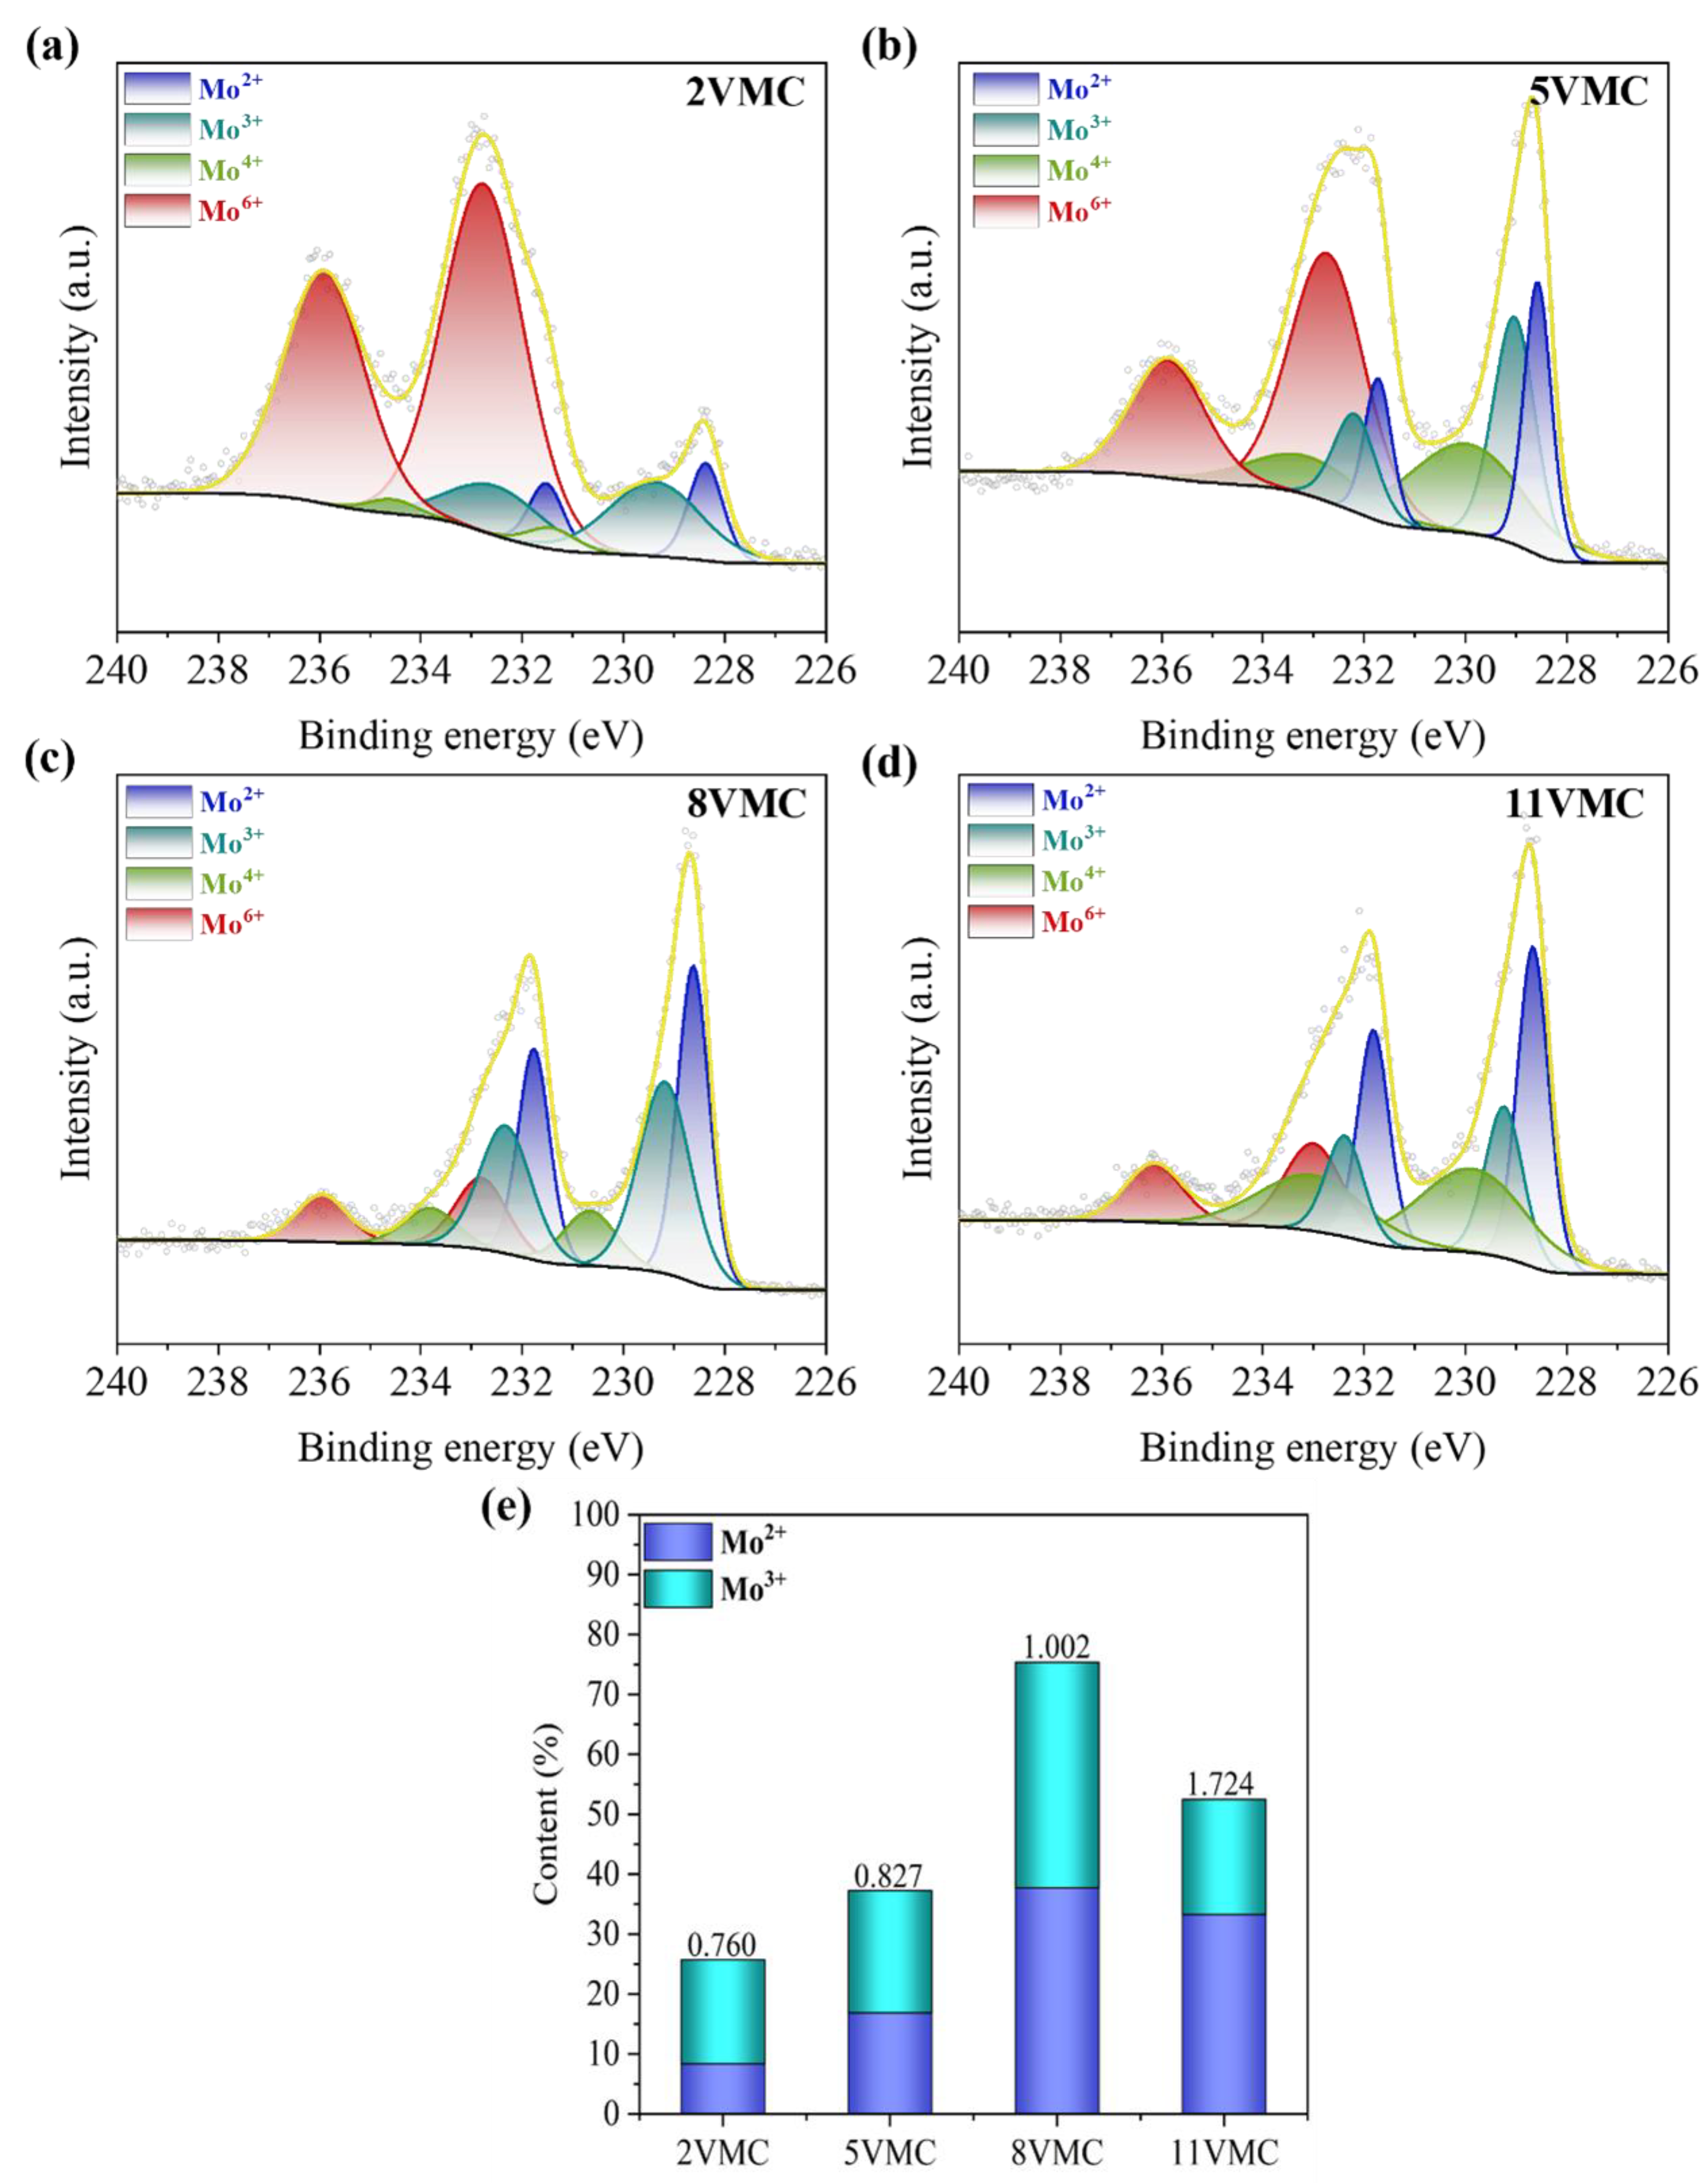
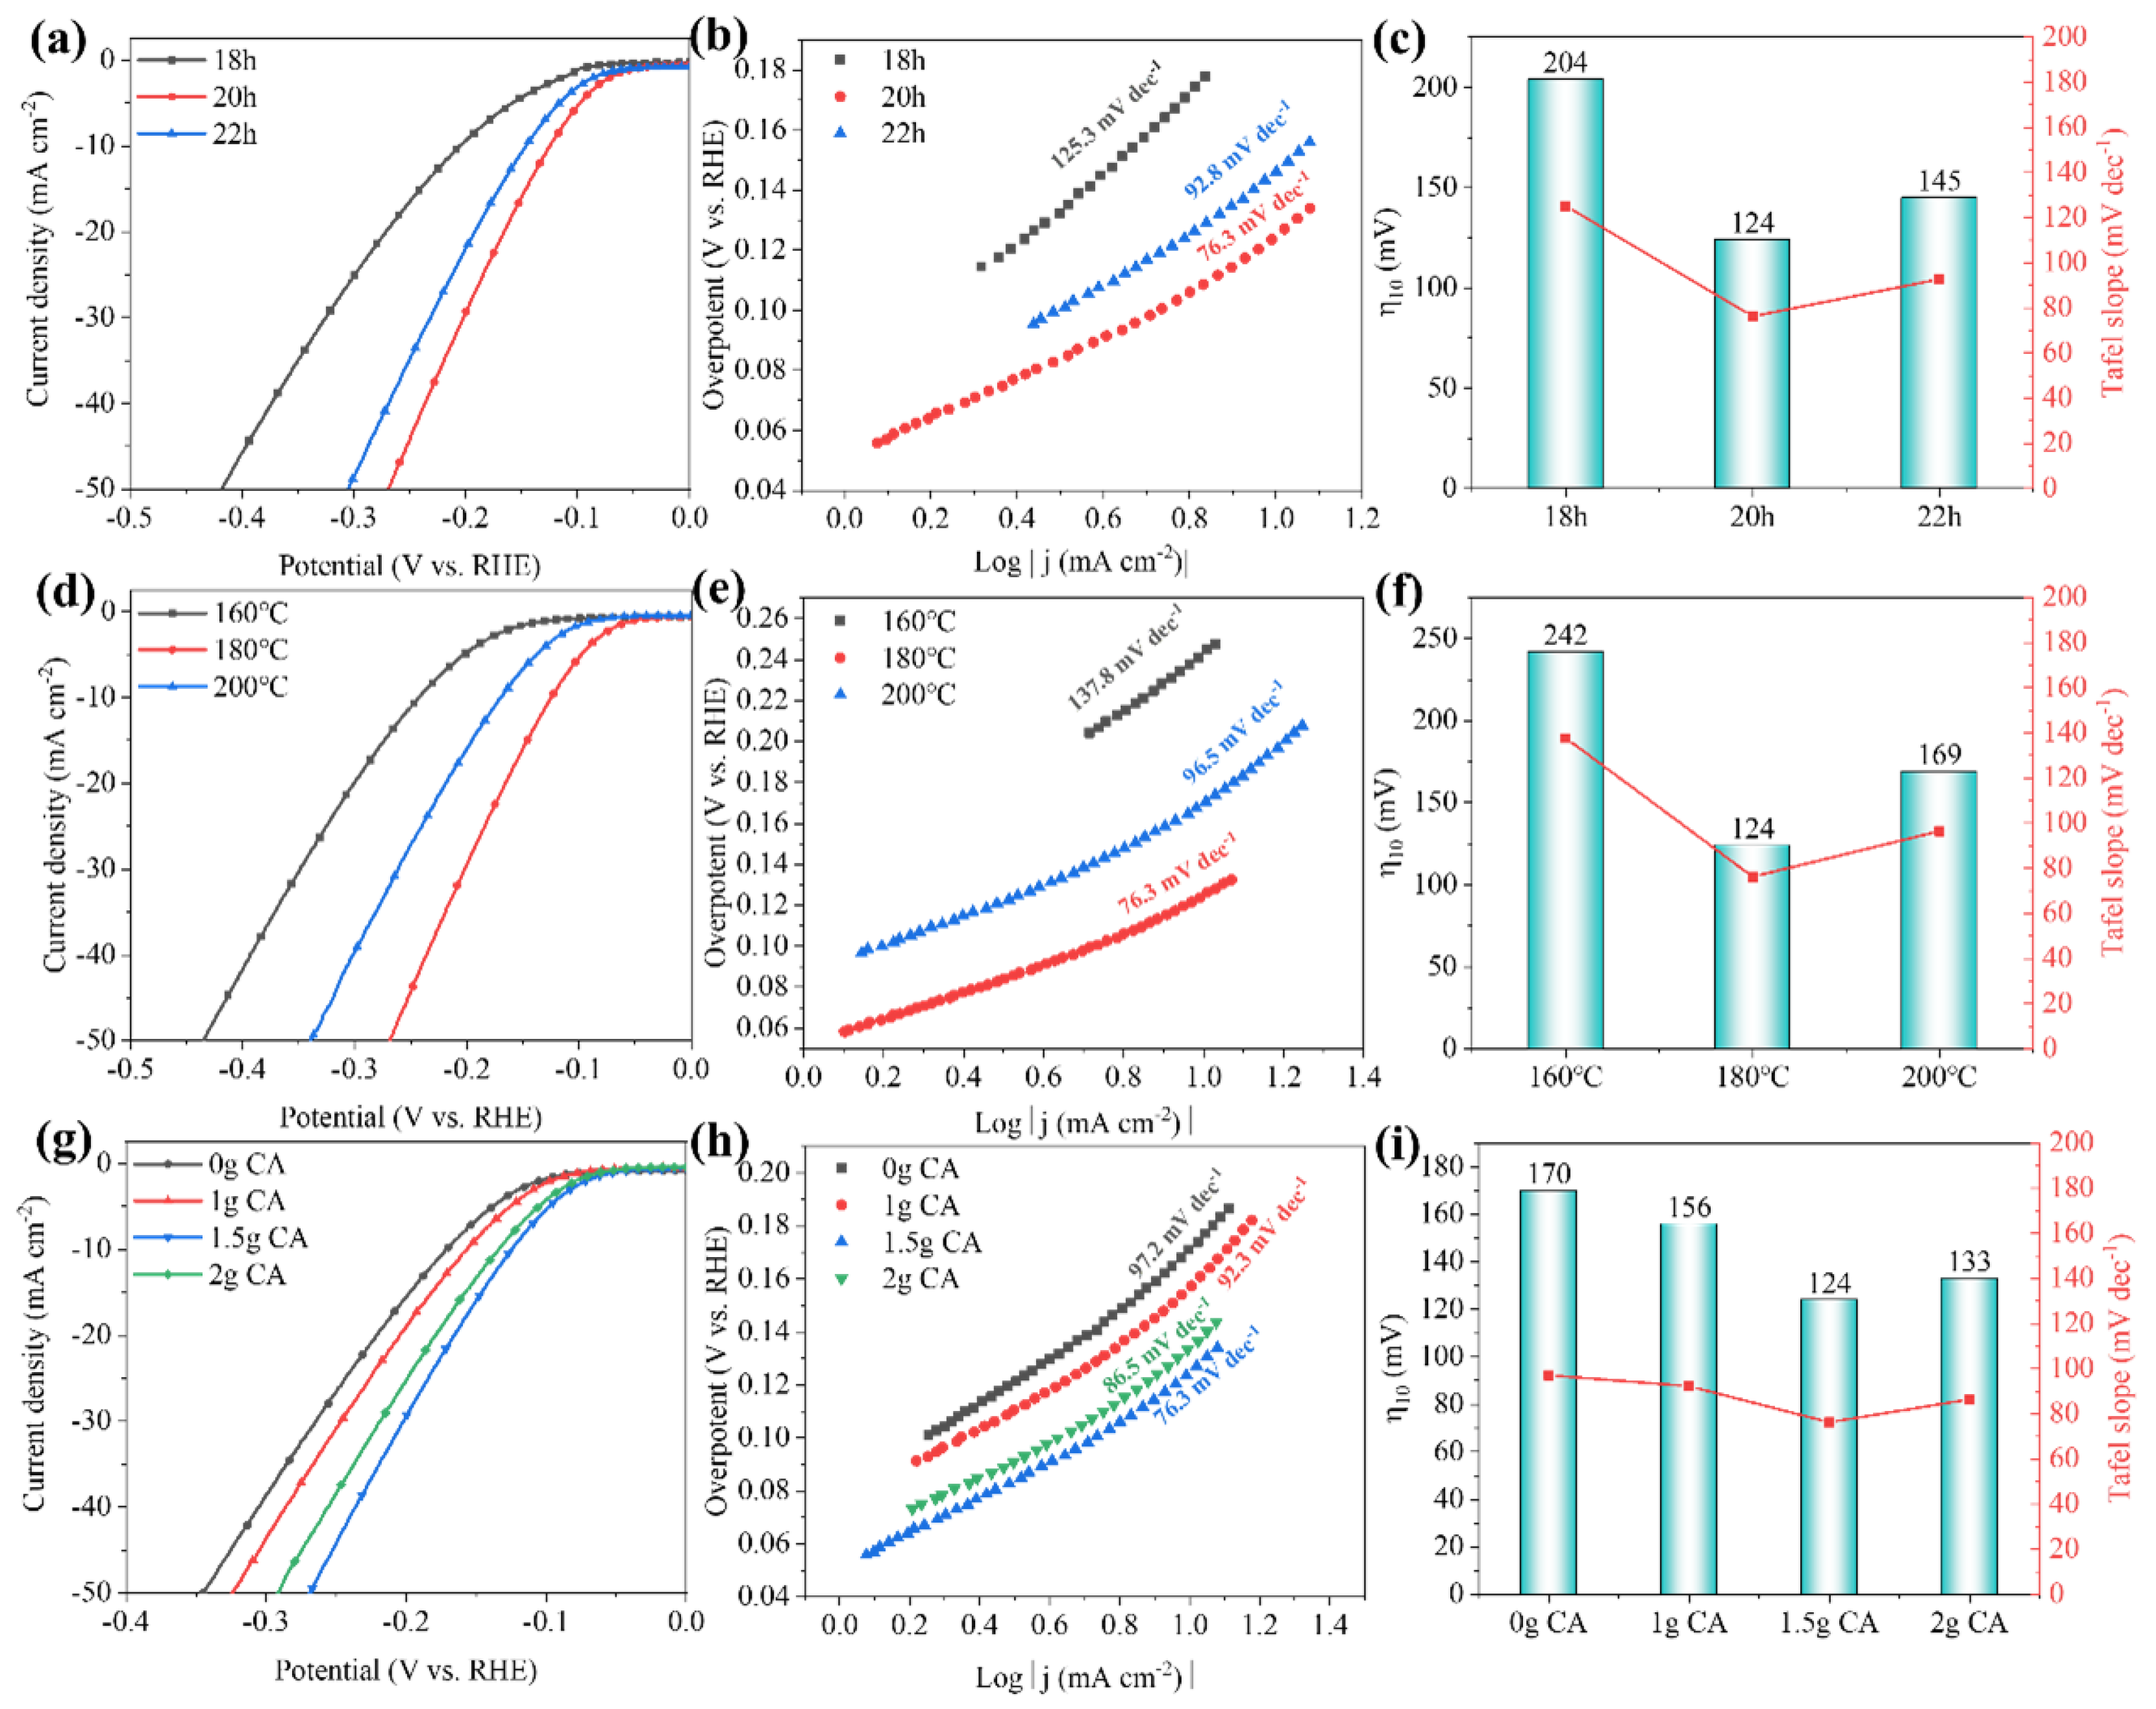
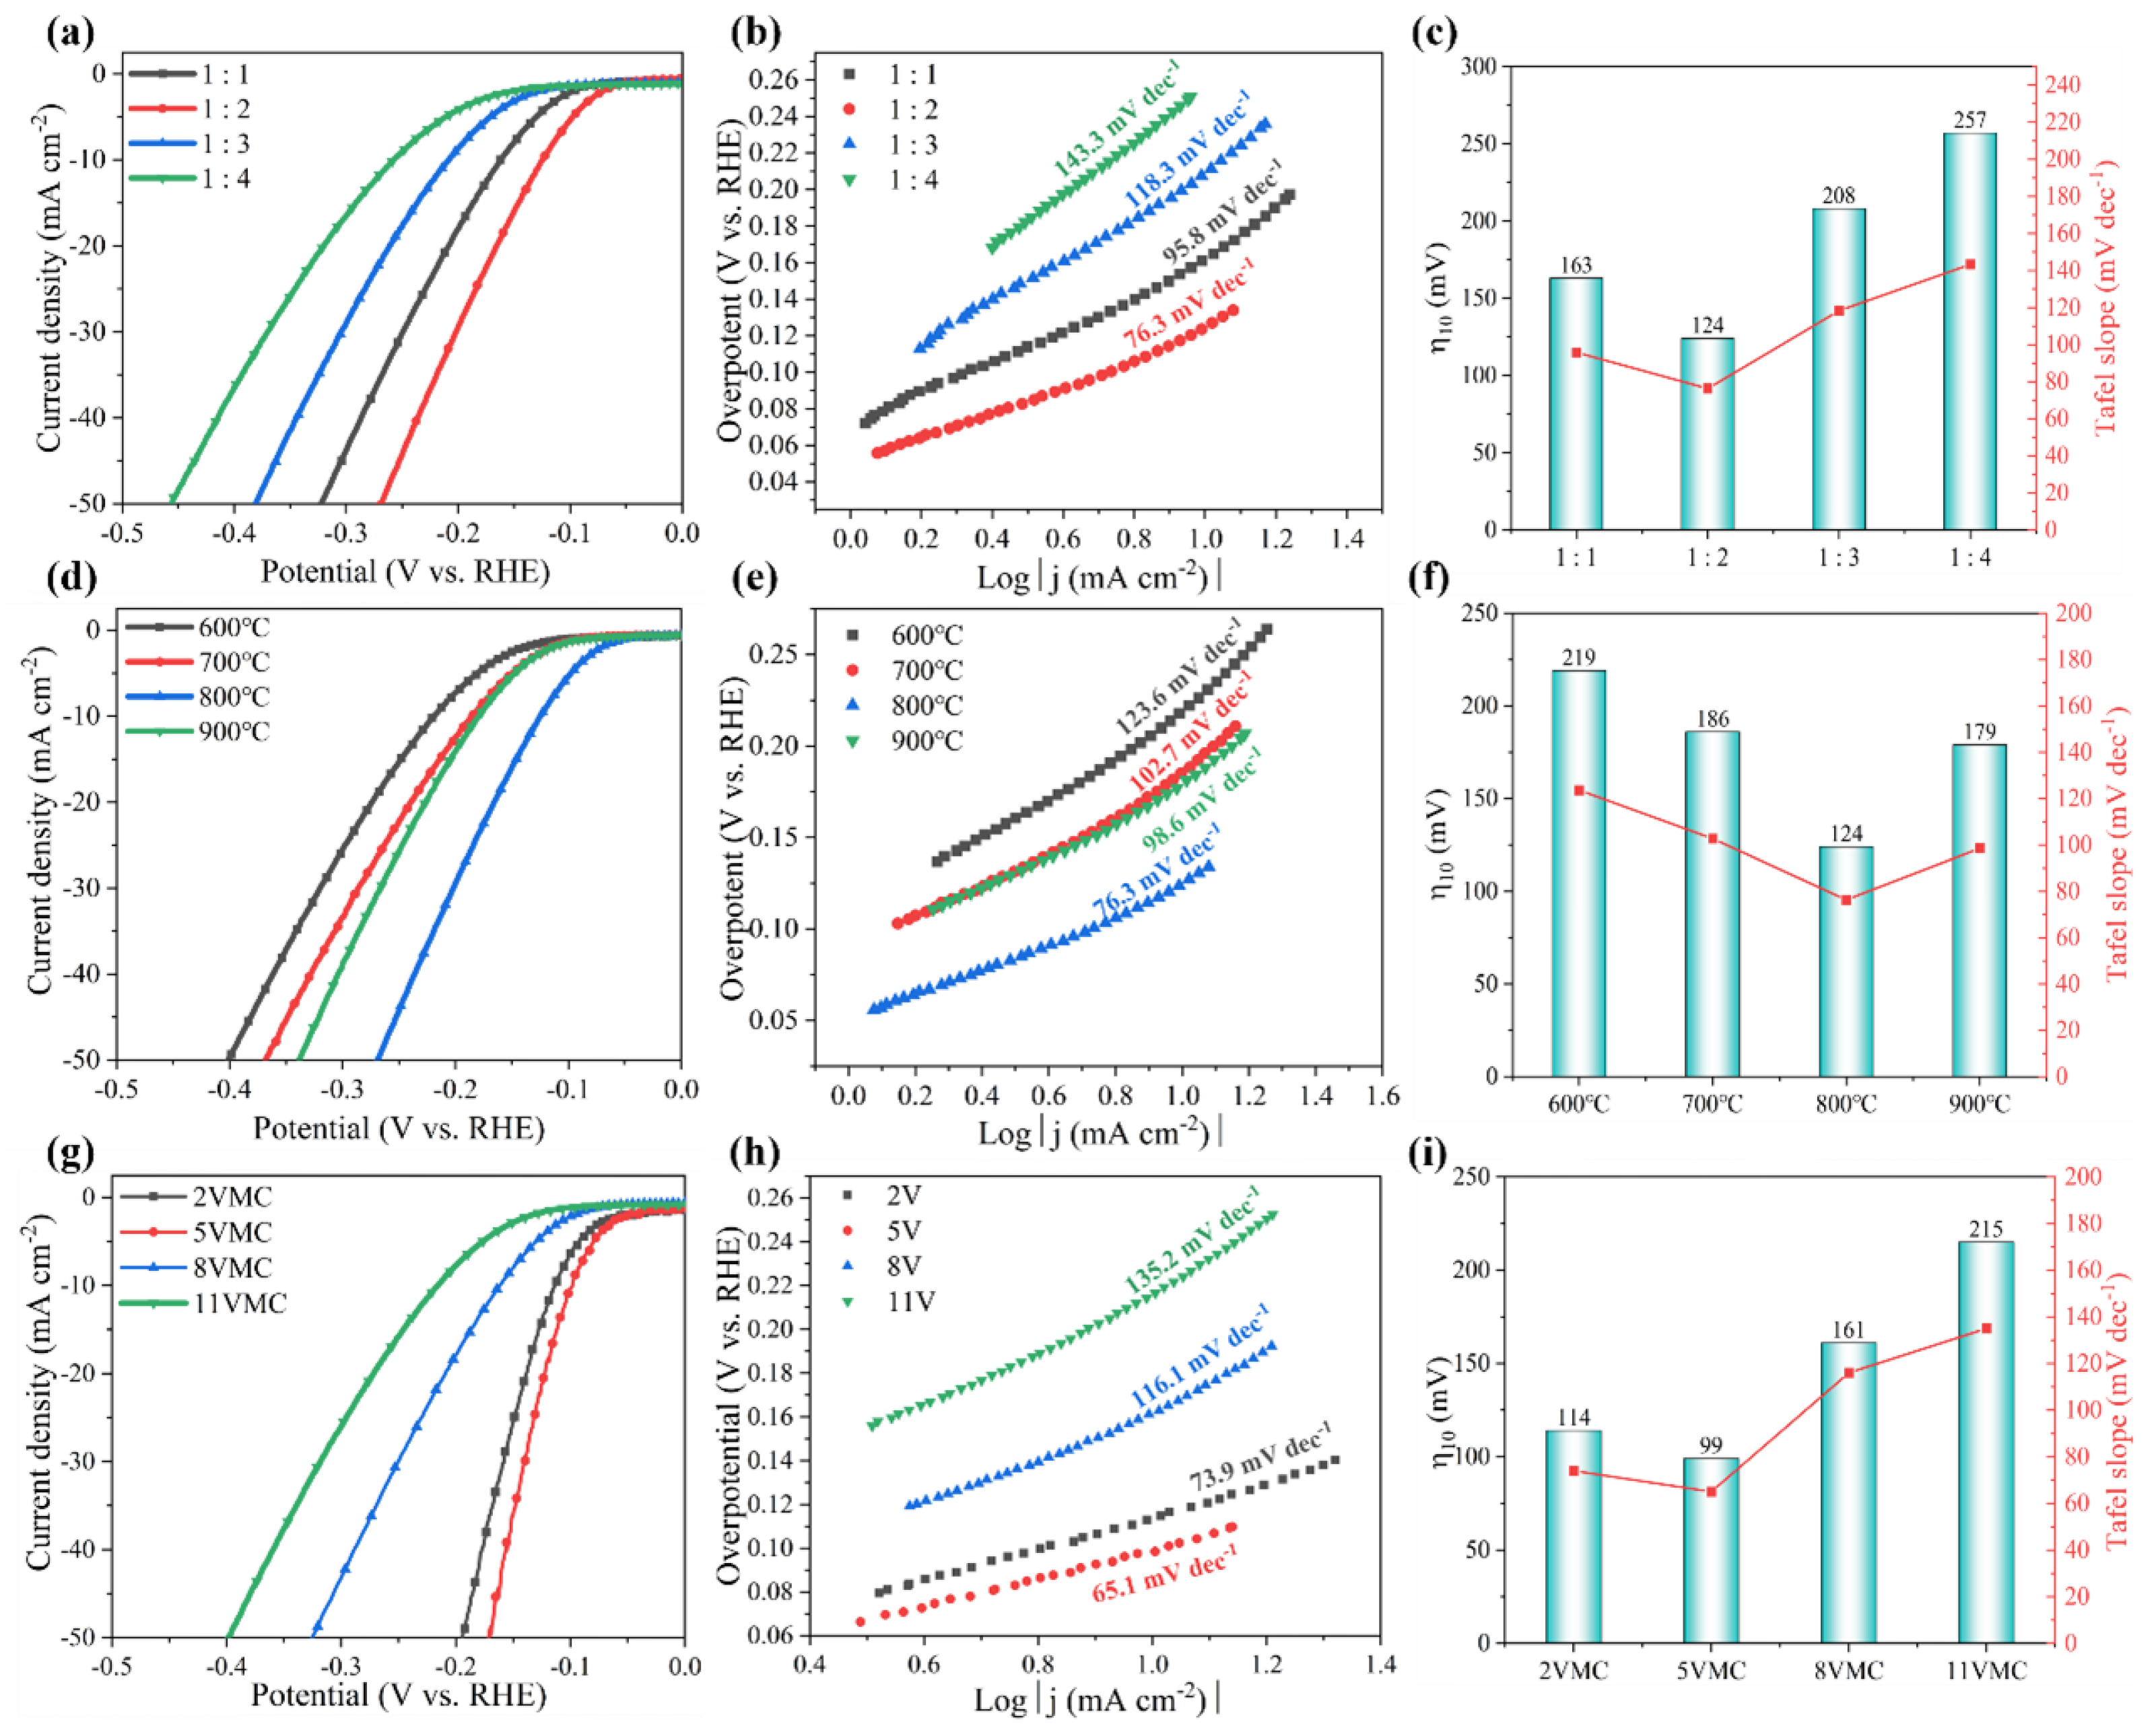
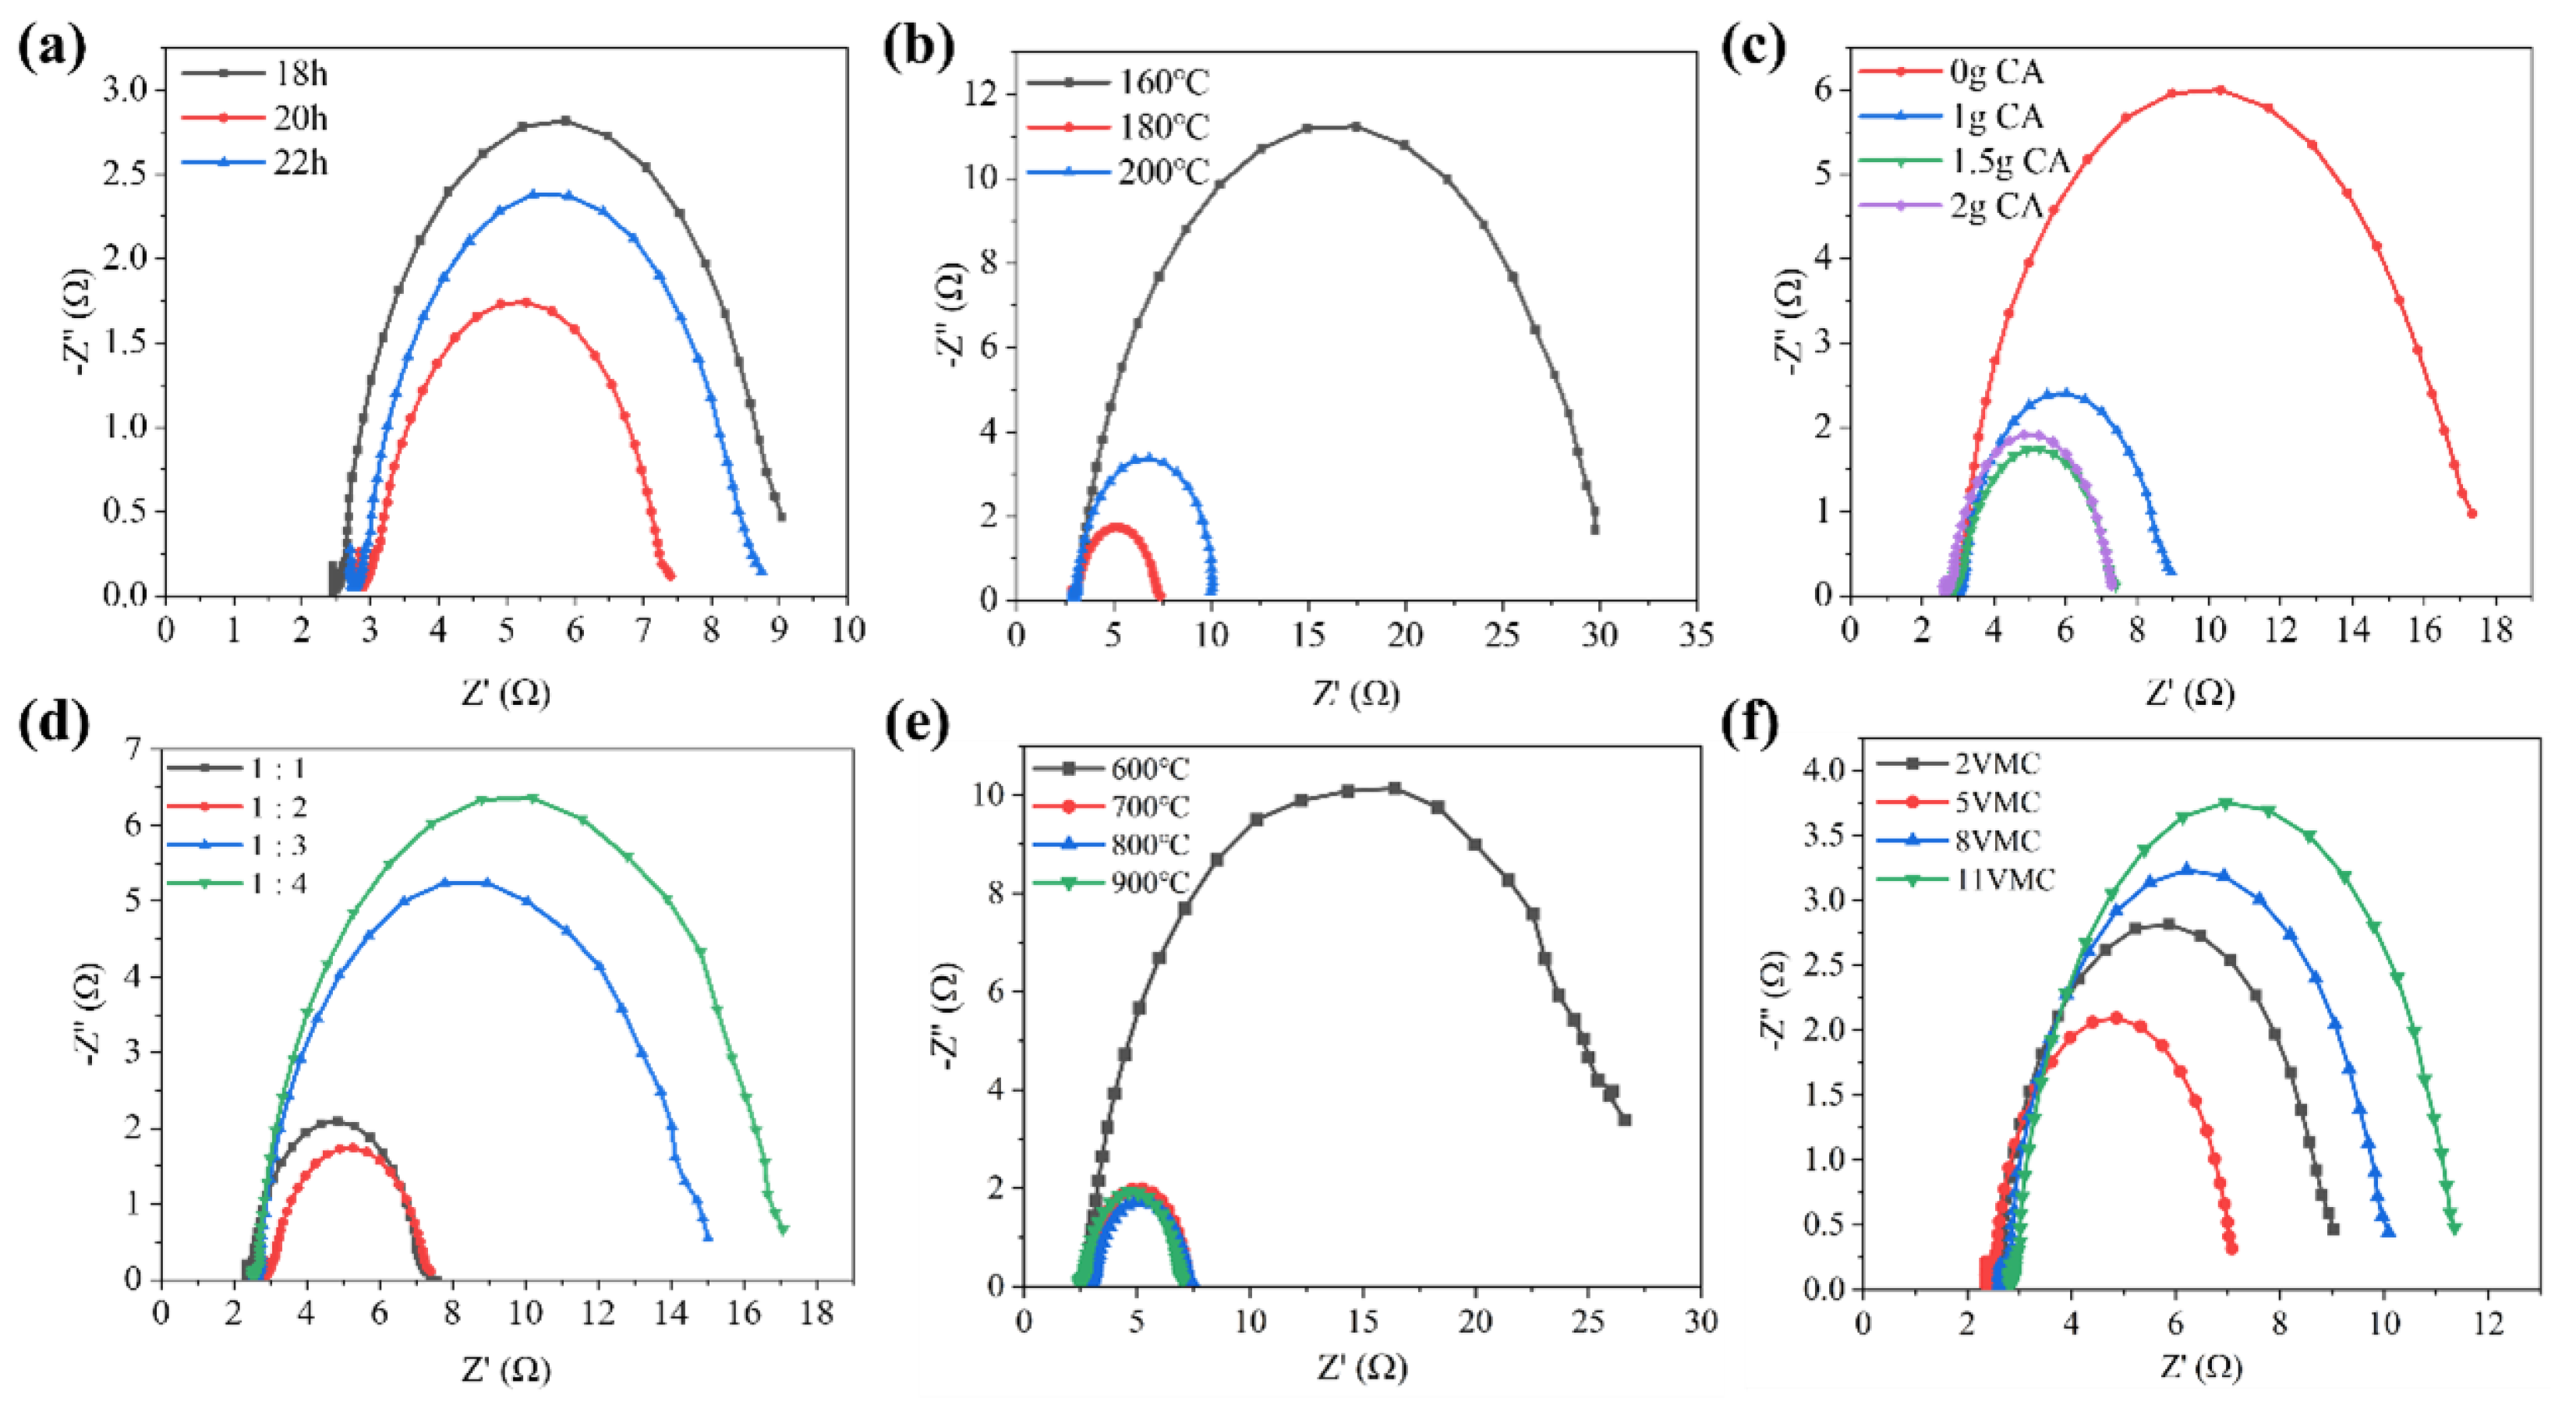
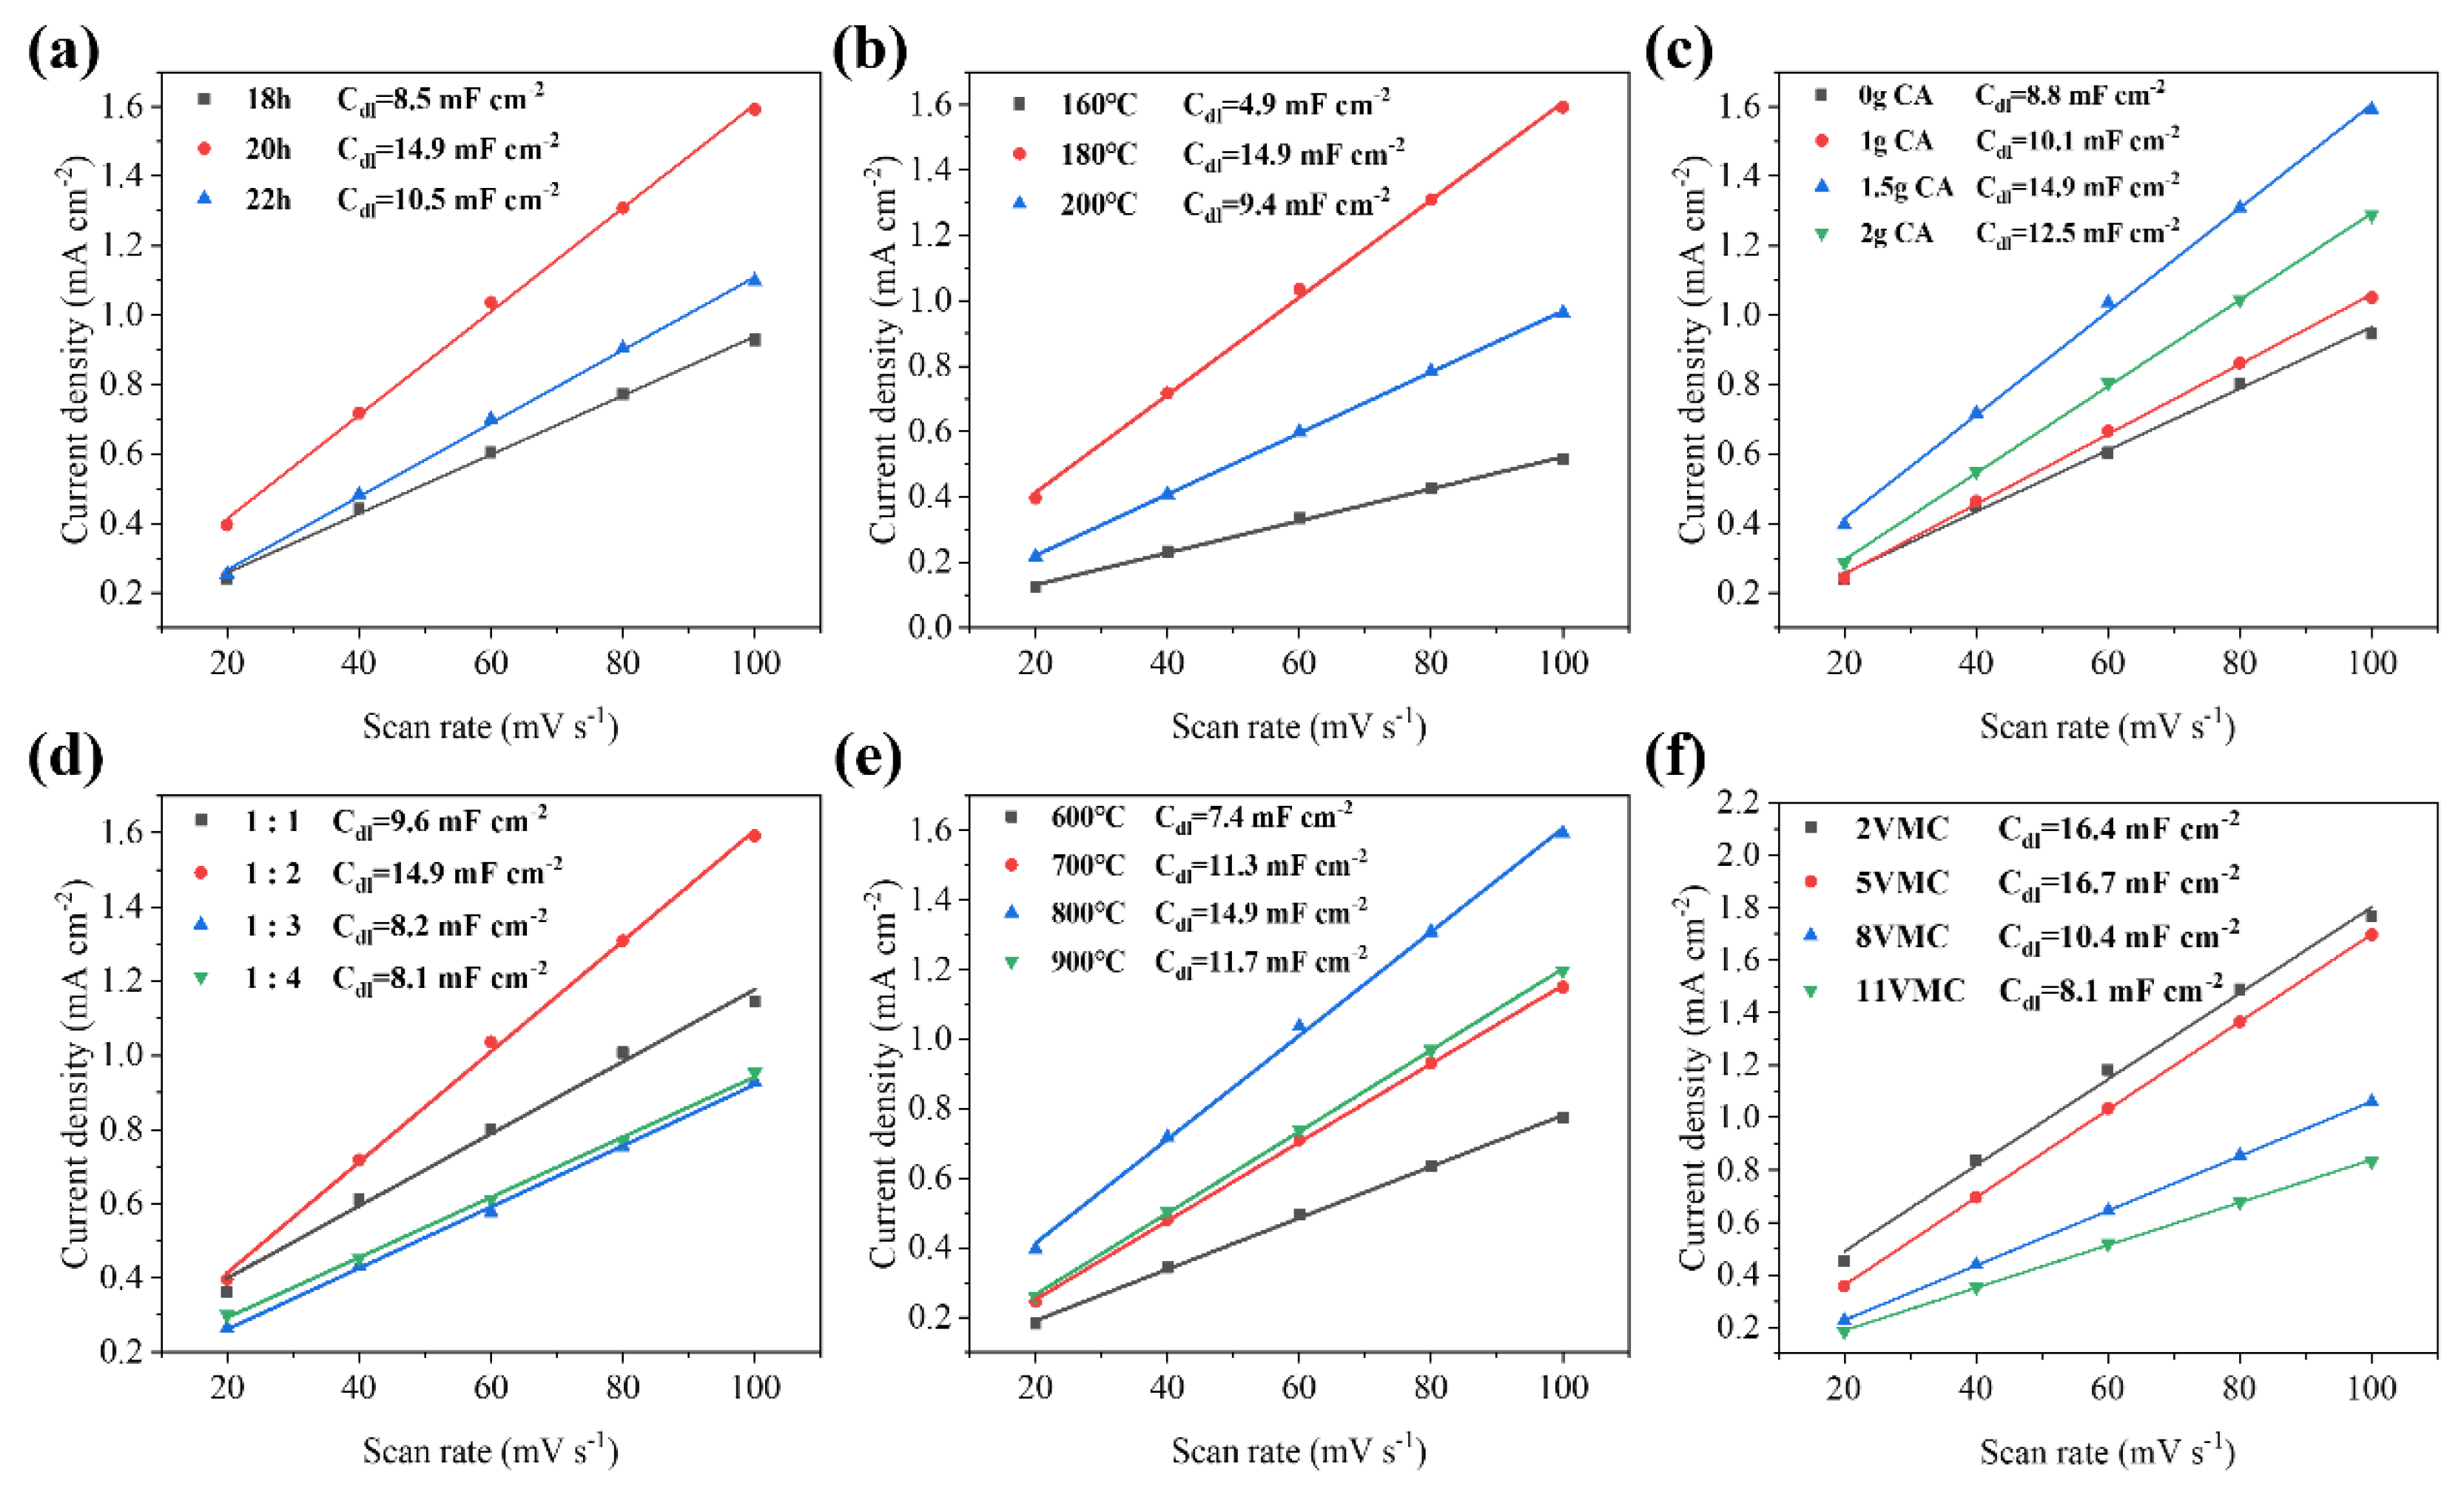
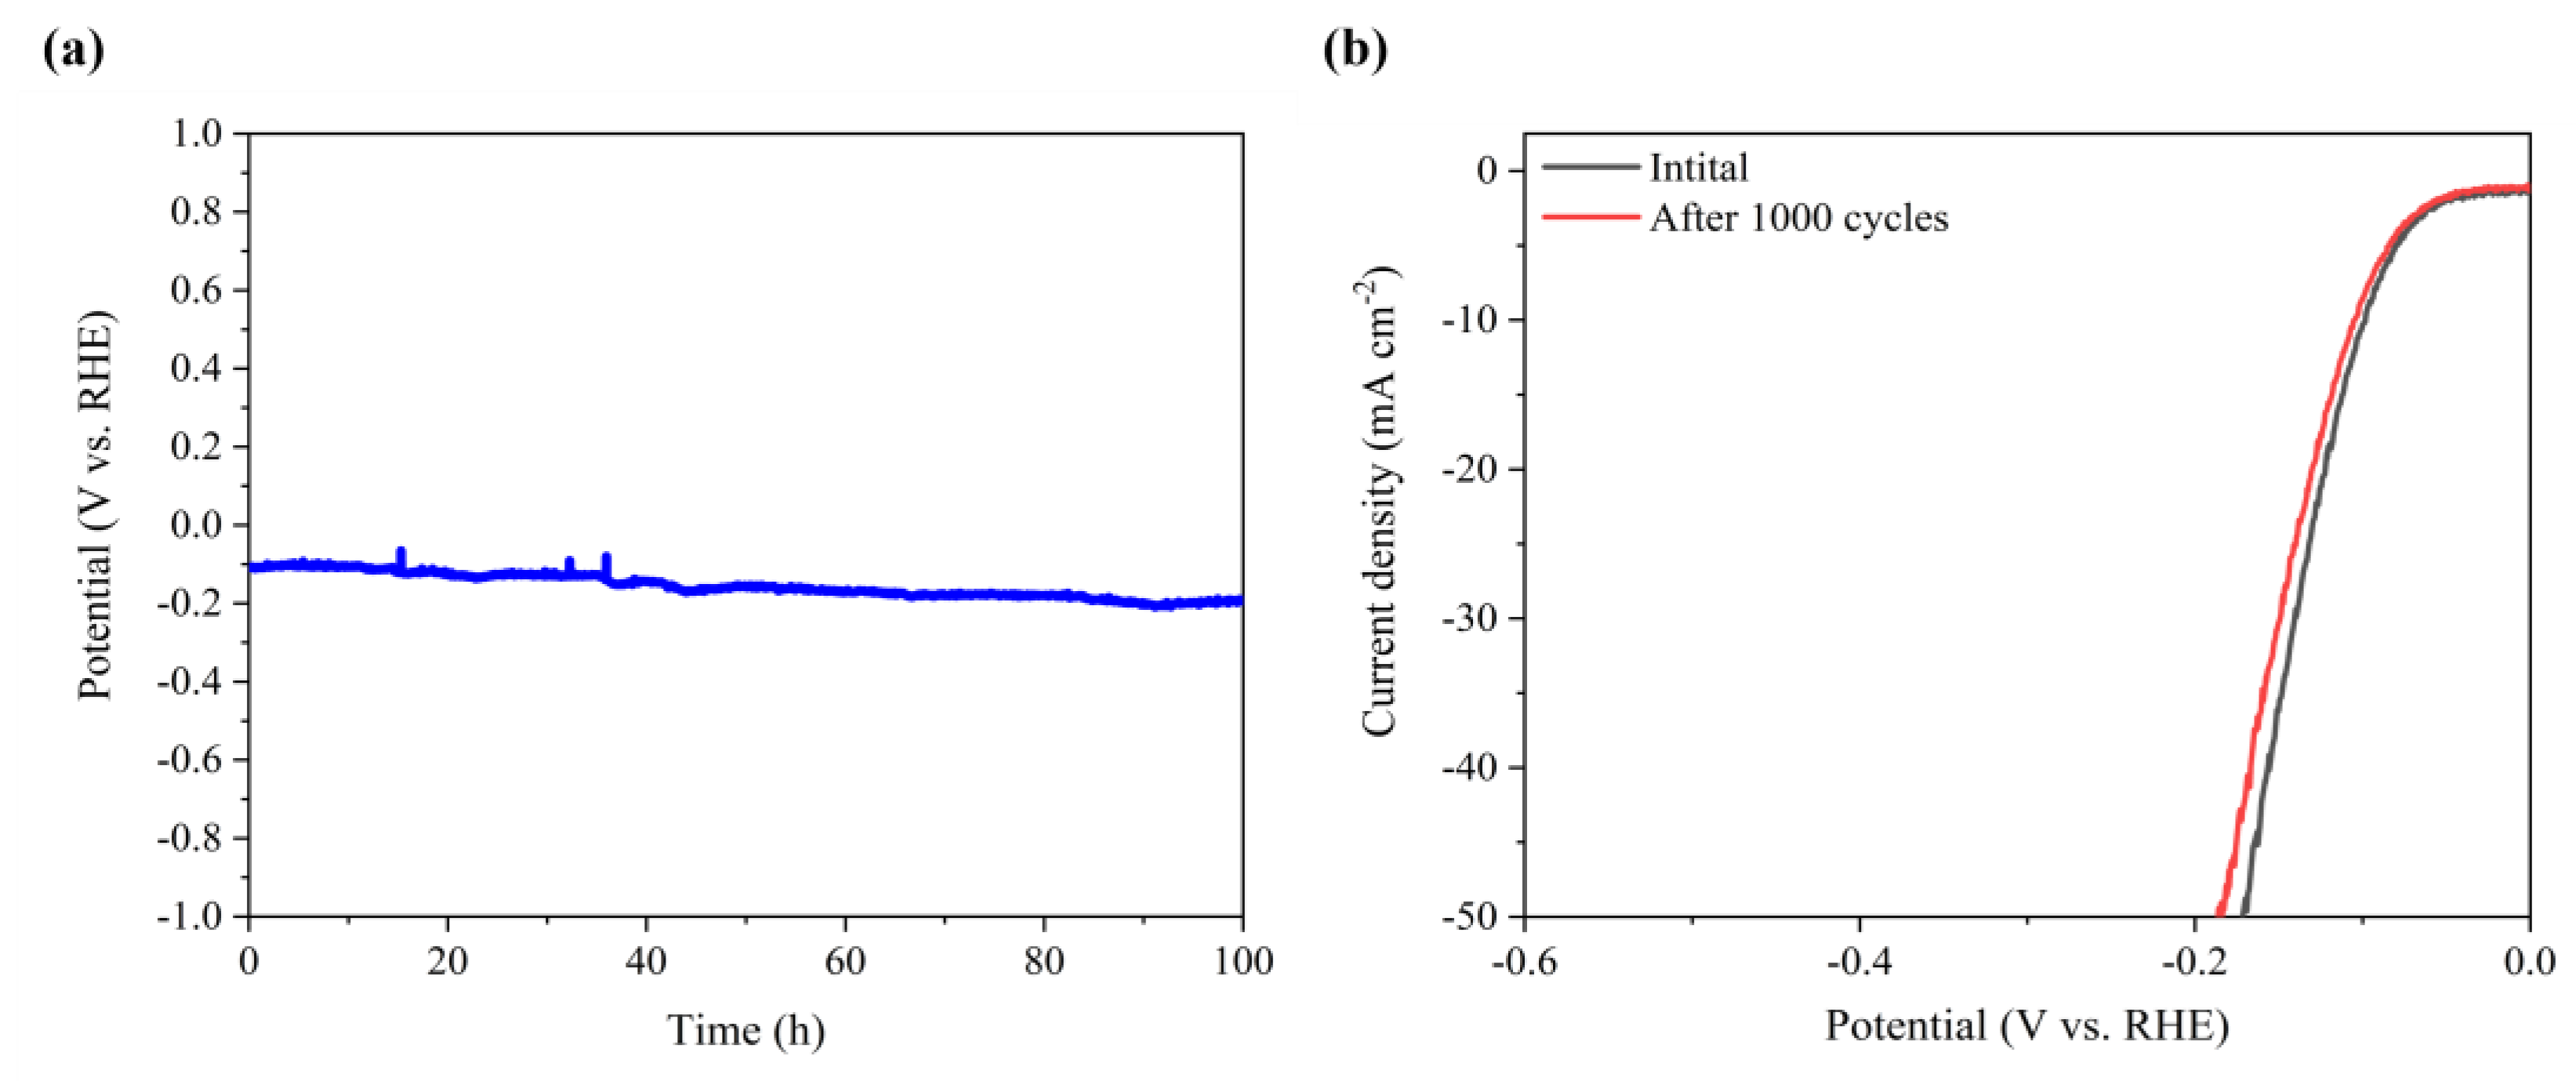
Efficient and low-cost electrocatalysts play a crucial role in hydrogen production through electrolysis of water. Molybdenum (Mo) carbide with a similar electronic structure to Pt was selected, both α-MoC1−x and α-MoC1−x/β-Mo2C electrocatalysts were successfully fabricated for electrochemical hydrogen evolution. A continuous optimization of the hydrothermal and carbonization conditions was carried out for the preparation of α-MoC1−x. The biphasic molybdenum carbide catalysts were further achieved via vanadium doping with a phase transition of molybdenum carbide from α to β, which increases the specific surface area of the electrocatalyst. It was found that the V-MoxC catalyst obtained at a Mo/V molar ratio of 100:5 exhibited the best hydrogen production performance, with a β to α phase ratio of 0.827. The overpotential of V-MoxC at η10 decreased to 99 mV, and the Tafel slope reached 65.1 mV dec−1, indicating a significant improvement in performance compared to undoped samples. Excellent stability was obtained of the as-prepared electrocatalyst for water splitting over 100 h at a current density of 10 mA cm−2.

Keywords: 
;  ;  ;  

1. Introduction

With the rapid advancement of society, the global demand for energy has surged. Currently, non-renewable energy sources such as oil, coal, and natural gas still dominate the energy landscape. However, their excessive use has led to growing concerns over energy shortages and environmental pollution [1,2,3], resulting in an urgent need to develop clean and sustainable alternatives [4]. Hydrogen energy has attracted increasing attention due to its zero emissions, recyclability, and high energy density [5]. The water electrolysis is considered one of the most promising methods for green hydrogen generation due to its environmental friendliness and renewability. Water electrolysis involves two half-reactions: oxygen evolution reaction (OER) at the anode and hydrogen evolution reaction (HER) at the cathode [6,7]. Platinum exhibits the highest catalytic performance for HER among noble metals, with low Tafel slopes and minimal overpotentials [8]. However, its high cost, scarcity, and poor stability under harsh conditions limit large-scale applications. Molybdenum (Mo), as one of the abundant transition metals on Earth, has been widely applied due to its excellent physicochemical properties [9]. Mo-based materials have been extensively studied in the field of energy conversion, including molybdenum oxides, molybdenum disulfide, and molybdenum carbides [10,11,12]. Among them, molybdenum carbide is considered an effective non-noble metal catalyst due to its Pt-like d-band electron density, high electrical conductivity and stability. Kitchin et al. found that when molybdenum combines with carbon to form molybdenum carbide, the surface d-band becomes broader than that of Mo, showing new bonding characteristics [13]. Li et al. developed novel Mo2C NTs via an organic-inorganic hybrid approach, and discovered their exceptional electrocatalytic performance for hydrogen evolution under alkaline conditions [14]. Yu et al. prepared N-MoxC/CoP-0.5 by decorating CoP with N-MoxC, which exhibits excellent electrocatalytic activity for the hydrogen evolution reaction (HER). The N-MoxC modification preserves CoP's fast charge transfer kinetics while expanding the active surface area, providing abundant interfaces and active sites for HER [15].To date, various crystal phases of molybdenum carbide have been extensively investigated, including face-centered cubic α-MoC1−x, simple hexagonal γ-MoC, and hexagonal close-packed β-Mo2C. Differences in atomic stacking and surface energy among these phases result in distinct electrochemical properties [16,17].
Initially regarded as a support material for Pt, molybdenum carbide was later found to possess intrinsic HER activity [18]. In 2012, Hu et al. demonstrated that commercial β-Mo2C exhibits excellent HER performance in both acidic and alkaline media [19]. Density functional theory (DFT) calculations revealed that the overlap between Mo d-orbitals and C p-orbitals leads to a broadened d-band, contributing to its Pt-like electronic structure and high catalytic activity [13]. Wan et al. synthesized four different phases of molybdenum carbide and investigated their crystal structures and HER performance [20]. They found a strong correlation between the HER activity and the surface electronic configurations of the different phases. The HER performance followed the order: α-MoC1−x < η-MoC < γ-MoC < β-Mo2C. Numerous theoretical and experimental studies have also confirmed that the HER activity of molybdenum carbide, similar to that of tungsten carbides, is strongly dependent on its crystal phase [21]. Although Mo-based carbides have been extensively studied as HER catalysts, their activity and stability still fall short of industrial standards.
To achieve this, researchers have employed strategies such as heteroatom doping, phase engineering, and heterostructure construction to enhance intrinsic activity. Yu et al. investigated the activity of Mo2C doped with various transition metals [22]. Both DFT calculations and electrochemical experiments demonstrated that the introduction of transition metals significantly alters the hydrogen adsorption energy and catalytic activity of Mo2C. The synergistic effects between different phases result in much higher catalytic performance for multiphase catalysts compared to their single-phase counterparts [23]. Chen et al. successfully induced a phase transition from β-Mo2C to α-MoC1−x through boron doping, with the amount of α-MoC1−x increasing as the B content rose [24]. The formation of a β-Mo2C/α-MoC1−x heterostructure led to the exposure of more active sites, enhancing the catalytic performance.
Inspired by these findings, this work first investigated the optimal preparation conditions for α-MoC1−x and subsequently employed ammonium metavanadate as the vanadium source. By precisely tuning the vanadium content, a series of V-MoxC samples with varying compositions were obtained. We systematically examined the effects of vanadium doping on crystal structure, morphology, electronic properties, and HER performance. The results demonstrate that vanadium can effectively induce the transformation of α-MoC1−x into biphasic α-MoC1−x/β-Mo2C materials. This study provides an effective strategy for designing high-performance HER catalysts through controlled phase engineering.

2. Results and Discussion

A study on the structure of the as prepared α-MoC1−x electrocatalyst under different hydrothermal conditions was conducted using XRD and Raman spectroscopy, as shown in Figure 1(b-g). The XRD patterns of the as-prepared electrocatalyst in Figure 1(b, d, f) exhibit a cubic α-MoC1−x crystal phase [25], the specific diffraction peaks at 2θ of 36.5°, 42.3°, 61.7°, and 73.8°, which assigned to the (111), (200), (220), and (311) crystal planes of α-MoC1−x, respectively. The full width at half maximum (FWHM) of the diffraction peaks for α-MoC1−x prepared under different conditions varies slightly, indicating that the crystallite sizes are approximately similar. It was found that the highest crystallinity of α-MoC1−x was achieved under hydrothermal conditions using 1.5 g of citric acid at 180 °C for 20 h. The molecular structure of the as-prepared α-MoC1−x electrocatalysts obtained under different hydrothermal conditions were investigated by Raman spectra, shown in Figure 1(c, e, g). The peaks at approximately 1349 cm−1 and 1593 cm−1 correspond to the D and G bands of carbon materials, respectively [26]. The intensity of the D bands is related to the defect density in the material, while the G bands represents the graphitic structure, corresponding to the vibration of sp2-hybridized carbon atoms, reflecting the degree of graphitization and lattice integrity. A higher ID/IG ratio typically indicates a greater concentration of structural defects and lower graphitization, whereas a lower ratio suggests fewer defects and higher graphitization. Comparative analysis revealed that the sample prepared with 1.5 g of citric acid under hydrothermal conditions at 180 °C for 20 h exhibited both favorable stability and catalytic activity. Therefore, these parameters were established as the optimal conditions for synthesizing the α-MoC1−x precursor.
Moreover, the effect of the amount of carbon source (dicyandiamide, DCD) and the carbonization temperature during the carburization process was investigated. The phase composition and structural properties of the resulting products under different carbonization conditions were studied using XRD and Raman spectroscopy, shown in Figure 2. When the mass ratios of precursor to DCD were set at 1:1, 1:2, 1:3, and 1:4, the XRD patterns of all products exhibited diffraction peaks exclusively corresponding to α-MoC1−x, with no additional impurity phases detected. However, the amount of DCD significantly influenced the crystallinity and crystallite size of the material, as evidenced by variations in peak intensity and full width at half maximum (FWHM) in the XRD patterns. As the DCD content increased, the peak intensity initially increased and then gradually decreased, reaching its maximum at a precursor-to-DCD ratio of 1:2. Meanwhile, the FWHM progressively broadened with higher DCD loading, indicating a reduction in crystallite size (Figure 2a).
In contrast, the carbonization temperature had a more pronounced impact on the material's phase composition and structure. As shown in Figure 2c, the samples carbonized at 600 °C, 700 °C, and 800 °C all retained the characteristic peaks of α-MoC1−x. However, when the temperature reached 900 °C, partial decomposition occurred, leading to the formation of β-Mo2C. At 600 °C, the material exhibited poor crystallinity, likely due to insufficient carbonization. The Raman spectra (Figure 2(b-d)) further revealed structural changes under different carbonization conditions. The results indicate that the sample prepared with a precursor-to-dicyandiamide mass ratio of 1:2 and carbonized at 800 °C exhibited the highest ID/IG ratio, suggesting an optimal balance between defect density and graphitic ordering. The slight decrease in the ID/IG ratio at higher temperatures may be attributed to excessive thermal energy promoting carbon atom rearrangement, thereby reducing structural disorder. Therefore, these conditions (1:2 mass ratio, 800 °C) were selected as the optimal carbonization parameters for subsequent material synthesis, ensuring a favorable defect-rich carbon structure while maintaining phase purity and crystallinity.
The V-doping was illustrated in Figure 3a for the preparation of V-MoxC. From Figure 3b the XRD patterns of V-MoxC samples prepared under identical conditions with varying vanadium content. No distinct V-related peaks are observed in any sample, indicating high dispersion of vanadium within the material [27]. At a Mo/V molar ratio of 100:2, only characteristic peaks of α-MoC1−x appear at 36.4°, 42.0°, 61.7°, and 73.7°, corresponding to the (111), (200), (220), and (311) planes, respectively, suggesting that the α-to-β phase transition has not occurred due to insufficient V content. As the V content increases to a Mo/V ratio of 100:5, the transition from α-MoC1−x to β-Mo2C is initiated, evidenced by the emergence of (100) and (101) peaks at 34.4° and 39.3°, respectively. These β-Mo2C peaks intensify with further V addition, and at a ratio of 100:11, additional peaks at 52.0° and 69.5° corresponding to the (102) and (103) planes appear, indicating enhanced phase transformation from α-MoC1−x to β-Mo2C. In Figure 3c, the Raman spectra show that the sample with the lowest V content (Mo/V = 100:2) has the lowest ID/IG ratio (0.96), while others range from 1.01 to 1.07, indicating more disordered carbon. The low ID/IG value at low V content suggests a single-phase α-MoC1−x structure with a relatively smooth and graphitized carbon surface. In contrast, the formation of α-MoC1−x/β-Mo2C biphasic structure at higher V content provides rougher surfaces, promoting defect-rich carbon layers and higher ID/IG ratios.
Figure 4(a-b) compares the specific surface area and pore size distribution of V-MoxC (Mo/V = 100:5) with pure α-MoC1−x. It should be noted that the α-MoC1−x material discussed here was synthesized under the previously determined optimal conditions. Between the remaining two samples, the V-doped 5VMC exhibits a substantial increase in specific surface area (94.18 m2 g−1) compared to pure α-MoC1−x (64.67 m2 g−1), due to the formation of a biphasic structure induced by vanadium doping, which enhances porosity and surface area. The pore size distribution (Figure 4b) reveals that all three materials exhibit mesoporous characteristics, with average pore diameters of 5.30 nm for α-MoC1−x, and 4.68 nm for 5VMC, indicating similar pore structures despite differences in specific surface area.
The morphologyies of the materials were characterized using SEM and TEM, as illustrated in Figure 5(a-g). From the SEM (Figure 5a) and TEM (Figure 5d) images, it can be observed that the α-MoC1−x retains the plate-like structure of its precursor with relatively uniform dimensions. This two-dimensional morphology facilitates the exposure of active sites, ensuring sufficient contact between the catalyst and electrolyte while enabling rapid release of hydrogen gas during the reaction. The HRTEM (Figure 5e) reveals distinct lattice fringes with spacings of 0.216 nm and 0.15 nm, corresponding to the (200) and (220) crystal planes of α-MoC1−x, respectively. Additionally, the plate-like α-MoC1−x particles are coated with a thin carbon layer (about 4 nm), evidenced by the observed lattice spacing of 0.341 nm, which matches the (002) plane of graphitic carbon. This carbon layer may enhance the material's electronic conductivity and structural stability. Comprehensive characterization of the 5VMC sample by SEM and TEM is presented in Figure 5(b, c, f, g). The material retains the broken, thin, plate-like morphology of the precursor, as shown in Figure 5(b-c). The results of further analysis of the morphology of the material using TEM and HRTEM are shown in Figure 5(f-g). The lattice spacing of 2.13 nm and 2.37 nm in the HRTEM of Figure 5g belongs to the (200) crystal plane of α-MoC1−x and the (002) crystal plane of β-Mo2C, respectively, proving the existence of the two phases. The heterostructure formed between them can modulate the local electronic structure and Mo-H bond strength, enhancing HER kinetics [28]. About 3 nm carbon layer is also observed, which stabilizes the structure without hindering electron transfer. As clearly shown in Figure 5h, the material is composed of C, Mo, N, and V elements, confirming the successful doping of V.
The bonding states and quantitative chemical composition before and after vanadium doping were investigated using X-ray photoelectron spectroscopy (XPS), as shown in Figure 6. The Figure 6(a, d) displays the high-resolution XPS spectra of C 1s. The dominant peak at approximately 284.80 eV is attributed to the C-C bond, while the peaks at 283.63 eV, 286.31 eV, and 288.52 eV correspond to C-Mo, C-O/C-N, and C-C=O bonds, respectively [29]. The presence of the C-Mo bond confirms the successful synthesis of molybdenum carbide. The C-N bond indicates the effective doping of nitrogen atoms from the precursor dicyandiamide into the carbon layers, which enhances the catalyst's conductivity [30]. Additionally, nitrogen incorporation induces electron reorganization, activating adjacent carbon atoms and thereby promoting the hydrogen evolution reaction [31]. Figure 6b presents the high-resolution XPS spectrum of Mo 3d, where three pairs of peaks are assigned to Mo-C (228.67/231.82 eV), Mo-N (229.39/232.54 eV) formed between molybdenum and doped nitrogen, and Mo-O (232.80/235.95 eV) due to inevitable molybdenum oxidation [32]. In contrast, Figure 6e shows the high-resolution XPS spectrum of Mo 3d, where two pairs of diffraction peaks at 228.57 eV/231.72 eV and 229.03 eV/232.12 eV correspond to the 3d5/2 and 3d3/2 orbitals of Mo2+ and Mo3+, respectively. Mo2+ is present in β-Mo2C, while Mo3+ exists in α-MoC1−x [33], confirming the coexistence of dual phases. The high-resolution XPS spectrum of N 1s in Figure 6(c, f) can be deconvoluted into five peaks [34]. The diffraction peaks located near 394.98 eV, 397.33 eV, 398.06 eV, 399.45 eV, and 401.82 eV correspond to Mo 3p, Mo-N bond, pyridinic N, pyrrolic N, and graphitic N, respectively. The presence of the Mo-N bond indicates the bonding between N and Mo, which can prevent the dissolution of Mo in the electrolyte, thereby endowing the material with excellent cycling stability. In the high-resolution N 1s spectrum (Figure 6f), the deconvoluted peaks observed at 394.98 eV, 397.33 eV, 398.06 eV, 399.45 eV, and 401.82 eV are assigned to Mo 3p, Mo-N bond, pyridinic N, pyrrolic N, and graphitic N, respectively. The presence of the Mo-N bond confirms the chemical interaction between nitrogen and molybdenum, which effectively suppresses the dissolution of Mo species in the electrolyte and consequently enhances the structural stability of the material. Figure 6g displays the high-resolution XPS spectrum of V 2p, revealing two characteristic doublets corresponding to V3+ (514.29 eV/521.79 eV) and V4+ (516.17 eV/523.87 eV).
Detailed XPS analysis was conducted on the Mo element in four samples, 2VMC, 5VMC, 8VMC, and 11VMC, as shown in Figure 7(a-d). Previous studies have shown that Mo4+ and Mo6+ do not contribute significantly to HER activity [35]. Therefore, the study mainly focused on the two valence states of Mo2+ and Mo3+. Figure 7e shows the percentage of these two valence states and the Mo2+/Mo3+ ratio in the four samples. As mentioned above, Mo2+ is contributed by β-Mo2C, while Mo3+ is contributed by α- MoC1−x. Therefore, the change in the ratio of Mo2+/Mo3+ can reflect the change in the proportion of β-Mo2C and α-MoC1−x phases in the material. It is not difficult to see from Figure 7e that with the continuous increase of vanadium element, the Mo2+/Mo3+ ratio gradually increases, indicating that the amount of molybdenum carbide in the β phase continues to increase, which is consistent with the XRD results. Further evidence shows that vanadium can induce the transformation of molybdenum carbide from α phase to β phase, and the ratio of the two phases can be controlled by the amount of vanadium added.
Figure 8(a-i) shows the polarization curves, the Tafel slopes, and performance comparison of materials prepared under different hydrothermal conditions. As seen in Figure. 8(a, d, g), the overpotential at 10 mAcm−210) first decreases and then increases with prolonged hydrothermal time and elevated hydrothermal temperature. This trend is attributed to the poor crystallinity of the materials under shorter hydrothermal times and lower hydrothermal temperatures, which negatively affects their reactivity. As the hydrothermal time and temperature increase, the crystallinity of the resulting carbonized products improves, thereby enhancing the catalytic performance. However, when the hydrothermal time and temperature become excessively high, the defect density in the material decreases, leading to a reduction in the exposed active surface area and ultimately resulting in a decline in material performance. The effect of citric acid addition on the material performance exhibits a similar trend to that of hydrothermal temperature and time. To better understand the HER activity from a kinetic perspective, the Tafel slopes of the materials in Figure 8(b, e, h) were obtained from the corresponding polarization curves using the Tafel equation. Generally, a smaller Tafel slope indicates a lower overpotential as the current density increases, suggesting that the catalyst is more efficient in the HER process [36]. As shown in Figure 8(b, e, h), the sample prepared with 1.5 g citric acid addition, 20 h hydrothermal time, and 180 °C hydrothermal temperature exhibits the smallest Tafel slope of 76.3 mV dec−1, indicating fast HER kinetics governed by the Volmer-Heyrovsky process [37].
During in-situ carburization of materials, carbon sources such as dicyandiamide and melamine, which decompose thermally to release gases and can form a carbon layer encapsulating the material, thereby preserving its structural stability. However, studies have shown that for core-shell structures, an excessively thick shell layer may hinder electron penetration to the catalyst, consequently impeding the catalytic process [38]. Figure 9a clearly demonstrates that in the initial stage, the carbon layer on the material surface gradually forms as the amount of dicyandiamide (DCD) increases. When the mass ratio of precursor to DCD reaches 1:2, the thickness of the carbon layer becomes optimal. Further increasing the DCD content leads to excessive carbon layer thickness, which adversely affects the material's hydrogen evolution performance, causing a decline in catalytic activity with increasing DCD amount. As the carbonization temperature rises, the material's performance progressively improves, reaching its peak catalytic activity at 800 °C. The Tafel slope plots (Figure 9(b, e)) of materials prepared under different DCD amounts and carbonization temperatures reveal that the sample with a 1:2 ratio and carbonized at 800 °C exhibits the lowest Tafel slope (76.3 mV dec−1), which is consistent with previous characterization results. Consequently, these optimal preparation conditions were selected for vanadium doping, yielding polarization curves, the Tafel slopes, and performance comparison curves for different vanadium doping levels (Figure 9(g-I)).
From the polarization curves in Figure 9g, it can be observed that the material with a Mo/V ratio of 100:5 achieves the lowest η10 (99 mV). The biphasic structure formed between α-MoC1−x and β-Mo2C introduces new active sites and modulates the surface properties of the catalyst, thereby enhancing catalytic activity. The η10 of the 2VMC sample (114 mV) also indicates that vanadium doping improves the hydrogen evolution performance compared to pure α-MoC1−x10: 124 mV). This suggests that vanadium not only regulates the biphasic structure but also intrinsically enhances the catalytic properties of molybdenum carbide. The Tafel slope analysis of vanadium-doped molybdenum carbides with different doping levels (Figure 9h) further confirms that 5VMC exhibits the lowest Tafel slope (65.1 mV dec−1), surpassing that of the undoped sample. With increasing vanadium content, the HER performance of the material progressively declines. This degradation is likely attributable to an increase in the β-Mo2C phase induced by the vanadium doping. Although β-Mo2C is catalytically active, its high hydrogen adsorption energy impedes the efficient desorption of generated hydrogen gas. Consequently, hydrogen bubbles accumulate on the active sites, thereby slowing the overall reaction kinetics. This is reflected in the increasing overpotential observed with higher vanadium content. Furthermore, the performance trend indicates that the HER process follows the Volmer-Heyrovsky mechanism, with the electrochemical adsorption of water molecules (the Volmer step) being the rate-limiting process [39].
Electrochemical impedance spectroscopy (EIS) was employed to investigate the charge transfer mechanism, and the obtained Nyquist plots are shown in Figure 10. The smallest semicircle radius in the Nyquist plot was observed for the precursor prepared with 1.5 g of citric acid under hydrothermal conditions at 180 °C for 20 h, which was subsequently converted into α-MoC1−x. This indicates the smallest charge transfer resistance (Rct) and the fastest charge transfer rate, thereby facilitating the rapid progression of the HER. In the electrochemical impedance tests of catalysts synthesized with different dicyandiamide amounts and different carbonization temperatures, as shown in Figure 10(d, e), it can be observed that when the mass ratio of precursor to dicyandiamide is 1:2 and the carbonization temperature is 800 °C, the semicircle radius in the Nyquist plot is the smallest. This corresponds to the minimum Rct and a high electron transfer rate, further confirming the optimal preparation conditions discussed earlier. The Figure 10f shows the EIS results of V-MoxC samples with different vanadium doping levels. The 5VMC sample exhibits the most favorable charge transfer kinetics, followed by the 2VMC, 8VMC, and 11VMC samples, which is consistent with their respective catalytic activities.
Figure 11(a-c) presents the double-layer capacitance (Cdl) measurements under three distinct hydrothermal conditions. It can be observed that the precursor obtained by adding 1.5 g of citric acid and undergoing hydrothermal treatment at 180 °C for 20 h exhibits the highest Cdl. Under subsequent carbonization conditions (Figure 11(d, e)), the material achieved its maximum electrochemical active surface area when the precursor-to-dicyandiamide mass ratio was 1:2 and the carbonization temperature was 800 °C, as reflected by the highest Cdl value of 14.9 mF cm−2. This result further validates the optimal preparation conditions identified earlier. Subsequently, vanadium doping was performed under these optimized conditions, and the corresponding Cdl results are shown in Figure 11f. Among the four tested materials, the 5VMC sample exhibited the highest Cdl (16.7 mF cm−2), confirming its ability to expose the largest effective active surface area during the catalytic process. This performance is superior to that of the undoped sample.
Stability tests further demonstrate the durability of 5VMC. During the 100 h chronopotentiometric test at a constant current density of 10 mA cm−2, as depicted in Figure 12a, the potential exhibits minimal fluctuation, while the Figure 12b reveals only a slight negative shift in the LSV curves after 1000 CV cycles. These results confirm the excellent long-term electrochemical stability of 5VMC.
Table 1. Comparison of the performance of the present work with other HER electrocatalysts reported in the literature in 1 M KOH.
Catalysts η10/mV Tafel slope/mV dec−1 Ref.
V-MoxC 99 65.1 This work
MoC-Mo2C-31.4 HNWs 120 42 [40]
Zn-MoC/Mo2C-0.2 139 49.8 [41]
MoC-Mo2C 126 50 [42]
MoC-Mo2C/PNCDs 121 60 [43]
MoC/Mo2C (II) 112 69 [44]
Ni-MoxC/NC-100 162 104.8 [45]
Fe-MoC/β-Mo2C@NC 143 73 [46]
Ni15-Mo2C/N 105 44.9 [47]

3. Materials and Methods

3.1. Materials and Chemicals

Ammonium molybdate tetrahydrate ((NH4)6Mo7O24·4H2O), anhydrous citric acid (C6H8O7), dicyandiamide (C2H2N4), hydrofluoric acid (HF), ammonium metavanadate (NH4VO3) and anhydrous ethanol (CH3CH2OH) were bought from Shanghai Aladdin Biochemical Technology Co., Ltd. Silica (SiO2 G.R.grade) was purchased from Sigma Aldrich Trading Co., Ltd. Nitric acid was bought from Xilong Fine Chemical Co., Ltd. Argon was provided by Henan Yuanzheng Technology Development Co., Ltd.

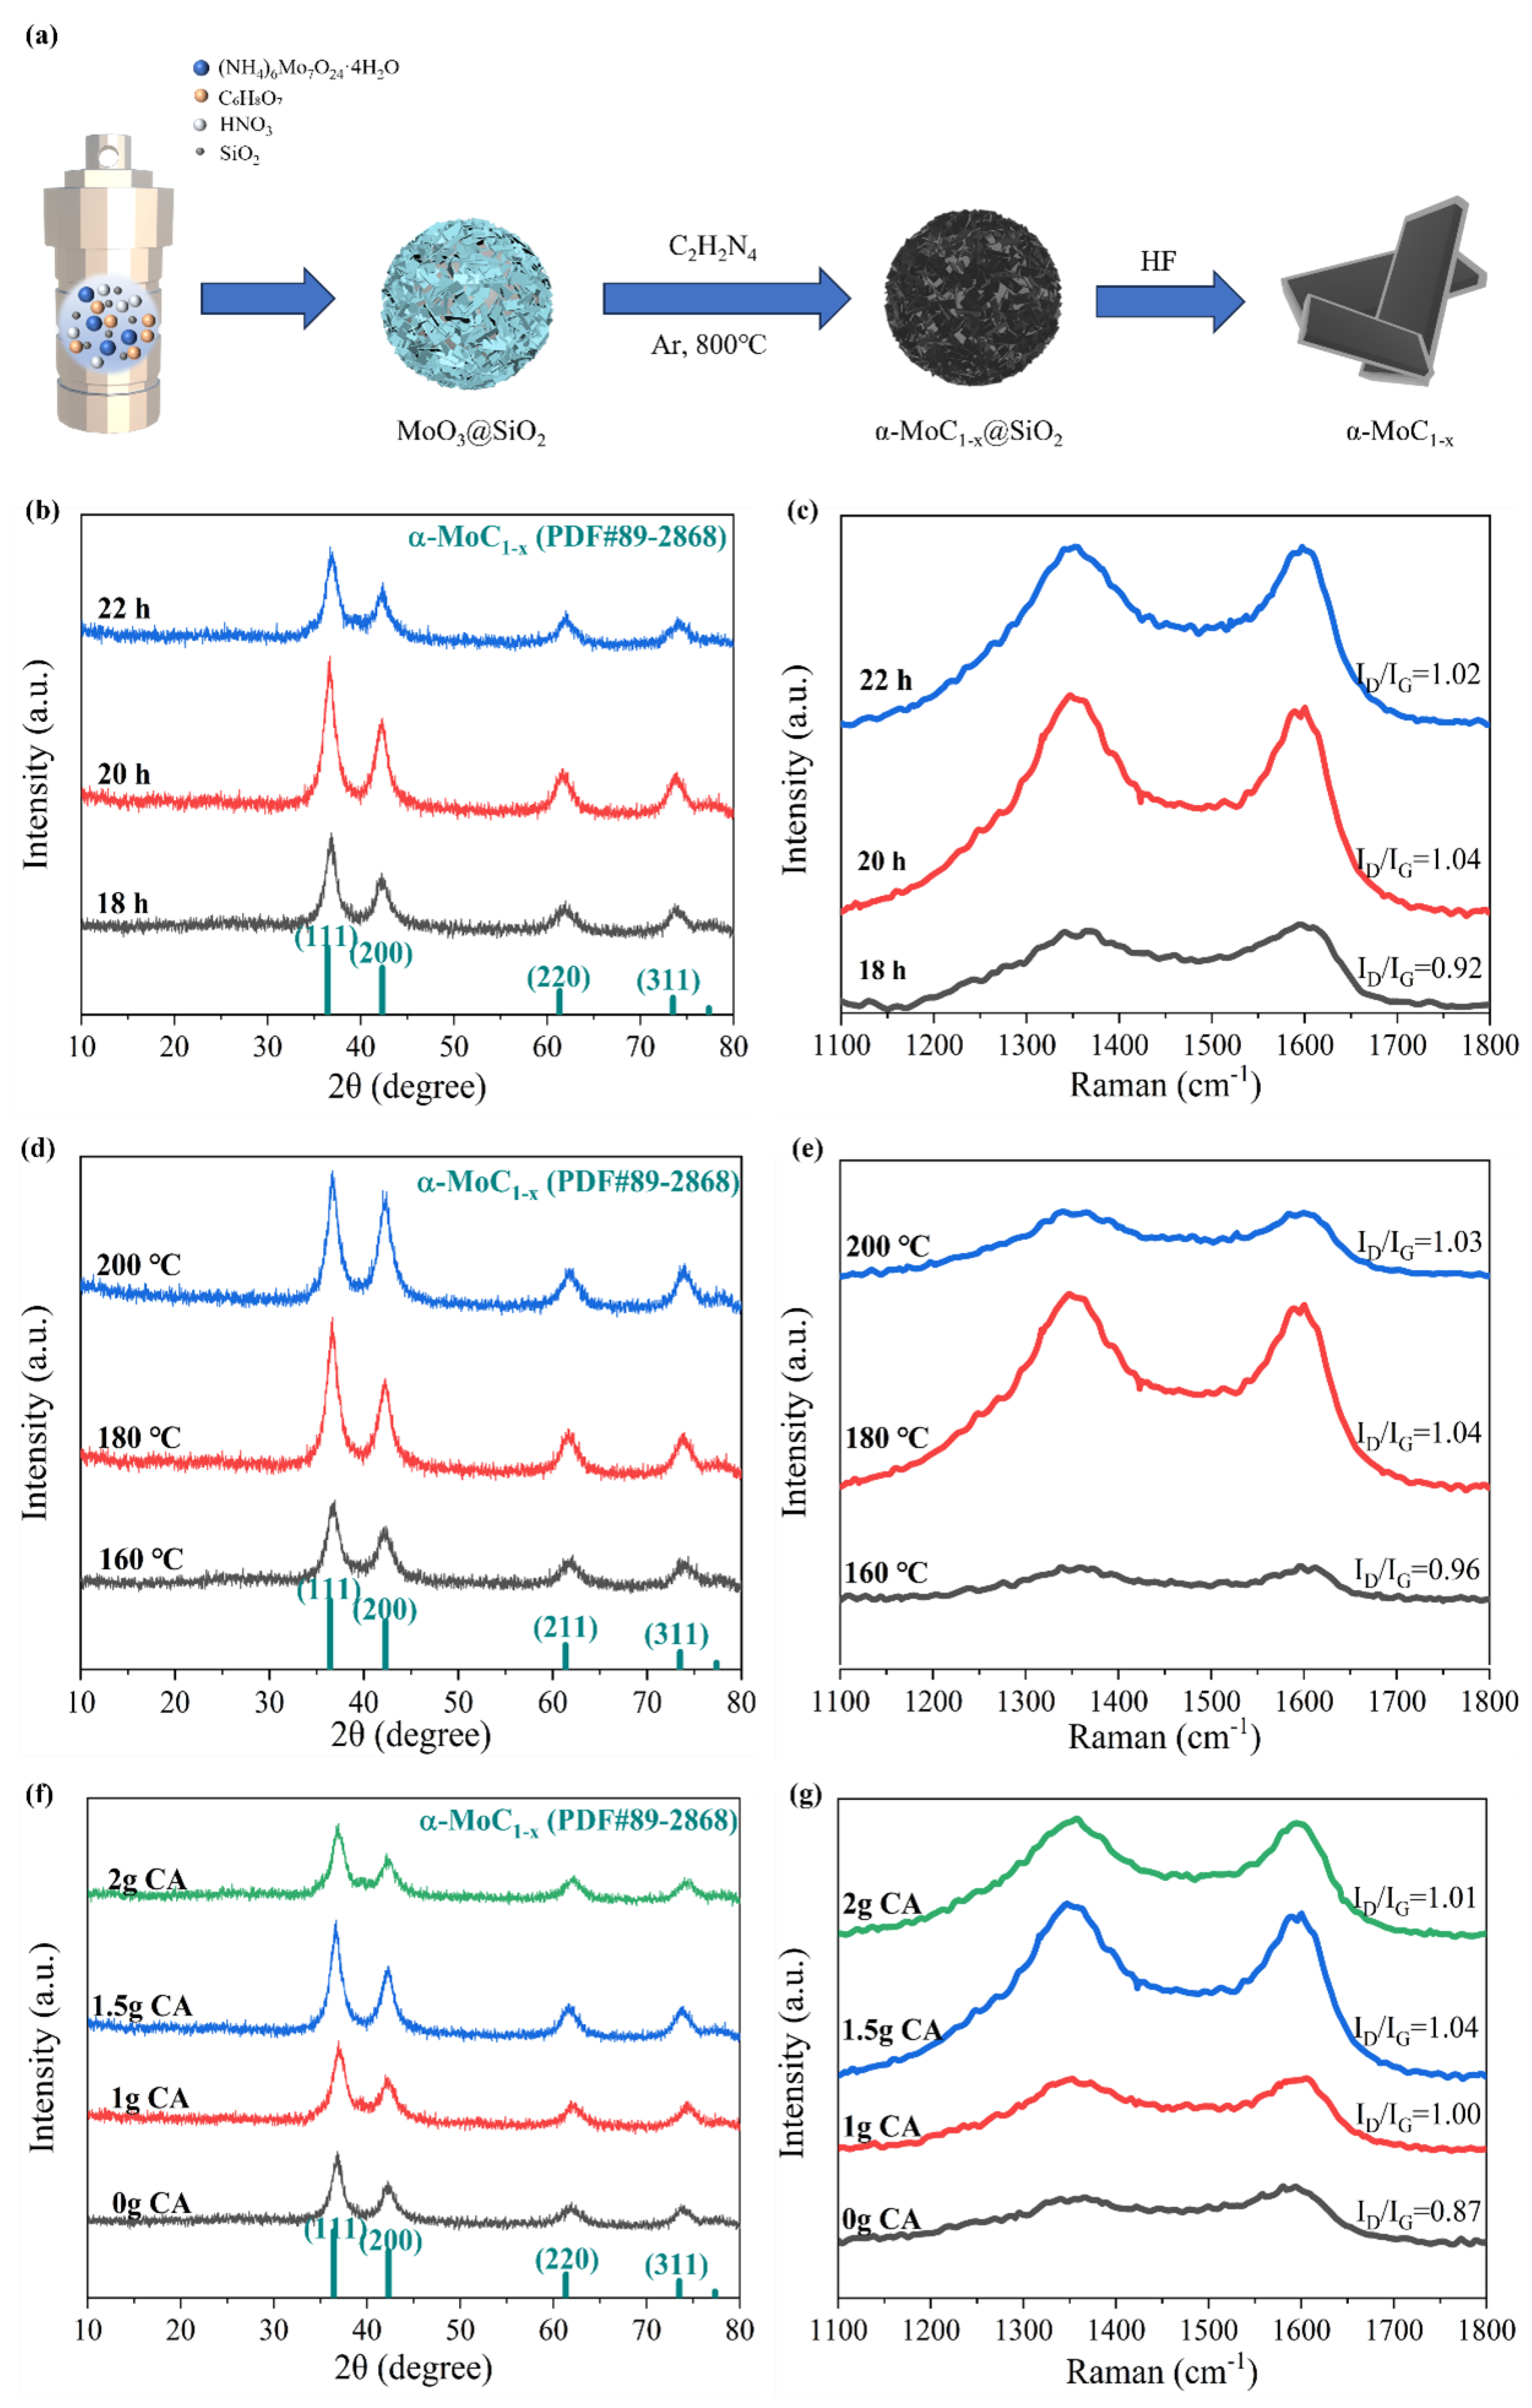
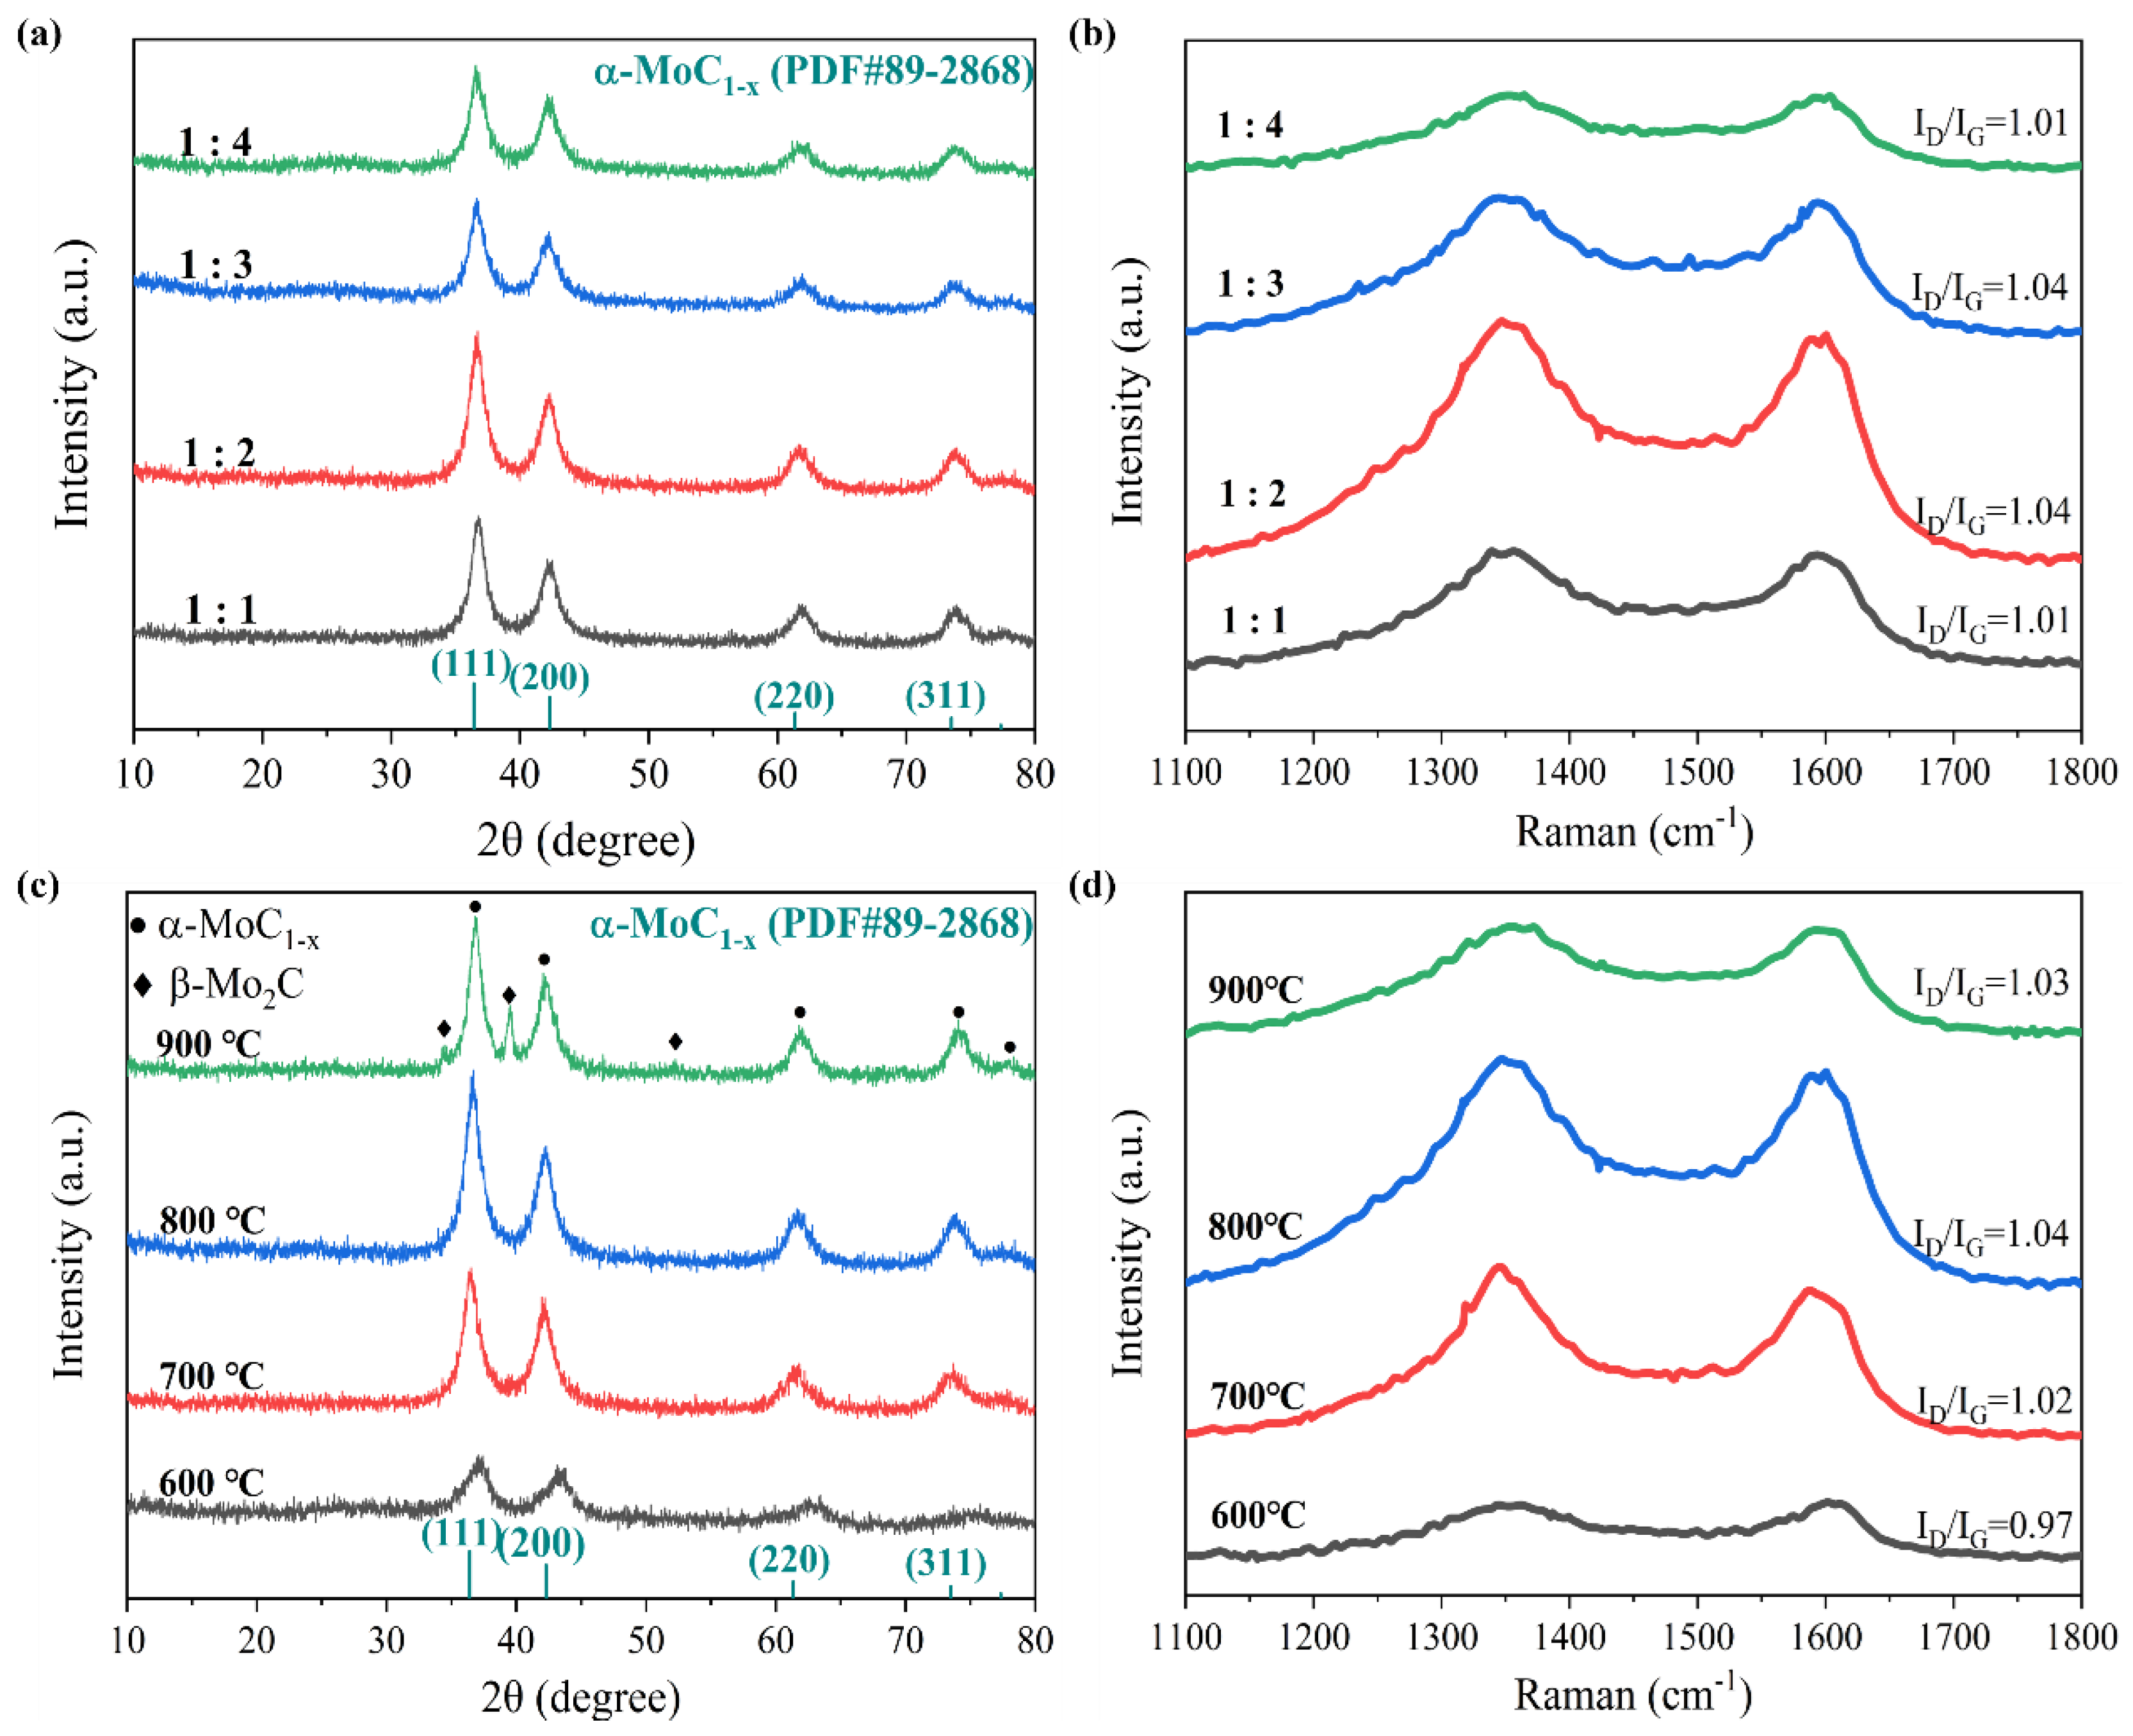
3.2. Synthesis of molybdenum carbide (α-MoC1−x) Samples and Vanadium Doped MoxC (V-MoxC) Samples

A total of 0.5 g of SiO2 was ultrasonically dispersed in 50 mL of deionized water. Subsequently, 5 mL of concentrated HNO3 and 1.5 g of anhydrous citric acid were added under continuous stirring to ensure complete dissolution. After the solution became clear, 0.3 g of (NH4)6Mo7O24·4H2O was introduced, then the mixture was stirred thoroughly to achieve homogeneous dispersion of the precursors. The solution was transferred to a 100 mL Teflon-lined autoclave and heated at 180 °C for 20 h. After washing and vacuum drying at 60 °C, the molybdenum oxide precursor loaded with SiO2 was obtained. Each precursor (200 mg) was placed downstream in a quartz boat, with 400 mg C2H2N4 upstream. Under Ar gas, the furnace was heated to 500 °C (2 °C/min, insulated for 1 h), then to 800 °C (5 °C/min, insulated for 2 h). After cooling, the SiO2 template was removed with 10% HF/ethanol, and the products were washed and dried to yield α-MoC1−x. The preparation scheme of α-MoC1−x was illustrated in Figure 1a.
After adding (NH4)6Mo7O24·4H2O in the aforementioned steps, measured quantities of ammonium metavanadate (with Mo/V molar ratios of 100:2, 100:5, 100:8, and 100:11) were introduced into the solution under continuous stirring. By repeating the subsequent procedures described above, V-MoxC samples were obtained. These samples were designated as 2VMC, 5VMC, 8VMC, and 11VMC according to their respective vanadium doping concentrations.

3.3. Materials characterization

The Bruker AXS D8 Advance X-ray diffractometer with Cu Kα radiation was served to measure X-ray diffraction (XRD) results. The scanning range was 10-80°, and the step size was 0.02°. The Raman spectra (Horiba LabRAM HR Evolution) of the composites were investigated with a laser diode at an excitation wavelength of 532 nm. Meanwhile, using the Micromeritics ASAP 2020 adsorbent to obtain the specific surface area of the material. In addition, the morphology and microstructures of the catalyst was determined by scanning electron microscope (JMS-75000F), transmission electron microscope (Talos™ F200). By analyzing X-ray photoelectron spectroscopy (Escalab-250Xi), quantitative analysis of elements and information on electronic energy level structure can be gained.

3.4. Electrochemical measurements

All electrochemical measurements were conducted in 1.0 M KOH using a typical three-electrode setup with a DH-7000 workstation (Donghua Analytical Instrument Co., Ltd., Jiangsu). The prepared catalyst, a platinum plate, and an Hg/HgO electrode served as the working, counter, and reference electrodes, respectively. 2.5 mg of the catalyst was added to a mixture of 245 μL deionized water, 245 μL anhydrous ethanol, and 10 μL of a 5 wt% Nafion dispersion. The mixture was sonicated for 1 h to form a homogeneous ink. Then, 150 μL of the ink was drop-cast onto an alcohol-washed and dried carbon paper (0.5×2 cm), covering an area of 0.5×1 cm to achieve a catalyst loading of approximately 0.75 mg cm−2. After thorough drying, the prepared electrode was used as the working electrode. All potentials were converted to the reversible hydrogen electrode (RHE) scale using: E (vs. RHE) = E (vs. Hg/HgO) + 0.098 + 0.0592 × pH. Linear sweep voltammetry (LSV) was performed from −0.8 to −1.3 V at 5 mV s−1 to obtain polarization curves. Tafel slopes were derived from the LSV data using the Tafel equation (η = b·log|j|+a). Cyclic voltammetry (CV) was conducted within a potential window of −0.45 to −0.35 V. The material was first scanned continuously until a stable response was obtained. Subsequently, CV scans were performed at scan rates ranging from 20 to 100 mV s−1 with an increment of 20 mV s−1, and with 10 cycles recorded at each rate. The data from the last cycle at each scan rate were used for analysis. The Electrochemical impedance spectroscopy (EIS) measurements were performed over a frequency range of 10−2 to 105 Hz with an amplitude of 5 mV.

4. Conclusions

In summary, α phase and α/β dual-phase composite structured molybdenum carbide electrocatalysts were successfully prepared, and vanadium doping improved their catalytic performance. Firstly, the optimal preparation method for the α phase was obtained through continuous optimization of the preparation process. The α-MoC1−x obtained at a hydrothermal temperature of 180 °C, hydrothermal time of 20 h, citric acid addition of 1.5 g, carbonization conditions of 800 °C, and precursor/dicyandiamide mass ratio of 1:2 exhibited the best electrocatalytic hydrogen evolution performance. Vanadium doped biphasic molybdenum carbide catalyst was prepared by introducing vanadium during the above preparation process. The addition of vanadium causes the transformation of molybdenum carbide from the α phase to the β phase. After the addition of vanadium, the catalyst structure becomes fragmented, the thickness decreases, and the specific surface area of the material increases. The V-MoxC catalyst with a Mo/V molar ratio of 100:5 exhibits the best charge transfer kinetics and surface properties, with a β/α ratio of 0.827. Due to the advantages of biphasic catalysts, V-MoxC catalysts exhibit superior hydrogen evolution performance, with an η10 of 99 mV, a Tafel slope of 65.1 mV dec−1, and excellent stability.

Author Contributions

S.L.: Writing-review & editing, Project administration, Funding acquisition. Y.L.: Conceptualization, Methodology, Data curation, Writing-original draft. R.J.: Validation, Formal Analysis. J.W.: Visualization, Formal Analysis. P.Z.: Investigation, Visualization. J.W.: Investigation, Resources. X.Y.: Supervision, Writing-Review & Editing. J.Z.: Project Administration, Writing-Review & Editing. All authors have read and agreed to the published version of the manuscript.

Funding

This work was supported by the Outstanding Young Talents Innovation Team Project of Zhengzhou University.

Data Availability Statement

The data presented in this study are available on request from the corresponding author.

Conflicts of Interest

The authors declare no conflicts of interest.

References

  1. Jin, J.; Wang, X.; Hu, Y.; Zhang, Z.; Liu, H.; Yin, J.; Xi, P. Precisely Control Relationship between Sulfur Vacancy and H Absorption for Boosting Hydrogen Evolution Reaction. Nano-Micro Letters 2024, 16, 63. [Google Scholar] [CrossRef] [PubMed]
  2. Iqbal, M.Z.; Zahid, R.; Khan, M.W.; Shaheen, M.; Aziz, U.; Aftab, S. Exploration of catalytically active materials for efficient electrochemical hydrogen and oxygen evolution reactions. International Journal of Hydrogen Energy 2023, 48, 8045–8070. [Google Scholar] [CrossRef]
  3. Bender, J.T.; Petersen, A.S.; Østergaard, F.C.; Wood, M.A.; Heffernan, S.M.J.; Milliron, D.J.; Rossmeisl, J.; Resasco, J. Understanding Cation Effects on the Hydrogen Evolution Reaction. ACS Energy Letters 2023, 8, 657–665. [Google Scholar] [CrossRef]
  4. Huang, C.; Ouyang, T.; Zou, Y.; Li, N.; Liu, Z.Q. Ultrathin NiCo2Px nanosheets strongly coupled with CNTs as efficient and robust electrocatalysts for overall water splitting. Journal of Materials Chemistry A 2018. [Google Scholar]
  5. Gong, Q.; Cheng, L.; Liu, C.; Zhang, M.; Feng, Q.; Ye, H.; Zeng, M.; Xie, L.; Liu, Z.; Li, Y. Ultrathin MoS2(1–x)Se2x Alloy Nanoflakes For Electrocatalytic Hydrogen Evolution Reaction. ACS Catalysis 2015, 5, 2213–2219. [Google Scholar] [CrossRef]
  6. Sun, J.; Chen, Y.; Ren, Z.; Fu, H.; Xiao, Y.; Wang, J.; Tian, G. Self-Supported NiS Nanoparticle-Coupled Ni2P Nanoflake Array Architecture: An Advanced Catalyst for Electrochemical Hydrogen Evolution. ChemElectroChem 2017, 4, 1341–1348. [Google Scholar] [CrossRef]
  7. Guo, Y.; Zhou, X.; Tang, J.; Tanaka, S.; Kaneti, Y.V.; Na, J.; Jiang, B.; Yamauchi, Y.; Bando, Y.; Sugahara, Y. Multiscale structural optimization: Highly efficient hollow iron-doped metal sulfide heterostructures as bifunctional electrocatalysts for water splitting. Nano Energy 2020, 75, 104913. [Google Scholar] [CrossRef]
  8. Bui, H.T.; Lam, N.D.; Linh, D.C.; Mai, N.T.; Chang, H.; Han, S.-H.; Oanh, V.T.K.; Pham, A.T.; Patil, S.A.; Tung, N.T.; Shrestha, N.K. Escalating Catalytic Activity for Hydrogen Evolution Reaction on MoSe2@Graphene Functionalization. Nanomaterials 2023, 13, 2139. [Google Scholar] [CrossRef]
  9. Lin, L.; Yao, S.; Gao, R.; Liang, X.; Yu, Q.; Deng, Y.; Liu, J.; Peng, M.; Jiang, Z.; Li, S.; Li, Y.-W.; Wen, X.-D.; Zhou, W.; Ma, D. A highly CO-tolerant atomically dispersed Pt catalyst for chemoselective hydrogenation. Nature Nanotechnology 2019, 14, 354–361. [Google Scholar] [CrossRef]
  10. Chen, M.; Ma, Y.; Zhou, Y.; Liu, C.; Qin, Y.; Fang, Y.; Guan, G.; Li, X.; Zhang, Z.; Wang, T. Influence of Transition Metal on the Hydrogen Evolution Reaction over Nano-Molybdenum-Carbide Catalyst. Catalysts 2018, 8, 294. [Google Scholar] [CrossRef]
  11. Ni, J.; Ruan, Z.; Xu, J.; Yan, J.; Ma, J.; Ma, H.; Qi, J.; Zhu, S.; Lu, L. Regulating surface wettability and electronic state of molybdenum carbide for improved hydrogen evolution reaction. International Journal of Hydrogen Energy 2023, 48, 17478–17488. [Google Scholar] [CrossRef]
  12. Xia, K.; Guo, J.; Xuan, C.; Huang, T.; Deng, Z.; Chen, L.; Wang, D. Ultrafine molybdenum carbide nanoparticles supported on nitrogen doped carbon nanosheets for hydrogen evolution reaction. Chinese Chemical Letters 2019, 30, 192–196. [Google Scholar] [CrossRef]
  13. Kitchin, J.R.; Nørskov, J.K.; Barteau, M.A.; Chen, J.G. Trends in the chemical properties of early transition metal carbide surfaces: A density functional study. Catalysis Today 2005, 105, 66–73. [Google Scholar] [CrossRef]
  14. Li, S.; Su, S.; Tian, Y.; Li, Y.; Yu, X.; Sun, P.; Zheng, J.Y. Template-assisted preparation of imbricate N–MoxC nanotubes for the effective electrocatalytic hydrogen evolution reaction. CrystEngComm 2023, 25, 1648–1656. [Google Scholar] [CrossRef]
  15. Yu, X.; Shi, W.; Wei, J.; Liu, T.; Li, Y.; He, M.; Wei, Z.; Ping, D.; Sun, P.; Zheng, J.Y.; Li, S. Green fabrication of ultrafine N-MoxC/CoP hybrids for boosting electrocatalytic water reduction. Nanotechnology 2024, 35, 065704. [Google Scholar] [CrossRef]
  16. Politi, J.R.d.S.; Viñes, F.; Rodriguez, J.A.; Illas, F. Atomic and electronic structure of molybdenum carbide phases: bulk and low Miller-index surfaces. Physical Chemistry Chemical Physics 2013, 15, 12617–12625. [Google Scholar] [CrossRef]
  17. Gao, Q.; Zhang, W.; Shi, Z.; Yang, L.; Tang, Y. Structural Design and Electronic Modulation of Transition-Metal-Carbide Electrocatalysts toward Efficient Hydrogen Evolution. Advanced Materials 2019, 31, 1802880. [Google Scholar] [CrossRef]
  18. Hunt, S.T.; Milina, M.; Alba-Rubio, A.C.; Hendon, C.H.; Dumesic, J.A.; Román-Leshkov, Y. Self-assembly of noble metal monolayers on transition metal carbide nanoparticle catalysts. Science 2016, 352, 974–978. [Google Scholar] [CrossRef]
  19. Vrubel, H.; Hu, X. Molybdenum Boride and Carbide Catalyze Hydrogen Evolution in both Acidic and Basic Solutions. Angewandte Chemie International Edition 2012, 51, 12703–12706. [Google Scholar] [CrossRef]
  20. Wan, C.; Regmi, Y.N.; Leonard, B.M. Multiple Phases of Molybdenum Carbide as Electrocatalysts for the Hydrogen Evolution Reaction. Angewandte Chemie 2014, 126, 6525–6528. [Google Scholar] [CrossRef]
  21. Gong, Q.; Wang, Y.; Hu, Q.; Zhou, J.; Feng, R.; Duchesne, P.N.; Zhang, P.; Chen, F.; Han, N.; Li, Y.; Jin, C.; Li, Y.; Lee, S.-T. Ultrasmall and phase-pure W2C nanoparticles for efficient electrocatalytic and photoelectrochemical hydrogen evolution. Nature Communications 2016, 7, 13216. [Google Scholar] [CrossRef] [PubMed]
  22. Yu, F.; Gao, Y.; Lang, Z.; Ma, Y.; Yin, L.; Du, J.; Tan, H.; Wang, Y.; Li, Y. Electrocatalytic performance of ultrasmall Mo2C affected by different transition metal dopants in hydrogen evolution reaction. Nanoscale 2018, 10, 6080–6087. [Google Scholar] [CrossRef] [PubMed]
  23. Wu, T.; Zhang, J.; Chen, Y.; Jia, Y.; An, J.; Ge, J.; Wang, M. Simple and Controllable Preparation of Molybdenum Carbides by One-Step Co-Electrolysis of Na2MoO4 and CO2. Journal of The Electrochemical Society. 2023, 170, 053503. [Google Scholar] [CrossRef]
  24. Chen, Z.; Guo, T.; Wu, Z.; Wang, D. Boron triggers the phase transformation of MoxC (α-MoC1−x/β-Mo2C) for enhanced hydrogen production. Nanotechnology 2020, 31, 105707. [Google Scholar] [CrossRef]
  25. Baek, D.S.; Jung, G.Y.; Seo, B.; Kim, J.C.; Lee, H.-W.; Shin, T.J.; Jeong, H.Y.; Kwak, S.K.; Joo, S.H. Ordered Mesoporous Metastable α-MoC1−x with Enhanced Water Dissociation Capability for Boosting Alkaline Hydrogen Evolution Activity. Advanced Functional Materials 2019, 29, 1901217. [Google Scholar] [CrossRef]
  26. Li, Y.; Jia, B.; Fan, Y.; Zhu, K.; Li, G.; Su, C.-Y. Bimetallic Zeolitic Imidazolite Framework Derived Carbon Nanotubes Embedded with Co Nanoparticles for Efficient Bifunctional Oxygen Electrocatalyst. Advanced Energy Materials 2018, 8, 1702048. [Google Scholar] [CrossRef]
  27. Schweitzer, N.M.; Schaidle, J.A.; Ezekoye, O.K.; Pan, X.; Linic, S.; Thompson, L.T. High Activity Carbide Supported Catalysts for Water Gas Shift. Journal of the American Chemical Society 2011, 133, 2378–2381. [Google Scholar] [CrossRef]
  28. Zhang, Y.; Liu, X.; Li, W.; Liu, W.; Yin, H.; Wang, D. Advanced and Durable Self-Standing MoC-Mo2C Electrode for Alkaline Hydrogen Evolution in Chlor-alkali Electrolysis. ACS Sustainable Chemistry & Engineering 2023, 11, 9470–9477. [Google Scholar] [CrossRef]
  29. Huang, Y.; Hu, J.; Xu, H.; Bian, W.; Ge, J.; Zang, D.; Cheng, D.; Lv, Y.; Zhang, C.; Gu, J.; Wei, Y. Fine Tuning Electronic Structure of Catalysts through Atomic Engineering for Enhanced Hydrogen Evolution. Advanced Energy Materials 2018, 8, 1800789. [Google Scholar] [CrossRef]
  30. Zang, D.; Gao, X.J.; Li, L.; Wei, Y.; Wang, H. Confined interface engineering of self-supported Cu@N-doped graphene for electrocatalytic CO2 reduction with enhanced selectivity towards ethanol. Nano Research 2022, 15, 8872–8879. [Google Scholar] [CrossRef]
  31. Xu, H.; Jia, H.; Fei, B.; Ha, Y.; Li, H.; Guo, Y.; Liu, M.; Wu, R. Charge Transfer Engineering via Multiple Heteroatom Doping in Dual Carbon-Coupled Cobalt Phosphides for Highly Efficient Overall Water Splitting. Applied Catalysis B: Environmental 2020, 268, 118404. [Google Scholar] [CrossRef]
  32. Zhao, T.; Jia, Z.; Zhang, Y.; Wu, G. Multiphase Molybdenum Carbide Doped Carbon Hollow Sphere Engineering: The Superiority of Unique Double-Shell Structure in Microwave Absorption. Small 2023, 19, 2206323. [Google Scholar] [CrossRef] [PubMed]
  33. Chen, Y.-Y.; Zhang, Y.; Jiang, W.-J.; Zhang, X.; Dai, Z.; Wan, L.-J.; Hu, J.-S. Pomegranate-like N,P-Doped Mo2C@C Nanospheres as Highly Active Electrocatalysts for Alkaline Hydrogen Evolution. ACS Nano 2016, 10, 8851–8860. [Google Scholar] [CrossRef] [PubMed]
  34. Lu, X.F.; Yu, L.; Zhang, J.; Lou, X.W.D. Ultrafine Dual-Phased Carbide Nanocrystals Confined in Porous Nitrogen-Doped Carbon Dodecahedrons for Efficient Hydrogen Evolution Reaction. Adv Mater. 2019, 31, e1900699. [Google Scholar] [CrossRef]
  35. Cui, W.; Cheng, N.; Liu, Q.; Ge, C.; Asiri, A.M.; Sun, X. Mo2C Nanoparticles Decorated Graphitic Carbon Sheets: Biopolymer-Derived Solid-State Synthesis and Application as an Efficient Electrocatalyst for Hydrogen Generation. ACS Catalysis 2014, 4, 2658–2661. [Google Scholar] [CrossRef]
  36. Wang, D.; Zhang, X.; Bao, S.; Zhang, Z.; Fei, H.; Wu, Z. Phase engineering of a multiphasic 1T/2H MoS2 catalyst for highly efficient hydrogen evolution. Journal of Materials Chemistry A 2017, 5, 2681–2688. [Google Scholar] [CrossRef]
  37. Huang, J.; Wang, J.; Xie, R.; Tian, Z.; Chai, G.; Zhang, Y.; Lai, F.; He, G.; Liu, C.; Liu, T.; Shearing, P.R.; Brett, D.J.L. A universal pH range and a highly efficient Mo2C-based electrocatalyst for the hydrogen evolution reaction. Journal of Materials Chemistry A 2020, 8, 19879–19886. [Google Scholar] [CrossRef]
  38. Jiang, H.; Yan, L.; Zhang, S.; Zhao, Y.; Yang, X.; Wang, Y.; Shen, J.; Zhao, X.; Wang, L. Electrochemical Surface Restructuring of Phosphorus-Doped Carbon@MoP Electrocatalysts for Hydrogen Evolution. Nano-Micro Letters 2021, 13, 215. [Google Scholar] [CrossRef]
  39. Liu, M.-J.; Yang, F.-H.; Mei, J.-C.; Guo, X.; Wang, H.-Y.; He, M.-Y.; Yao, Y.-A.; Zhang, H.-F.; Liu, C.-B. MOF Template-Derived Carbon Shell-Embedded CoP Hierarchical Nanosheet as Bifunctional Catalyst for Overall Water Splitting. Nanomaterials 2023, 13, 2421. [Google Scholar] [CrossRef]
  40. Sun, J.; Zhang, X.; Jin, M.; Xiong, Q.; Wang, G.; Zhang, H.; Zhao, H. Robust enhanced hydrogen production at acidic conditions over molybdenum oxides-stabilized ultrafine palladium electrocatalysts. Nano Research 2021, 14, 268–274. [Google Scholar] [CrossRef]
  41. Li, X.; Jiang, Y.; Jia, L.; Wang, C. MoO2 nanoparticles on reduced graphene oxide/polyimide-carbon nanotube film as efficient hydrogen evolution electrocatalyst. Journal of Power Sources 2016, 304, 146–154. [Google Scholar] [CrossRef]
  42. Wu, L.; Wang, X.; Sun, Y.; Liu, Y.; Li, J. Flawed MoO2 belts transformed from MoO3 on a graphene template for the hydrogen evolution reaction. Nanoscale 2015, 7, 7040–7044. [Google Scholar] [CrossRef]
  43. Jin, Y.; Wang, H.; Li, J.; Yue, X.; Han, Y.; Shen, P.K.; Cui, Y. Porous MoO2 Nanosheets as Non-noble Bifunctional Electrocatalysts for Overall Water Splitting. Advanced Materials 2016, 28, 3785–3790. [Google Scholar] [CrossRef]
  44. Sun, C.; Wang, P.; Wang, H.; Xu, C.; Zhu, J.; Liang, Y.; Su, Y.; Jiang, Y.; Wu, W.; Fu, E.; Zou, G. Defect engineering of molybdenum disulfide through ion irradiation to boost hydrogen evolution reaction performance. Nano Research 2019, 12, 1613–1618. [Google Scholar] [CrossRef]
  45. Saleem, S.; Salman, M.; Ali, S.; Ling, Y.; Khan, M. Electrocatalytic hydrogen evolution reaction on sulfur-deficient MoS2 nanostructures. International Journal of Hydrogen Energy 2022, 47, 7713–7723. [Google Scholar] [CrossRef]
  46. Ghosh, D.; Ghosal Chowdhury, M.; Biswas, R.; Haldar, K.K.; Patra, A. Europium Molybdate/Molybdenum Disulfide Nanostructures with Efficient Electrocatalytic Activity for the Hydrogen Evolution Reaction. ACS Applied Nano Materials 2023, 6, 7218–7228. [Google Scholar] [CrossRef]
  47. Huang, Y.; Wang, C.; Song, H.; Bao, Y.; Lei, X. Carbon-coated molybdenum carbide nanosheets derived from molybdenum disulfide for hydrogen evolution reaction. International Journal of Hydrogen Energy 2018, 43, 12610–12617. [Google Scholar] [CrossRef]
Figure 1. (a) Preparation processes of α-MoC1−x. (b, d, f) XRD patterns and (c, e, g) Raman spectra of α-MoC1−x samples prepared under different hydrothermal conditions.
Preprints 193970 g001
Figure 2. (a, c) XRD and (b, d) Raman spectra of α-MoC1−x samples prepared under different carbonation conditions.
Preprints 193970 g002
Figure 3. (a) Preparation process of V-MoxC. (b) XRD patterns and (c) Raman spectra of V-MoxC samples prepared with different vanadium doping levels.
Preprints 193970 g003
Figure 4. (a) N2 adsorption-desorption isothermal curves and (b) pore size distributions for α-MoC1−x and 5VMC samples.
Preprints 193970 g004
Figure 5. (a) SEM, (d) TEM and (e) HRTEM images of α-MoC1−x prepared under optimal conditions. (b, c) SEM, (f) TEM and (g) HRTEM, and (h) EDS mapping images of 5VMC sample.
Preprints 193970 g005
Figure 6. High-resolution XPS spectra of (a) C 1s, (b) Mo 3d and (c) N 1s of α-MoC1−x prepared under the optimum conditions. High-resolution XPS spectra of (d) C 1s, (e) Mo 3d, (f) N 1s and (g) V 2p for 5VMC sample.
Preprints 193970 g006
Figure 7. (a-d) Mo 3d high-resolution XPS spectra of samples obtained with different vanadium doping levels and (e) percentage of Mo2+ and Mo3+ on the surface.
Preprints 193970 g007
Figure 8. (a, d, g) The LSV curves and (b, e, h) the Tafel slopes and (c, f, i) performance comparison of α-MoC1−x prepared under different hydrothermal conditions.
Preprints 193970 g008
Figure 9. (a, d) The LSV curves and (b, e) the Tafel slopes and (c, f) comparative properties of α-MoC1−x prepared under different carbonation conditions. (Hydrothermal treatment: 1.5 g citric acid, 800 °C, 20 h). Comparison of (g) the LSV curves and (h) the Tafel slopes and (i) η10 of V-MoxC prepared with different vanadium doping levels.
Preprints 193970 g009
Figure 10. (a-e) Electrochemical impedance plots of α-MoC1-x prepared under different hydrothermal and carbonation conditions. (f) Electrochemical impedance plots of V-MoxC prepared with different vanadium doping levels.
Preprints 193970 g010
Figure 11. (a-e) Bilayer capacitance plots of α-MoC1−x prepared under different hydrothermal and carbonation conditions. (f) Bilayer capacitance plots of V-MoxC prepared with different vanadium doping levels.
Preprints 193970 g011
Figure 12. (a) Chrono-potential curves of 5VMC samples at 10 mA cm−2 and (b) the LSV curves before and after 1000 turns of CV cycling.
Preprints 193970 g012
Disclaimer/Publisher’s Note: The statements, opinions and data contained in all publications are solely those of the individual author(s) and contributor(s) and not of MDPI and/or the editor(s). MDPI and/or the editor(s) disclaim responsibility for any injury to people or property resulting from any ideas, methods, instructions or products referred to in the content.
Copyright: This open access article is published under a Creative Commons CC BY 4.0 license, which permit the free download, distribution, and reuse, provided that the author and preprint are cited in any reuse.
Prerpints.org logo

Preprints.org is a free preprint server supported by MDPI in Basel, Switzerland.

Subscribe

Disclaimer

Terms of Use

Privacy Policy

Privacy Settings

© 2026 MDPI (Basel, Switzerland) unless otherwise stated