Preprint
Article

This version is not peer-reviewed.

Different Classes of Antibiotics, by Provoking Distinct Patterns of Dysbiosis, May Affect the Occurrence of Inflammatory Bowel Disease

Submitted:

09 January 2026

Posted:

13 January 2026

You are already at the latest version

Abstract

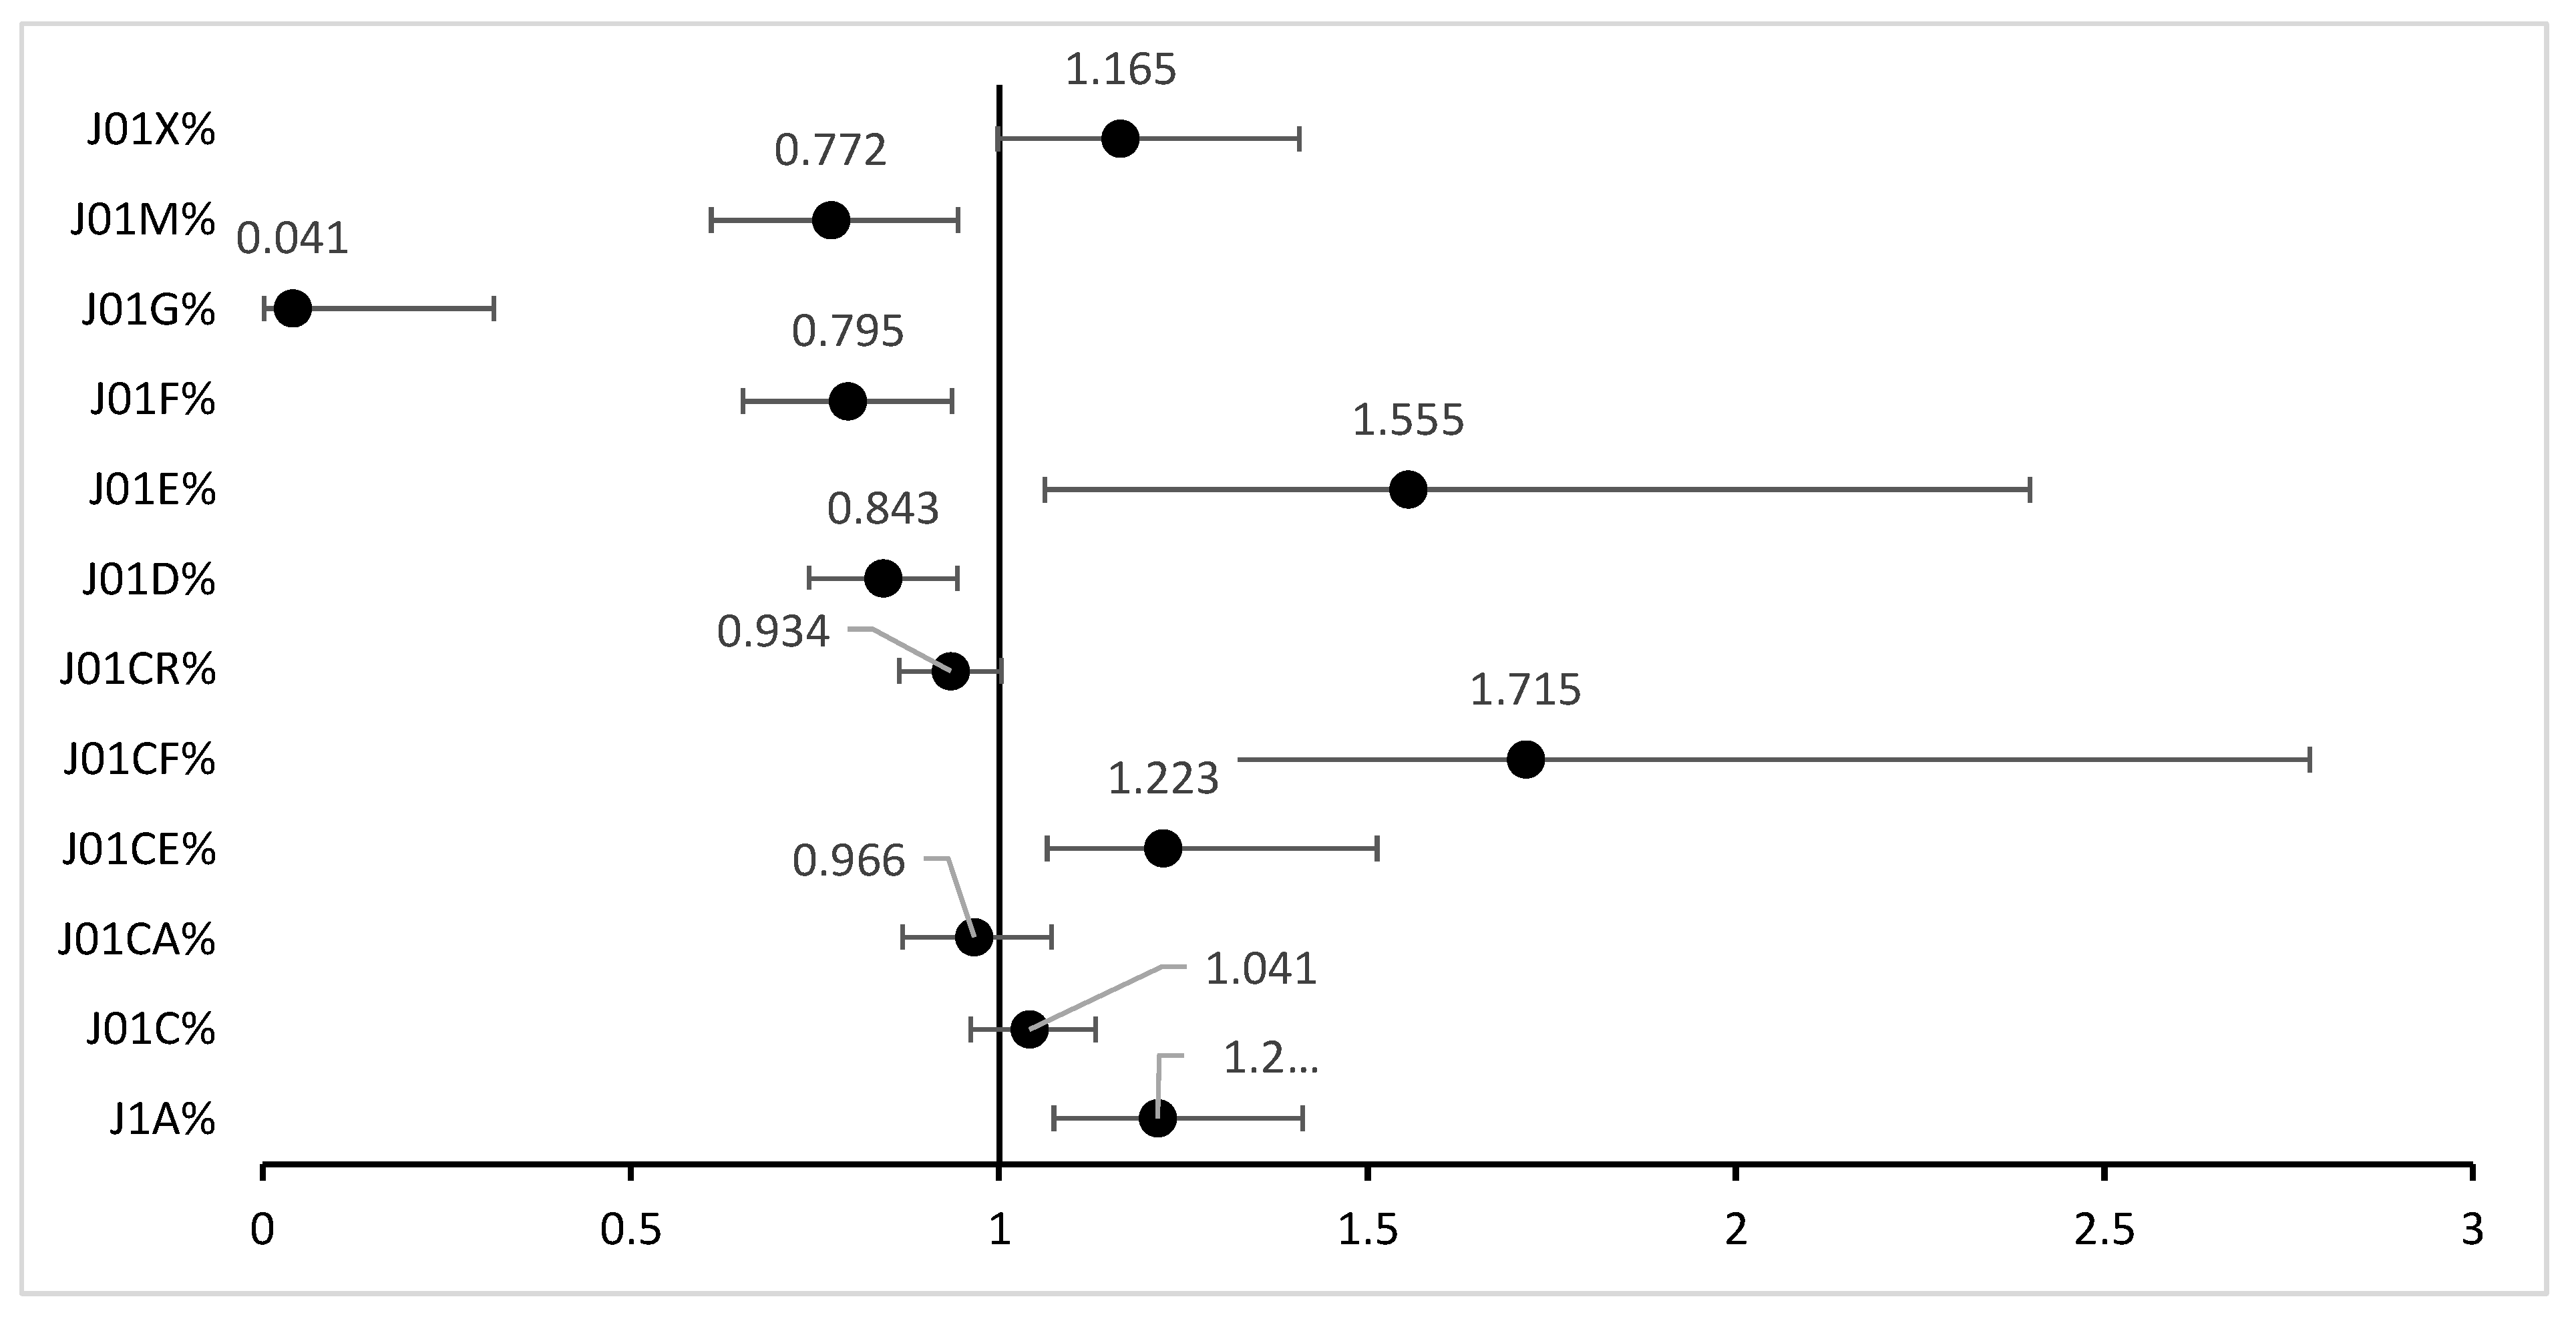
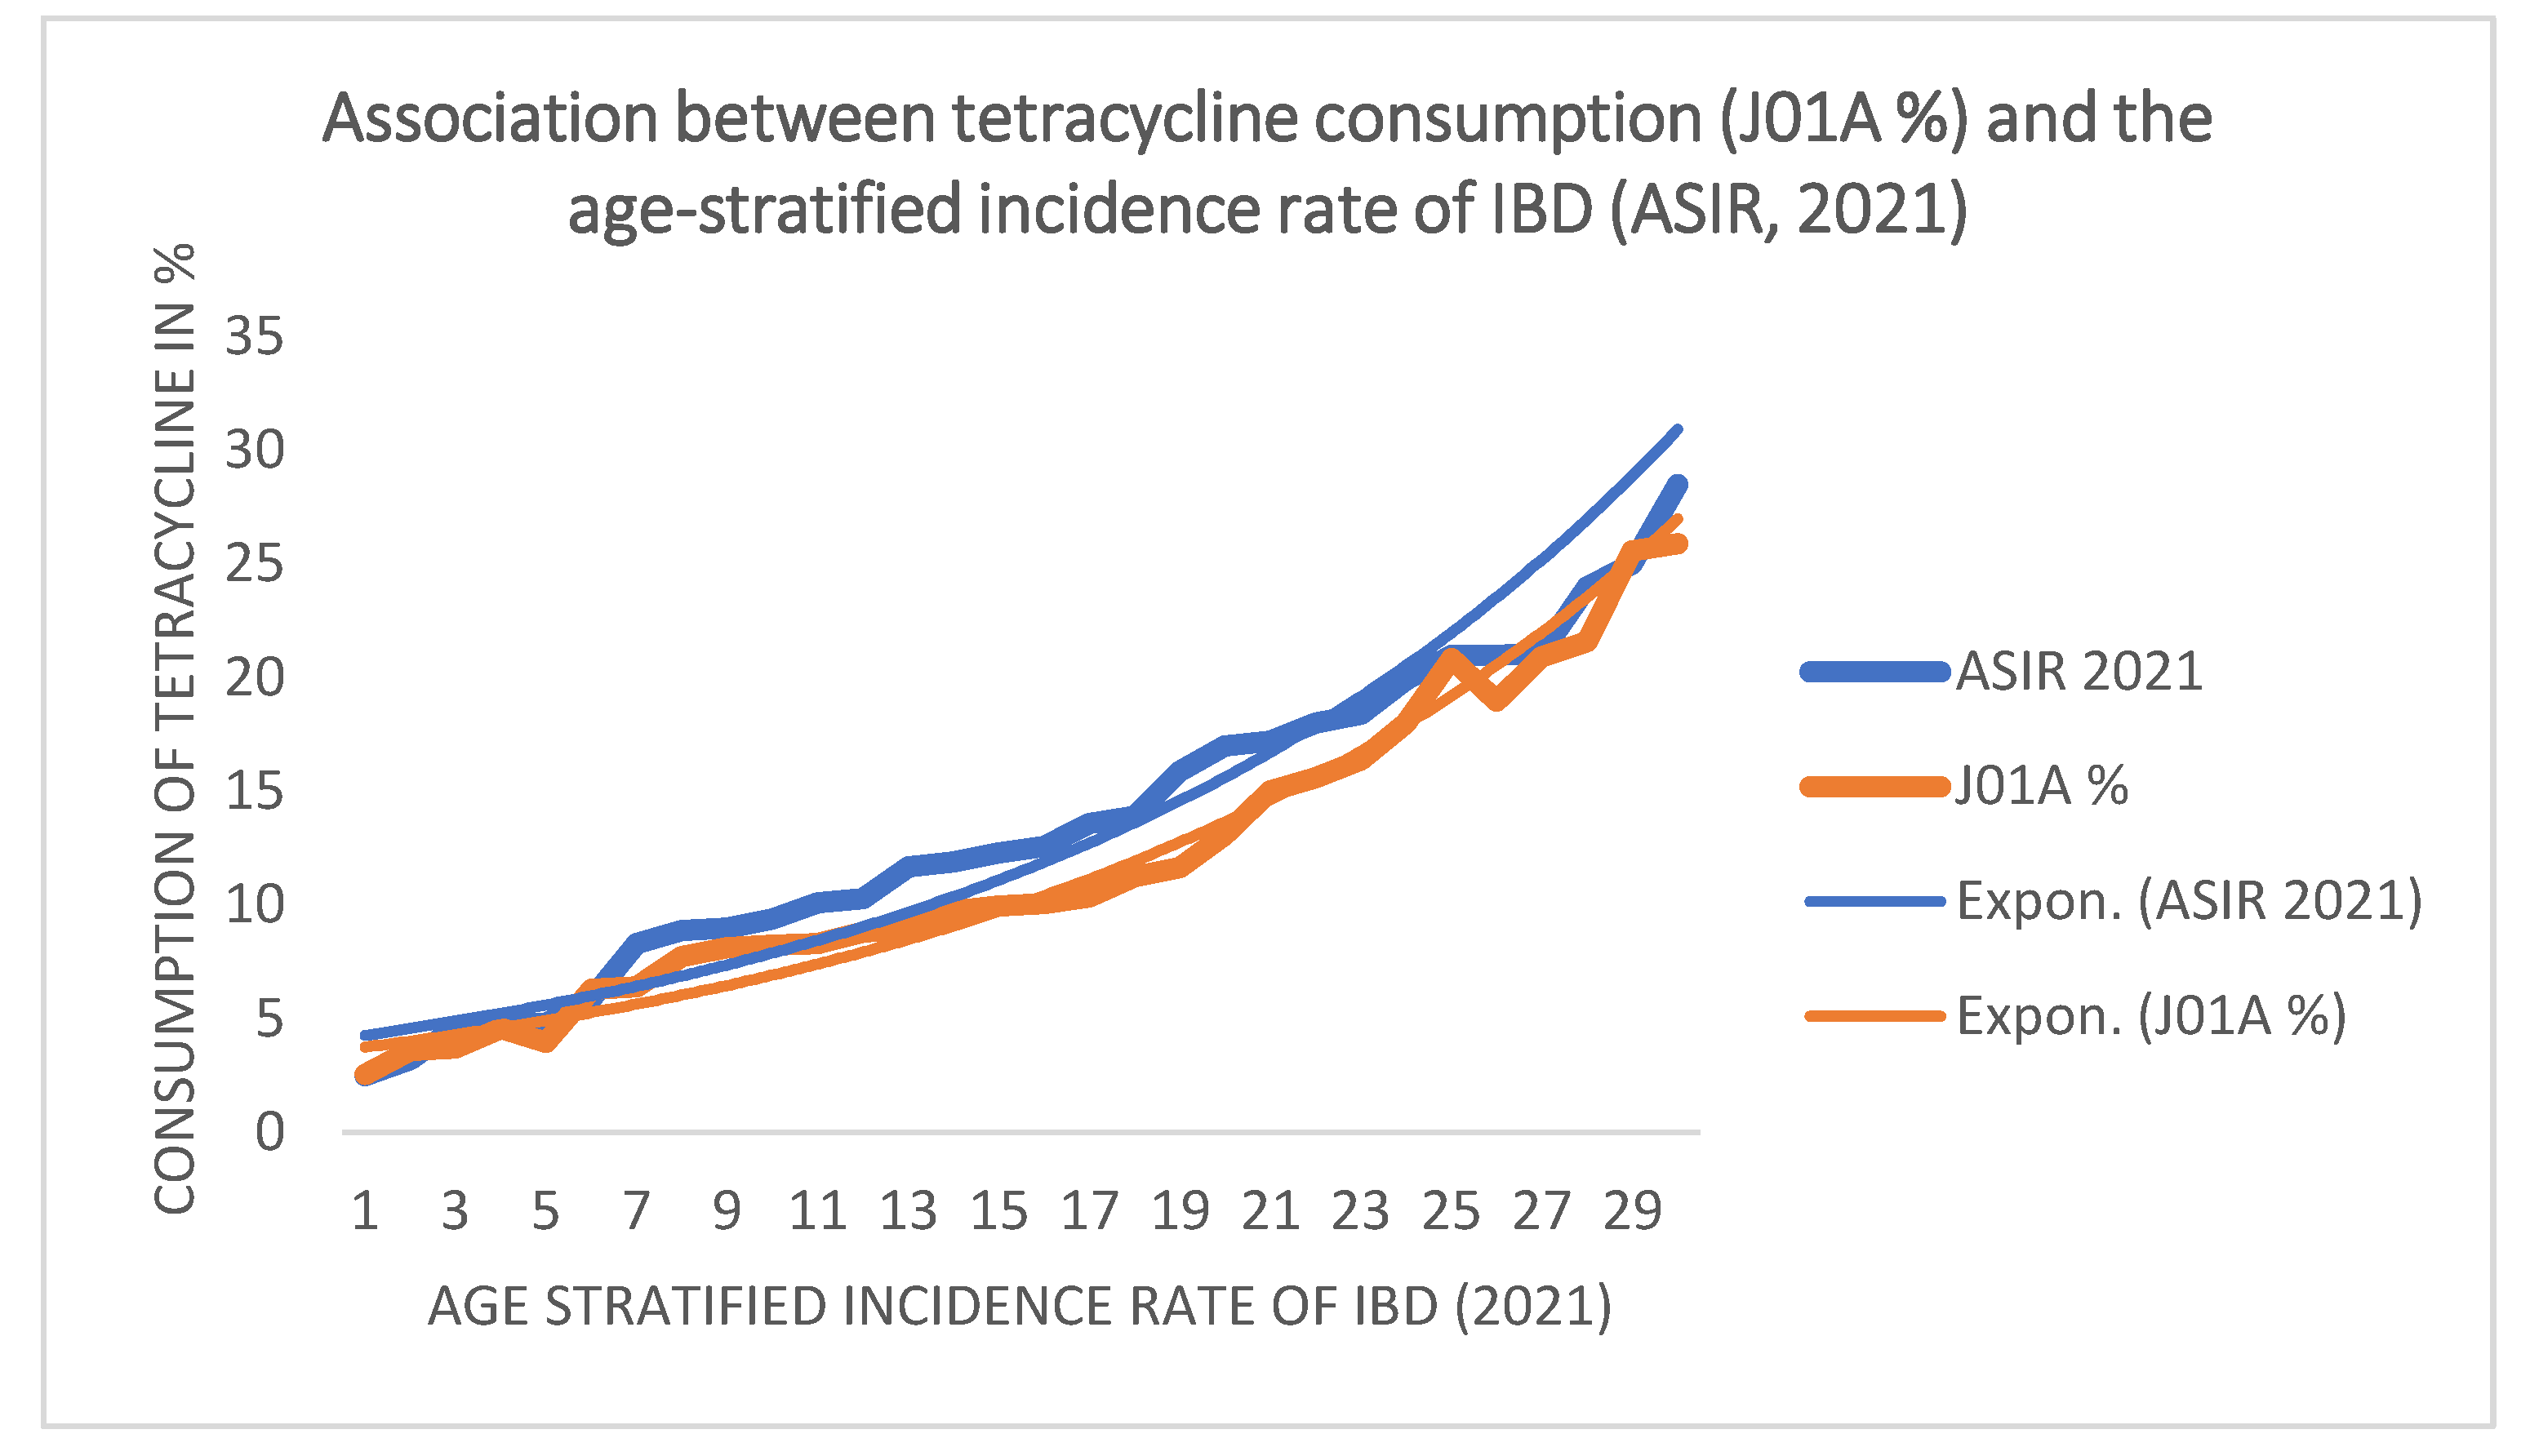
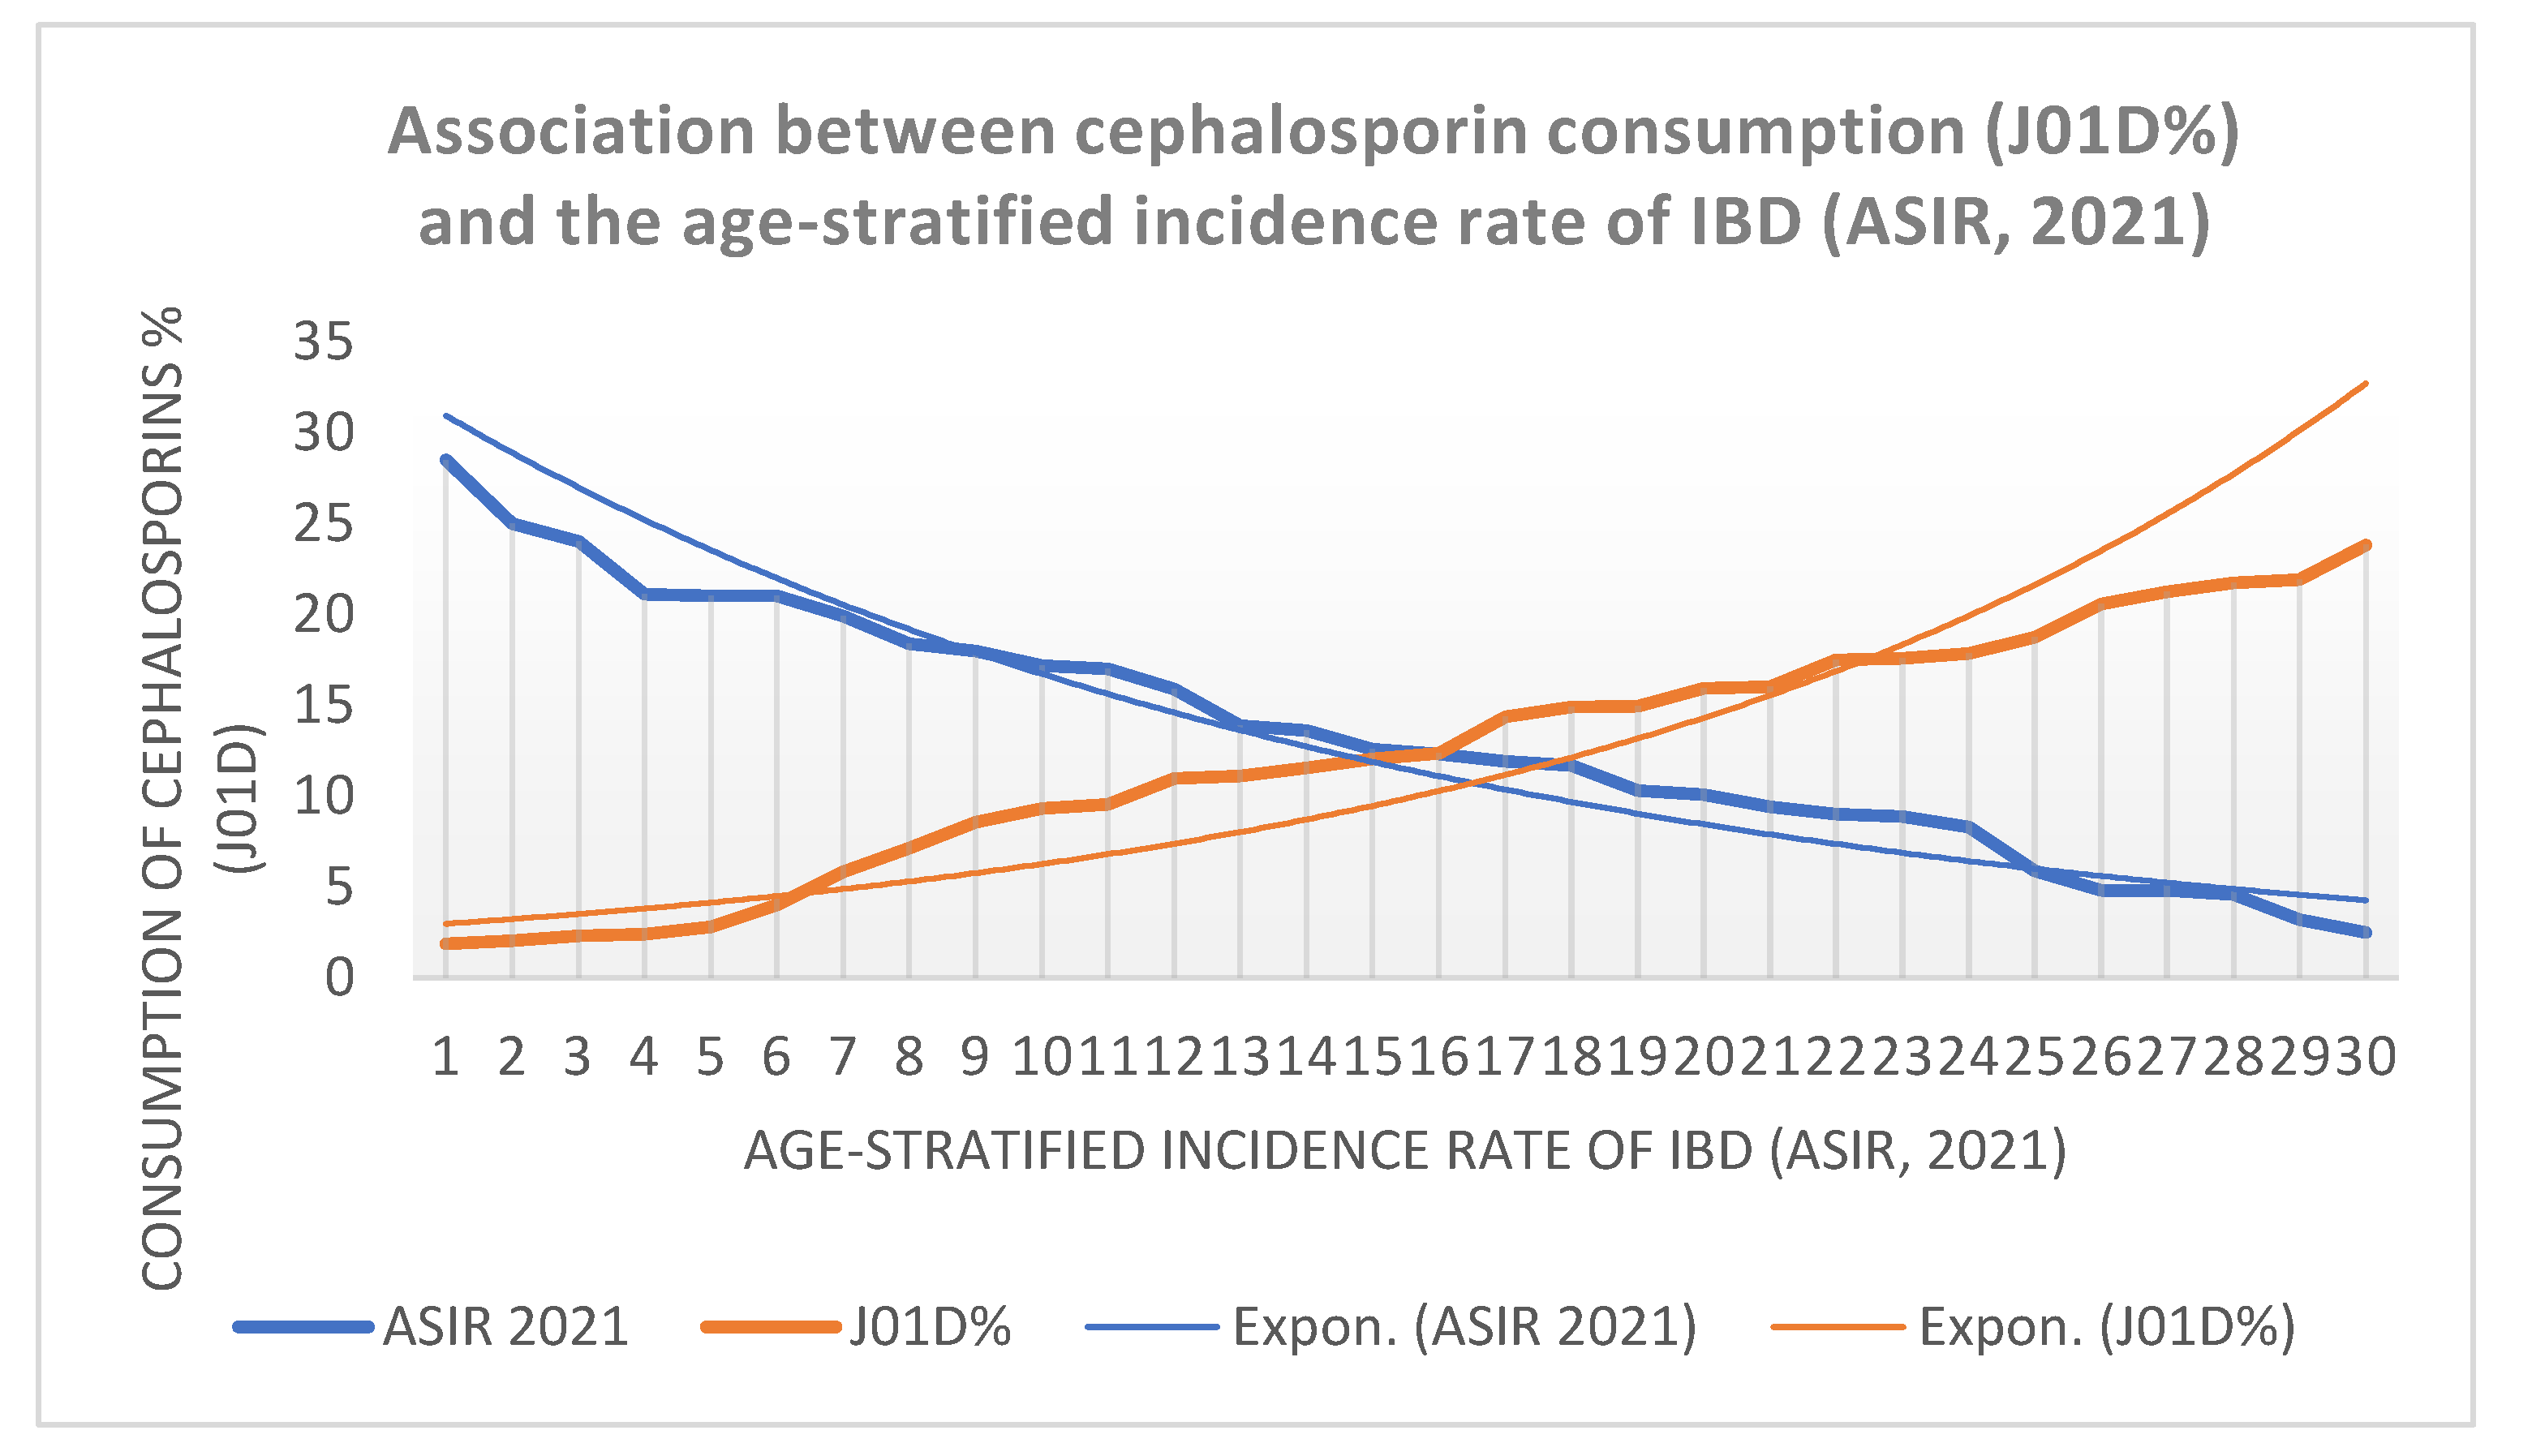
The predominant forms of inflammatory bowel disease (IBD) are Crohn's disease and ulcerative colitis, which occur in approximately 0.5-1% of the World population. Alterations in the microbial flora (dysbiosis) are considered the primary precipitating factor in IBD. Because antibiotics are major disruptors of the microbiome, it was hypothesized that different antibiotic classes might induce distinct alterations in gut flora, reflected in positive or negative associations with IBD incidence at the population level. Average yearly consumption was calculated from ECDC reports (2004-2023) for the major antibiotic classes, which cover 99.87% of total antibiotic consumption across 30 European countries. Data were compared with age-stratified IBD incidence (15–39 years) estimated for 2021. Ordinal logistic regression modeled the association between antibiotic class proportions and IBD-incidence categories, entering each antibiotic class separately as a continuous predictor. Pearson correlation analyses were conducted to assess linear associations, and Kruskal-Wallis tests were applied to compare incidence categories. Statistical significance was set at p < 0.05. Tetracyclines (J01A), narrow-spectrum penicillin (J01CE, J01CF), and sulfonamides (J01E) showed a significant positive association with IBD incidence, indicating that higher consumption was associated with higher national incidence. In contrast, cephalosporins, macrolides, aminoglycosides, and quinolones showed significant negative associations, suggesting links to lower national incidence levels. Different antibiotic consumption patterns across 30 European countries may be associated with the IBD incidence.

Keywords: 
;  ;  ;  ;  

1. Introduction

Inflammatory bowel disease (IBD) refers to diseases that cause chronic inflammation in the gastrointestinal (GI) tract. Symptoms include abdominal pain, diarrhea (often with blood), fatigue, and unintended weight loss, though they can vary depending on the disease's severity and location. Symptoms include abdominal pain, diarrhea, and weight loss, which can come and go in periods of flare-up and remission. Crohn's disease can develop anywhere along the digestive tract from the mouth to the anus, whereas ulcerative colitis is restricted to the large intestine. These diseases are non-communicable and incurable, affecting millions of people worldwide. Usually, IBD is considered a Western disease. By the 21st century, emerging industrialized nations in Asia and Latin America had experienced a rapid increase in cases, making inflammatory bowel disease a global issue (1, 2). Patients with IBD might produce a variety of symptoms that are different in UC and CD; however, frequent symptoms include persistent abdominal pain, diarrhea (with or without blood), weakness, and weight loss. IBD’s clinical manifestations are characterized by recurrent episodes of gastrointestinal tract inflammation caused by an abnormal immune response to gut microflora. Ulcerative colitis (UC) generally presents itself as bloody diarrhea with or without mucus. Patients frequently complain of tenesmus, a sensation of incomplete evacuation, and abdominal pain. On physical exam, the patients complain of feeling predominantly left lower or left upper quadrant abdominal pain. In more severe cases, signs of an acute abdomen may develop, including guarding, rebound tenderness, or percussion tenderness, warranting investigation for toxic megacolon. The clinical manifestations of Crohn's disease (CD) vary considerably depending on the anatomical location of gastrointestinal involvement. Manifestations differ depending on the underlying inflammation, fistula formation, or the development of strictures. The symptom complex of right lower quadrant pain, weight loss, and non-bloody diarrhea is suggestive of Crohn's disease flare-up. Fistula formation can appear as fecaluria, pneumaturia, and rectovaginal fistula development. Masses in the right lower quadrant are generally related to abscess formation. Children with CD may present with growth retardation and delayed sexual maturation (3-5). The incidence of IBD has risen in the past decades, and now it is a global issue and not only a “Western” disease. Approximately 1.3 million people in Europe suffer from inflammatory bowel disease (IBD), which is about 0.2% of the population, but its rate varies by geographical regions. IBD incidence ranges from 10.5 to 46.14 per 100,000 in Europe. Crohn’s disease [CD] incidence ranged from 4.1 to 22.78 per 100,000 in Europe, and ulcerative colitis [UC] estimates ranged from 3.0 to 23.36 per 100,000 in Europe. Northern European countries and the UK show the highest rates of UC, while southern and eastern European countries historically have lower rates, though these are increasing. The UK has the highest prevalence rate with 570/100000 inhabitants, followed by Denmark (530/100000) and Norway (503/100000). The lowest prevalence rates were reported from Portugal (1,6/100000) and Romania (2,42/100000). The prevalence of Crohn's disease in Europe ranges from approximately 61.6 to 178 per 100,000 people (6, 7). Genetic analyses have identified more than 200 genes associated with an increased risk of developing IBD, but most of the associations are relatively weak. Twins studies indicate a concordance rate of around 4% for dizygotic pairs. In contrast, concordance rates for monozygotic twins have been reported as 50% with higher rates among pairs with Crohn's disease than pairs with ulcerative colitis. Among pairs with Crohn's disease, the majority have disease in the exact location of the bowel (8). The single greatest known risk factor for developing IBD is having a close family member with IBD, which might raise the possibility, apart from genetics, that the “transfer” of the IBD-related microbiome also occurs (9). It is observed that about 5% and 23% of people with IBD have a first-degree relative with IBD. Among families with multiple affected family members, there appears to be a high degree of clinical similarity in disease location, disease behavior, age at diagnosis, and the presence and character of extra-intestinal manifestations (10). Reports on the environmental risk factors for IBD indicated that maternal smoking, early life antibiotic exposure, otitis media, living in urban area (for CD), adult smoking (for CD), longer NSTAID drugs taking, combined oral contraceptives, hormonal medical treatment, adult antibiotic exposure, carnivorous diet, and consuming ultra-processed foods (UBD) augment the possibility of developing CD, but not UC. Breastfeeding up to 12 months, higher consumption of vegetables and fish, exposure to farm animals, bed sharing, fruit and vegetables (UC), fiber intake (CD), appendectomy (UC), tobacco smoking (UC), presence of Helicobacter pylori, and Mediterranean diet are considered protective factors. The opposite effect of smoking for CD (aggravating the symptoms) and UC (ameliorating the disease process) is well known, but no appropriate explanation exists. Reports also indicate the role of psychological factors in the development of IBD (6, 11). Inflammatory bowel diseases arise from a convergence of genetic risk, environmental factors, and gut microbiota, where each is necessary but not sufficient alone to cause disease. However, environmental factors (diet, antibiotics, etc.) can influence the composition of gut flora by promoting or inhibiting the proliferation of different microbial taxa. The pro-colitogenic effects of intestinal dysbiosis and the amelioration of the inflammatory burden through fecal microbiota transplantation are well established.

2. Concept/working hypothesis:

Considerable scientific knowledge accumulated over the past decades suggests that the principal driving force in the development of inflammatory bowel diseases (UC, CD) is pro-inflammatory dysbiosis, which arises from various external factors in (probably) genetically susceptible individuals. Different diets either promote (ultra-processed food) or protect (Mediterranean diet) the development of IBD. Antibiotic exposure, particularly at early ages, is considered a risk factor for the development of IBD. Still, different antibiotic classes, depending on the susceptibility of the intestinal microbial taxa, may either promote or inhibit the growth of IBD-related dysbiosis. Antibiotic consumption reports (ECDC) from the 30 European countries included in the study indicate manifold differences in the average yearly consumption of different antibiotic classes, expressed in Defined Daily Dose/1000 inhabitants/Day (DID). The consumption of narrow-spectrum, beta-lactamase-sensitive penicillin (J01CE), calculated as an average yearly consumption, is highest in Denmark (27.733 DID) and lowest in Italy (0.009 DID). The highest average annual cephalosporin consumption was reported in Greece (23.814 DID), and the lowest in the UK (2.067). It is hypothesized that if the consumption of any antibiotic group shows a significant positive statistical association with the incidence of IBD, it might indicate that higher use of that class is linked to an increased likelihood of belonging to a higher IBD-incidence category. In contrast, a significant negative association may suggest that greater consumption of a given antibiotic class is associated with a higher probability of belonging to a lower IBD-incidence category, potentially reflecting differing impacts on gut flora. Countries with higher consumption of antibiotic classes that show positive associations might report higher IBD incidence. In contrast, increased use of classes that show negative associations may correspond to lower IBD incidence.

3. Objective

Identification of antibiotic classes that show positive or negative statistical association with the IBD incidence (ASIR 2021), which might promote or inhibit the IBD-related dysbiosis.

4. Materials and methods

An average yearly antibiotic consumption database was developed on antibiotic consumption in 30 European countries from the ECDC annual reports of 2004-2023 (twenty years) accessed in August 2025 (https://www.ecdc.europa.eu/en/publications-data/antimicrobial-consumption-eueea-esac-net-annual-epidemiological-report-2023 ). Total antibiotic consumption (public, hospital) was recorded for the countries included in the study for each year (2004-2023, twenty years) to calculate the yearly average consumption. The ECDC reports included 15 antibiotic categories, expressed as Defined Daily Dose/1000 Inhabitants/Day (DID), coded according to the ATC classification at level II. and III. https://qap.ecdc.europa.eu/public/extensions/AMC2_Dashboard/AMC2_Dashboard.html#eu-consumption-tab
Antibiotic categories (codes): Total systemic antibiotics: J01, tetracyclines: J01A, amphenicols: J01B, penicillin group (all): J01C, broad spectrum, beta-lactamase susceptible penicillin: J01CA, narrow spectrum, beta-lactamase susceptible penicillin: J01CE, narrow spectrum, beta-lactamase resistant, narrow spectrum penicillin: J0CF, broad spectrum, beta-lactamase resistant combination penicillin: J01CR, cephalosporin: J01D, sulfonamides: J01E, macrolides and lincomycin: J01F, aminoglycosides: J01G, quinolones: J01M, antibiotic combinations: J01R, other antibiotics: J01X, which includes glycopeptides, polymyxines, steroid antibacterials, imidazole derivates, nitrofurantoin derivates, fusidic acid etc. The average yearly total antibiotic consumption (J01, in DID) was calculated as 587. 226 DID for the 30 countries. The highest consumption was reported from the UK (41.961 DID), and the lowest from the Netherlands (9.917). Several differences in antibiotic consumption were observed across European countries. The Nordic countries preferred different narrow-spectrum penicillins, whereas in the Mediterranean countries, broad-spectrum antibiotics were predominantly used (Table 1). To develop the antibiotic database for comparison, we calculated the relative share of antibiotic consumption across different classes from the total amount (J01, DID) and expressed it as a percentage (%). Antibiotic groups of very low consumption (below 0.5 DID/year: amphenicols /J01B/ and combinations /J01R/) were left out of the calculation. The remaining amount covered the 99,87% of the average total yearly consumption. The database on the incidence rate of IBD in 2021 was extracted from the Global Burden of Disease (GBD) study 2021, and the age-standardized incidence rate/100,000 inhabitants (ASIR) for 2021, as reported by Chen L et al. The database included data on young people aged 15-39 years, for whom IBD occurs more frequently (12, 13). The results were featured in Table 1. The highest incidence of IBD (age-stratified incidence rate: ASIR 2021) among young people was reported in the Netherlands (28.5/100000 inhabitants), and the lowest in Romania (2.5/100000 inhabitants). The results were categorized into three ordinal groups (low, medium, and high incidence) based on tertiles of the overall distribution: Group 1 = IBD incidence < 9.867, Group 2 = IBD incidence >= 9.867 and < 17.067, and Group 3 = IBD incidence >= 17.067. Statistics: Pearson correlation coefficients were first calculated to assess the bivariate relationships between each antibiotic class and IBD incidence. Ordinal logistic regression was performed to model the association between antibiotic class proportions and IBD incidence category. Each antibiotic class was entered separately into the model as a continuous independent variable. This approach was chosen to avoid multicollinearity among antibiotic courses, as these variables represent mutually dependent components of total antibiotic consumption. A positive association indicated higher odds of belonging to a higher IBD-incidence category with increasing antibiotic consumption, whereas a negative association indicated higher odds of belonging to a lower IBD-incidence category. The regression models estimated odds ratios (OR) with corresponding 95% confidence intervals (95% CI) and p-values. Non-parametric tests were used due to violations of normality and homogeneity of variance, as assessed by the Shapiro-Wilk and Levene’s tests. Therefore, differences in antibiotic consumption patterns across IBD incidence categories were examined using the Kruskal-Wallis test, followed by Dunn’s test with the Dwass-Steel-Critchlow-Fligner (DSCF) correction for pairwise post-hoc comparisons. Model performance was evaluated using likelihood-ratio tests, and the proportional odds assumption was checked where applicable. Statistical significance was set at p < 0.05. Pearson correlation coefficients were reported alongside regression outputs and the results of the non-parametric tests for comparative interpretation. All analyses were performed using Jamovi (version 2.3.28.0) statistical software.

5. Results

In the 30 European countries analyzed, average annual antibiotic consumption varied considerably by class. Pearson correlation analyses identified positive associations between the proportional use of tetracyclines (J01A, r = 0.519, p = 0.003), narrow spectrum, beta-lactamase–sensitive penicillin (J01CE, r = 0.465, p = 0.010), narrow spectrum, beta-lactamase–resistant penicillin (J01CF, r = 0.503, p = 0.005), and sulfonamides (J01E, r = 0.424, p = 0.020) with IBD incidence. In contrast, cephalosporins (J01D, r = –0.478, p = 0.008), macrolides (J01F, r = –0.337, p = 0.068), aminoglycosides (J01G, r = –0.524, p = 0.003), and quinolones (J01M, r = –0.452, p = 0.012) demonstrated inverse correlations. Other antibiotic classes did not show significant associations (Table 1).
The results of univariate ordinal logistic regression analyses paralleled these patterns. Higher consumptions of tetracycline: J01A (OR = 1.215, 95% CI [1.074-1.412]), narrow-spectrum, beta-lactamase-sensitive penicillin: J01CE (OR = 1.223, 95% CI [1.065-1.513]), narrow-spectrum, beta-lactamase resistant penicillin: J01CF (OR = 1.715, 95% CI [1.234-2.779]) and sulfonamides: J01E (OR = 1.555, 95% CI [1.062-2.399]) were associated with increased odds of belonging to higher IBD-incidence categories, respectively. On the other hand, higher consumptions of cephalosporin: J01D (OR = 0.843, 95% CI [0.742-0.943]), macrolides: J01F (OR = 0.795, 95% CI [0.652-0.936]), aminoglycosides: J01G (OR = 0.041, 95% CI [0.002-0.314]), and quinolones: J01M (OR = 0.772, 95% CI [0.609-0.944]) were associated with lower odds of higher IBD incidence. (Table 1.) These trends were visualized in a forest plot summarizing odds ratios and 95% confidence intervals across all antibiotic classes (Figure 1) and in diagrams (Figure 2 and Figure 3).
Non-parametric Kruskal–Wallis tests confirmed significant differences in antibiotic consumption across IBD incidence categories for multiple classes, including J01A, J01C, J01CE, J01CF, J01CR, J01D, J01E, and J01 G. Post-hoc pairwise comparisons using the DSCF method revealed that the most significant differences were between low- vs high-incidence groups (G1 vs G3) and medium- vs high-incidence groups (G2 vs G3) (Table 1). For example, J01A consumption differed significantly between G1 and G3 (p = 0.018) and G2 vs G3 (p = 0.006), while J01CF showed differences between G1 vs G2 (p = 0.034) and G2 vs G3 (p = 0.003).
Overall, results demonstrate a consistent pattern: certain antibiotic classes, particularly those targeting Gram-positive bacteria, were positively associated with higher IBD incidence, whereas classes with broader Gram-negative activity were inversely associated, with some overlap.

6. Discussion

The possible role of the gut microbiome in the development of inflammatory bowel diseases (IBD) was first raised over 20 years ago through the process of dysbiosis, an imbalance of gut bacteria that leads to reduced diversity and an increase in pro-inflammatory microbes (14). Early efforts to correct microbiome composition through fecal microbiota transplantation and achieve clinical remission had also been reported (15). The role of the gut microbiota in the establishment and maintenance of health, and in the pathogenesis of different diseases, including IBD, has also been identified over the past two decades. The gut microbiota interacts with the host through metabolites, small molecules produced as intermediates or end products of microbial metabolism. These metabolites can arise from bacterial metabolism of dietary substrates, modification of host molecules, such as bile acids, or directly from bacteria (16). In healthy adults, Firmicutes and Bacteroidetes are the predominant phyla in the intestines, with Proteobacteria and Actinobacteria accounting for the majority of the remaining bacteria (17). The possible roles of viruses and plant metabolites have also been considered (18). The most crucial change observed in IBD-related dysbiosis is the significant reduction of the diversity of microbiome, with the decrease in taxa with anti-inflammatory or protective properties like Lachnospiraceae, Bifidobacterium, Faecalibacterium prausnitzii, Roseburia species, Bacteroides, and the proliferation of the pro-inflammatory Proteobacteria, Fusobacterium species, and Ruminococcus gnavus species has also been observed. Biopsy specimens from the ileum and the rectum showed similar dysbiosis, but the biopsy and fecal isolates were not identical (19). Firmicutes and Bacteroides, together, constitute approximately 90% of gut microbiota and are key producers of short-chain fatty acids (SCFAs). Bacterial ‘dysbiosis’ in IBD has been typically characterized by an increased ratio of potentially pathogenic to beneficial bacteria and lower overall diversity. Recently, the focus of microbiome research has shifted from microbial composition to the functional properties of specific bacterial species and strains. Comprehensive multi-omics investigations have elucidated the composition of bacterial species and their metabolic profiles in patients with IBD, enabling more accurate detection of alterations in bacterial ecology that coincide with disease initiation and progression. An extensive, detailed review summarizes the roles of different microbial metabolites and their interactions with the immune system (20). A multi-omics study of UC patients indicated that B. vulgatus proteases are associated with UC disease activity, and this observation has also been confirmed in animal experiments (21). The mechanisms by which the microbiota damages the intestinal epithelial barrier are complex and remain a subject of study (22). Several risk factors are considered for the development of IBD. However, the decisive role in the development of IBD is the modification of the microbiome, because external factors can induce dysbiosis, which may act as a "risk factor" for IBD or have a "protective" effect against its development (23). The crucial role of the microbiome in the development of IBD or in the amelioration of symptoms is further supported by fecal microbiota transfer (FMT) experiments (24). Fecal microbiota transplantation from healthy donors induced clinical remission and endoscopic improvement in active ulcerative colitis (UC) and is associated with distinct microbial changes that relate to outcome (25). The clinical symptoms of Crohn's disease had also been ameliorated after using FMT (26). By restoring microbial diversity and correcting dysbiosis, FMT offers a novel, microbiota-targeted alternative to conventional therapies. While data support its efficacy in improving disease remission, variability in outcomes underscores the need for standardized protocols and additional large-scale, controlled studies (27). The role of antibiotics in the development of IBD and their use as therapeutic agents are controversial. A combination of amoxicillin, metronidazole, and tetracycline was reported to be beneficial in a limited number of steroid-resistant UC patients without a control group (28, 29). An extensive study from Denmark reported that antibiotic use is a risk factor, with practically all antibiotic classes identified as risk factors, except nitrofurantoin. A meta-analysis of publications reporting on the association of antibiotic use and the development of IBD confirmed that antibiotic exposure could be considered a risk factor for IBD. This study was based on prescription analyses and questionnaires. They concluded that almost all antibiotic classes were associated with increased IBD risk, and the extent of the risk varied across classes (30). Recent reports indicate a significant shift in healthy gut flora even before IBD diagnosis (31). These changes include a general decrease in microbial diversity, a reduction in beneficial bacteria like Faecalibacterium and Ruminococcaceae, and an increase in potentially harmful bacteria such as Enterobacteriaceae and Fusobacterium (32).

Conclusion

The role of the altered microbiome (dysbiosis) in the development of various diseases, including IBD, is well known and has been reported in several publications, as included in the references. The most significant microbiome-disrupting agents that cause dysbiosis are antibiotics, which enter the human body either as therapeutic agents or as environmental pollutants through drinking water or the food chain. Our research focused on identifying potential antibiotic classes associated with higher or lower IBD incidence and on estimating their possible role in IBD development across 30 European countries. The results of our statistical analysis were further strengthened by the observation that the list of the countries with the highest top 10 of IBD prevalence showed similar rank order (7 out of 10), with the rank order of the antibiotic classes showing positive associations, and the lowest 10 consumption group of the antibiotic classes showing negative associations (5-8 out of 10) (Table 2.). Our findings highlight the possibility that antibiotic consumption patterns from 30 European countries might influence the incidence of IBD.
Limitations of our study: Our comparative analysis of antibiotic consumption and IBD prevalence cannot be interpreted at the individual level because we lacked individual-level data on antibiotic use.
Strength of the study: The comparison of large databases and the extensive statistical analysis of the results clearly indicate that antibiotic consumption patterns may drive IBD development by altering the microbiome.
Author contribution:
Gábor Ternák: Conceptualization, Data curation, Formal Methodology, Writing original draft
Gergely Márovics: Statistics, Conceptualization, Data curation, Writing – review & editing
István Kiss: Conceptualization, Writing – review & editing
Financial Support: No funding/sponsorship was required for this study.
Potential Competing Interest: Gábor Ternák is a retired Professor at the University of Pécs, School of Medicine, Hungary, and declared no competing interests. Gergely Márovics is a senior researcher at the University of Pécs, Medical School, Department of Public Health Medicine, Hungary, and declared no competing interests. István Kiss is the Head Professor at the University of Pécs, Medical School, Department of Public Health, and declared no potential interest.

References

  1. Ng, SC; Shi, HY; Hamidi, N; Underwood, FE; et al. Worldwide incidence and prevalence of inflammatory bowel disease in the 21st century: a systematic review of population-based studies. Lancet 2017, 390(10114), 2769–2778. [Google Scholar] [CrossRef]
  2. Rosen, MJ; Dhawan, A; Saeed, SA; et al. Inflammatory Bowel Disease in Children and Adolescents. JAMA Pediatr 2015, 169(11), 1053–60. [Google Scholar] [CrossRef]
  3. Rubin, DT; Ananthakrishnan, AN; Siegel, CA. Clinical Guideline: Ulcerative Colitis in Adults. Am J Gastroenterol 2019, 114(3), 384–413. [Google Scholar] [CrossRef]
  4. Lichtenstein, GR; Loftus, EV; Isaacs, KL; et al. ACG Clinical Guideline: Management of Crohn's Disease in Adults. Am J Gastroenterol 2018, 113(4), 481–517. [Google Scholar] [CrossRef] [PubMed]
  5. McDowell, C; Farooq, U; Haseeb, M. Inflammatory Bowel Disease. In StatPearls [Internet]; StatPearls Publishing: Treasure Island (FL), 4 Aug 2023; Available online: https://www.ncbi.nlm.nih.gov/books/NBK470312/.
  6. Caron, B; Honap, S; Peyrin-Biroulet, L. Epidemiology of Inflammatory Bowel Disease across the Ages in the Era of Advanced Therapies. J Crohns Colitis 2024, 18 Supplement_2, ii3–ii15. [Google Scholar] [CrossRef] [PubMed]
  7. Bruner, LP; White, AM; Proksell, S. Inflammatory Bowel Disease. Prim Care Epub. 2023, 50(3), 411–427. [Google Scholar] [CrossRef] [PubMed]
  8. Borowitz, SM. The epidemiology of inflammatory bowel disease: Clues to pathogenesis? Front Pediatr 2023, 10, 1103713. [Google Scholar] [CrossRef]
  9. Halfvarson, J; Ludvigsson, JF; Bresso, F; et al. Age determines the risk of familiar inflammatory bowel disease – a nationwide study. Alim Pharmacol Ther. 2022, 56, 491–500. [Google Scholar] [CrossRef]
  10. Halfvarson, J. Genetic epidemiology of inflammatory bowel disease, early twin and family studies. In Molecular genetics of inflammatory bowel disease, 2nd ed.; Hedin, C, Rioux, JD, M D’Amato, Eds.; Springer Nature Switzerland: Cham, 2019; pp. 25–46. [Google Scholar]
  11. Agrawal, M; Sabino, J; Frias-Gomes, C; et al. Early life exposures and the risk of inflammatory bowel disease: Systematic review and meta-analyses. EClinicalMedicine 2021, 36, 100884. [Google Scholar] [CrossRef]
  12. Lin, D; Jin, Y; Shao, X; et al. Global, regional, and national burden of inflammatory bowel disease, 1990-2021: Insights from the global burden of disease 2021. Int J Colorectal Dis. 2024, 39(1), 139. [Google Scholar] [CrossRef]
  13. Chen, L; Xu, Y; Ai, F; et al. Dissecting the rising tide of inflammatory bowel disease among youth in a changing world: insights from GBD 2021. Int J Colorectal Dis. 2025, 40(1), 44. [Google Scholar] [CrossRef]
  14. Swidsinski, A; Ladhoff, A; Pernthaler, A; et al. Mucosal flora in inflammatory bowel disease. Gastroenterology 2002, 122(1), 44–54. [Google Scholar] [CrossRef] [PubMed]
  15. West, CE; Renz, H; Jenmalm, MC. in-FLAME Microbiome Interest Group. The gut microbiota and inflammatory noncommunicable diseases: associations and potentials for gut microbiota therapies. J Allergy Clin Immunol 2015, 135(1), 3–13; quiz 14. [Google Scholar] [CrossRef]
  16. Lavelle, A; Sokol, H. Gut microbiota-derived metabolites as key actors in inflammatory bowel disease. Nat Rev Gastroenterol Hepatol 2020, 17(4), 223–237. [Google Scholar] [CrossRef]
  17. Jandhyala, SM; Talukdar, R; Subramanyam, C; et al. Role of the normal gut microbiota. World J Gastroenterol 2015, 21(29), 8787–8803. [Google Scholar] [CrossRef]
  18. Rahaman, MM; Wangchuk, P; Sarker, S. A systematic review on the role of gut microbiome in inflammatory bowel disease: Spotlight on virome and plant metabolites. Microb Pathog 2025, 205, 107608. [Google Scholar] [CrossRef] [PubMed]
  19. Dalal, SR. The Microbiome and Inflammatory Bowel Diseases. Surg Clin North Am 2025, 105(5), 941–951. [Google Scholar] [CrossRef]
  20. Iliev, ID; Ananthakrishnan, AN; Guo, CJ. Microbiota in inflammatory bowel disease: mechanisms of disease and therapeutic opportunities. Nat Rev Microbiol 2025, 23(8), 509–524. [Google Scholar] [CrossRef]
  21. Mills, RH; Dulai, PS; Vázquez-Baeza, Y. Multi-omics analyses of the ulcerative colitis gut microbiome link Bacteroides vulgatus proteases with disease severity. Nat Microbiol 2022, 7(2), 262–276. [Google Scholar] [CrossRef]
  22. Foppa, C; Rizkala, T; Repici, A; et al. Microbiota and IBD: Current knowledge and future perspectives. Dig Liver Dis. 2024, 56(6), 911–922. [Google Scholar] [CrossRef] [PubMed]
  23. Agrawal, M; Allin, KH; Petralia, F; et al. Multiomics to elucidate inflammatory bowel disease risk factors and pathways. Nat Rev Gastroenterol Hepatol 2022, 19(6), 399–409. [Google Scholar] [CrossRef] [PubMed]
  24. Yadegar, A; Bar-Yoseph, H; Monaghan, TM; et al. Fecal microbiota transplantation: current challenges and future landscapes. Clin Microbiol Rev.;Epub 2024, 37(2), e0006022. [Google Scholar] [CrossRef] [PubMed] [PubMed Central]
  25. Paramsothy, S; Kamm, MA; Kaakoush, NO; et al. Multidonor intensive faecal microbiota transplantation for active ulcerative colitis: a randomised placebo-controlled trial. Lancet 2017, 389, 1218–28. [Google Scholar] [CrossRef] [PubMed]
  26. Fehily, SR; Wright, EK; Basnayake, C; et al. Faecal microbiota transplantation in Crohn's disease: an Australian randomised placebo-controlled trial protocol. BMJ Open 2025, 15(4), e094714. [Google Scholar] [CrossRef]
  27. Lahoud, C; Habib, T; Kalta, D; et al. Intestinal Microbiota and Fecal Transplantation in Patients with Inflammatory Bowel Disease and Clostridioides difficile: An Updated Literature Review. J Clin Med. 2025, 14(15), 5260. [Google Scholar] [CrossRef]
  28. Koido, S; Ohkusa, T; Kajiura, T; et al. Long-term alteration of intestinal microbiota in patients with ulcerative colitis by antibiotic combination therapy. PLoS One 2014, 9, e86702. [Google Scholar] [CrossRef] [PubMed]
  29. Faye, AS; Allin, KH; Iversen, AT; et al. Antibiotic use as a risk factor for inflammatory bowel disease across the ages: a population-based cohort study. Gut 2023, 72(4), 663–670. [Google Scholar] [CrossRef]
  30. Duan, R; Zhang, C; Li, G; et al. Antibiotic Exposure and Risk of New-Onset Inflammatory Bowel Disease: A Systematic Review and Dose-Response Meta-Analysis. Clin Gastroenterol Hepatol;Epub 2025, 23(1), 45–58.e15. [Google Scholar] [CrossRef] [PubMed]
  31. Boppana, K; Almansouri, NE; Bakkannavar, S; et al. Alterations in Gut Microbiota as Early Biomarkers for Predicting Inflammatory Bowel Disease Onset and Progression: A Systematic Review. Cureus 2024, 16(4), e58080. [Google Scholar] [CrossRef]
  32. San-Martin, MI; Chamizo-Ampudia, A; Sanchiz, Á; et al. Microbiome Markers in Gastrointestinal Disorders: Inflammatory Bowel Disease, Colorectal Cancer, and Celiac Disease. Int J Mol Sci 2025, 26(10), 4818. [Google Scholar] [CrossRef]
Figure 1. Forest plot showing the results (OR) of the ordinal regression model with the corresponding 95% CI.
Preprints 193673 g001
Figure 2. Positive association between tetracycline consumption and the prevalence of IBD (ASIR, 2021).
Preprints 193673 g002
Figure 3. Inverse association between cephalosporin consumption and the incidence of IBD (ASIR, 2021).
Preprints 193673 g003
Table 1. The average total yearly systemic antibiotic consumption (J01, 2004-2023, 20 years) expressed in defined daily dose/1000 inhabitants/day (DID) in 30 European countries, and the consumption of antibiotic classes is described as a relative share in percentage (%) of the total systemic consumption (J01) with the IBD age-standardized incidence rates (ASIR). The table also shows the results of the statistical analyses.
Average, yearly antibiotic consumption (2004-2023, 20 years) expressed in defined daily dose/1000 inhabitants/day (did) in 30 European countries. IBD incidence
Countries J01 J1A % J01C% J01CA% J01CE% J01CF% J01CR% J01D% J01E% J01F% J01G% J01M% J01X% ASIR 2021
Austria 10.193 3.726 47.435 8.219 4.060 0.704 34.880 15.933 2.519 18.670 0.245 7.291 4.209 13.600
Belgium 22.537 8.829 45.889 19.787 0.442 1.599 24.086 8.575 1.169 14.330 0.208 10.307 11.520 12.300
Bulgaria 20.213 10.362 29.583 17.131 1.446 0.002 10.877 21.720 4.276 19.338 1.500 14.033 0.548 9.000
Croatia 19.808 6.391 41.336 11.226 5.069 0.558 24.391 17.831 4.338 15.972 0.517 8.289 5.700 9.400
Cyprus 26.500 11.637 35.256 10.078 0.339 0.154 25.226 21.249 1.060 11.368 0.367 17.340 2.358 11.900
Czech Rep. 15.627 11.237 35.439 4.541 8.542 0.828 21.537 14.952 5.414 20.147 0.433 3.742 7.362 24.000
Denmark 16.540 9.734 61.570 20.188 27.733 9.239 4.432 1.877 4.916 12.079 0.316 3.534 4.794 19.900
Estonia 11.716 15.600 32.813 16.051 2.062 1.489 13.699 12.355 4.429 19.962 0.684 8.246 5.605 4.600
Finland 17.484 21.589 28.447 15.068 7.685 0.850 4.848 16.004 7.263 7.443 0.095 5.646 12.290 18.400
France 24.836 13.069 49.806 28.256 0.678 1.251 19.963 9.563 1.964 14.346 0.376 7.697 2.935 13.900
Germany 12.928 16.406 34.990 18.489 5.271 0.427 10.796 17.491 4.932 15.880 0.204 5.966 4.118 25.000
Greece 32.505 7.737 28.884 12.497 1.335 0.038 15.007 23.814 1.198 25.229 1.716 8.448 2.946 4.800
Hungary 14.754 8.964 33.696 8.003 2.890 0.004 24.380 14.905 4.175 21.737 0.406 14.421 1.978 18.000
Iceland 19.202 25.577 47.629 18.816 10.831 6.115 11.867 4.022 4.591 7.617 0.371 4.035 5.796 21.000
Ireland 20.689 15.021 45.876 15.274 4.588 6.562 19.369 7.118 4.979 18.766 0.398 4.016 3.094 17.000
Italy 22.860 2.550 43.891 11.437 0.009 0.086 31.530 11.536 3.014 20.022 0.474 13.645 3.943 8.300
Latvia 13.162 18.965 36.168 22.988 0.808 0.449 12.083 9.310 5.799 T12.710 1.426 8.972 6.434 4.800
Lithuania 16.412 9.961 46.183 29.731 5.427 0.478 11.259 10.986 2.348 11.881 1.255 6.555 10.531 5.900
Luxembourg 22.502 8.312 38.870 13.111 0.305 0.884 24.022 17.585 1.659 16.466 0.277 11.190 6.398 15.900
Malta 19.815 8.114 36.043 3.125 0.627 0.884 31.406 20.561 1.674 19.062 1.272 11.324 4.117 10.100
Netherlands 9.917 20.846 32.962 13.176 2.572 5.652 11.919 2.394 4.988 14.822 0.635 7.894 14.764 28.500
Norway 16.195 17.996 40.831 13.521 22.184 4.662 0.493 2.307 4.909 9.318 0.469 2.940 21.368 21.000
Poland 22.225 10.058 29.536 15.044 1.361 0.150 12.981 14.387 2.441 18.011 0.304 6.548 15.427 3.200
Portugal 19.290 4.563 45.254 10.305 0.558 2.824 30.814 12.061 2.625 15.865 0.353 10.093 6.421 10.300
Romania 25.095 3.963 45.695 15.954 2.534 2.172 25.031 18.764 3.176 13.387 1.088 12.848 0.823 2.500
Slovakia 20.805 8.237 32.417 6.135 7.974 0.029 18.451 21.932 2.685 25.282 0.402 9.481 0.998 8.900
Slovenia 13.354 3.610 54.967 16.239 13.072 2.023 23.632 5.836 6.903 16.126 0.486 9.484 2.935 12.600
Spain 24.050 6.311 54.587 22.790 0.445 1.005 30.343 11.100 1.925 11.966 0.314 10.477 2.937 11.700
Sweden 14.052 20.911 48.537 8.712 25.907 12.013 1.941 2.790 3.679 5.000 0.163 6.356 12.449 21.100
UK 41.961 25.900 38.492 18.626 4.601 9.435 5.828 2.067 7.099 13.570 0.586 2.822 6.401 17.200
Pearson's r 0.519 0.112 -0.144 0.465 0.503 -0.334 -0.478 0.424 -0.337 -0.524 -0.452 0.310
Pearson's p-value 0.003 0.554 0.447 0.010 0.005 0.071 0.008 0.020 0.068 0.003 0.012 0.095
Odds ratio 1.215 1.041 0.966 1.223 1.715 0.934 0.843 1.555 0.795 0.041 0.772 1.165
95%CI 1.074-1.412 0.961-1.131 0.869-1.071 1.065-1.513 1.234-2.779 0.864-1.003 0.742-0.943 1.062-2.399 0.652-0.936 0.002-0.314 0.609-0.944 0.998-1.407
p value 0.005 0.331 0.510 0.023 0.007 0.068 0.005 0.031 0.011 0.008 0.019 0.072
Kruskal-Wallis p 0.003 0.048 0.924 0.002 0.014 0.001 0.030 0.004 0.114 0.010 0.006 0.096
Post-Hoc test G1 vs G2 0.893 0.041 0.893 0.322 0.034 0.050 0.285 0.251 0.404 0.022 0.893 0.997
G1 vs G3 0.018 0.636 0.972 0.011 0.041 0.041 0.060 0.018 0.165 0.027 0.011 0.220
G2 vs G3 0.006 0.285 0.988 0.009 0.636 0.003 0.165 0.018 0.404 0.988 0.027 0.103
Glossary: Antibiotic categories (ACT codes): Total systemic antibiotics: J01, tetracyclines: J01A, penicillin group (all): J01C, broad spectrum, penicillinase susceptible penicillin: J01CA, narrow spectrum, penicillinase susceptible penicillin: J01CE, narrow spectrum, penicillinase resistant, narrow spectrum penicillin: J0CF, broad spectrum, penicillinase resistant penicillin: J01CR, cephalosporines: J01D, sulfonamides: J01E, macrolides and lincomycin: J01F, aminoglycosides: J01G, quinolones: J01M, other antibiotics: J01X, which includes glycopeptides, polymyxine, steroid antibacterial, imidazole derivates, nitrofurantoin derivates, etc.
Table 2. Rank order of the incidence of IBD (ASIR 2021) and the rank order distribution of the countries with higher consumption of antibiotic classes with positive (J01A, J01CE, J01E) and the low consumption of antibiotic groups with negative statistical association (J01D, J01F, J01M). The first 10 countries in the IBD rank order appear (bold, bigger font) in the top 10 for positive consumption and the bottom 10 for negative association with antibiotic classes. Seven countries are identical in the antibiotic groups with a positive statistical association, and 5-8 in the low-consumption groups with a negative association and higher IBD incidence.
Countries ASIR 2021 Countries J01A % Countries J01CE% Countries J01E% Countries J01D% Countries J01F% Countries J01M%
Netherlands 28,5 UK 25,900 Denmark 27,733 Finland 7,263 Greece 23,814 Slovakia 25,282 Cyprus 17,340
Germany 25 Iceland 25,577 Sweden 25,907 UK 7,099 Slovakia 21,932 Greece 25,229 Hungary 14,421
Czechia 24 Finland 21,589 Norway 22,184 Slovenia 6,903 Bulgaria 21,720 Hungary 21,737 Bulgaria 14,033
Sweden 21,1 Sweden 20,911 Slovenia 13,072 Latvia 5,799 Cyprus 21,249 Czechia 20,147 Italy 13,645
Iceland 21 Netherlands 20,846 Iceland 10,831 Czechia 5,414 Malta 20,561 Italy 20,022 Romania 12,848
Norway 21 Latvia 18,965 Czechia 8,542 Netherlands 4,988 Romania 18,764 Estonia 19,962 Malta 11,324
Denmark 19,9 Norway 17,996 Slovakia 7,974 Ireland 4,979 Croatia 17,831 Bulgaria 19,338 Luxembourg 11,190
Finland 18,4 Germany 16,406 Finland 7,685 Germany 4,932 Luxembourg 17,585 Malta 19,062 Spain 10,477
Hungary 18 Estonia 15,600 Lithuania 5,427 Denmark 4,916 Germany 17,491 Ireland 18,766 Belgium 10,307
UK 17,2 Ireland 15,021 Germany 5,271 Norway 4,909 Finland 16,004 Austria 18,670 Portugal 10,093
Ireland 17 France 13,069 Croatia 5,069 Iceland 4,591 Austria 15,933 Poland 18,011 Slovenia 9,484
Luxembourg 15,9 Cyprus 11,637 UK 4,601 Estonia 4,429 Czechia 14,952 Luxembourg 16,466 Slovakia 9,481
France 13,9 Czechia 11,237 Ireland 4,588 Croatia 4,338 Hungary 14,905 Slovenia 16,126 Latvia 8,972
Austria 13,6 Bulgaria 10,362 Austria 4,060 Bulgaria 4,276 Poland 14,387 Croatia 15,972 Greece 8,448
Slovenia 12,6 Poland 10,058 Hungary 2,890 Hungary 4,175 Estonia 12,355 Germany 15,880 Croatia 8,289
Belgium 12,3 Lithuania 9,961 Netherlands 2,572 Sweden 3,679 Portugal 12,061 Portugal 15,865 Estonia 8,246
Cyprus 11,9 Denmark 9,734 Romania 2,534 Romania 3,176 Italy 11,536 Netherlands 14,822 Netherlands 7,894
Spain 11,7 Hungary 8,964 Estonia 2,062 Italy 3,014 Spain 11,100 France 14,346 France 7,697
Portugal 10,3 Belgium 8,829 Bulgaria 1,446 Slovakia 2,685 Lithuania 10,986 Belgium 14,330 Austria 7,291
Malta 10,1 Luxembourg 8,312 Poland 1,361 Portugal 2,625 France 9,563 UK 13,570 Lithuania 6,555
Croatia 9,4 Slovakia 8,237 Greece 1,335 Austria 2,519 Latvia 9,310 Romania 13,387 Poland 6,548
Bulgaria 9 Malta 8,114 Latvia 0,808 Poland 2,441 Belgium 8,575 Latvia 12,710 Sweden 6,356
Slovakia 8,9 Greece 7,737 France 0,678 Lithuania 2,348 Ireland 7,118 Denmark 12,079 Germany 5,966
Italy 8,3 Croatia 6,391 Malta 0,627 France 1,964 Slovenia 5,836 Spain 11,966 Finland 5,646
Lithuania 5,9 Spain 6,311 Portugal 0,558 Spain 1,925 Iceland 4,022 Lithuania 11,881 Iceland 4,035
Greece 4,8 Portugal 4,563 Spain 0,445 Malta 1,674 Sweden 2,790 Cyprus 11,368 Ireland 4,016
Latvia 4,8 Romania 3,963 Belgium 0,442 Luxembourg 1,659 Netherlands 2,394 Norway 9,318 Czechia 3,742
Estonia 4,6 Austria 3,726 Cyprus 0,339 Greece 1,198 Norway 2,307 Iceland 7,617 Denmark 3,534
Poland 3,2 Slovenia 3,610 Luxembourg 0,305 Belgium 1,169 UK 2,067 Finland 7,443 Norway 2,940
Romania 2,5 Italy 2,550 Italy 0,009 Cyprus 1,060 Denmark 1,877 Sweden 5,000 UK 2,822
Disclaimer/Publisher’s Note: The statements, opinions and data contained in all publications are solely those of the individual author(s) and contributor(s) and not of MDPI and/or the editor(s). MDPI and/or the editor(s) disclaim responsibility for any injury to people or property resulting from any ideas, methods, instructions or products referred to in the content.
Copyright: This open access article is published under a Creative Commons CC BY 4.0 license, which permit the free download, distribution, and reuse, provided that the author and preprint are cited in any reuse.
Prerpints.org logo

Preprints.org is a free preprint server supported by MDPI in Basel, Switzerland.

Subscribe

Disclaimer

Terms of Use

Privacy Policy

Privacy Settings

© 2026 MDPI (Basel, Switzerland) unless otherwise stated