Submitted:
11 January 2026
Posted:
12 January 2026
You are already at the latest version
Abstract
Holidays generate sharp deviations in retail demand, creating surges before major events and steep declines afterward, and often account for a disproportionately large share of annual sales. Accurately forecasting such fluctuations is essential for inventory planning, pricing, and supply chain coordination, yet presents unique challenges. This review synthesizes the literature on modeling holiday impacts in retail sales forecasting, emphasizing how holiday-related features are designed, integrated, and evaluated. We identify five central themes: (1) the decision on whether to model the effect of a certain holiday; (2) the inter-temporal dynamics of holiday effects, including pre-holiday stock-ups and post-holiday decay; (3) cross-sectional heterogeneity across products and categories; (4) clustering and categorization strategies for grouping holidays; and (5) the integration of holiday and non-holiday data through unified or separate modeling frameworks. For each theme, we summarize the contribution of current literature and propose possible future research directions. We also proposed a unified decision flow for modeling holiday impact in demand forecasting. This paper provides both a roadmap for researchers seeking to advance methodological rigor and a guide for practitioners aiming to improve operational forecasting accuracy during critical holiday periods.
Keywords:
holiday effects
; demand forecasting
; feature engineering
; modeling approach
1. Introduction
Accurate demand forecasting is a critical function for inventory planning, promotion scheduling, supply chain coordination, and financial decision-making. While many advances have been made in time-series and machine-learning-based forecasting methods, retail demand remains difficult to predict during periods that deviate from regular seasonal trends—most notably during holidays.
Holidays, both cultural and commercial, induce substantial distortions in consumer purchasing behavior. In many retail sectors, holidays represent disproportionately large spikes in sales volume. Events like Black Friday, Cyber Monday, and the Christmas season can account for 30–50% of annual revenue in certain product categories, such as consumer electronics, fashion, and gifting-related goods [1,2]. This concentration of sales into narrow windows magnifies the stakes of forecasting errors: under-prediction may result in severe stockouts, lost revenue, and customer dissatisfaction, while over-prediction leads to excess inventory, increased holding costs, and markdown losses. For example, in the U.S. alone, retail sales during the November–December holiday season surpassed $960 billion in 2022, with e-commerce contributing over $260 billion [3]. Forecasting models that fail to account for holiday effects may lead to significant out-of-stock ([4,5]) or overstock, and result in business loss. Therefore, developing robust and context-aware forecasting models that effectively capture the holiday effect is of practical importance.
The simplest and most widely used approach in practice involves binary indicator variables that flag whether a given day or week coincides with a holiday. Common examples include:
However, such a modeling strategy can be oversimplified and may fail to accurately capture the potentially complex impact of the holiday event on retail demand. Much literature on demand forecasting has introduced various forms of holiday-related features to model the impact of holidays in demand forecasting. However, despite the ubiquity of these practices, there is no comprehensive review or set of guidelines that summarizes useful practices for modeling holiday impact in demand forecasting. There is some literature on demand forecasting (e.g., [6]), but none of them provides a deep investigation into demand forecasting during special periods, such as holidays. This review aims to fill that gap by providing a structured and critical overview of the literature on holiday effects in retail demand forecasting, proposing possible future directions for research.
The main research questions and motivations of the paper are as follows:
- Necessity of modeling holiday impact: What kind of holidays need to be explicitly modeled, and what kind of holidays do not need to be modeled if some other calendar-related features are already available?
- Inter-temporal Structure: How can we better capture the dynamics of demand during the phases surrounding a holiday, including the buildup before and the decline afterward? This question aims to identify effective strategies for modeling the time-wise heterogeneity of a single holiday’s impact.
- Cross-sectional heterogeneity: How can we better account for differences in the impact of a single holiday across multiple products or categories? This question highlights the cross-sectional variation in holiday effects. Taken together, the first two questions focus on modeling the heterogeneity of holiday impacts—one along the inter-temporal dimension and the other across products.
- Clustering of holidays: How can we effectively group or differentiate holidays based on their demand effects? Unlike the first two questions, which center on a single holiday, this question addresses how previous literature integrates multiple holidays—whether they should be unified into clusters or treated as distinct events.
- Integration of holiday and non-holiday data: How can holiday and non-holiday data be combined most effectively in forecasting models? Compared to the previous four topics, this topic goes beyond the holiday featuring and discusses how the combination of holiday and non-holiday data can reach a good prediction accuracy for the demand during the holiday. Traditional approaches often train a single model on all available data, but this can reduce accuracy due to the imbalance between holiday and non-holiday observations. Thus, it is essential to review how prior studies have structured these two data sources in complementary ways.
The logical relationships of these five topics are summarized in Figure 1. By focusing on aspects of modeling holidaying empirical insights, feature engineering strategies, and model integration approaches, this review provides a consolidated reference and future research agenda for the researchers and practitioners seeking to improve retail sales forecasting under holiday-induced volatility.
The paper is organized as follows: Section 2 outlines the research method. Section 3, Section 4, Section 5, Section 6 and Section 7 present the literature review, each focusing on an aspect of modeling holiday impact. Section 8 proposes a unified decision flow for modeling holiday impact in demand forecasting. Section 9 discusses the implications of the literature review on retail and marketing research. Section 10 presents the conclusion and some future directions for research.
2. Research Method and Summary Statistics
This section presents the method used for the literature search and provides statistics on the distribution of the literature across different dimensions.
This literature review adopts a structured narrative approach, aiming to synthesize both academic and applied insights into how holidays influence retail demand and how such effects are modeled. To ensure comprehensive coverage, we conducted an extensive literature search using databases including Scopus, Web of Science, Google Scholar, and arXiv, as well as curated industry resources such as McKinsey Insights, NRF (National Retail Federation) reports, and company white papers from NielsenIQ, IRI, and Instacart.
The following combinations of keywords were used during the search process: “holiday effect retail sales,” “retail demand forecasting holidays,” “calendar effect sales prediction,” “holiday feature engineering retail,” “day-of-week holiday forecasting,” “proximity features holiday,” “holiday decay modeling,” “event-based time series forecasting,” and “holiday uplift sales model”. Filters were applied to prioritize peer-reviewed publications, working papers with technical contributions, and high-impact industry reports. Studies were selected for inclusion based on their empirical focus on holiday-driven variation in sales, their methodological contributions to modeling holiday effects, and their relevance to operational forecasting contexts. Special effort was made to include literature from multiple sectors (e.g., fashion, grocery, e-commerce, energy) to capture cross-domain insights into holiday-related demand patterns.
2.1. Industry Distribution of Studies
In total, 42 academic and industry studies were included in the final review. These works were published between 2000 and 2025, with the majority (over 70%) appearing after 2015. The selected papers span two domains: retail (apparel, grocery, e-commerce), energy (electricity and gas demand). As Table 1 provides a concise overview of the distribution of the reviewed studies in terms of the industry that these studies focus on.
2.2. Geographic Distribution of Studies
The reviewed studies vary in their geographic focus. Table 2 summarizes the primary countries or regions considered. A substantial share of the reviewed work focuses on the United States, reflecting the availability of large retail and energy datasets, followed by European countries (e.g., Germany, Spain, UK), and China. A smaller but growing number of studies examine emerging markets or adopt multi-country/region datasets. This distribution highlights the current concentration of holiday-effect modeling research in developed markets, leaving opportunities for future research to explore underrepresented regions.
2.3. Methodological Distribution of Studies
The reviewed studies differ substantially in their methodological orientation. Roughly one-third of the works employ traditional statistical approaches (e.g., ARIMA, Regression models, Bayesian models). A large proportion of papers focus on advanced machine learning techniques, including gradient boosting, recurrent neural networks, and Transformer-based models. The remaining studies, mostly industrial or government reports, use descriptive methods. Table 3 summarizes this methodological distribution.
3. Choosing the Holiday Events to Model
Before even getting into creating holiday-related features, it is necessary to consider whether a holiday should be modeled into features or not. To consider this, it is first necessary to consider
As noted by [7], public holidays can be categorized into three groups.
- Weekday holidays: The second group contains the so-called weekday public holidays. These holidays are not fixed in their date, but in the weekday of their occurrence. The date of occurrence of the public holiday can thus vary from year to year, but usually falls on a similar date. In many European countries, several Christian public holiday days, such as Easter or Ascension, belong to this group. In countries like the US or the UK, some bank holidays fall into this category as well. For instance, in the UK, the Spring Bank holiday is always on the last Monday of May. [7], by analyzing the electric demand of some weekday holiday in Germany, reveals that even though the historical date of these holidays varies, the impact seems to be quite stable over the years.e implication of this is that, if the cyclical profile of demand is table, we can just put the seasonal pattern feature into the model, without creating extra features indicating such weekday holidays.
- Fixed date holidays: They are those that always occur on the fixed day each year. Typical examples are New Year’s Day, which is always on 1 January, and also Christmas Day, which is celebrated in many African, American, and European countries on 25 December. Many national holidays (such as Independence Day in the US) belong to this group. The impact of such a holiday on demand highly depends on the day of the week it is. For example, [7], by analyzing the electric demand of fixed-date holiday in Germany, found that if fixed date holidays fall on a Sunday, there is no (distinct) impact observable, whereas the impact is significant for the other days. One implication for this observation is that it is usually necessary to model such holidays,
Finally, there are also exceptions to holidays that can not be clearly grouped into the classes. These are public holidays that have neither a date nor a weekday fixed. Notable examples are the Vernal Equinox Day in Japan or the Tomb-Sweeping Day in China ([7]). Also, Most of these countries have the so-called Lunar Events and Solar Events. The latter ones depend on the Sun and thus match the standard (Georgian) calendar year. The Lunar Events depend on the Moon cycle, typical examples are e.g. Ramadan or AshurThese public holidays are very special because they move throughout the year. This is because the Luna year (or Islam/Muslim year) does not match the periodicity of the sun. From the modeling and forecasting perspective, tracking this phenomenon is very challenging. As temperature cycles follow the Solar year and the energy consumption depends on the temperature (due to cooling and/or heating), this leads to changing interactions between Luna public holidays and temperature effects. Note that, depending on a country, there can be either more fixed-date public holidays or weekday public holidays throughout the year.
For the second and third types of holidays, it is also often recommended to add day-of-week information as a feature in the forecasting model. The reason is that for these two types of holidays, their impact on consumption demand depends heavily on the day of the week.
- For instance, if a day is a holiday and also a weekend, then (without other promotional factors), its sales should be similar to those of a typical weekend day. If a day is a holiday and a weekday, the sales of this day should be higher than the same non-holiday weekday. [8]
- Moreover, the weekday placement of a holiday can influence not only the sales on the holiday itself, but also adjacent days. When a holiday occurs on a Friday falls on a Friday or Monday, it creates a three-day weekend, which typically stimulates elevated consumer activity. ([9])
This calls for a more careful consideration of the relationship between the holiday event of the current date and the day of the week on the current date and the day-of-week information for the dates adjacent to it, which is unfortunately not present in the current literature. One issue with modeling the impact of such a holiday is that calendar variation associated with fixed holidays is closely entangled with the annual seasonal pattern ([10]). Disentangling the two dynamics requires an appropriate specification of either component and is an area that needs further research.
4. Modeling Inter-Temporal Change in Holiday Impact
This section presents historical literature’s approach on modeling the inter-temporal dynamics of a single holiday, i.e, how the impact of a single holiday on retail demand changes during a comprehensive holiday phase (i.e., before the holiday, during the holiday, and after the holiday).
The motivations for investigating this aspect are as follows. First, much of the literature has already documented the inter-temporal changes in retail demand during such holiday periods. A typical pattern is the pre-holiday stock-up, followed by a post-holiday decline– consumers frequently shift their purchases earlier to prepare for celebrations or avoid store closures, leading to suppressed demand immediately afterward. Table 4 summarizes some papers and reports that provide evidence on this trend. These findings justify the need to model the inter-temporal change of the holiday effect efficiently.
Second, while most holiday demand models treat holidays as isolated events, empirical evidence and operational intuition suggest that holidays can affect each other—especially when they occur in close succession. For example, if an earlier holiday drives substantial consumer demand, a closely following holiday may experience dampened sales uplift due to forward-shifted or satiated consumption. This phenomenon has been observed in both food and general merchandise categories – for instance, when Easter is closely followed by Mother’s Day or Memorial Day in the U.S. calendar, the uplift from the latter holidays may be reduced as consumers have recently spent on groceries, gifts, or apparel. Instacart’s weekly demand logs show that categories like baked goods, flowers, and frozen desserts often peak during the first major holiday in a sequence, with lower-than-expected growth during the second [13]. Such empirical evidence calls for the necessity to pay attention to the nearby calendar information of the holiday to be modeled, i.e., modeling the inter-temporal structure.
Modeling such inter-temporal structure and dynamics is challenging. As [10] puts, the correct specification of calendar-related dynamics can be a difficult task as well since data granularity enables measurement not only of fixed- and moving-holiday effects but also of the effects of related events, such as bridging days or longer pre- and post-holiday phases of interest. Finding and testing appropriate variables for such A variety of effects can quickly become time-consuming, even when working only with dummy variables.
In this section, we outline two main approaches to capturing such inter-temporal structure in holiday effects. Section 4.1 explores the categorization approach, which is commonly used in demand forecasting literature. Section 4.2 provides a quantitative description of the inter-temporal structure in the holiday effect, an area that remains underdeveloped in current literature.
4.1. Categorization of Inter-Temporal Structure
Categorization, i.e., categorizing the calendar period based on holiday information for the preceding, current, and following periods, is widely used in the demand forecasting literature. See Table 5 for a brief summary of representative papers. In these papers, date types are determined by the presence of holidays around the date. For example, by examining holidays in the preceding, current, and subsequent periods, a total of 8 types of dates will be identified.
One aspects that are under-explored in the previous literature and are worth future research— When categorizing calendar dates based on the preceding/current/future dates, it is important to choose a proper time span– how far should we look back to the past and look forward to the future? a short time span brings less date types, which is easy to handle, but only focus on local period information and fail to capture a broader time horizon; a long time span contains more inter-temporal structure information, but also increases the number of date types, which could bring challenges to model training. No literature has done such a comprehensive discussion, and this will be a promising future research direction.
4.2. Quantitative Depicting the Proximity
The method of the previous section adopts fixed binary windows (e.g., ±7 days) around holidays. It treats the holiday period as a discrete block (e.g., dummy variables for pre-holiday and post-holiday intervals), thereby ignoring the possibility that holiday effects may taper off or intensify gradually. This reliance on rigid windows can miss finer inter-temporal patterns, such as nonlinear acceleration before major events or asymmetric post-holiday decay. This section presents some ideas for quantitatively modeling the gradual intensification or decay of holiday effects
One of the simplest ways to capture such dynamics for a holiday is to define ’distance’, i.e., the days to the most recent future holiday, and the days after the most recent previous holiday:
where H is the set of known holiday dates. Table 6 summarizes the several available papers that constructed features that quantitatively measure the inter-temporal structure.
A more flexible approach is to consider inter-temporal decay. A typical form is:
An alternative expression could be:
where the parameter and control how rapidly the effect fades.
It is also possible to consider the gradual build-up or the gradual decay of multiple holiday events:
where is the binary or proximity-weighted signal for a holiday at time t, and the adjustment term accounts for the lingering influence of earlier holidays . The decay rate controls how quickly prior holidays lose influence, and can be learned or set to reflect the strength of prior holiday uplift. Such formulations can help de-bias forecasts when multiple holidays cluster within a short time window.
Although the above feature creations appear intuitive, they remain relatively rare and largely unexplored in the previous literature.
5. Modeling Cross-Section Heterogeneity of Holiday Impact
The previous section explores modeling the inter-temporal change in the impact of a single holiday event, i.e., the time-dimension heterogeneity of holiday-event impact. In this section, we explore another dimension of the heterogeneity of holiday impact, the heterogeneity on the cross-sectional (product-wise) dimension. We first list literature highlighting the importance of modeling the heterogeneity in the effects of a single holiday. We then propose some guidelines for modeling such heterogeneity in demand forecasting.
- The magnitude and direction of holiday effects vary significantly across product categories, depending on consumption habits, perishability, cultural symbolism, and gifting traditions. Products like flowers, chocolate, alcohol, and baked goods consistently exhibit strong uplifts near holidays such as Valentine’s Day, Christmas, and Thanksgiving. For instance, Hirche et al. [26] show that alcoholic beverages in the U.S. experience spikes around New Year’s Eve and Memorial Day, especially for spirits and beer. Similarly, the Instacart holiday trend report highlights sharp increases in baking supplies, dairy, and turkeys in the week before Thanksgiving and Christmas [13]. Fashion and apparel categories also tend to exhibit strong holiday sensitivity, particularly in the lead-up to gifting occasions such as Christmas and Mother’s Day. On the other hand, household staples like cleaning supplies, batteries, and non-seasonal over-the-counter medications show relatively stable demand across holidays, with only minor deviations. Furthermore, Ehrenthal et al. [12] note that perishables (e.g., fresh produce in grocery contexts) require unique inventory planning. Conversely, large durable goods (e.g., mattresses, appliances) may exhibit holiday-season spikes only during discount-focused holidays such as Labor Day or Black Friday, rather than culturally significant celebrations.
- In many cases, people purchase a lot on holiday not because of the holiday itself, but simply because there are discounts and promotions on retail products. One obvious example is Black Friday, the day when retailers offer significant discounts on a broad range of products. Another example is Double Eleven in China, which originally celebrated being single and is now a major sales event. People make many purchases on this day not because it is a special day, but because of the discounts and promotions available. Instead of using holiday information, it would be more straightforward to use promotion/sales event-related information as feature variables directly.
The above observation implies that it is important to explicitly account for the heterogeneity of holiday impacts when constructing demand forecasting models. Several approach exists:
- Interaction terms: A straightforward method is to introduce cross-terms (interaction effects) between holiday indicators and other relevant covariates, such as product categories, price levels, or store formats, which is the typical practice in statistics ([27]). This approach is attractive due to its simplicity and interpretability—coefficients directly indicate how the holiday effect changes with each covariate. However, in high-dimensional settings with many potential covariates, this method can quickly lead to a combinatorial explosion of parameters, increasing the risk of overfitting, especially when holiday data are sparse. Therefore, studying how to model the heterogeneity of holiday events while avoiding the high dimension curse is an interesting direction for future research. However, the literature lacks a thorough discussion on the best strategy for creating such historical uplift information.
- Hierarchical Bayesian Model/Multi-task learning: One option is to estimate separate models for each product, category, or store, but impose a prior that links their holiday-related coefficients—such as a Dirichlet process or hierarchical Bayesian structure—so that parameter estimates borrow strength across similar series while retaining flexibility for heterogeneity. Another modern alternative is Multi-Task Learning (MTL), where each product or store is treated as a separate task. By sharing latent representations in neural networks or kernel-based models, MTL may allow the model to learn both global patterns (common to all products) and task-specific adjustments (unique holiday responses), often yielding better generalization for low-sample-size holidays. There are some papers on applying multi-task learning to demand forecasting (e.g., [28,29]), but few have paid particular attention to the model learning, especially for holidays. In general, however, there is no literature that tries to do such a hierarchical Bayesian model or multi-task learning methods. Therefore, this is a promising and interesting direction for future research.
Despite the promise of these techniques, the discussion and application of the more structured heterogeneity-aware frameworks in sales forecasting remains significantly limited. Therefore, they are promising directions for future research—particularly as large-scale retail datasets and machine learning tools become more accessible.
6. Clustering of Holiday Events
The previous two sections mainly focused on modeling the heterogeneity of a single holiday’s impact. This section focuses instead on how to integrate the information regarding the impact of various holidays when doing demand forecasting – In modeling holiday effects, a key design choice lies in how the holiday information is encoded so that information is shared among different holidays. When coming to modeling various holidays, there are three strategies: a single unified holiday variable, separate dummy variables for each holiday, or an intermediate approach that groups holidays into meaningful categories or types.
The most straightforward approach is to use a single unified holiday variable, a binary flag that equals one if the date is a holiday and zero otherwise. This method is standard ([30]), straightforward to implement, reduces dimensionality, and helps avoid overfitting when historical data is limited. However, this approach implicitly assumes that all holidays exert the same effect, which is rarely the case. Large-scale shopping events like Christmas or Black Friday typically generate far greater sales lifts than minor public holidays. Therefore, this strategy may dilute important heterogeneity.
At the opposite extreme, each holiday is treated as a distinct event, allowing the model to estimate distinct impacts for each event. This strategy has been adopted in many works on retail sales forecasting. By allowing holiday-specific coefficients, this method captures nuanced demand responses and yields interpretable results. However, it greatly increases the number of variables, which can lead to overfitting if certain holidays occur infrequently. Moreover, stable estimation requires sufficient historical occurrences for each holiday, which may not be feasible in short data series.
An intermediate strategy between treating all holidays as identical and modeling each holiday separately is to group holidays into meaningful categories or types. Instead of assigning a unique coefficient to each holiday, holidays can be clustered into groups expected to share similar demand dynamics. This approach reduces the model’s dimensionality while allowing it to capture richer variation than a single unified holiday indicator. Grouping can be based on domain expertise, such as the cultural or functional roles of holidays, or informed by data-driven analysis of historical demand profiles.
The Table 7 summarizes some main ideas of the clustering of holidays:
- Knowledge-based clustering: This approach classifies holidays based on domain or cultural knowledge, drawing on predefined categories such as national holidays, religious observances, cultural festivals, and commercial events. This taxonomy reflects the intuition that holidays with similar socio-cultural origins tend to influence purchasing behavior similarly. The advantage of this knowledge-driven classification is interpretability and transferability across markets; however, it may also oversimplify the heterogeneity that exists within a category.
- Data-driven clustering of holidays: This approach clusters holidays based on observed demand profiles. Here, historical sales trajectories before, during, and after each holiday are extracted and compared, and holidays with similar sales dynamics are classified into the same group. Most available studies still rely on straightforward methods such as visualization/eyeball inspection. One promising future research direction is to apply more advanced unsupervised learning methods to group holidays exhibiting similar inter-temporal demand patterns ([31]).
- Bayesian Hierarchical Approach: This approach differs fundamentally from both the knowledge-based and the data-driven clustering methods: holidays are modeled individually, but their coefficients are assumed to come from a shared statistical distribution. This is common in hierarchical or Bayesian frameworks, where holiday-specific effects are treated as random effects drawn from a common prior distribution. Such partial pooling allows information sharing across holidays, improving estimation accuracy when data for a particular holiday is sparse, while still allowing for heterogeneity in effects. This approach provides a principled compromise between over-pooling (treating all holidays the same) and no pooling (estimating each holiday completely separately), but requires careful prior specification and can be computationally more intensive. So far, there is very limited literature that has applied such an approach in modeling the impact of multiple holidays. To our best knowledge, [22] is the only paper that did such a discussion. Therefore, this is still a new direction for the future.
7. Integration of Holiday and Non-Holiday Data
The previous sections outlined a range of approaches for creating useful holiday-related features, including proximity measures, inter-temporal decay functions, and intra-holiday position indicators. However, in most of these cases, the underlying assumption is that the entire dataset—covering both holiday and non-holiday periods—is pooled together for model training. This unified modeling approach introduces several potential drawbacks.
First, in many retail settings, the number of holiday observations is small compared to the vast majority of non-holiday data. When optimizing a single model across the full dataset, the learning process tends to be dominated by non-holiday patterns, simply because they make up the majority of the training examples. This can lead to underfitting in the holiday periods, resulting in poor predictive accuracy exactly where accurate forecasts are most critical for operational planning.
Second, in many industries, sales during holidays can be several times higher than on ordinary days. If the loss function is based on absolute errors (e.g., mean squared error), these high-demand days naturally carry a disproportionate weight in the optimization process. This can cause the model to overcompensate for holiday spikes, potentially degrading its performance on regular days. In extreme cases, the model may be “pulled” toward patterns that reduce holiday errors at the expense of overall fit, or even produce unstable parameter estimates.
Given these challenges, a growing body of literature has considered more sophisticated ways of treating non-holiday and holiday data. Table 8 summarizes the commonly used methods in the current literature:
- Utilize only holiday data: This approach allows a model to specialize in the distinct demand dynamics of its respective period, avoiding the dilution or distortion that can occur when attempting to fit a single model to both regimes. Using only holiday data in modeling can reduce the noise from the non-holiday data, but it also has the risk of overfitting due to a significantly small sample size. Also, it includes much information from the non-holiday data that may still be useful for predicting holiday demand. One more flexible way of modeling this is to let the model adaptively learn the weight of holiday and non-holiday data during– i.e., let the model determine the best sample weight allocation during the training process ([43]).
- Model the residual/uplift: In this method, the baseline model is first applied to holiday periods to generate predictions. The difference between observed holiday sales and these baseline forecasts (i.e., the residual or uplift) is then modeled separately. The uplift model typically uses holiday-related features—such as holiday identity, proximity variables, and temperature effects—as predictors. This approach, by using non-holiday data and holiday data separately, avoided the non-holiday data from affecting the model training using holiday data, but also organically utilized the information in non-holiday data that may be helpful for prediction on holiday demand.
8. A Unified Decision Flow for Modeling Holiday Effects in Demand Forecasting
The previous sections provide a systematic summary on the current modeling strategies on holiday event impact. This section, combining the review so far, proposes a unified flow of modeling the holiday event in the retail demand forecasting.
Figure 2 presents a practical decision flow that guides the selection of modeling strategies for holiday effects based on data characteristics and modeling objectives.
The first decision concerns whether the holiday is essentially a weekday-type holiday. As is mentioned in Section 3, if a holiday is weekday-type, seasonality components may already absorb most of the holiday impact, and no explicit holiday variable is required. This branch reflects the idea that not all holidays necessarily warrant special treatment in forecasting models.
If a holiday is not weekday-type, i.e., fixed date, or other types, seasonality alone is not sufficient to model its impact. The next question is the objective of model accuracy: should the model primarily optimize overall accuracy, or should it balance accuracy across both non-holiday and holiday periods? When the focus is only on overall accuracy, unified models trained on the full dataset may be adequate, even though they often underperform on holidays due to data imbalance. However, if accurate prediction during holidays is equally important, then a more specialized modeling strategy is needed. In this case, a more sophisticated way of integrating holiday and non-holiday data, like separate modeling or two-step modeling approaches, is recommended. Such strategies help prevent the learning process from being dominated by the abundant non-holiday observations.
The next key decision concerns whether the application involves a single (or a few) holiday or multiple holidays. When only one major holiday (or a few holidays) is relevant , the modeling problem reduces to capturing how demand around that specific event varies over time and across products. In this setting, modeling efforts can focus on inter-temporal structures (see Section 4) and cross-sectional heterogeneity (see Section 3).
When multiple holidays are involved, it is necessary to first consider the potential of holiday clustering. As mentioned in Section 6, by grouping holidays with similar demand patterns, analysts can reduce dimensionality, improve statistical efficiency, and enable information sharing across related events. Clustering serves as an intermediate representation between a single unified holiday indicator and fully holiday-specific modeling, striking a balance between expressiveness and robustness. After the clustering is completed, we get back to modeling inter-temporal structures and cross-sectional heterogeneity.
9. Implications for Retail and Marketing Research
This literature review has several important implications for retail and marketing research, particularly in how scholars conceptualize, model, and interpret demand dynamics around holidays and special events. Beyond forecasting accuracy, the findings reviewed in this paper suggest that holiday effects constitute a broader marketing phenomenon that intersects with consumer behavior, promotion strategy, and market design.
First, the reviewed literature highlights that holidays should not be treated merely as exogenous calendar shocks, but rather as strategic demand-shaping events that interact with consumer anticipation, inventory availability, pricing, and promotional intensity. From a marketing research perspective, this implies that holiday effects are fundamentally behavioral in nature, reflecting forward-looking purchase decisions, stockpiling behavior, and intertemporal substitution. As a result, modeling holidays purely through static indicator variables risks overlooking the underlying consumer decision processes that generate observed sales patterns.
Second, the strong evidence of cross-sectional heterogeneity in holiday effects has direct implications for marketing research on segmentation and personalization. The literature consistently shows that the magnitude, timing, and even direction of holiday impacts vary substantially across product categories, brands, and customer segments. This suggests that aggregate-level analyses may not be sufficient to discover meaningful differences in how consumers respond to holidays. For marketing scholars, this opens avenues for integrating holiday-aware demand models with customer-level data.
Third, the review reveals a conceptual distinction between holidays as cultural events and holidays as marketing constructs. In many retail contexts, elevated demand around holidays is driven not solely by the holiday itself but by coordinated promotional campaigns, discounts, and advertising efforts. From a marketing research standpoint, this raises identification challenges: observed holiday uplifts may conflate intrinsic holiday effects with firm-initiated marketing actions. The findings suggest a need for future studies to disentangle these mechanisms, either through richer feature engineering (e.g., separating calendar effects from promotion indicators) or through causal inference frameworks. Addressing this issue is critical for accurately estimating the true incremental value of holiday-specific marketing strategies.
Fourth, the emphasis on inter-temporal dynamics—such as pre-holiday buildup, post-holiday decay, and interactions between closely spaced holidays—has broader implications for event-based marketing research. Many marketing phenomena, including product launches, media campaigns, and seasonal promotions, exhibit similar lead–lag structures. The techniques reviewed in this paper, including proximity measures, decay functions, and attention-based models, provide a transferable methodological toolkit for studying time-localized marketing events more generally. This suggests that insights from holiday demand modeling can inform a wider class of research on inter-temporal marketing effectiveness.
Finally, the growing use of separate or two-stage modeling frameworks—where baseline (non-holiday) demand is modeled independently from holiday uplift—has implications for marketing analytics research. Such frameworks align closely with uplift modeling, counterfactual prediction, and incremental impact measurement, which are central concerns in marketing science. By explicitly modeling “normal” demand separately from event-driven deviations, researchers can obtain more interpretable estimates of holiday impact and reduce bias caused by data imbalance. This perspective encourages marketing scholars to move beyond monolithic predictive models toward modular designs that better reflect underlying market mechanisms.
10. Conclusion and Future Directions
This literature review provided a comprehensive overview of approaches and strategies for modeling the impact of holidays on demand. The main conclusions from the literature review are as follows:
- 1.
- The first step of modeling holiday effect in demand forecast is to understand the type of the holiday, i.e., weekday type, or fixed-date type. For the former one, calendar seasonality alone is sufficient to depict the holiday impact. For the latter case, a feature that denotes the holiday event is usually needed. Also, in this case, features indicating the day of the week are often needed to distinguish the holiday’s impact across different days of the week. A more detailed discussion on how to add such a useful day-of-week feature is a possible future research direction.
- 2.
- When depicting the inter-temporal structure of a holiday’s impact, i.e., the impact of a holiday’s on demand before, during, and after it occurs, a substantial portion of the literature still models the holiday effect using coarse categorical indicators—such as simple binary or trinary variables denoting “before,” “during,” and “after” holiday phases. More discussion on the length of time window that defines such phases, and more quantitative and flexible representations—such as continuous decay functions, spline-based effects, or learned inter-temporal profiles—are needed.
- 3.
- When modeling the heterogeneity of the impact of a holiday across products/ and sectors, relatively few attempt to model this heterogeneity in a systematic way. A more sophisticated way of introducing an interaction term, a more detailed discussion on creating effective features that capture historical uplift, and the exploration of the potential of hierarchical models and multi-task learning are important frontiers for improving holiday demand forecasting.
- 4.
- Grouping holidays based on their demand impact is a potentially powerful tool for reducing model complexity and improving generalization. Most existing studies rely on knowledge-based or data-driven clustering methods based solely on eye inspection. There is a clear need for applying a more sophisticated clustering approach that learn holiday groupings from demand profiles. Meanwhile, utilizing a Bayesian approach, such as the Dirichlet process mixture model, is a promising future research direction.
- 5.
- Currently, when dealing with the integration of holiday and non-holiday data, some literature chooses to model holiday effect using holiday data only, while other develop a baseline model using non-holiday data and combine the model with holiday data to produce holiday predictions. An advanced approach to learning the optimal sample weighting scheme during model training will be a promising direction for future research.
- 6.
- A substantial proportion of the papers reviewed are in the energy demand domain, e.g., demand for electricity, gas, etc. The application of holiday impact modeling methods in this domain to retail demand prediction for boosting accuracy during the holiday season remains undeveloped.
The Table 9 summarizes the main future possible research directions under each category.
There are some more directions for future research. One direction is to use attention-based sequence models that dynamically adjust holiday weights: In the previous section, the paper mentioned that some literature tries to increase the forecasting accuracy on holidays by separating the holiday and non-holiday data. Another approach is to adjust the holiday weight during model training. Transformer-based architectures and attention mechanisms allow models to dynamically weight holiday-related time steps, rather than treating all holiday days identically. For instance, [51] developed Tsformer—a Transformer model for tourism demand forecasting—that learns relative attention to calendar features, including holidays, with attention focusing on days near the forecast horizon. [52] decomposes the historical time series features into peak and non-peak components, based on a priori causal indicators. The convolutional encoder experiences only the historical demand without peaks. These models can learn to focus on proximal holiday uplift while discounting older events, providing a flexible alternative to handcrafted decay functions.
Another direction is to utilize external signals (e.g., Google Trends, weather) to enhance Holiday Demand Modelling: External data sources such as Google Trends or weather forecasts can enrich holiday-aware models. [53] utilizes multimodal neural networks that integrate holiday calendars, Google search trends, and sales data to enhance retail demand forecasts, with Google Trends features serving as leading indicators for holiday interest and facilitating early planning.
Funding
No funding received.
Data Availability Statement
There is no data involved in this paper.
Conflicts of Interest
I am reporting that I did not receive any funding from any organization for this research. There is no conflict of interest.
References
- National Retail Federation (NRF). "Holiday and Seasonal Trends." Available at: https://nrf.com/insights/holiday-and-seasonal-trends, 2023.
- McKinsey & Company. "How retailers can win the 2022 holiday season." Available at: https://www.mckinsey.com, 2022.
- U.S. Census Bureau. "Monthly Retail Trade Report – Holiday Season Sales Summary." Available at: https://www.census.gov/retail/index.html, 2023.
- Elghadghad, Ahmed, Ahmad Alzubi, and Kolawole Iyiola. "Out-of-stock prediction model using buzzard coney hawk optimization-based LightGBM-enabled deep temporal convolutional neural network." Applied Sciences 14.13 (2024): 5906.
- Xu, Lu. "Predicting Out-of-Stock Risk Under Delivery Schedules Using Neural Networks." Electronics 14.15 (2025): 3012. [CrossRef]
- Douaioui, Kaoutar, et al. "Machine Learning and Deep Learning Models for Demand Forecasting in Supply Chain Management: A Critical Review." Applied System Innovation (ASI) 7.5 (2024). [CrossRef]
- Ziel, Florian. "Modeling public holidays in load forecasting: a German case study." Journal of Modern Power Systems and Clean Energy 6.2 (2018): 191-207.
- Huber, Jakob, and Heiner Stuckenschmidt. "Daily retail demand forecasting using machine learning with emphasis on calendric special days." International Journal of Forecasting 36.4 (2020): 1420-1438.
- retail customer experience, Consumers hit stores big time during long Thanksgiving weekend, https://www.retailcustomerexperience.com/news/consumers-hit-stores-big-time-during-long-thanksgiving-weekend/#:~:text=Of%20the%20196.7%20million%20U.S.%20holiday%20shoppers,spike%20from%20approximately%20105%20million%20last%20year. [CrossRef]
- Webel, Karsten. "A review of some recent developments in the modelling and seasonal adjustment of infra-monthly time series." (2022).
- Zhang, Feng, Shuhua Jiang, and Yi Cao. "A sales forecasting model for the consumer goods with holiday effects." Journal of Risk Analysis and Crisis Response, vol. 10, no. 1, 2020, pp. 33–42.
- Obermair, Elisabeth, Andreas Holzapfel, and Heinrich Kuhn. "Operational planning for public holidays in grocery retailing – Managing the grocery retail rush." Operations Management Research, vol.16, no.2, 2023, pp.931–948.
- Instacart Corporate. "‘Tis the Season … for Last Minute Shopping: Thanksgiving and Christmas 2022 Customer Behavior." Platform insights report (2022). https://www.instacart.com/company/updates/thanksgiving-christmas-2023-holiday-data-report/. [CrossRef]
- Instacart / Skai. "2021 publisher holiday trends: Instacart platform data." Platform insights report (2021). https://skai.io/blog/2021-publisher-holiday-trends-instacart/.
- NielsenIQ. "Fresh insights about grocery on-shelf availability in the holiday period." Industry report (2022). https://nielseniq.com/global/en/insights/analysis/2022/fresh-insights-about-grocery-on-shelf-availability-in-the-post-covid-era/.
- Brabec, Marek, et al. "Statistical model of segment-specific relationship between natural gas consumption and temperature in daily and hourly resolution." Natural Gas (2010): 393-416.
- Hor, Ching-Lai, Simon J. Watson, and Shanti Majithia. "Daily load forecasting and maximum demand estimation using ARIMA and GARCH." 2006 International conference on probabilistic methods applied to power systems. IEEE, 2006.
- McElroy, Tucker S., Brian C. Monsell, and Rebecca J. Hutchinson. "Modeling of Holiday Effects and Seasonality in Daily Time Series." Center for Statistical Research and Methodology Report Series (RRS2018-01), U.S. Census Bureau, January 23, 2018.
- Soares, Lacir J., and Marcelo C. Medeiros. Modeling and forecasting short-term electricity load: A comparison of methods with an application to Brazilian data. International Journal of Forecasting 24.4 (2008): 630-644.
- Baunach, Ludwig, and Stefan Spinler. "Enhancing E-Commerce Fulfilment Operations: Machine Learning for Order Forecasting and Workforce Scheduling." Available at SSRN 5341892 (2025). [CrossRef]
- Wolters, Jannik, and Arnd Huchzermeier. "Joint in-season and out-of-season promotion demand forecasting in a retail environment." Journal of Retailing 97.4 (2021): 726-745.
- Heaps, Sarah E., Malcolm Farrow, and Kevin J. Wilson. "Identifying the effect of public holidays on daily demand for gas." Technical report (arXiv preprint), 2018. [CrossRef]
- Lamedica, R., et al. "A neural network based technique for short-term forecasting of anomalous load periods." IEEE transactions on Power Systems 11.4 (1996): 1749-1756. [CrossRef]
- Haselbeck, Florian, et al. "Machine learning outperforms classical forecasting on horticultural sales predictions." Machine Learning with Applications 7 (2022): 100239. [CrossRef]
- Gunawan, Jeffrey, and Chin-Ya Huang. "An extensible framework for short-term holiday load forecasting combining dynamic time warping and LSTM network." IEEE Access 9 (2021): 106885-106894. [CrossRef]
- Hirche, Maike, Laura Büsch, and Georg Wilms. "Comparing the day temperature and holiday effects on retail sales of alcoholic beverages—a time-series analysis." International Journal of Alcohol and Drug Research 9.1 (2021): 11–20. [CrossRef]
- Cox, David R. "Interaction." International Statistical Review/Revue Internationale de Statistique (1984): 1-24.
- Guo, Yujie, Ying Chen, and Yu Zhang. "Enhancing demand prediction: A multi-task learning approach for taxis and TNCs." Sustainability 16.5 (2024): 2065.
- Fiot, Jean-Baptiste, and Francesco Dinuzzo. "Electricity demand forecasting by multi-task learning." IEEE Transactions on Smart Grid 9.2 (2016): 544-551. [CrossRef]
- Hyndman, Rob J., and George Athanasopoulos. Forecasting: principles and practice. OTexts, 2018. [CrossRef]
- Liao, T. Warren. "Clustering of time series data—a survey." Pattern recognition 38.11 (2005): 1857-1874.
- Brabec, Marek, et al. "A statistical model for natural gas standardized load profiles." Journal of the Royal Statistical Society Series C: Applied Statistics 58.1 (2009): 123-139.
- Cancelo, J., A. Espasa, and R. Grafe. "Forecasting from one day to one week ahead for the spanish system operator,+." PVGTPCVKQPCN, QWTPCN QH (QTGECUVKPI 24: 588. [CrossRef]
- Jain, Ankur, Manghat Nitish Menon, and Saurabh Chandra. "Sales forecasting for retail chains." San Diego, California: UC San Diego Jacobs School of Engineering (2015).
- Arunraj, Nari Sivanandam, and Diane Ahrens. "A hybrid seasonal autoregressive integrated moving average and quantile regression for daily food sales forecasting." International Journal of Production Economics 170 (2015): 321-335.
- McSharry, Patrick E., Sonja Bouwman, and Gabriël Bloemhof. "Probabilistic forecasts of the magnitude and timing of peak electricity demand." IEEE Transactions on Power Systems 20.2 (2005): 1166-1172.
- Caetano, Ricardo, José Manuel Oliveira, and Patrícia Ramos. "Transformer-Based Models for Probabilistic Time Series Forecasting with Explanatory Variables." (2025). [CrossRef]
- Dong, Huanhe, et al. "The Short-Term Load Forecasting for Special Days Based on Bagged Regression Trees in Qingdao, China." Computational intelligence and neuroscience 2021.1 (2021): 3693294. [CrossRef]
- Petroșanu, Dana-Mihaela, et al. "E-commerce sales revenues forecasting by means of dynamically designing, developing and validating a directed acyclic graph (DAG) network for deep learning." Electronics 11.18 (2022): 2940. [CrossRef]
- Smith, Michael. "Modeling and short-term forecasting of New South Wales electricity system load." Journal of Business & Economic Statistics 18.4 (2000): 465-478. [CrossRef]
- López, Miguel, et al. "Classification of special days in short-term load forecasting: the Spanish case study." Energies 12.7 (2019): 1253.
- Panapakidis, Ioannis P. "Application of hybrid computational intelligence models in short-term bus load forecasting." Expert Systems with Applications 54 (2016): 105-120. [CrossRef]
- Shu, Jun, et al. "Meta-weight-net: Learning an explicit mapping for sample weighting." Advances in neural information processing systems 32 (2019).
- Khotanzad, Alireza, Reza Afkhami-Rohani, and Dominic Maratukulam. "ANNSTLF-artificial neural network short-term load forecaster-generation three." IEEE Transactions on Power Systems 13.4 (2002): 1413-1422.
- Son, Jihoo, et al. "Day-ahead short-term load forecasting for holidays based on modification of similar days’ load profiles." IEEE Access 10 (2022): 17864-17880.
- Zhang, Qipei, et al. "A deep learning based real-time load forecasting method in electricity spot market." Journal of Physics: Conference Series. Vol. 1176. No. 6. IOP Publishing, 2019.
- Zhu, Kedong, Jian Geng, and Ke Wang. "A hybrid prediction model based on pattern sequence-based matching method and extreme gradient boosting for holiday load forecasting." Electric Power Systems Research 190 (2021): 106841.
- Xie, Jingrui, and Alex Chien. "Holiday demand forecasting in the electric utility industry." 2016 SAS Global Forum, Las Vegas, NV, Apr 18. Vol. 21. 2016.
- DoorDash Data Science Team. "How DoorDash improves holiday forecasts with a cascade machine learning approach." DoorDash Blog (2023). https://careersatdoordash.com/blog/how-doordash-improves-holiday-predictions-via-cascade-ml-approach/.
- Abolghasemi, Mahdi, Eshragh, Ali, Hurley, Jason, and Fahimnia, Behnam. "Demand forecasting in the presence of systematic events: Capturing sales promotions." International Journal of Production Economics, 2021, 232, 107948.
- Yi, Siyuan, Chen, Xing, and Tang, Chuanming. "Tsformer: Time series Transformer for tourism demand forecasting." arXiv preprint, 2021.
- Wolff, Malcolm, Olivares, Kin G., Oreshkin, Boris, et al. "SPADE: Split Peak Attention Decomposition for Retail Demand Forecasting." arXiv preprint, 2024. [CrossRef]
- Kumar, Nitesh, et al. "Multimodal neural network for demand forecasting." arXiv preprint, 2022.
- Marziali, Andrea, Emanuele Fabbiani, and Giuseppe De Nicolao. "Ensembling methods for countrywide short-term forecasting of gas demand." International Journal of Oil, Gas and Coal Technology 26.2 (2021): 184-201.
- Taylor, Sean J., and Benjamin Letham. "Forecasting at scale." The American Statistician 72.1 (2018): 37–45.
- Prestwich, S., Tarim, A., Rossi, R., Hnich, B. "Intermittency and Obsolescence: A Croston Method With Linear Decay." arXiv preprint (2014).
Figure 1.
Logical relationship of the five main topics.
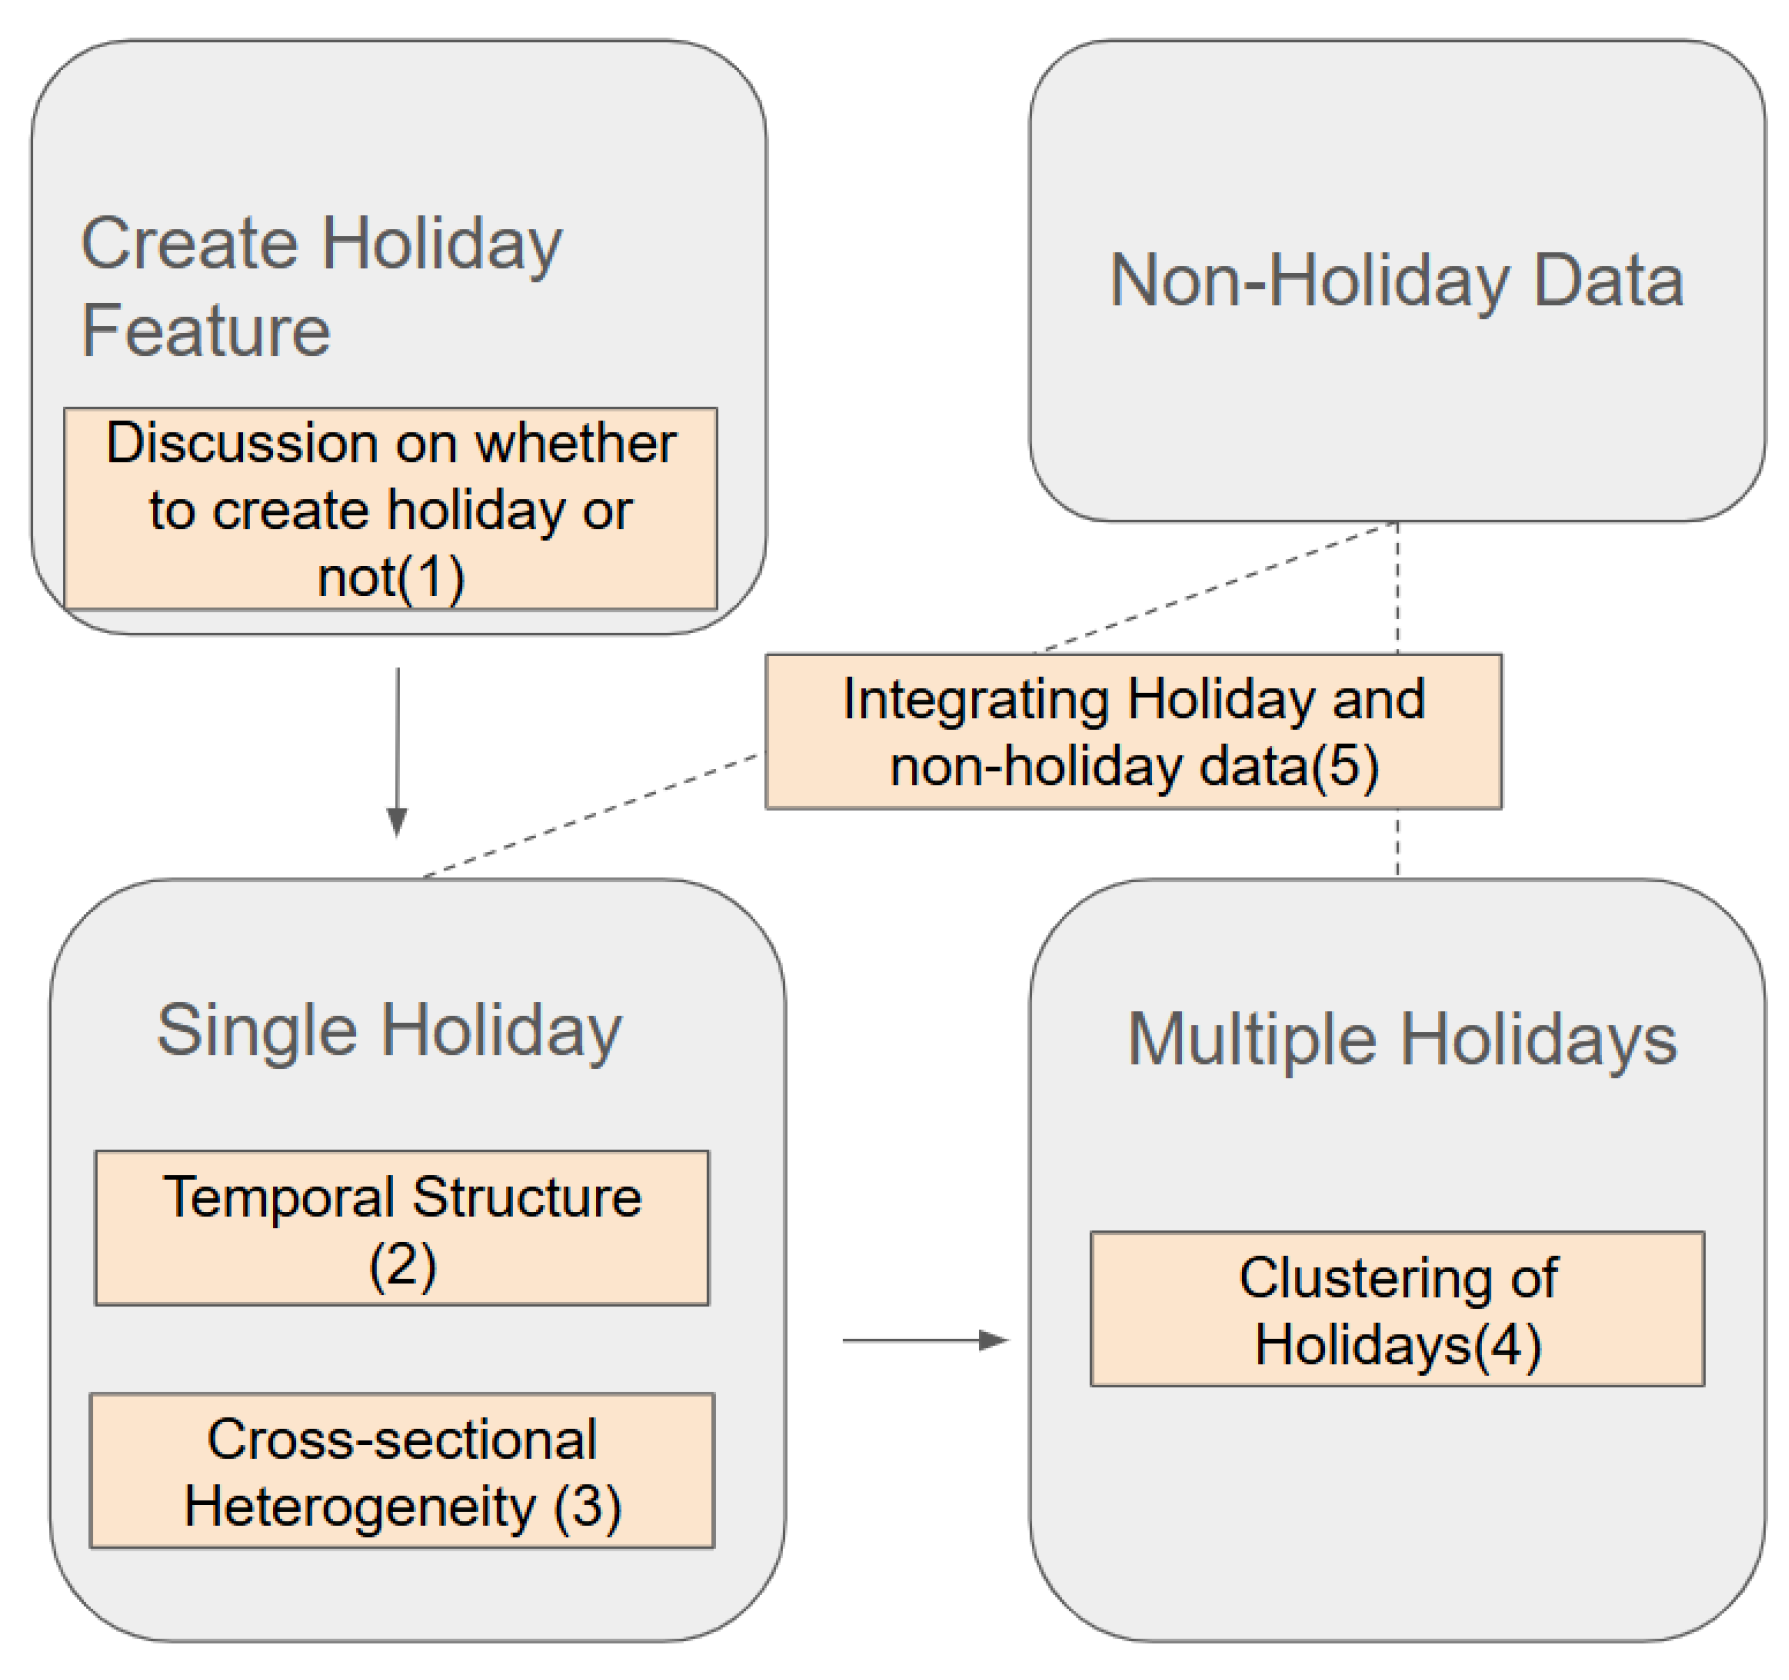
Figure 2.
Decision Flow of Modeling Holiday Event.
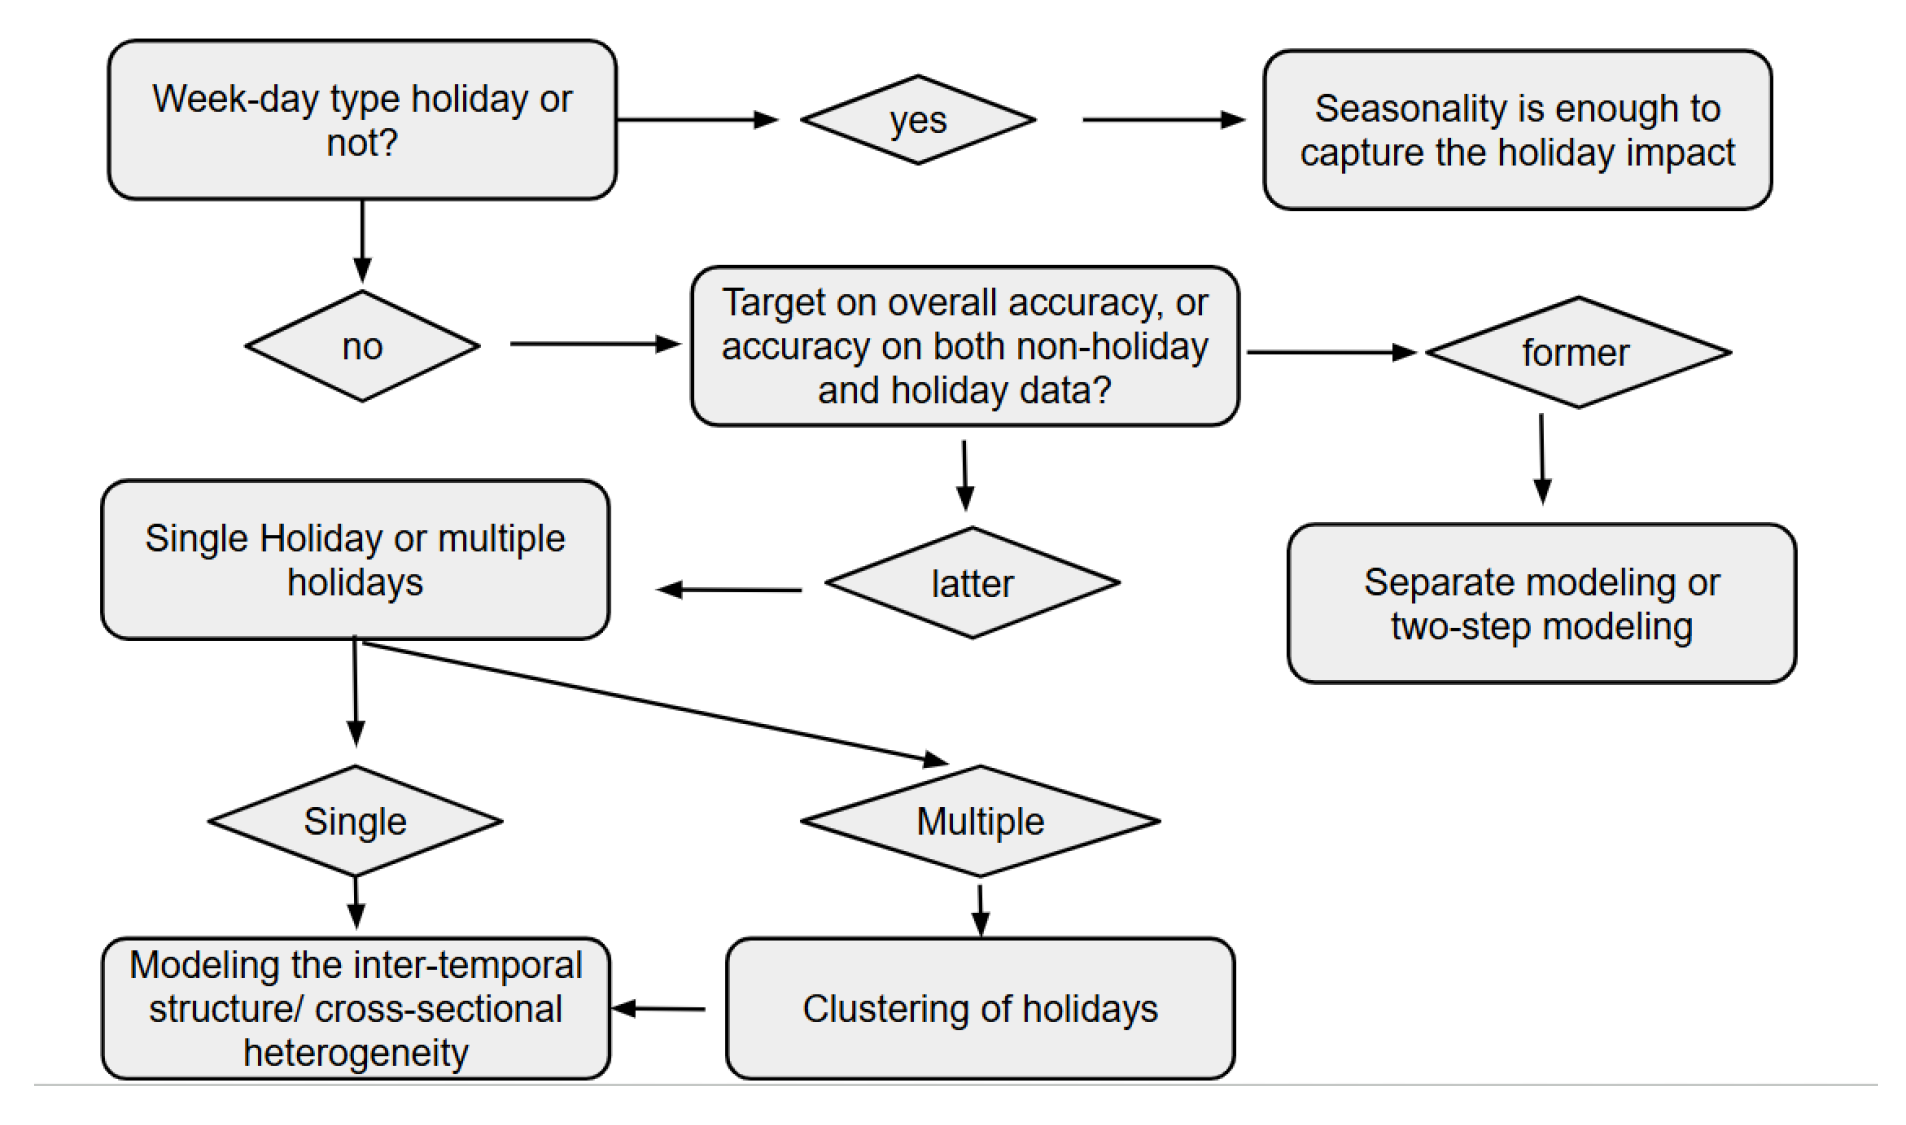

Table 1.
Summary of Reviewed Studies: Targeted Industry.
| Domain | Year Range | Number of Papers |
|---|---|---|
| Retail | 2009–2025 | 22 |
| Energy (electricity, gas) | 2000–2023 | 23 |
| Other | 2010–2025 | 1 |
| Total | 2000–2025 | 46 |
Table 2.
Geographic Distribution of Reviewed Studies.
| Country / Region | Number of Papers |
|---|---|
| United States | 13 |
| East Europe | 4 |
| West Europe | 10 |
| United Kingdom | 2 |
| China | 7 |
| South America | 2 |
| Autralia | 2 |
| East Asia/Southern East Asia | 4 |
| Multiple Countries | 2 |
| Total | 46* |
Table 3.
Methodological Distribution of Reviewed Studies.
| Methodological Approach | Number of Papers |
|---|---|
| Statistical models only | 14 |
| Machine learning / neural networks | 25 |
| Descriptive methods | 7 |
| Total | 46* |
Table 4.
Evidence of sales change before and after holiday.
| Country | Paper/Report | Details/Conclusion |
|---|---|---|
| China | [11] | Demonstrated that cigarette sales in China increase sharply before Lunar New Year and then decline significantly |
| German | [12] | Reported that in German grocery retail, perishables exhibit strong demand surges just ahead of public holidays, followed by a drop in the days afterward |
| The United States | [13,14] | Major order volumes spike in the week before Thanksgiving and Christmas, with item-level sales increases of up to 40% compared to baseline weeks |
| The United States | [15] | Found that in the weeks leading up to Thanksgiving, on-shelf availability for grocery items declined due to stockouts driven by surge demand, highlighting the degree of pre-holiday stocking behavior. |
Table 5.
Literature that uses categorical variables to depict the inter-temporal structure of holiday impact
Table 5.
Literature that uses categorical variables to depict the inter-temporal structure of holiday impact
| Paper | Details/Conclusion |
|---|---|
| [8] | Classified the date as one of the following categories: where special days exist, special day exists one day before, special day exists one day later, special day exists same day of the previous week |
| [11] | Captured anticipatory demand (e.g., fresh food purchases leading into Thanksgiving) and post-event slumps (e.g., returns in electronics post-Christmas) |
| [16] | Created date code, based on the (non)working day information in the previous period, in the current period, and in the following period |
| [17] | Special Days (holidays), Proximity Days (before and after special day, Mondays before special days, and Fridays after special ), Non-special Days(normal weekdays and weekends) |
| [18] | Holiday regressors are constructed by first determining the calendar dates for the actual holiday, say with day index t, and declaring a window of times for which the activity is increased or decreased |
| [19] | Identify a total of 15 day types, including weekdays, days before and after public holidays, and bridge days. |
| [20] | To encapsulate the potential impact of major events such as Christmas or Black Friday, the paper introduces indicators: one week before Christmas, two weeks before Christmas, and one week after Christmas, Black Week, black weekend, and after Cyber Week (one week after Cyber Monday. |
| [21] | Created feature variable to indicate if the week is before a certain holiday |
Table 6.
Literature that quantitatively depicts the inter-temporal structure of holiday impact.
| Paper | Details/Conclusion |
|---|---|
| [22] | by using decay expression, modeled the probability of transition into the pre-holiday state, as well as the probability of transition out from the post-holiday state. |
| [23] | Considering the load drop due to the proximity of the forecast day, the work applied a special rule by adding a distance variable of a specific day from Sunday or a holiday day. |
| [24] | Counter for a public in the impact of a single holiday event, i.e., the time-dimension heterogeneity of holiday-event as well as Valentine’s and Mother’s Day |
| [25] | Considered the day of the week indicator for |d| days before each public holidays, with |
Table 7.
Literature on Approaches of Clustering of Holidays.
| Method | Paper | Details |
|---|---|---|
| Knowledge-based clustering | [32] | Holidays are classified as bank holiday (when banks are closed, typically in observance of a federal or local holiday), Christmas, Easter. |
| Knowledge-based clustering | [33] | There are two classes of holidays, common holidays and special holidays. Common holidays include some national holidays and all regional and local holidays. |
| Knowledge-based clustering | [34] | Considered State Holiday(public holiday, Easter holiday, Christmas) and School Holiday (indicates if the event was affected by the closure of public schools, which vary from state to state). |
| Knowledge-based clustering | [35] | The holidays are classified into four categories, such as regular holidays, festivals, upper Austrian holidays (except German holidays), and school vacations. |
| Knowledge-based clustering | [36] | The dummy variables describe days falling in the summer and Christmas periods (excluding feast days and weekends). Eleven feast days (New Year’s Day, Carnival, Easter Day, 2nd Easter Day, Ascension Day, Queen’s Day, Whit Sunday, Whit Monday, Christmas Day, Boxing Day, and New Year’s Eve). |
| Knowledge-based clustering | [37] | Events feature accounts for 31 distinct special days, such as holidays and other significant events, categorized into four classes: Sporting, Cultural, National, and Religious. Including these variables helps the models account for spikes or drops in sales associated with specific events. |
| Data-driven clustering | [38] | by analyzing demand profiles, national holidays are classified into statutory days, bridging days, and days preceding and following holidays, which are called proximity days |
| Data-driven clustering | [39] | By analyzing the historical dataset, divided dates into three categories: weekends and public holidays (marked with 1), Black Fridays (marked with 2), and ordinary days (marked with 0). |
| Data-driven clustering | [40] | Public holidays are treated as Sundays, based on their similar historical electricity load profile. |
| Data-driven clustering | [41] | Based on load profile data, developed a deep classification of the special days to improve forecasting accuracy, |
| Data-driven clustering | [42] | Proposes clustering special days according to their load pattern. The cluster information and the average load of reference days are fed into an ANN. |
| Information sharing across holiday effect | [22] | When setting prior distribution, the paper allows positive correlation between the parameters that describe the effects of each type of public holiday so that information can be pooled across types. |
Table 8.
strategies of separately modeling the demand for holidays.
| Method | Paper | Details/Conclusion |
|---|---|---|
| Utilizing only historical holiday data | [44] | Found the "close" holidays to the upcoming one in the historical data, with closeness criterion being the temperature at the peak load hour. Then, the peak load of the upcoming holiday is computed by a novel weighted interpolation function. |
| Utilizing only historical holiday data | [45] | Adjusted the load profiles of similar days to that of the target holiday, which is implemented by incorporating each factor-induced effect on the load. Specifically, a rule-based similar day selection module is constructed to select ’similar’ days. The peak load of the upcoming holiday is computed by a weighted interpolation function. |
| Utilizing only historical holiday data | [45] | Adjusted the load profiles of similar days to that of the target holiday, which is implemented by incorporating each factor-induced effect on the load. Specifically, a rule-based similar day selection module is constructed to select ’similar’ days. |
| Utilizing only historical holiday data | [46] | the working days and holidays are separately trained |
| Utilizing only historical holiday data | [47] | try to predict the electricity demand of the target holiday using only holiday data. On the one hand, during training, they select historical holidays whose load profiles are similar to the target holiday and use the average of these historical holiday profiles to predict the target holiday’s load profile. They also trained another model using only holiday data, which tries to capture the extreme demand value during these periods. The two models’ predictions are combined to produce a final prediction on the target holiday’s load |
| Model the residual/uplift | [48] | Applied a two-stage approach. During the first stage, holiday demand is forecast using the benchmark model, treating holidays as regular days. During the second stage, the average of the residuals is calculated by holiday and by hour. The averaged residual is then added by holiday and by hour to the stage-one load forecasts to yield the final two-stage forecast. |
| Model the residual/uplift | [49] | Applied a gradient boosting model to forecast baseline demand, and then used a separate linear regression to estimate holiday uplift multipliers. These multipliers are then applied to the base forecast only when holiday indicators are active. |
| Model the residual/uplift | [50] | Proposed a DUS(demand uplift state) algorithm that computes the average demand uplift for each possible case of special event state, and use it for demand forecast. |
| Model the residual/uplift | [21] | Applied a two-step approach: in the first stage, they forecast the seasonal sales cycle by fitting a regression model to a decomposed training set, which excludes promotional and holiday sales, and then extrapolate that model to a testing set. In the second stage, they integrate the resulting seasonal forecast into a multiplicative demand function that accounts for consumer stockpiling and captures promotional and holiday sales uplifts. |
Table 9.
Summary of future research direction.
| Method | Details |
|---|---|
| Deciding the holiday events to model | joint modeling of fixed-date holiday and day-of-week features. |
| Modeling Inter-Temporal Change in Holiday Impact |
|
| Modeling Cross-Section Heterogeneity of Holiday Impact |
|
| Clustering of Holiday Events |
|
| Integration of Holiday and Non-holiday Data | develop algorithms that adaptively learn the optimal sample weights for holiday and non-holiday data |
Disclaimer/Publisher’s Note: The statements, opinions and data contained in all publications are solely those of the individual author(s) and contributor(s) and not of MDPI and/or the editor(s). MDPI and/or the editor(s) disclaim responsibility for any injury to people or property resulting from any ideas, methods, instructions or products referred to in the content. |
© 2025 by the author. Licensee MDPI, Basel, Switzerland. This article is an open access article distributed under the terms and conditions of the Creative Commons Attribution (CC BY) license.
Copyright: This open access article is published under a Creative Commons CC BY 4.0 license, which permit the free download, distribution, and reuse, provided that the author and preprint are cited in any reuse.


