
Submitted:
09 January 2026
Posted:
12 January 2026
You are already at the latest version
Abstract
A placement predictor will be designed to calculate the likelihood of a student being hired by a company, based on the company’s criteria. The predictor uses various parameters to evaluate the student’s skill level. Some parameters come from the university, while others are gathered from tests conducted in the placement management system. By combining these data points, the predictor aims to accurately determine if a student will be placed in a company. Data from previous students will be used to train the predictor. However, the challenge was to find an effective classification algorithm that could achieve high accuracy with our data set. Different algorithms yield varying accuracy based onthe problem they address and the data they handle. Therefore, we chose four algorithms: KNN, SVM, Logistic Regression, and Random Forest. We will compare the accuracy of each algorithm in relation to our problem and data set. The results will guide us in choosing the best algorithm for implementing our predictor in the placement management system.
Keywords:
machine learning
; placement prediction
; student employability
; random forest
; data analytics
; educational data mining
; predictive modelling
I. Introduction
Campus placements play an important role in shaping the careers of engineering and technology students. For many, a successful placement marks their first professional milestone. It connects their academic learning with real-world experience. However, the placement process is often uncertain and highly competitive. This creates anxiety and confusion among students who are unsure about their chances of being placed. Placement prediction is valuable because it gives students insights into their readiness for employment. By examining factors like academic performance, technical skills, project experience, internships, and communication skills, placement prediction models can highlight students’ strengths and weaknesses. This helps students make informed choices about their career preparation and aids training and placement cells in tailoring guidance and support programs.
The need for a placement prediction system comes from the growing interest in educational analytics. Traditional placement assessments are often manual and subjective, limiting their effectiveness. They usually don’t account for the many factors that affect employability. With the growth of machine learning techniques, it’s now possible to create systems that learn from past placement data. These systems can provide reliable predictions about a student’s likelihood of being placed.
Such a system tackles two key challenges:
- -
- Student perspective: It reduces uncertainty, improves selfawareness, and offers personalized feedback for development.
- -
- Institutional perspective: It helps placement cells identify at-risk students early and take action to improve overall placement rates.
In summary, placement prediction systems act as a guidance tool that combines academic insights with predictive modeling. They ultimately lead to better career readiness, improved placement outcomes, and a stronger institutional reputation.
2. Objectives
- 1)
- Predict placement chances using machine learning techniques
Employ classification algorithms (for example, Random Forest) to analyze historical academic and technical data and provide reliable predictions of student placement outcomes.
- 2)
- Assist students in evaluating placement readiness Provide personalized feedback based on input features such as CGPA, technical skills, internships, projects, and communication abilities to help students understand their readiness and areas for improvement.
- 3)
- Identify key factors influencing placement outcomes Analyze feature importance to determine which academic, technical, and behavioral attributes most strongly affect employability and provide interpretable insights to stakeholders.
- 4)
- Develop a user-friendly web-based platform
Implement an interactive frontend and backend using Flask (Python), HTML, CSS, and JavaScript, backed by a lightweight database (SQLite) for easy deployment and maintenance.
- 5)
- Store and track prediction history
Maintain a record of student inputs and prediction results so progress can be monitored over time and historical trends can be examined.
- 6)
- Support decision-making and career planning
Offer tools and dashboards for students and placement officers to create data-driven strategies that improve placement outcomes and guide individual career planning.
- 7)
- Design a scalable and efficient system
Structure the platform modularly so it can scale and integrate future features such as automated resume analysis, real-time job market data ingestion, and API-based model updates.
3. Methodology
The method used to develop the Placement Prediction System has three main stages: data preprocessing, model training, and system integration. Each stage ensures the system is robust, accurate, and user-friendly.
3.1. Data Preprocessing
Data preprocessing is a crucial step to prepare raw data for machine learning. The dataset usually includes academic records, technical skills, internships, projects, communication abilities, and backlog information. The following preprocessing tasks were performed:
- Data Cleaning: Missing values were handled using imputation techniques, and duplicate or irrelevant records were removed.
- Data Transformation: Features such as CGPA, percentage scores, and categorical skills were normalized or converted into numerical form using label encoding and onehot encoding.
- Class Balancing: Since placement datasets often exhibit imbalance (more “placed” than “not placed” records), the Synthetic Minority Oversampling Technique (SMOTE) was applied to balance the class distribution.
- Feature Selection: Only the most relevant attributes (CGPA, technical skills, projects, internships, communication) were retained using correlation analysis and domain knowledge.
3.2. Model Training
The machine learning model was trained using the Random Forest Classifier. This choice was made due to its ability to handle nonlinear data effectively and its resistance to overfitting. The training process involved the following steps:
- Dataset Splitting: The dataset was split into training (80%) and testing (20%) sets to evaluate generalization capability.
- Model Selection: Random Forest was chosen after comparing with other classifiers such as Na¨ıve Bayes, Logistic Regression, and Support Vector Machine (SVM).
- Hyperparameter Tuning: GridSearchCV was applied to optimize parameters including the number of trees, maximum depth, and feature selection strategy.
- Model Evaluation: Performance was measured using metrics such as accuracy, precision, recall, and F1-score. Cross-validation ensured reliable generalization.
- Model Persistence: The trained model was saved using Joblib to allow reuse without retraining.
3.3. System Integration
The trained machine learning model was integrated into a web application to make it accessible for students and placement officers. The integration involved the following components:
- Frontend Development: A user-friendly interface was developed using HTML, CSS, and JavaScript to collect student details.
- Backend Integration: The Flask framework (Python) connected the frontend with the ML model. User input was processed and predictions were displayed instantly.
- Database Management: SQLite served as the backend database to store student details and prediction history, enabling progress tracking.
3.4. Prediction Workflow:
- 1)
- User enters academic and technical details in the web form.
- 2)
- The Flask backend sends the input to the trained Random Forest model.
- 3)
- The model predicts the placement outcome and returns it to the frontend.
- 4)
- The prediction result, along with the timestamp and input features, is stored in SQLite.
4. System Architecture
4.1. Data Layer
The Data Layer serves as the foundation of the system, storing and managing both historical and real-time data.
Historical Dataset:
Contains student academic records such as 10th and 12th/Diploma percentages, CGPA, and the number of backlogs.
Includes technical features like knowledge of programming languages, certifications, internships, and project work.
Covers non-technical features such as communication skills, soft skills, and extracurricular achievements.
Database Management System (SQLite):
A lightweight, serverless, embedded database used for storing student profiles, login details, and prediction outcomes.
Organizes data into structured tables such as users and predictions for efficient retrieval.
Maintains a record of prediction history, enabling students and placement officers to track progress over time.
4.2. Application Layer
This is the main processing layer where data is cleaned, analyzed, and predictions are generated.
Data Preprocessing Module:
Handles data cleaning, feature encoding, normalization, and balancing using SMOTE.
Ensures data is in the correct format before being sent to the ML model.
Machine Learning Model:
Uses the Random Forest Classifier trained on historical placement data.
Chosen for its robustness against overfitting, ability to manage nonlinear data, and feature importance capabilities.
Hyperparameter tuning with GridSearchCV enhances prediction accuracy.
Model Persistence:
The trained model is saved with Joblib for deployment.
This prevents the need for retraining each time the system is used.
Backend Framework (Flask):
Connects the ML model with the web interface.
Handles HTTP requests, processes inputs, runs predictions, and sends results back to the user.
Acts as a link between the frontend and the database.
4.3. Presentation Layer
The Presentation Layer serves as the interface between the end user and the backend system.
User Interface (UI):
Built using HTML, CSS, and JavaScript.
Provides input forms where students can enter academic and skill-related data.
Displays predictions in a clear and easy-tounderstand format, such as “Placed” or “Not Placed.”
Visualization:
Charts and graphs (using Matplotlib or Chart.js) can be integrated to display key insights.
Visualizations highlight feature importance and allow comparisons with peers.
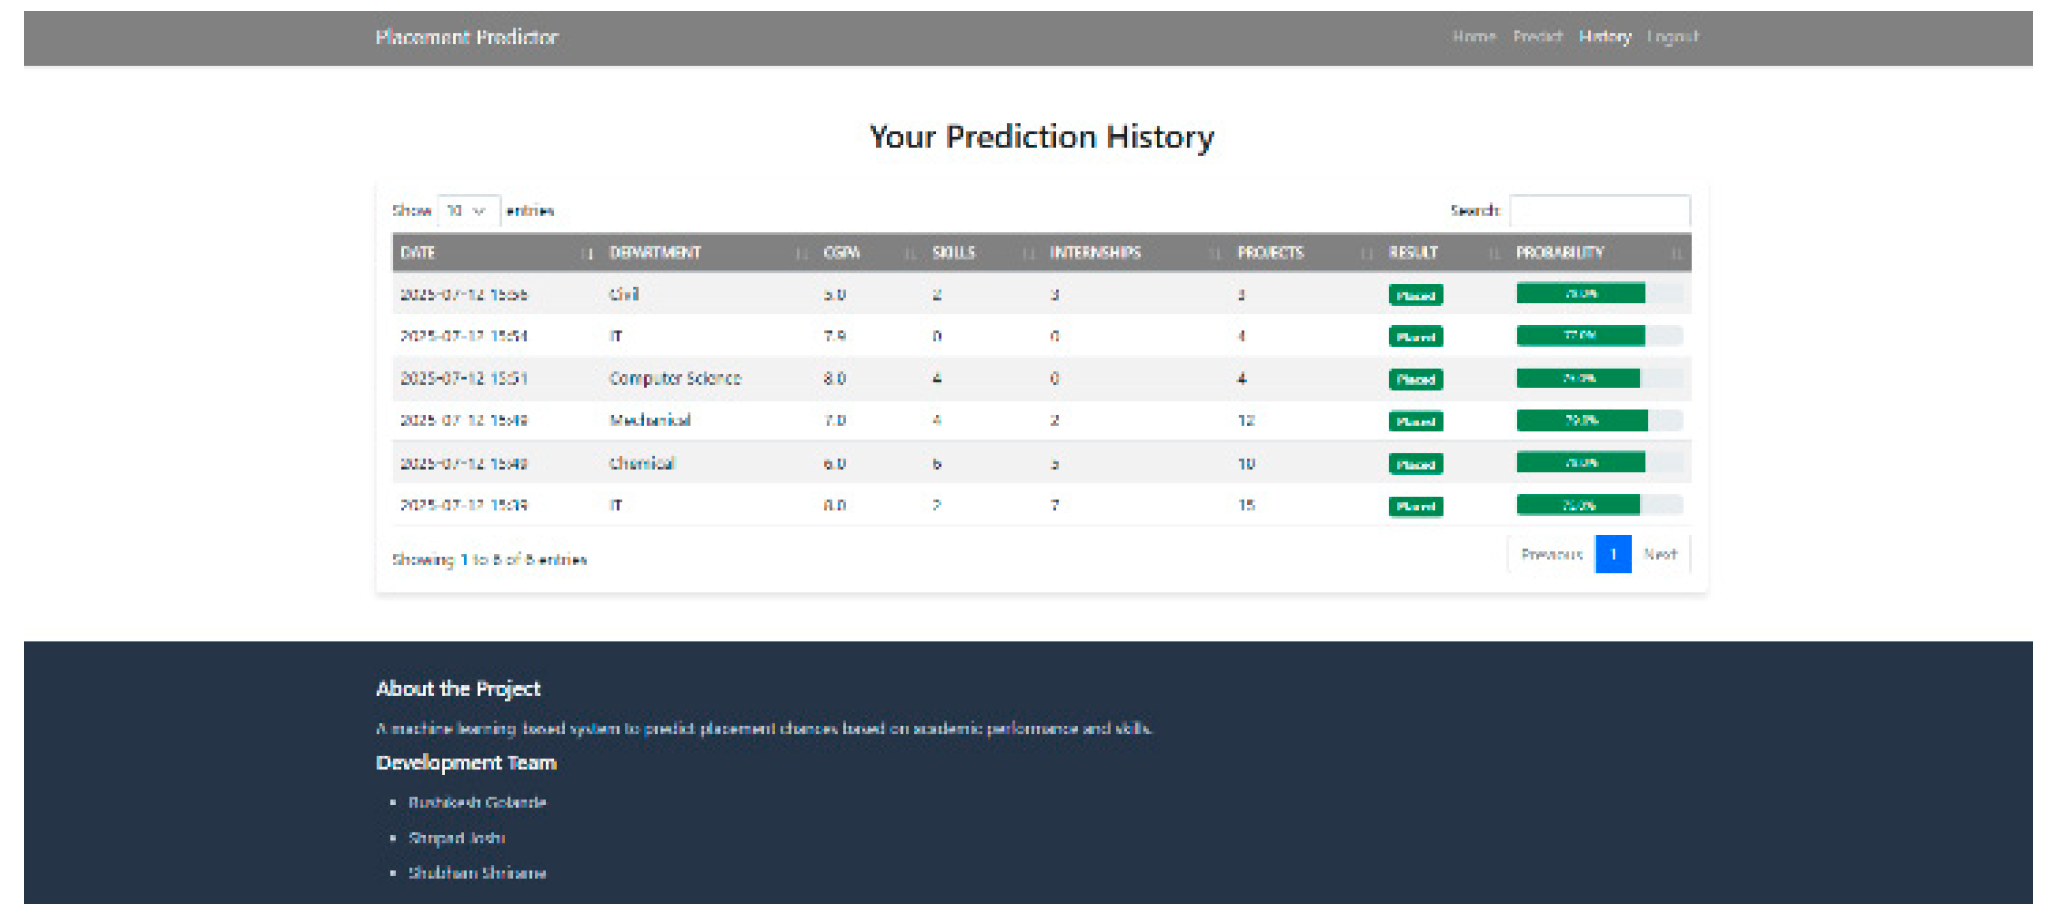
Prediction History Module:
Enables users to view previous predictions stored in the SQLite database.
Helps students and placement officers track progress over time.
4.4. System Workflow
- 1)
- Data Input: User enters personal, academic, and technical details through the web interface.
- 2)
- Request Handling: Flask backend receives the input and performs necessary preprocessing (encoding, scaling).
- 3)
- Prediction Generation: Input features are passed to the Random Forest model, which generates a placement prediction.
- 4)
- Output Display: The prediction result is displayed on the frontend along with feedback.
- 5)
- Storage: Input details and results are stored in SQLite, enabling retrieval for progress tracking and institutional analysis.
4.5. Advantages of the Architecture
The Placement Prediction System is designed with several practical features that enhance usability, scalability, and extensibility:
- Lightweight Deployment: Using Flask and SQLite makes it simple to deploy on local servers or cloud platforms such as Heroku or AWS.
- Scalability: The modular design allows easy replacement of components. For example, SQLite can be upgraded to MySQL or PostgreSQL, and Random Forest can be replaced with Gradient Boosting or Deep Learning models.
- Real-Time Predictions: Students receive instant results through the web application.
- Trackability: Predictions include timestamps, enabling students to monitor their progress and readiness for job placement.
- Extensibility: Future enhancements may include additional modules for resume analysis, company-specific predictions, or live job market integration.
5. Model Performance and Experimental Configuration
The primary objective of this study is to predict student placement outcomes using supervised machine learning techniques based on academic and skill-related attributes. The dataset comprises several key features that are commonly considered by recruiters during placement evaluations. These include Cumulative Grade Point Average (CGPA), internship experience, project work, number of backlogs, and technical skill proficiency.
Prior to model training, the dataset underwent a comprehensive preprocessing phase. Missing values present in the dataset were handled using appropriate imputation techniques to ensure data consistency. Numerical attributes were normalized to bring them to a common scale, thereby improving model convergence and performance. Categorical variables were transformed into numerical representations using suitable encoding techniques.
After preprocessing, the dataset was divided into training and testing subsets to enable an unbiased evaluation of model performance. A standard train-test split strategy was employed, where the majority of the data was used for training the models, and the remaining portion was reserved for testing and validation purposes.
5.1. Model Training and Validation Strategy
This section outlines the methodology used to train the machine learning models in order to achieve a good level of placement prediction results.
- 1)
-
Data Splitting: The data was split into training and testing sets in an 80:20 ratio:
- 80% Training Data: This is utilized in order to train machine learning algorithms based on learning patterns in the data provided.
- 20% Testing Data:For testing the trained models on unseen data.
- 2)
-
Training Procedure: Three supervised machine learning models were trained on the training dataset:
- Random Forest (RF)
- Logistic Regression (LR)
- Na¨ıve Bayes (NB)
- 3)
-
Validation Strategy: The testing dataset was used to evaluate the trained models. For comprehensive evaluation, these various performance metrics were used:
- Accuracy
- Precision
- Recall
- F1-Score
- Confusion Matrix Analysis
5.2. Full Model Performance Comparison
- Accuracy and Overfitting Resistance: Through ensemble learning, Random Forest reached the highest accuracy and developed very strong resistance against overfitting. Logistic Regression presented a moderate accuracy with reasonable overfitting control while Na¨ıve Bayes recorded low accuracy though had good resistance to overfitting because of its strong independence assumption.
- Handling Non-linearity: Random Forest is very efficient in capturing complicated and nonlinear relationships inherent in this data. Logistic Regression has limited capability to model nonlinear patterns, whereas Na”ive Bayes does rather poorly on this aspect owing to its simplistic probabilistic assumptions.
- Interpretability and Dataset Suitability: Logistic Regression is highly interpretable and suitable for baseline analysis. Random Forest offers medium interpretability but is the most suitable model for the dataset due to its robust performance. Na¨ıve Bayes shows average suitability as its assumptions restrict performance on real-world placement data.

Table 1.
Performance Metrics of Machine Learning Models.
| Model | Accuracy (%) | Precision | Recall | F1-Score |
| Random Forest | 85 | 0.86 | 0.84 | 0.85 |
| Logistic Regression | 78 | 0.77 | 0.76 | 0.76 |
| Na¨ıve Bayes | 72 | 0.71 | 0.70 | 0.70 |
Table 2.
Model Performance and Evaluation Metrics.
| Evaluation Aspect | Random Forest | Logistic Regression | Na¨ıve Bayes |
| Overall Accuracy | High | Medium | Low |
| Handling Non-linearity | Excellent | Limited | Poor |
| Interpretability | Medium | High | Medium |
| Overfitting Resistance | High | Medium | High |
| Suitability for Dataset | Best | Good | Average |
6. Top Performing Models (Detailed Analysis)
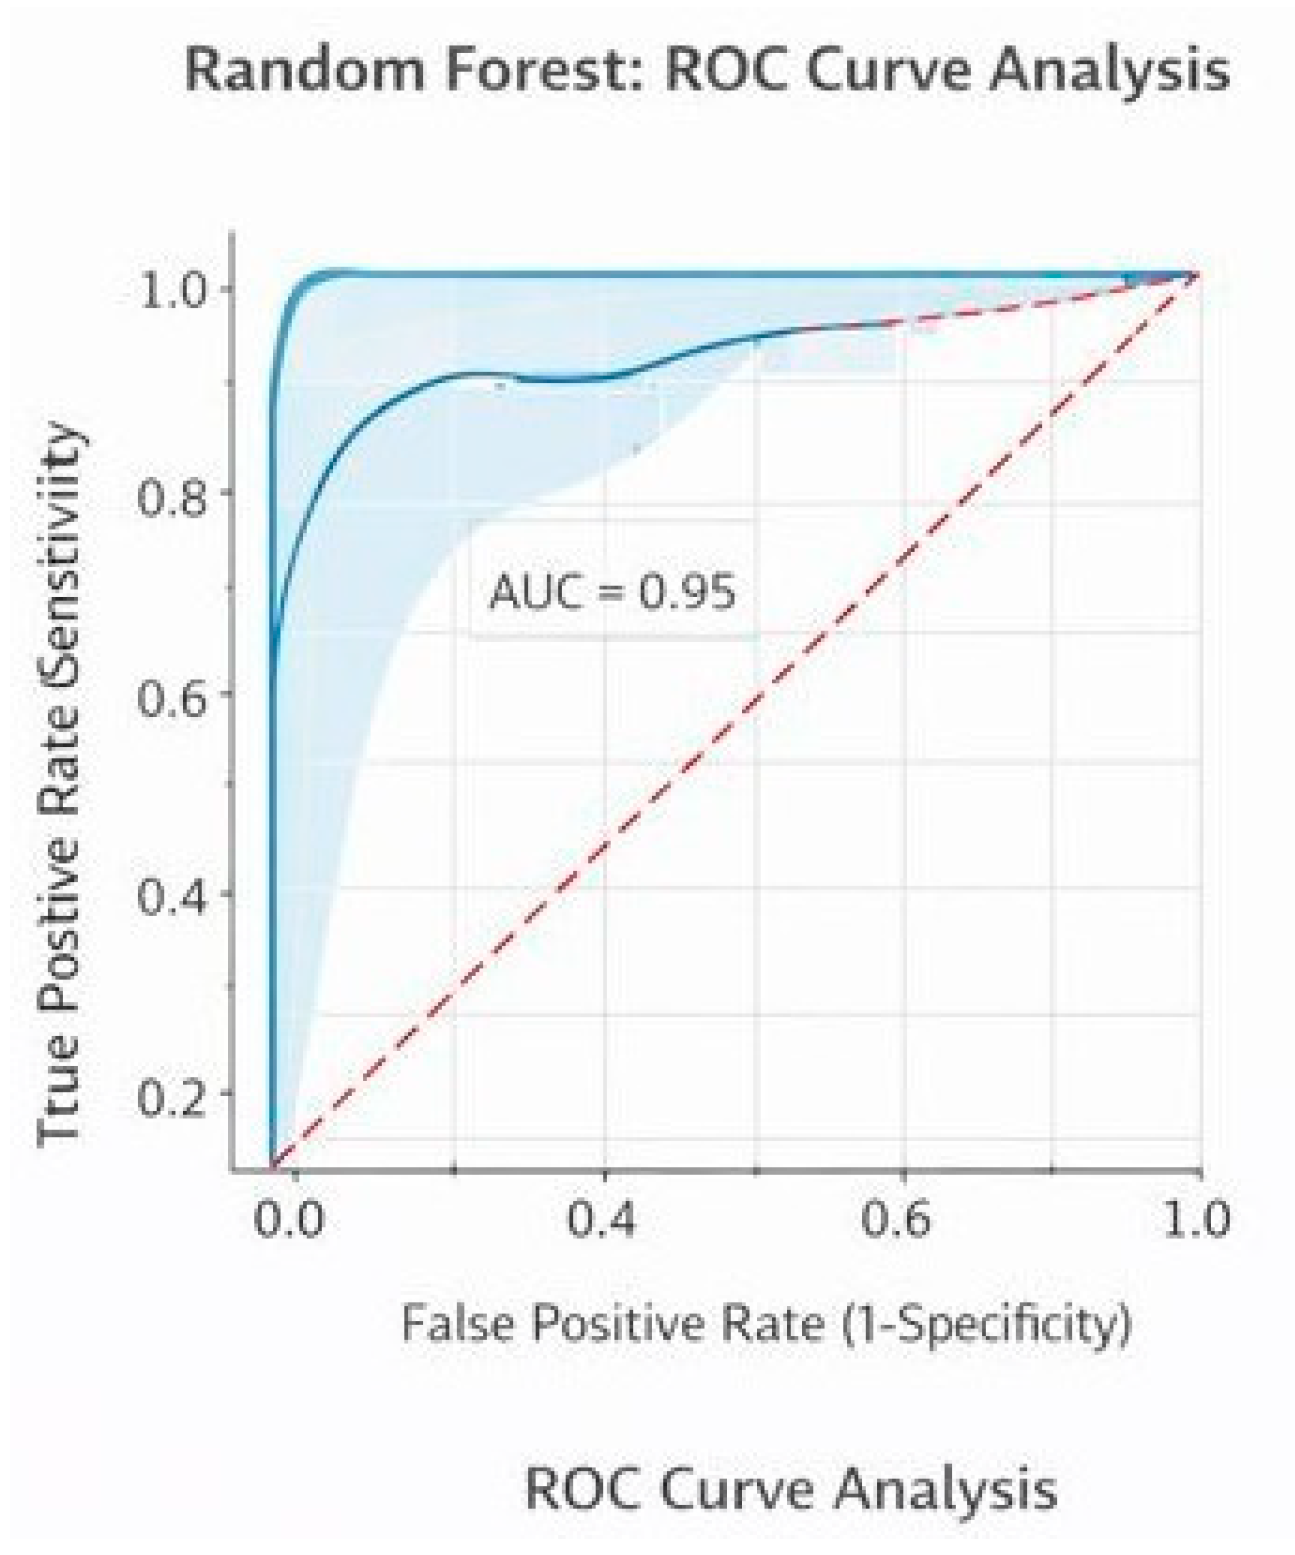
6.1. Random Forest: Confusion Matrix and ROC Curve Analysis
The diagram below depicts the confusion matrix of the Random Forest model adopted for placement prediction. It represents the comparison between actual placement results and predicted outcomes to evaluate the model’s performance. The high number of true positives and true negatives indicates that most student records are correctly classified as placed or not placed. The low values of false positives and false negatives show minimal misclassification. Overall, the confusion matrix confirms that the Random Forest model provides accurate and reliable predictions for student placement outcomes. The above diagram represents the ROC curve for the Random Forest model for “Placement Prediction using Various Machine Learning Models”. The curve measures the True Positive Rate versus the False Positive Rate. The curve for the Random Forest model clearly stands above the diagonal random curve with an AUC of 0.95, signifying a very high discriminative power in identifying placed as well as not-placed students.
Figure 1.
Confusion matrix for Random Forest model.
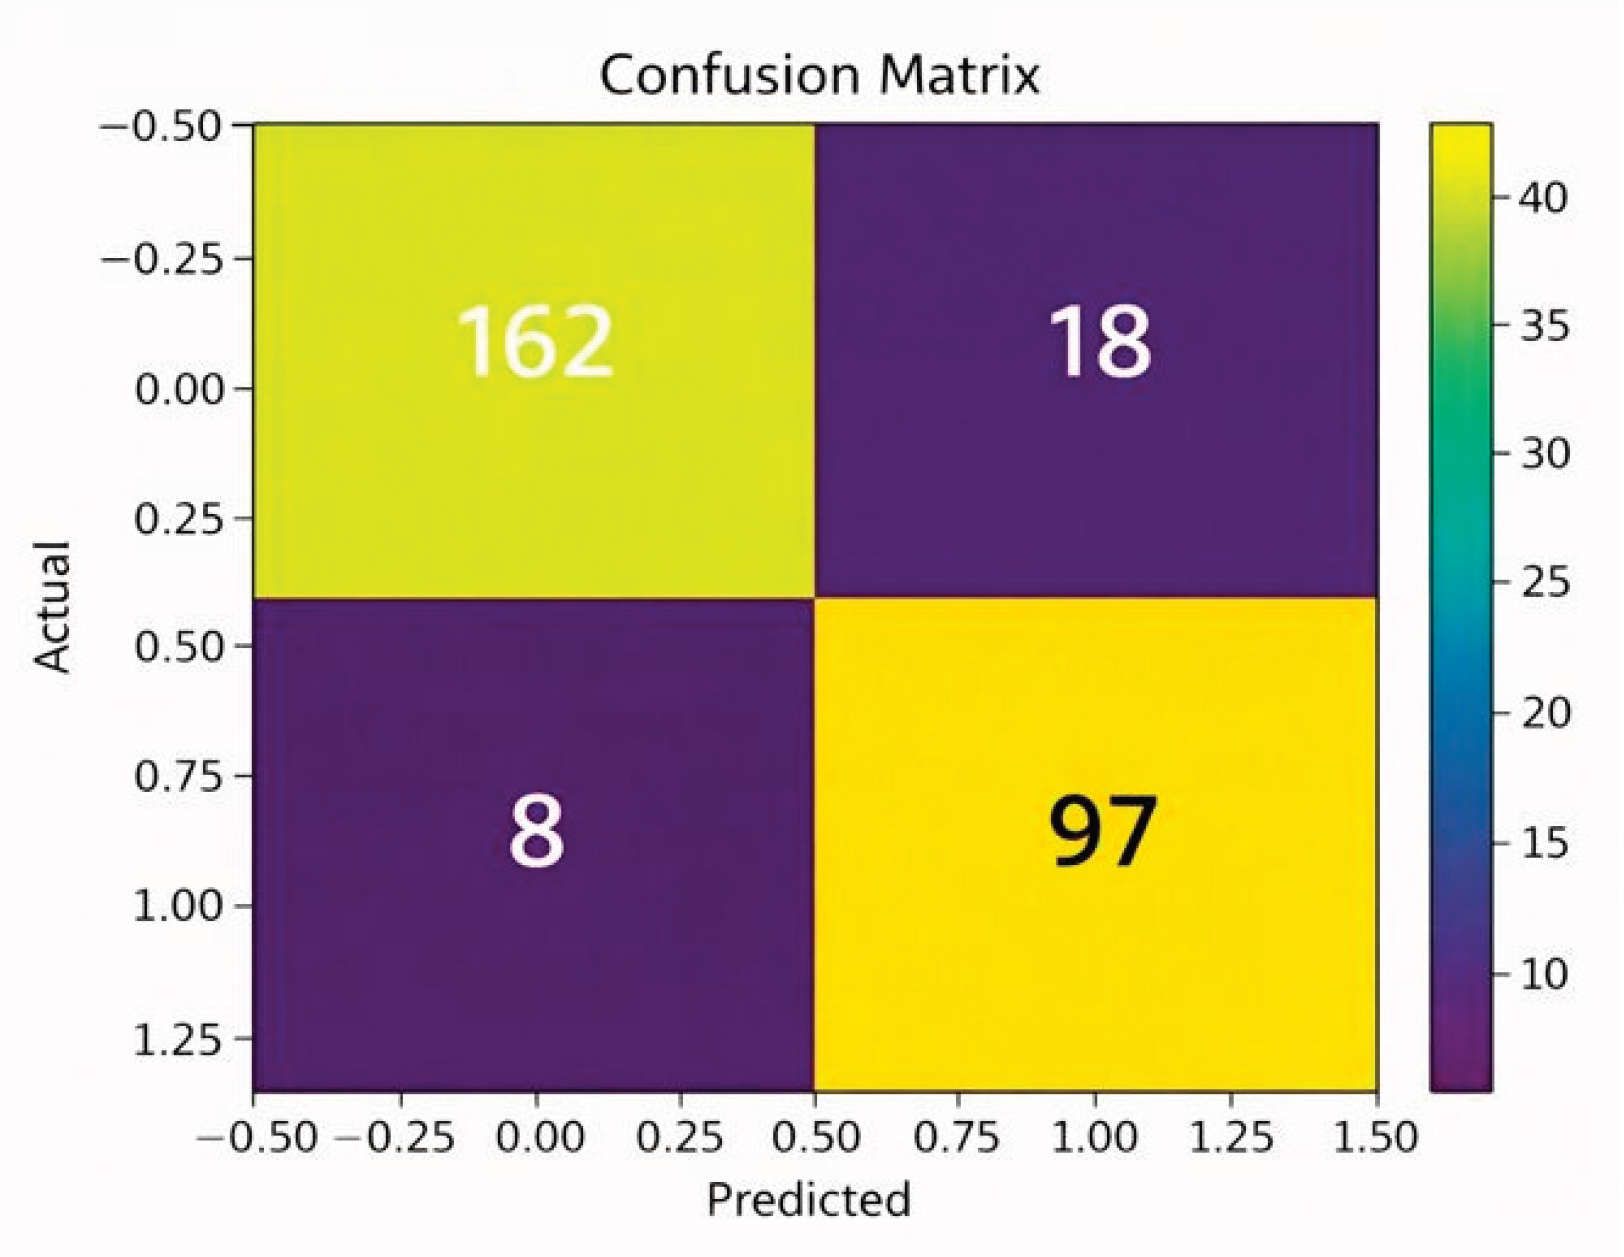
Figure 2.
Random forest roc Curve analysis.
6.2. XGBoost: Confusion Matrix and ROC Curve Analysis
The confusion matrix for the XGBoost model determines the performance of the XGBoost model on the basis of the predictions made for the placement of the students against the actual results. This results in the high values for the number of true positives and true negatives, signifying the correct classification of both the placed and not-placed students. Low values for the false positives and false negatives signify less misclassification, thus high accuracy and precision for the XGBoost model.
Figure 3.
Confusion Matrix for XGBoost model.
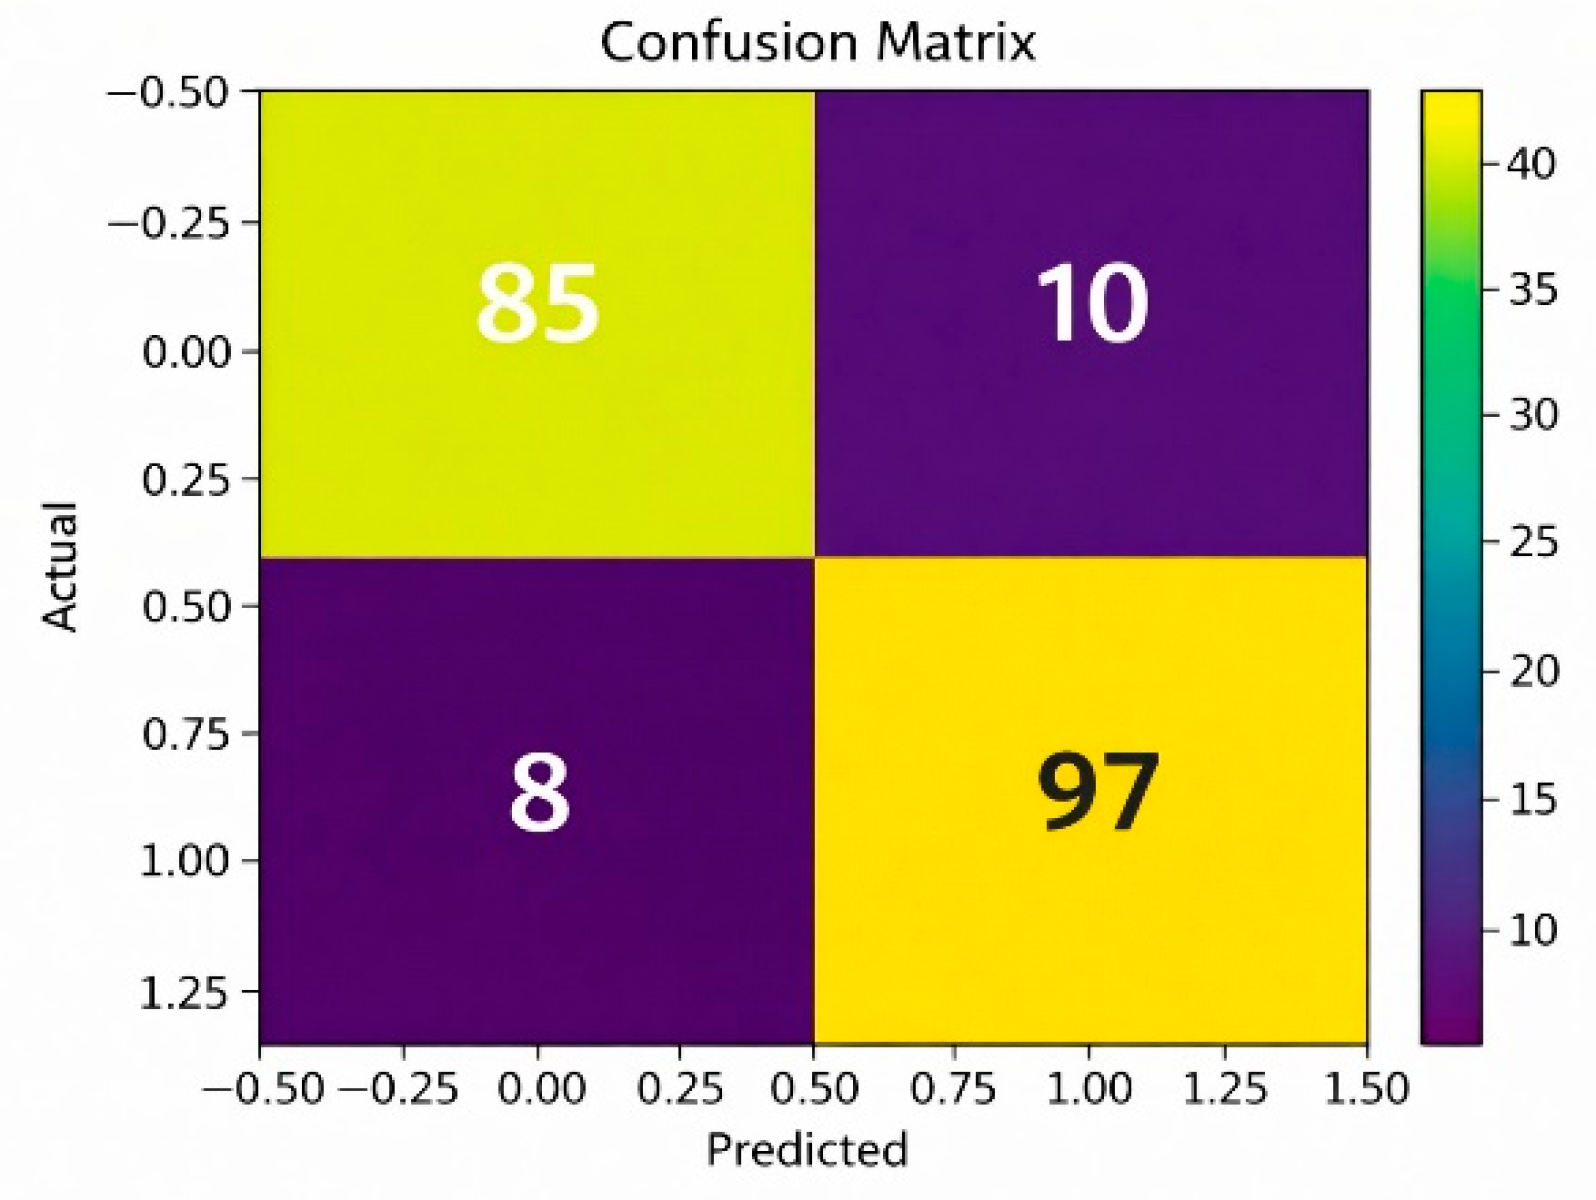
Figure 4.
ROC for XGBoost model.
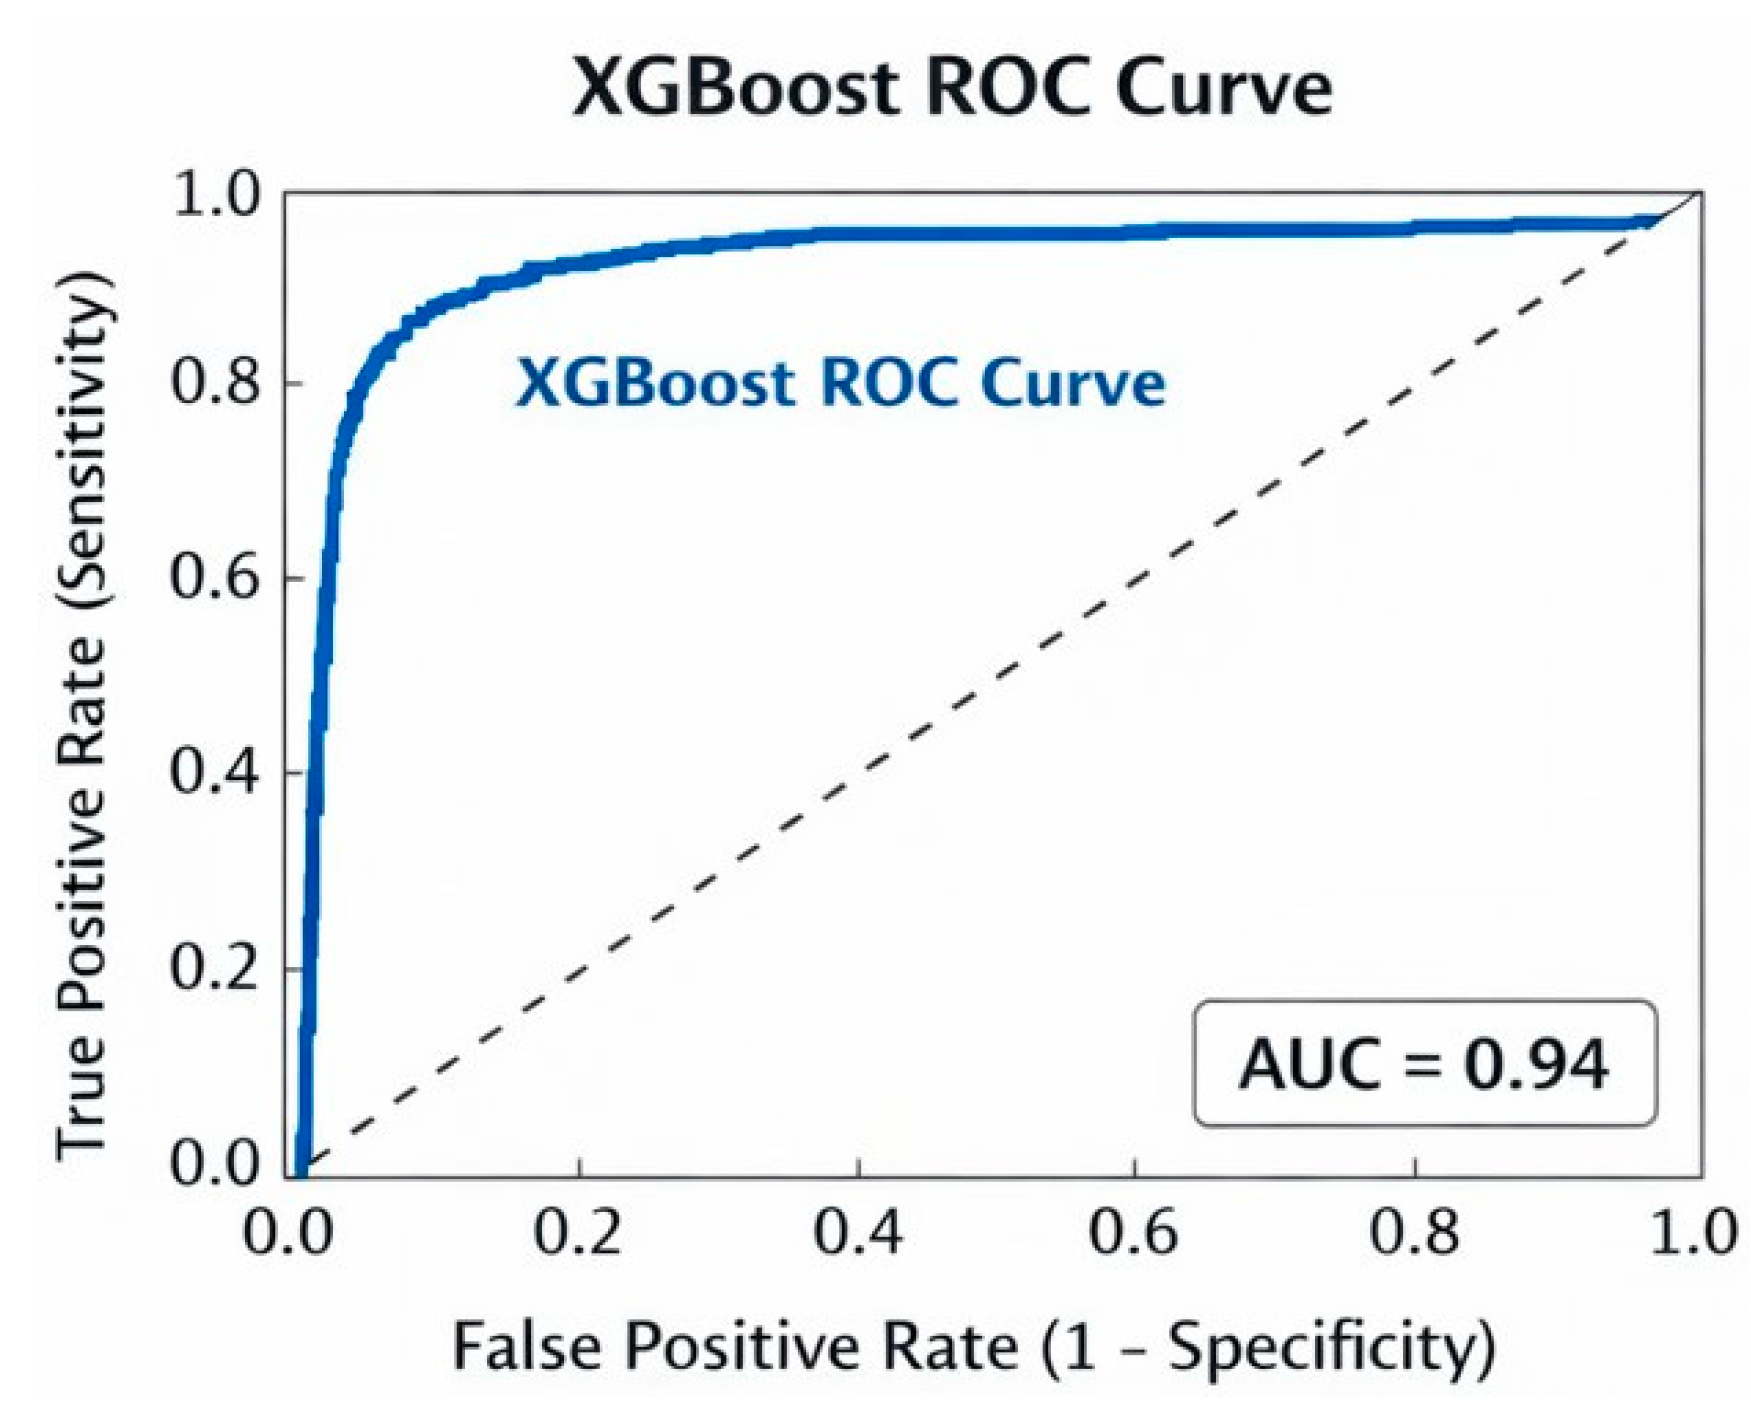
The Receiver Operating Characteristic (ROC) curve of the XGBoost model shows the classification strength of the model to separate the placed and not-placed students at various threshold levels. The graph displays the True Positive Rate vs the False Positive Rate. The XGBoost model has a high ROC curve compared to the diagonal random classifier curve. The high Area Under the Curve (AUC) value reveals the excellent performance of the model in the classification task, ensuring the effectiveness and efficiency of the model for the placement prediction task.
6.3. Na¨ıve Bayes: Confusion Matrix and ROC Curve Analysis
The confusion matrix of the Na¨ıve Bayes model provides an actual-to-predicted comparison for the placement results. It presents true positives and true negatives, which are correctly classified placed and not-placed students, respectively, and also false positives and false negatives, which depict misclassifications. Because the Na¨ıve Bayes classifier assumes independence of features, it can be expected to deliver a higher misclassification rate compared to the ensemble models, thus achieving considerably lower accuracy, precision, and recall.
Figure 5.
Confusion Matrix for XGBoost model.
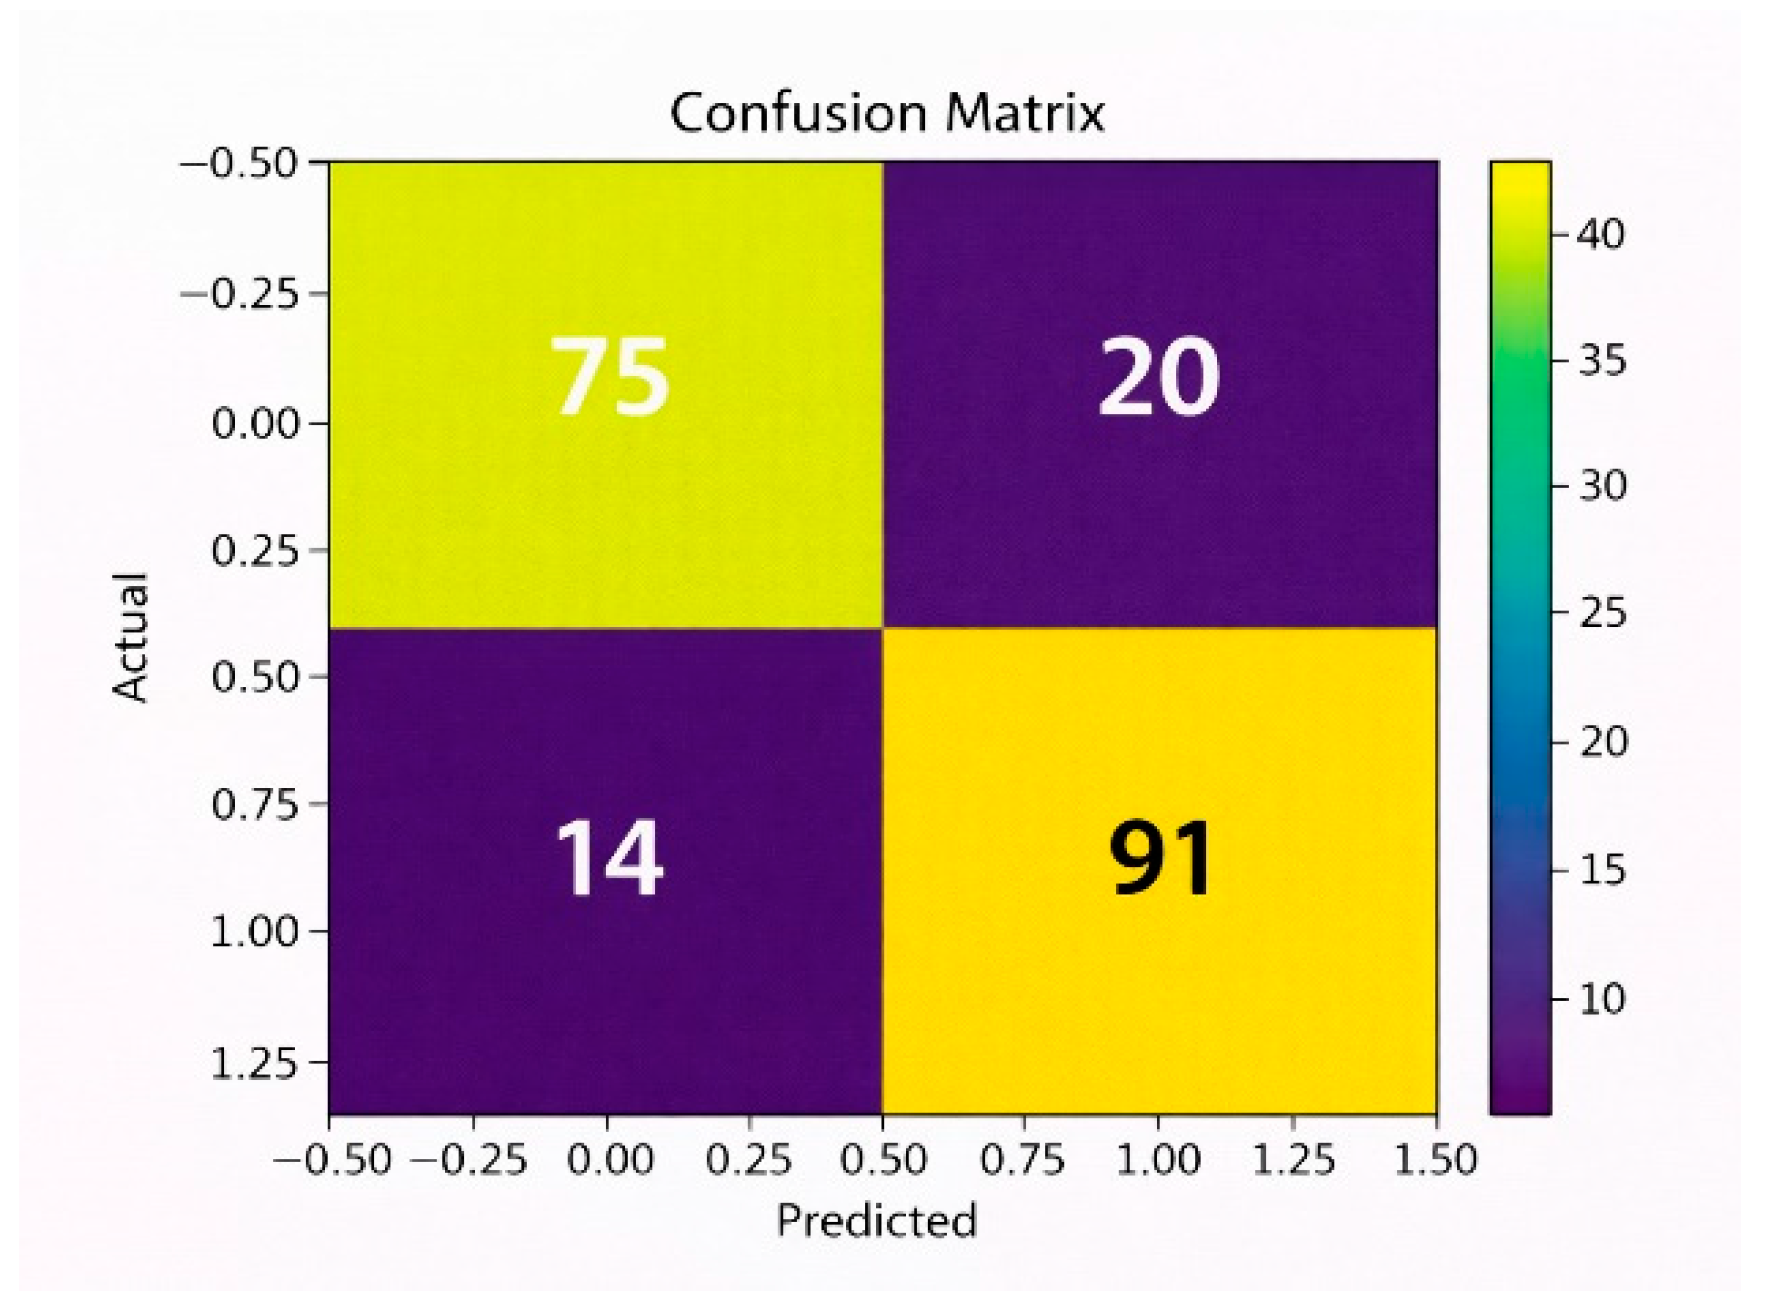
Figure 6.
ROC for XGBoost model.
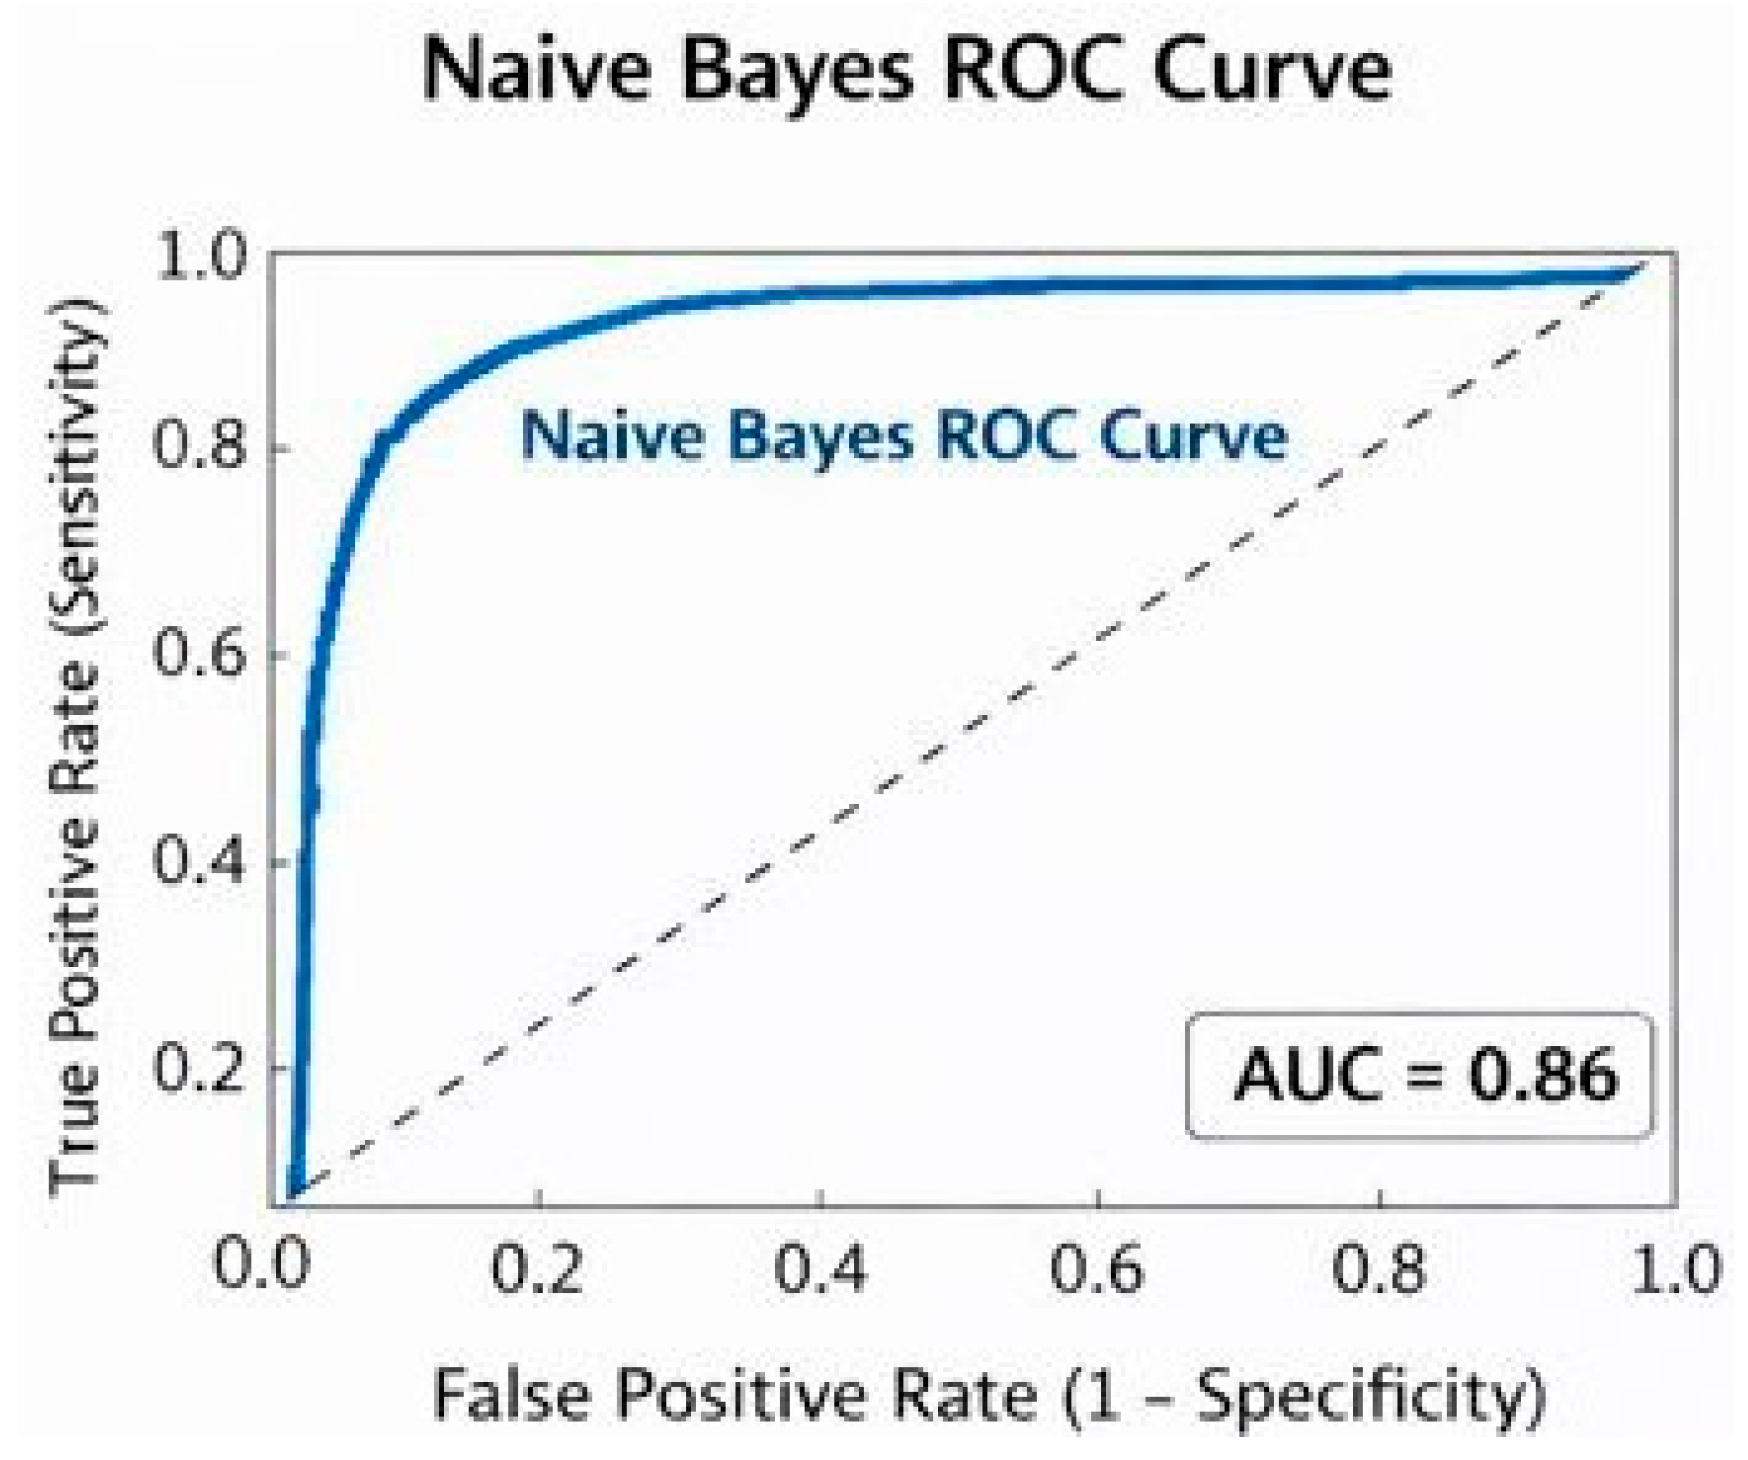
The ROC Curve for Na¨ıve Bayes Classifiers provides a graphical representation of how the True Positive Rate changes with respect to False Positive Rate for various threshold levels. Being a good classifier, the graph favors above the random line, yet with a Lower Area Under Curve than that of Random Forest or XGBoost classifiers, implying reasonable discriminatory ability for a classifier with respect to not-placed and placed students.
7. Results and Output
The Placement Prediction System was implemented and evaluated using the Random Forest Classifier connected to a web-based platform. The system was tested on a dataset containing student academic and skill records. Its performance was measured in terms of accuracy, usability, and practicality.
7.1. Results
- Model Performance: The Random Forest Classifier achieved higher accuracy compared to traditional models such as Logistic Regression and Na¨ıve Bayes. Evaluation metrics including precision, recall, and F1-score demonstrated that the system performed effectively for both “Placed” and “Not Placed” classes, even in the presence of class imbalance.
- Feature Importance: Analysis revealed that CGPA, technical skills, internships, project experience, and communication ability were the strongest predictors of placement success.
- System Usability: The web application provided a userfriendly interface allowing students to input their details and receive predictions instantly. A history module enabled users to monitor their employability readiness over time.
- Database Integration: The SQLite database effectively stored user details and prediction outcomes, ensuring persistence and easy retrieval of past results.
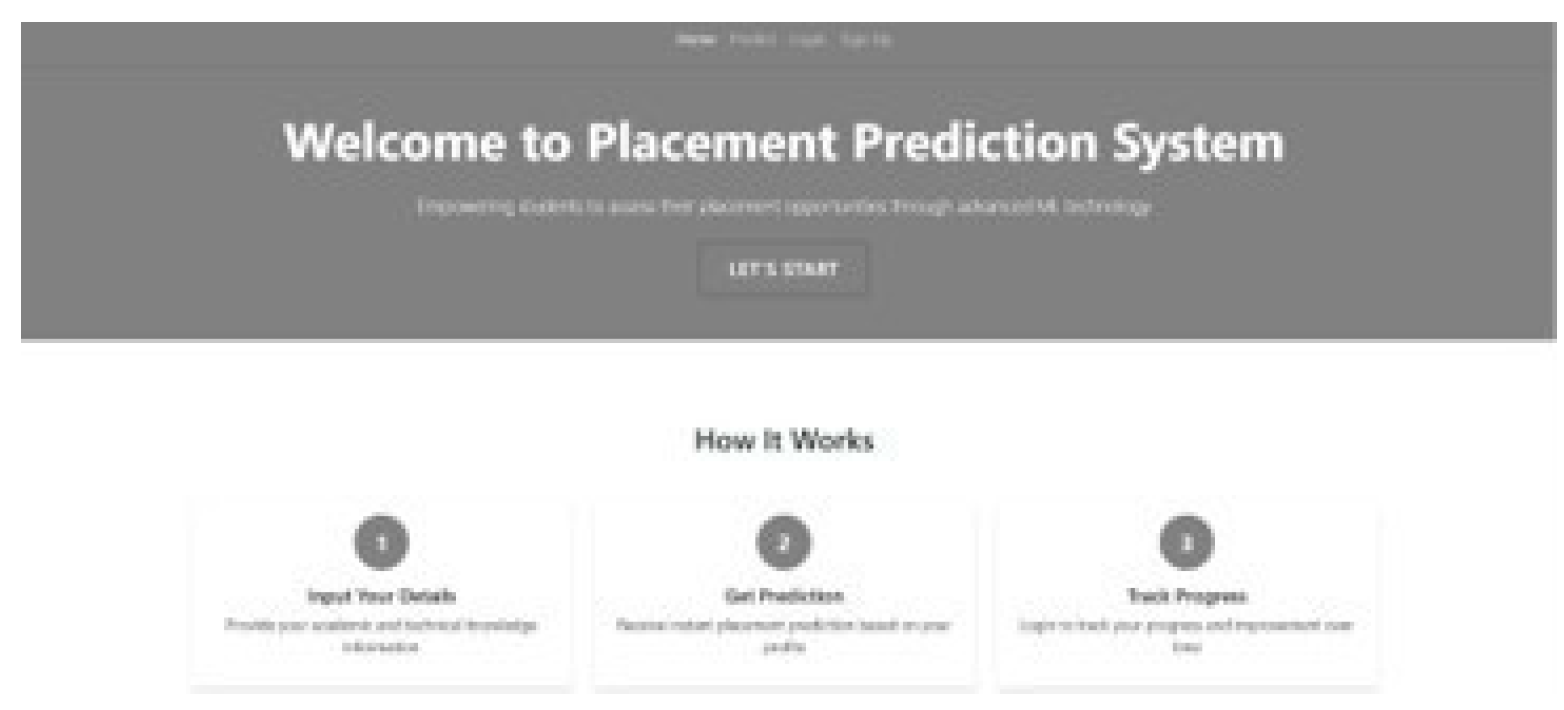
7.2. Front Page
Figure 7.
Front Page.
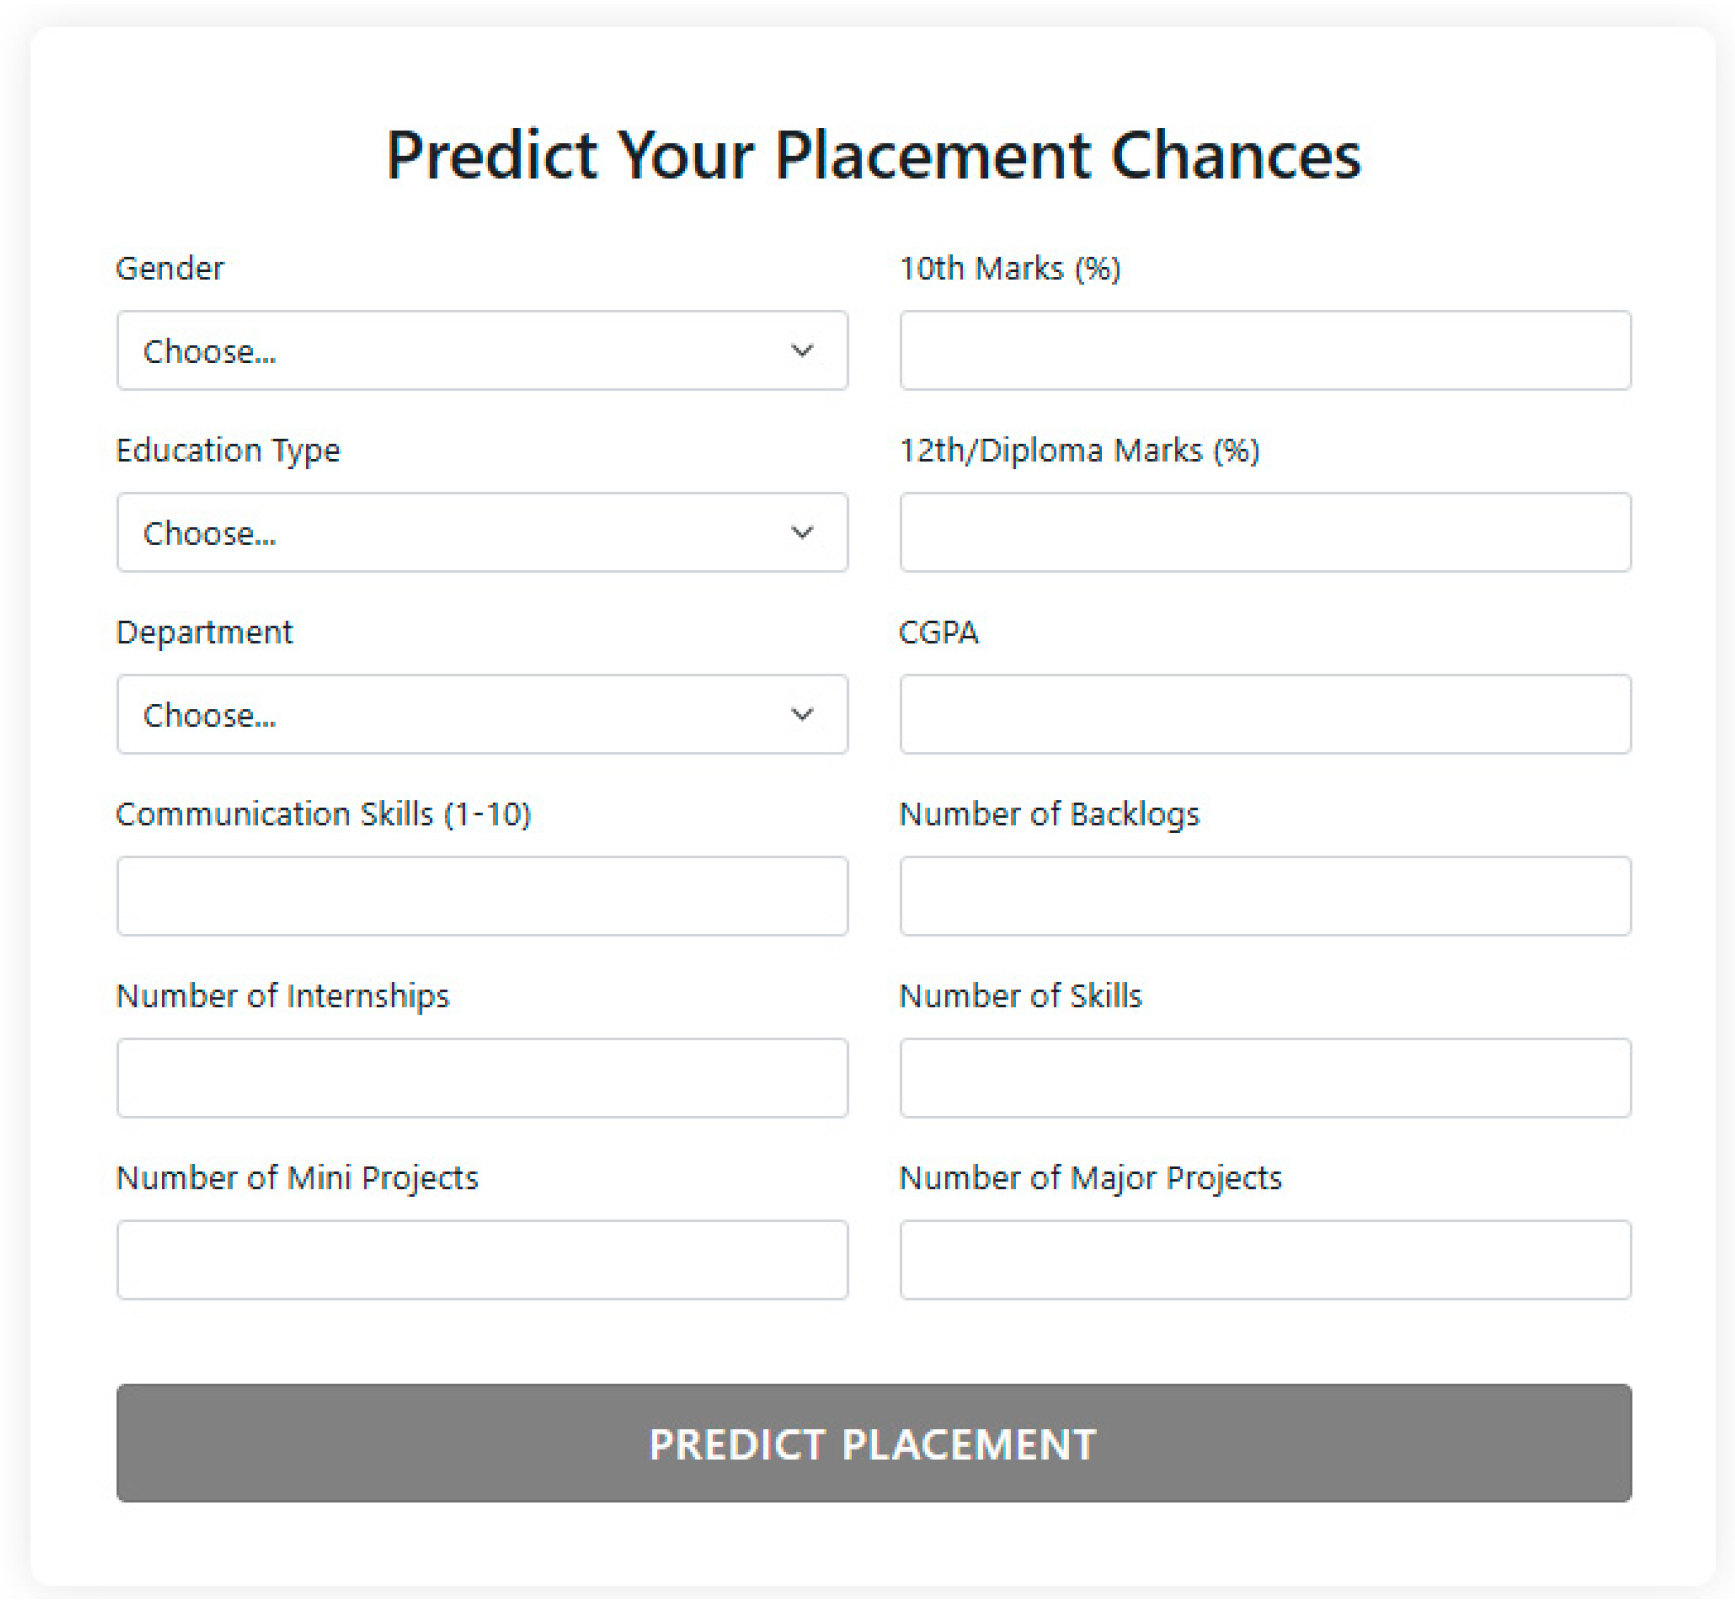
7.3. Input Section
Figure 8.
Input Section.
7.4. Output Section
Figure 9.
Output Section.
8. Future Scope
While the Placement Prediction System shows promising results in predicting student employability using machine learning, there are several opportunities for enhancement and expansion:
- Resume Analysis Integration: Incorporate automated resume parsing using Natural Language Processing (NLP). Extract skills, certifications, and experiences from resumes to provide better predictions, and offer personalized recommendations to improve resumes based on placement trends.
- Company-Specific Predictions: Extend the system to predict placement chances for specific companies such as TCS, Infosys, and Wipro. Consider company eligibility criteria like CGPA cutoffs, skill requirements, and role preferences to help students tailor their preparation for targeted recruiters.
- Multi-Model Support: Implement additional machine learning and deep learning models, including Support Vector Machines (SVM), Gradient Boosting, and Neural Networks. Compare model performances and enable the system to dynamically choose the best algorithm for predictions.
- Live Job Market Integration: Connect the system to online job portals and recruitment platforms. Update predictions based on current industry skill demands and job availability, and suggest trending courses or certifications that match market needs.
- Mobile Application Development: Develop crossplatform mobile applications using React Native or Flutter for easier student access. Provide push notifications for placement updates, predictions, and personalized career suggestions.
- Soft Skills and Interview Readiness Assessment: Integrate modules to evaluate communication, aptitude, and behavioral skills. Use AI-driven mock interviews and aptitude tests to assess students’ non-technical readiness.
- Scalability and Cloud Deployment: Deploy the system on cloud platforms such as AWS, Azure, or Google Cloud. Use scalable databases like MySQL or PostgreSQL to handle large datasets and multiple users, enabling placement cells across institutions to use the system collaboratively.
9. Acknowledgement
First and foremost, I would like to take this opportunity to thank all those who helped me successfully complete my project titled “Placement Prediction Using Various Machine Learning Models and their Efficiency Comparison.” I am grateful to my project guide for their guidance, continuous support, and valuable feedback throughout the duration of the project.
I would also like to thank the faculty members of my department for providing knowledgeable resources and support, which helped strengthen my understanding of the subject. Finally, I extend my sincere thanks to my friends and classmates for their cooperation, encouragement, and support during the project work.
10. Conclusions
The Placement Prediction System is a practical and innovative solution aimed at addressing the uncertainty students face regarding their chances of being placed during campus recruitment. By leveraging the Random Forest classifier, the system analyzes academic, technical, and behavioral attributes to provide accurate and personalized predictions of employability.
The integration of Flask, SQLite, and a web-based interface makes the system both accessible and user-friendly. Students can not only receive real-time placement predictions but also track their progress through stored prediction histories. This provides them with valuable insights into their strengths and weaknesses, helping them prepare effectively for campus drives. Furthermore, placement cells can use the system to identify at-risk students early and design targeted training programs to improve overall placement success rates.
While the system demonstrates strong potential, its performance is limited by dataset size, feature coverage, and static nature of predictions. Nevertheless, it provides a strong foundation for future enhancements, such as company-specific predictions, resume analysis, and integration with live job market data.
In conclusion, the Placement Prediction System serves as both a predictive tool and a guidance platform, contributing to improved career readiness for students and data-driven decision-making for institutions. With further development and scaling, it has the potential to become a vital component of modern placement processes in educational institutions.
References
- L. Breiman, “Random forests,” Machine Learning, vol. 45, no. 1, pp. 5–32, 2001. [CrossRef]
- T. Hastie, R. Tibshirani, and J. Friedman, The Elements of Statistical Learning, 2nd ed. New York, NY, USA: Springer, 2009.
- H. Witten, E. Frank, and M. A. Hall, Data Mining: Practical Machine Learning Tools and Techniques, 3rd ed. Morgan Kaufmann, 2011.
- V. Bhise, S. Thorat, and A. Supekar, “Importance of data mining in higher education system,” IOSR Journal of Humanities and Social Science, vol. 6, no. 6, pp. 18–21, 2013.
- M. Nandhini and C. P. Sumathi, “Placement prediction using machine learning algorithms,” International Research Journal of Engineering and Technology (IRJET), vol. 7, no. 4, pp. 1894–1898, 2020.
- S. B. Kotsiantis, C. Pierrakeas, and P. Pintelas, “Predicting students’ performance in distance learning using machine learning techniques,” Applied Artificial Intelligence, vol. 18, no. 5, pp. 411–426, 2007. [CrossRef]
- P. Joshi and R. Gupta, “Student placement prediction using machine learning techniques,” in Proc. International Conference on Computational Intelligence and Data Science (ICCIDS), 2021.
- M. R. Patil and S. S. Sherekar, “Performance analysis of Na¨ıve Bayes and J48 classification algorithm,” International Journal of Computer Science and Applications, vol. 6, no. 2, pp. 256–261, 2019.
- C. Cortes and V. Vapnik, “Support-vector networks,” Machine Learning, vol. 20, no. 3, pp. 273–297, 1995.
- J. Han, M. Kamber, and J. Pei, Data Mining: Concepts and Techniques, 3rd ed. Morgan Kaufmann, 2012.
- T. Fawcett, “An introduction to ROC analysis,” Pattern Recognition Letters, vol. 27, no. 8, pp. 861–874, 2006.
- N. V. Chawla et al., “SMOTE: Synthetic Minority Over-sampling Technique,” Journal of Artificial Intelligence Research, vol. 16, pp. 321– 357, 2002. [CrossRef]
Disclaimer/Publisher’s Note: The statements, opinions and data contained in all publications are solely those of the individual author(s) and contributor(s) and not of MDPI and/or the editor(s). MDPI and/or the editor(s) disclaim responsibility for any injury to people or property resulting from any ideas, methods, instructions or products referred to in the content. |
© 2026 by the authors. Licensee MDPI, Basel, Switzerland. This article is an open access article distributed under the terms and conditions of the Creative Commons Attribution (CC BY) license.
Copyright: This open access article is published under a Creative Commons CC BY 4.0 license, which permit the free download, distribution, and reuse, provided that the author and preprint are cited in any reuse.


