Submitted:
12 January 2026
Posted:
13 January 2026
You are already at the latest version
Abstract
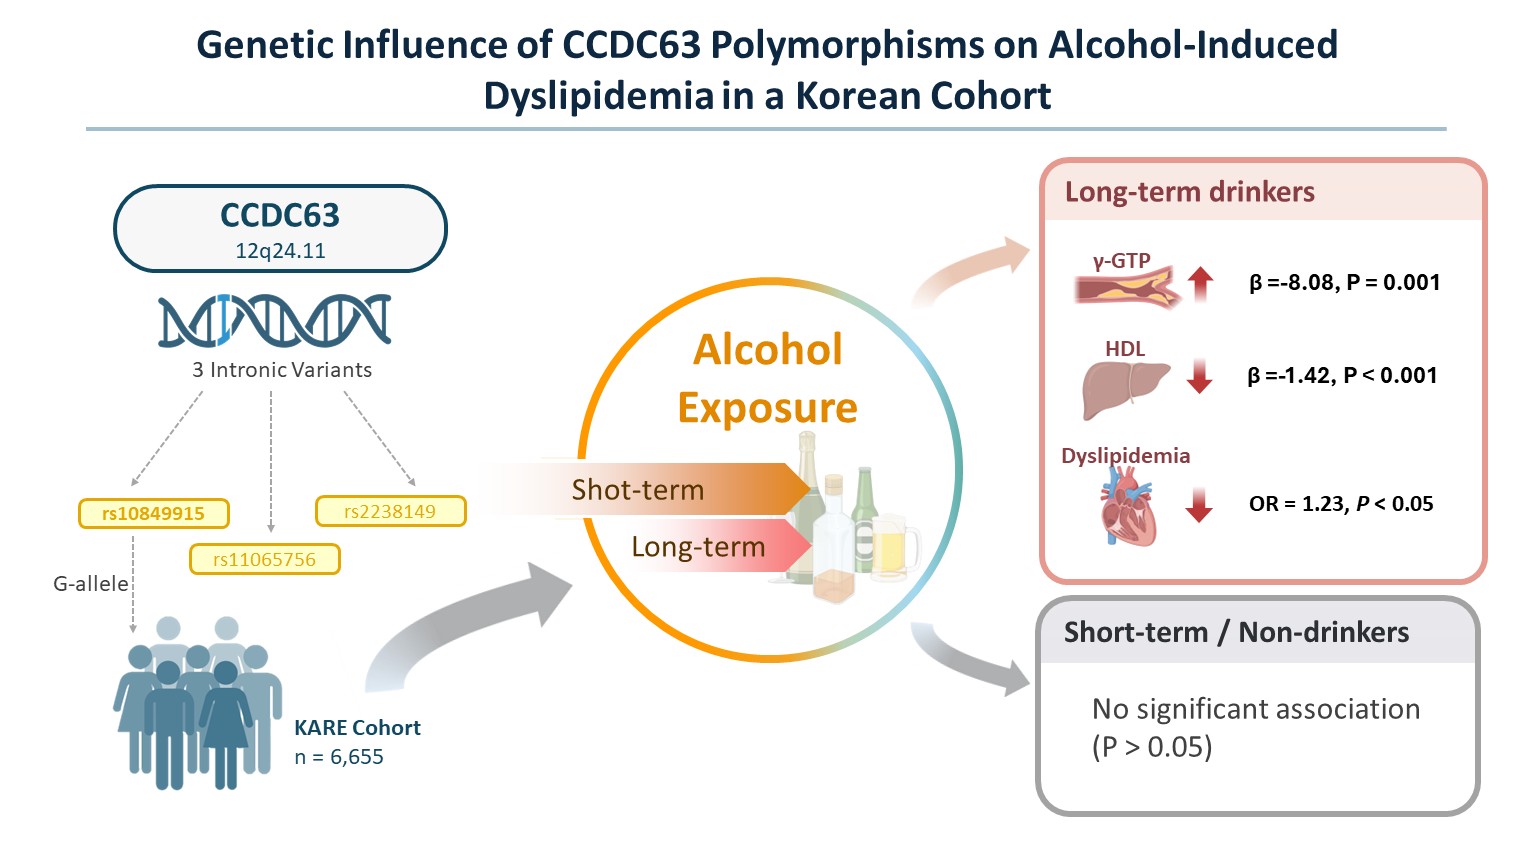
While chronic alcohol consumption is an established risk factor for lipid metabolic dysregulation, the underlying genetic mediators remain largely elusive. This study investigated the synergistic impact of CCDC63 (Coiled-Coil Domain Containing 63) polymorphisms and alcohol intake on dyslipidemia risk within a Korean cohort. Leveraging data from the KARE study (n=6,655; 4,327 dyslipidemia cases vs. 2,328 controls), we analyzed SNPs across the CCDC63 locus via Affymetrix SNP Array 5.0. Logistic regression, adjusted for age and sex, was performed to evaluate genotype-phenotype association, and gene-environment interactions by alcohol exposure duration. Three intronic variants (rs10849915, rs11065756, and rs2238149) were significantly associated with dyslipidemia (OR ≥1.15, P <0.005). Notably, stratified analysis revealed a clear gene–environment interaction. In current drinkers, the G-allele of rs10849915 was significantly associated with a higher risk of dyslipidemia (OR = 1.23, P <0.05) , significantly lower γ-GTP levels (β =-8.08), and reduced HDL (β =-1.42). However, no such genetic associations were observed in the non-drinking group (P > 0.05 for all traits). Our findings demonstrate that CCDC63 variants specifically modulate lipid metabolism and hepatic enzyme levels in an alcohol-dependent manner. The paradoxical association—lower γ-GTP yet higher dyslipidemia risk in drinkers—suggests that CCDC63 plays a critical role in the complex interplay between alcohol exposure and systemic lipid homeostasis.
Keywords:
alcohol interaction
; CCDC63
; dyslipidemia
; genetic stratification
; Pleiotropy
1. Introduction
Dyslipidemia, abnormal blood lipid levels, represents a major modifiable risk factor for cardiovascular disease, affecting approximately 40% of Korean adults [1,2]. Alcohol consumption considerably influences lipid metabolism through complex interactions with genetic background and other environmental factors [3,4]. Moderate alcohol intake may increase HDL cholesterol levels, while heavy or chronic consumption promotes hypertriglyceridemia and fatty liver disease [5,6]. Research in Asian populations exhibits distinct patterns of alcohol-related dyslipidemia, with genetic factors explaining much of the individual variation in metabolic responses [7,8]. Genome-wide association studies have found various genetic regions linked to alcohol consumption and lipid metabolism traits across diverse ethnic populations [9,10]. The CCDC63 gene has consistently shown links to alcohol consumption in African American, European, and East Asian groups. In particular, the rs10849915 variant is strongly associated with both weekly alcohol intake and the frequency of drinking [10,11,12,13,14,15,16]. However, it remains unknown whether the CCDC63 gene alters lipid metabolic responses under chronic alcohol exposure.
eQTL (expression quantitative trait locus) resources imply that CCDC63 variants modulate transcription in tissues that are key to lipid homeostasis, such as the liver and skeletal muscle [17,18]. However, direct mechanistic studies are still warranted. Compared to studies focused on people of European descent, research on East Asians, including Koreans provides additional insights thanks to distinct patterns in linkage disequilibrium and allele frequencies [19,20]. Furthermore, susceptibility mechanisms distinct from those elicited by steady, moderate consumption in Western populations may be triggered by episodic heavy drinking, which is common in Korea [21,22]. A comprehensive understanding of how CCDC63 polymorphisms influence the association of the alcohol–dyslipidemia relationship could inform precise prevention strategies in communities with high rates of alcohol [23]. Accordingly, we analyzed a large Korean cohort from the Korean Association REsource (KARE) to evaluate associations between CCDC63 variation and dyslipidemia, with a specific focus on gene–environment interactions by alcohol-exposure duration. We speculated that differences in the CCDC63 gene might impact both lipid metabolism and liver function associated with alcohol intake. We suggested that chronic alcohol exposure may influence the risk of dyslipidemia differently according to each person’s genotype. We also explored whether these genetic effects might be explained by intermediate phenotypes such as liver enzyme levels or markers of inflammation.
2. Materials and Methods
2.1. Study Population
Korean participants were drawn from a population-based cohort initiated by the Korea National Institute of Health in 2009 [24]. After applying prespecified exclusion criteria, the final analytic cohort comprised 6,655 adults aged 40–69 years. Cases were defined as individuals with a documented diagnosis of lipid metabolism disorders or current use of lipid-modifying therapy (n = 4,327). Controls were participants without a history of dyslipidemia and not receiving lipid-lowering medications (n = 2,328). Individuals with missing key variables, borderline lipid measurements (cutoffs predefined), or protocol noncompliance were excluded from all analyses. Lipid disorder classification followed standard diagnostic thresholds: total cholesterol concentrations ≥240 mg/dL, high-density lipoprotein ≤40 mg/dL, low-density lipoprotein ≥160 mg/dL, or triglyceride levels ≥200 mg/dL. Healthy comparators demonstrated optimal lipid profiles characterized by total cholesterol <200 mg/dL, high-density lipoprotein >40 mg/dL, low-density lipoprotein <130 mg/dL, and triglycerides <150 mg/dL. Ethical oversight was provided by the KCDC Institutional Review Board, with documented participant consent obtained according to institutional guidelines.
2.2. Genetic Profiling
Genomic DNA was extracted from leukocytes isolated from peripheral venous blood. Genetic variation was assayed with the Affymetrix Genome-Wide Human SNP Array 5.0 platform (Affymetrix, Santa Clara, CA, USA). The analysis targeted the CCDC63 locus on chromosome 12, defined as a 10-kb interval extending 5 kb upstream and downstream of the transcriptional boundaries. Candidate single-nucleotide polymorphisms within this interval were obtained from the Korean Association REsource (KARE) dataset. Genomic coordinates were mapped to the February 2009 human genome assembly (GRCh37/hg19) based on UCSC Genome Browser annotations.
2.3. Data Analysis Framework
Computational analyses utilized PLINK software version 1.9 (https://www.cog-genomics.org/plink2) integrated with SPSS statistical package version 27 (IBM Corporation, Armonk, NY, USA). Association testing between CCDC63 polymorphisms and lipid disorders employed logistic regression modeling under additive inheritance assumptions. Linear regression frameworks evaluated relationships linking significant variants with hepatic biomarkers (alanine aminotransferase, aspartate aminotransferase, γ-glutamyl transferase) and lipid profile (high-density lipoprotein, triglycerides). Potential biases were controlled by incorporating age, sex, BMI, and residential location as covariates in all regression analyses. Participants were divided into AA homozygotes and G-variant individuals to evaluate the interaction between rs10849915 and alcohol history. Additionally, the duration of alcohol intake was partitioned into five-year categories (spanning ≤5 to >21 years) to observe metabolic trends over time. We quantified subgroup-specific risks for dyslipidemia through odds ratios and 95% confidence intervals.
3. Results
3.1. Participant Characteristics and Lipid Profiles
Our analysis included 6,655 participants-47.7% male, with mean age 52 years and BMI 24.6 kg/m² (Table 1). Comparing dyslipidemia cases to healthy controls revealed both demographic and metabolic differences. Cases were more likely to be male (52.4% versus 39.0%, P < 0.001), slightly older (52.7 versus 51.1 years, P = 0.013), and had higher BMI (25.2 versus 23.3 kg/m², P = 0.003). Lipid measurements diverged more sharply. Cases averaged 196 mg/dL for total cholesterol versus 169 mg/dL in controls. Triglycerides showed an even larger gap-185 mg/dL in cases compared to 99 mg/dL in controls, nearly a twofold difference. LDL cholesterol was elevated in cases (120 versus 98 mg/dL), while HDL cholesterol showed the reverse pattern: cases had lower levels at 39 mg/dL versus 51 mg/dL in controls. All lipid parameters differed significantly between groups (P < 0.001), confirming that our case definition successfully separated individuals with dyslipidemia from those with healthy lipid profiles.
3.2. Genomic Landscape of CCDC63 and Dyslipidemia Risk
To determine if CCDC63 plays a role in lipid metabolism, we examined six intronic variants within the gene. Our analysis identified a clear association between dyslipidemia and three specific markers—rs11065756, rs10849915, and rs2238149—all of which met strict statistical criteria (P < 0.005; Table 2). What stood out was the striking consistency in their effect sizes; each variant carried a nearly identical risk, with odds ratios tightly clustered between 1.15 and 1.16. The three variants showed consistent effects. Each had nearly the same risk increase, with odds ratios between 1.15 and 1.16. These SNPs likely share linkage disequilibrium, and their coordinated association pattern supports a genuine role for CCDC63 in lipid metabolism.
3.3. Replication of rs10849915 Associations
The rs10849915 variant was previously identified in genome-wide studies of alcohol consumption. We confirmed this association in our Korean cohort [13]: the G allele showed a strong inverse relationship with alcohol intake (β = -0.31 ± 0.02, P = 1.31 × 10-60, Table 3). The consistency across populations—including European, African American, and now Korean samples—supports a genuine biological signal rather than population-specific artifacts.
3.4. Associations with Liver Enzymes and Lipid Markers
We examined whether the three CCDC63 variants associate with liver enzymes and lipid levels (Table 4). Linear regression revealed significant associations with multiple biomarkers.
The strongest effects appeared for γ-GTP. All three variants correlated with lower γ-GTP levels, with effect sizes ranging from -6.99 to -7.55 U/L (P values from 2.07 × 10⁻⁸ to 8.67 × 10⁻⁸). ALT and AST showed similar negative associations, though with smaller magnitudes. HDL cholesterol also decreased with the minor alleles.
For rs10849915, the associations included ALT (β = -1.18 ± 0.51, P = 0.022), AST (β = -1.20 ± 0.37, P = 0.001), γ-GTP (β = -6.99 ± 1.29, P = 5.68 × 10⁻⁸), and HDL cholesterol (β = -0.87 ± 0.29, P = 0.002). The particularly strong γ-GTP association is notable because this enzyme serves as a biomarker for alcohol consumption, linking back to CCDC63’s established role in drinking behavior. Combined with the HDL findings, these results suggest CCDC63 influences both alcohol processing and lipid metabolism.
3.5. Distinct Genetic Effects by Alcohol Consumption
To determine whether these genetic associations depend on alcohol exposure itself, we stratified participants by current drinking status (Table S1). In current drinkers, the G-allele of rs10849915 maintained its significant association with dyslipidemia risk (OR = 1.23, P = 0.0074), lower γ-GTP levels (β = -8.08, P = 0.0013), and reduced HDL-cholesterol (β = -1.42, P = 6.58 × 10⁻⁵). Among non-drinkers, these relationships disappeared entirely—no significant associations were detected for any trait (P > 0.05). This divergence confirms that the metabolic impact of CCDC63 variants is selectively triggered by alcohol exposure rather than being an intrinsic lipid defect.
3.6. Alcohol Duration Effects Vary by Genotype
We examined whether alcohol duration affects dyslipidemia risk differently depending on rs10849915 genotype (Figure 1, Table 5). AA homozygotes (n=2,554) showed a striking pattern. Dyslipidemia risk increased progressively with drinking duration, peaking at 16-20 years (OR = 2.03, 95% CI: 1.44-2.85, P < 0.001 versus ≤5 years). Risk remained elevated beyond 21 years (OR = 1.92, 95% CI: 1.47-2.49, P < 0.001). In contrast, individuals carrying at least one G allele (AG/GG, n=821) showed more modest increases—from OR 1.29 at 6-10 years (P = 0.04) to OR 1.55 at 16-20 years (P = 0.02). The effect magnitudes were roughly half those seen in AA individuals. A crossover pattern emerged from the interaction analysis. With short-term drinking (≤15 years), AG/GG genotypes associated with higher risk. However, prolonged exposure (>15 years) shifted the burden toward AA individuals, who became substantially more vulnerable. BMI showed consistent effects across both genotypes (AA: OR 1.33, AG/GG: OR 1.29, both P < 0.001). Age was significant only among AG/GG genotypes (OR 1.13, P < 0.001).
3.7. Sex-Specific Genetic Effects
Sex-stratified analysis revealed substantial differences in rs10849915 associations between males and females (Table 6). For dyslipidemia, the genetic effect appeared exclusively in males. Men carrying the minor allele faced increased risk (OR=1.24, P=0.003), while women showed no significant association (OR=1.07, P=0.273). Both sexes exhibited significant relationships with alcohol consumption, though males demonstrated stronger effects (β=-0.40, P=2.71×10⁻⁷⁴ versus β=-0.23, P=1.66×10⁻²²). Hepatic enzyme associations followed the same pattern. Males showed significant negative correlations across all three markers: ALT (β=-1.45, P=0.012), AST (β=-1.98, P=0.002), and γ-GTP (β=-13.02, P=2.16×10⁻⁷). The γ-GTP effect proved particularly robust. Females demonstrated weaker associations—ALT (β=-0.97, P=0.031) and γ-GTP (β=-1.60, P=0.015) reached marginal significance, while AST did not (β=-0.51, P=0.181). Lipid parameters diverged sharply between sexes. HDL cholesterol decreased substantially in males (β=-1.86, P<0.001) but showed no effect in females (β=0.06, P=0.902). Triglycerides exhibited a similar male-specific pattern (male: β=-9.83, P=0.006; female: β=2.19, P=0.391). Across all metabolic traits examined, rs10849915 associations appeared consistently stronger in males.
3.8. CCDC63 Tissue Expression Profile
CCDC63 showed highest expression in testicular tissue, followed by skeletal muscle according to GTEx v10 (Figure 2). Among other tissues, moderate expression appeared in adipose tissue and liver. The rs10849915 variant functions as an expression quantitative trait locus (eQTL) for CCDC63 exclusively in skeletal muscle tissue (P = 6.26 X 10⁻⁷, n=816). The effect allele showed a positive normalized effect size (NES = 0.13), indicating increased CCDC63 expression in a dosage-dependent manner. No significant eQTL effects were detected in testis, adipose, or liver tissues despite measurable CCDC63 expression in these organs. This muscle-specific regulatory pattern suggests rs10849915 resides within or near a tissue-selective enhancer element. GTEx Portal reports this variant using GRCh38 coordinates (chr12:110,895,818) with T/C allele designations, where the C allele increases CCDC63 expression (NES = +0.13). In our GRCh37-based Korean dataset (chr12:111,333,622), we use A/G notation where the G allele corresponds to the GTEx C allele.
4. Discussion
We confirmed the CCDC63-alcohol connection that previous genome-wide studies identified. In our Korean cohort, the G allele at rs10849915 had a strong negative link to alcohol consumption (β = -0.31 ± 0.02, P = 1.31 x 10⁻⁶⁰). This matches findings from other populations [10,25]. The same three variants—rs10849915, rs11065756, and rs2238149—affected multiple traits. They associated with dyslipidemia as well as alcohol-related markers: liver enzymes (ALT, AST, γ-GTP) and HDL-cholesterol. This pattern suggests CCDC63 connects how the liver processes alcohol with lipid metabolism. All three variants linked to lower HDL cholesterol. The effect was strongest for rs11065756 (β = -0.91 ± 0.29, P = 1.48 x 10⁻³). The clinical impact is clear. Each copy of the risk allele lowers HDL by 0.91 mg/dL. This effect, though modest, may contribute to cardiovascular risk given the established inverse relationship between HDL levels and cardiovascular disease [26]. Genetic background determined who developed dyslipidemia with prolonged drinking. AA homozygotes faced escalating risk about 23% increase per decade of consumption. In contrast, people carrying at least one G allele (AG/GG genotypes) stayed relatively protected regardless of drinking duration. This gene-by-alcohol interaction opens doors for personalized risk assessment based on rs10849915 genotype [27]. To understand how rs10849915 might exert these effects, we examined the GTEx expression database and found that CCDC63 is directly regulated, especially in skeletal muscle. We also observed notable activity in the liver and fat tissue. Gene regulation that occurs in specific tissues serves as a bridge connecting genetic differences to how metabolism functions [17,28].
The GTEx database shows rs10849915 affects CCDC63 expression in muscle (NES = 0.13, P = 6.26 × 10⁻⁷). This variant appears as C/T in GTEx (GRCh38) and A/G in our Korean dataset (GRCh37). The C allele in GTEx matches our G allele—both increase muscle CCDC63 expression. Higher expression makes sense given the G allele’s link to dyslipidemia (OR = 1.15). More CCDC63 in muscle could interfere with lipid handling.
Our finding that CCDC63 variants associate with lower liver enzymes yet higher dyslipidemia risk in drinkers represents a notable metabolic paradox. This pattern closely resembles the well-known effects of the ALDH2 rs671 polymorphism in East Asians, where individuals with reduced alcohol-processing capacity often exhibit lower hepatic stress markers (γ-GTP) but miss the beneficial HDL-raising effect typically induced by ethanol consumption [29,30]. In our cohort, the lack of association in non-drinkers strongly supports the hypothesis that the G-allele’s impact on lipid profiles is a downstream consequence of altered alcohol-mediated metabolism. While the G-allele appears ’protective’ for the liver (lower γ-GTP), the resulting decrease in HDL-cholesterol levels leads to a higher clinical probability of dyslipidemia (OR = 1.23). This underscores that ’genetically healthier’ liver enzyme levels do not always translate to a lower cardiovascular risk profile in the context of alcohol consumption (Table 4). This underscores that ’genetically healthier’ liver enzyme levels do not always translate to a lower cardiovascular risk profile in the context of alcohol consumption. The skeletal muscle-specific eQTL pattern provides mechanistic insight into the male-predominant associations observed for rs10849915 (Table 6). Men typically maintain 30-40% greater muscle mass than women, with regional differences being more pronounced in the upper body (40% difference) compared to the lower body (33% difference) [31]. This sex difference in muscle mass distribution potentially amplifies any muscle-based metabolic effects of CCDC63 variants. The absence of significant eQTL activity in adipose or liver—tissues where sex differences in mass and function are less pronounced—further supports skeletal muscle as the primary tissue mediating this variant’s metabolic effects. Testosterone-regulated transcription in muscle tissue may enhance the variant’s impact on systemic metabolism in males. GTEx reports this variant using T/C allele designations on GRCh38, while our Korean dataset uses A/G notation on GRCh37. The GTEx C allele (effect allele, NES = +0.13) corresponds to our G allele (risk allele, OR = 1.15). The tissue-specific expression of CCDC63 helps clarify how one genetic variant can influence metabolism throughout the entire body. The strong effects observed in males are reasonable, considering how actively this gene functions in the testes. The transcription process, influenced by testosterone, likely enhances the metabolic impact of this variant. [32]. The difference between men and women in this area likely stems from evolutionary pressures. These pressures are thought to arise from the distinct metabolic demands and the way each sex processes alcohol [33]. There are some significant limitations to our study. Because it is cross-sectional, we are unable to figure out which comes first whether genetic variants lead to dyslipidemia or if the relationship works the other way around.
Our study has several limitations. We analyzed only common genetic variants, so rare mutations with strong effects on lipid regulation would not appear in our dataset. Additionally, the alcohol consumption data was self-reported by participants. We tried to validate this using liver enzyme measurements, but you know how it goes with self-reported drinking habits. They are never completely accurate [34]. Nevertheless, multiple lines of evidence support the clinical relevance of our findings. Similar genetic associations have been reported in independent cohorts. The biochemical markers we measured correspond to the metabolic phenotypes we observed. The proposed biological mechanisms are consistent with current understanding of lipid metabolism. Genotyping CCDC63 variants could identify individuals at elevated risk for alcohol-related dyslipidemia. This information could inform clinical practice through more frequent lipid monitoring in genetically susceptible individuals, personalized alcohol consumption guidance based on genotype, and targeted lifestyle interventions for those at highest risk. HECTD4 (chromosome 12q24.13) lies approximately 1.25 Mb from CCDC63 (12q24.11). In the same KARE cohort, HECTD4 associates with both alcohol consumption and lipid metabolism [35]. STRING network analysis [36] suggests these neighboring genes may jointly regulate lipid metabolism in response to alcohol. This network relationship indicates HECTD4 warrants investigation through experimental studies and mediation analysis in our dataset. Prospective validation remains necessary before clinical application. Moving forward, research should address two priorities: characterizing the molecular mechanisms of CCDC63 function and confirming these associations across diverse populations.
5. Conclusion
Our findings provide an evidence that CCDC63 is a critical genetic factor modulating metabolic homeostasis in a manner strictly contingent upon alcohol consumption. We observed that the genetic influence on dyslipidemia and its associated biomarkers is restricted to the drinking population, indicating a profound gene–environment interaction. This study clarifies the paradoxical metabolic signature of CCDC63—reduced γ-GTP levels coupled with an increased risk of dyslipidemia—which reveals the multifaceted impact of alcohol on systemic lipid homeostasis. These insights not only identify CCDC63 as a potential biomarker for cardiovascular assessment in alcohol-consuming groups but also advocate for a lifestyle-integrated approach in human genomic studies.
Supplementary Materials
The following supporting information can be downloaded at the website of this paper posted on Preprints.org.
Author Contributions
Conceptualization, S.P. and H.-S.J.; Methodology, S.P.; Software, Y.-N.K.; Validation, Y.-N.K., S.W.L., and H.-S.J.; Formal Analysis, Y.-N.K. and S.W.L.; Investigation, Y.-N.K.; Resources, H.-S.J.; Data Curation, S.W.L.; Writing—Original Draft Preparation, Y.-N.K., and S.P.; Writing-Review & Editing, S.W.L, and S.P.; Visualization, Y.-N.K.; Supervision, S.P.; Project Administration, S.P.; Funding Acquisition, S.P. All authors have read and agreed to the published version of the manuscript.
Funding
This research was supported by the Regional Innovation System & Education (RISE) program through the Gangwon RISE Center, funded by the Ministry of Education (MOE) and the Gangwon State (G.S.), Republic of Korea (Grant number: 2026-RISE-10-005).
Institutional Review Board Statement
The study was conducted in accordance with the Declaration of Helsinki, and conducted, with bioresources from National Biobank of Korea, The Korea Disease Control and Prevention Agency, Republic of Korea (KBN-2022-089).
Informed Consent Statement
Informed consent was obtained from all subjects involved in the study.
Data Availability Statement
The data presented in this study are available on request from the corresponding author. The data are not publicly available due to ethical restrictions imposed by the Korea Centers for Disease Control and Prevention regarding the use of KARE cohort data.
Acknowledgments
The authors thank Hye-Yeon Song, Yoon-Joo Song for their setup assistance of plink program.
Conflicts of Interest
The authors declare no conflicts of interest.
References
- Lee, H.; Kim, S.; Son, Y.; Kim, S.; Kim, H.J.; Jo, H.; Park, J.; Lee, K.; Lee, H.; Kang, J.; et al. National trends in dyslipidemia prevalence, awareness, treatment, and control in South Korea from 2005 to 2022. Sci Rep 2025, 15, 16148. [Google Scholar] [CrossRef]
- Atherosclerosis, K. S. o. L. a. Dyslipidemia Fact Sheet in South Korea 2023. 2022. [Google Scholar]
- Klop, B.; Elte, J.W.; Cabezas, M.C. Dyslipidemia in obesity: mechanisms and potential targets. Nutrients 2013, 5, 1218–1240. [Google Scholar] [CrossRef]
- Baraona, E.; Lieber, C.S. Effects of ethanol on lipid metabolism. J Lipid Res 1979, 20, 289–315. [Google Scholar] [CrossRef]
- Brien, S.E.; Ronksley, P.E.; Turner, B.J.; Mukamal, K.J.; Ghali, W.A. Effect of alcohol consumption on biological markers associated with risk of coronary heart disease: systematic review and meta-analysis of interventional studies. BMJ 2011, 342, d636. [Google Scholar] [CrossRef] [PubMed]
- Steiner, J.L.; Lang, C.H. Alcohol, Adipose Tissue and Lipid Dysregulation. Biomolecules 2017, 7. [Google Scholar] [CrossRef] [PubMed]
- Wakabayashi, I. Association between alcohol drinking and metabolic syndrome in Japanese male workers with diabetes mellitus. J Atheroscler Thromb 2011, 18, 684–692. [Google Scholar] [CrossRef]
- Park, H.S.; Oh, S.W.; Cho, S.I.; Choi, W.H.; Kim, Y.S. The metabolic syndrome and associated lifestyle factors among South Korean adults. Int J Epidemiol 2004, 33, 328–336. [Google Scholar] [CrossRef]
- Willer, C.J.; Schmidt, E.M.; Sengupta, S.; Peloso, G.M.; Gustafsson, S.; Kanoni, S.; Ganna, A.; Chen, J.; Buchkovich, M.L.; Mora, S.; et al. Discovery and refinement of loci associated with lipid levels. Nat Genet 2013, 45, 1274–1283. [Google Scholar] [PubMed]
- Liu, M.; Jiang, Y.; Wedow, R.; Li, Y.; Brazel, D.M.; Chen, F.; Datta, G.; Davila-Velderrain, J.; McGuire, D.; Tian, C.; et al. Association studies of up to 1.2 million individuals yield new insights into the genetic etiology of tobacco and alcohol use. Nat Genet 2019, 51, 237–244. [Google Scholar] [CrossRef]
- Clarke, T.K.; Adams, M.J.; Davies, G.; Howard, D.M.; Hall, L.S.; Padmanabhan, S.; Murray, A.D.; Smith, B.H.; Campbell, A.; Hayward, C.; et al. Genome-wide association study of alcohol consumption and genetic overlap with other health-related traits in UK Biobank (N=112 117). Mol Psychiatry 2017, 22, 1376–1384. [Google Scholar] [CrossRef] [PubMed]
- Jorgenson, E.; Thai, K.K.; Hoffmann, T.J.; Sakoda, L.C.; Kvale, M.N.; Banda, Y.; Schaefer, C.; Risch, N.; Mertens, J.; Weisner, C.; et al. Genetic contributors to variation in alcohol consumption vary by race/ethnicity in a large multi-ethnic genome-wide association study. Mol Psychiatry 2017, 22, 1359–1367. [Google Scholar] [CrossRef] [PubMed]
- Baik, I.; Cho, N.H.; Kim, S.H.; Han, B.G.; Shin, C. Genome-wide association studies identify genetic loci related to alcohol consumption in Korean men. Am J Clin Nutr 2011, 93, 809–816. [Google Scholar] [CrossRef]
- Park, B.L.; Kim, J.W.; Cheong, H.S.; Kim, L.H.; Lee, B.C.; Seo, C.H.; Kang, T.C.; Nam, Y.W.; Kim, G.B.; Shin, H.D.; et al. Extended genetic effects of ADH cluster genes on the risk of alcohol dependence: from GWAS to replication. Hum Genet 2013, 132, 657–668. [Google Scholar] [CrossRef]
- Schumann, G.; Coin, L.J.; Lourdusamy, A.; Charoen, P.; Berger, K.H.; Stacey, D.; Desrivieres, S.; Aliev, F.A.; Khan, A.A.; Amin, N.; et al. Genome-wide association and genetic functional studies identify autism susceptibility candidate 2 gene (AUTS2) in the regulation of alcohol consumption. Proc Natl Acad Sci USA 2011, 108, 7119–7124. [Google Scholar] [CrossRef]
- Kapoor, M.; Wang, J.C.; Wetherill, L.; Le, N.; Bertelsen, S.; Hinrichs, A.L.; Budde, J.; Agrawal, A.; Bucholz, K.; Dick, D.; et al. A meta-analysis of two genome-wide association studies to identify novel loci for maximum number of alcoholic drinks. Hum Genet 2013, 132, 1141–1151. [Google Scholar] [CrossRef]
- Consortium, G.T. The GTEx Consortium atlas of genetic regulatory effects across human tissues. Science 2020, 369, 1318–1330. [Google Scholar] [CrossRef]
- Nica, A.C.; Montgomery, S.B.; Dimas, A.S.; Stranger, B.E.; Beazley, C.; Barroso, I.; Dermitzakis, E.T. Candidate causal regulatory effects by integration of expression QTLs with complex trait genetic associations. PLoS Genet 2010, 6, e1000895. [Google Scholar] [CrossRef]
- Zhou, H.; Kalayasiri, R.; Sun, Y.; Nunez, Y.Z.; Deng, H.W.; Chen, X.D.; Justice, A.C.; Kranzler, H.R.; Chang, S.; Lu, L.; et al. Genome-wide meta-analysis of alcohol use disorder in East Asians. Neuropsychopharmacology 2022, 47, 1791–1797. [Google Scholar] [CrossRef] [PubMed]
- Lu, X.; Huang, J.; Mo, Z.; He, J.; Wang, L.; Yang, X.; Tan, A.; Chen, S.; Chen, J.; Gu, C.C.; et al. Genetic Susceptibility to Lipid Levels and Lipid Change Over Time and Risk of Incident Hyperlipidemia in Chinese Populations. Circ Cardiovasc Genet 2016, 9, 37–44. [Google Scholar] [CrossRef]
- Elisaus, P.; Williams, G.; Bourke, M.; Clough, G.; Harrison, A.; Verma, A. Factors associated with the prevalence of adolescent binge drinking in the urban areas of Greater Manchester. Eur J Public Health 2018, 28, 49–54. [Google Scholar] [CrossRef]
- Trostler, M.; Li, Y.; Plankey, M.W. Prevalence of binge drinking and associated co-factors among medical students in a U.S. Jesuit University. Am J Drug Alcohol Abuse 2014, 40, 336–341. [Google Scholar] [CrossRef] [PubMed]
- Relling, M.V.; Evans, W.E. Pharmacogenomics in the clinic. Nature 2015, 526, 343–350. [Google Scholar] [CrossRef] [PubMed]
- Cho, Y.S.; Go, M.J.; Kim, Y.J.; Heo, J.Y.; Oh, J.H.; Ban, H.J.; Yoon, D.; Lee, M.H.; Kim, D.J.; Park, M.; et al. A large-scale genome-wide association study of Asian populations uncovers genetic factors influencing eight quantitative traits. Nat Genet 2009, 41, 527–534. [Google Scholar] [CrossRef]
- Kranzler, H.R.; Zhou, H.; Kember, R.L.; Vickers Smith, R.; Justice, A.C.; Damrauer, S.; Tsao, P.S.; Klarin, D.; Baras, A.; Reid, J.; et al. Genome-wide association study of alcohol consumption and use disorder in 274,424 individuals from multiple populations. Nat Commun 2019, 10, 1499. [Google Scholar] [CrossRef]
- Gordon, D.J.; Probstfield, J.L.; Garrison, R.J.; Neaton, J.D.; Castelli, W.P.; Knoke, J.D.; Jacobs, D.R., Jr.; Bangdiwala, S.; Tyroler, H.A. High-density lipoprotein cholesterol and cardiovascular disease. Four prospective American studies. Circulation 1989, 79, 8–15. [Google Scholar] [CrossRef]
- Collins, F.S.; Varmus, H. A new initiative on precision medicine. N Engl J Med 2015, 372, 793–795. [Google Scholar] [CrossRef]
- Lieber, C.S. Metabolism of alcohol. Clin Liver Dis 2005, 9, 1–35. [Google Scholar] [CrossRef] [PubMed]
- Nakamura, Y.; Amamoto, K.; Tamaki, S.; Okamura, T.; Tsujita, Y.; Ueno, Y.; Kita, Y.; Kinoshita, M.; Ueshima, H. Genetic variation in aldehyde dehydrogenase 2 and the effect of alcohol consumption on cholesterol levels. Atherosclerosis 2002, 164, 171–177. [Google Scholar] [CrossRef]
- Wada, M.; Daimon, M.; Emi, M.; Iijima, H.; Sato, H.; Koyano, S.; Tajima, K.; Kawanami, T.; Kurita, K.; Hunt, S.C.; et al. Genetic association between aldehyde dehydrogenase 2 (ALDH2) variation and high-density lipoprotein cholesterol (HDL-C) among non-drinkers in two large population samples in Japan. J Atheroscler Thromb 2008, 15, 179–184. [Google Scholar] [CrossRef]
- Janssen, I.; Heymsfield, S.B.; Wang, Z.M.; Ross, R. Skeletal muscle mass and distribution in 468 men and women aged 18-88 yr. J Appl Physiol (1985) 2000, 89, 81–88. [Google Scholar] [CrossRef] [PubMed]
- Baraona, E.; Abittan, C.S.; Dohmen, K.; Moretti, M.; Pozzato, G.; Chayes, Z.W.; Schaefer, C.; Lieber, C.S. Gender differences in pharmacokinetics of alcohol. Alcohol Clin Exp Res 2001, 25, 502–507. [Google Scholar] [CrossRef]
- Del Boca, F.K.; Darkes, J. The validity of self-reports of alcohol consumption: state of the science and challenges for research. Addiction 2003, 98, 1–12. [Google Scholar] [CrossRef]
- Ginsburg, G.S.; Phillips, K.A. Precision Medicine: From Science To Value. Health Aff (Millwood) 2018, 37, 694–701. [Google Scholar] [CrossRef]
- Lee, Y.J.; Lee, H.; Jang, H.B.; Yoo, M.G.; Im, S.; Koo, S.K.; Lee, H.J. The potential effects of HECTD4 variants on fasting glucose and triglyceride levels in relation to prevalence of type 2 diabetes based on alcohol intake. Arch Toxicol 2022, 96, 2487–2499. [Google Scholar] [CrossRef] [PubMed]
- Szklarczyk, D.; Kirsch, R.; Koutrouli, M.; Nastou, K.; Mehryary, F.; Hachilif, R.; Gable, A.L.; Fang, T.; Doncheva, N.T.; Pyysalo, S.; et al. The STRING database in 2023: protein-protein association networks and functional enrichment analyses for any sequenced genome of interest. Nucleic Acids Res 2023, 51, D638–D646. [Google Scholar] [CrossRef] [PubMed]
Figure 1.
Dyslipidemia risk by alcohol consumption duration stratified by rs10849915 genotype. Odds ratios (OR) with 95% confidence intervals (CI) for dyslipidemia across alcohol consumption duration categories, stratified by rs10849915 genotype. Dark bars represent AA homozygotes (n=2,554); light bars represent AG/GG heterozygotes (n=821). Alcohol duration categories: <5 years (reference), 6-10 years, 11-15 years, 16-20 years, and >21 years. Vertical lines indicate 95% confidence intervals. Estimates from logistic regression models adjusted for age, sex, body mass index, and gamma-glutamyl transferase levels.
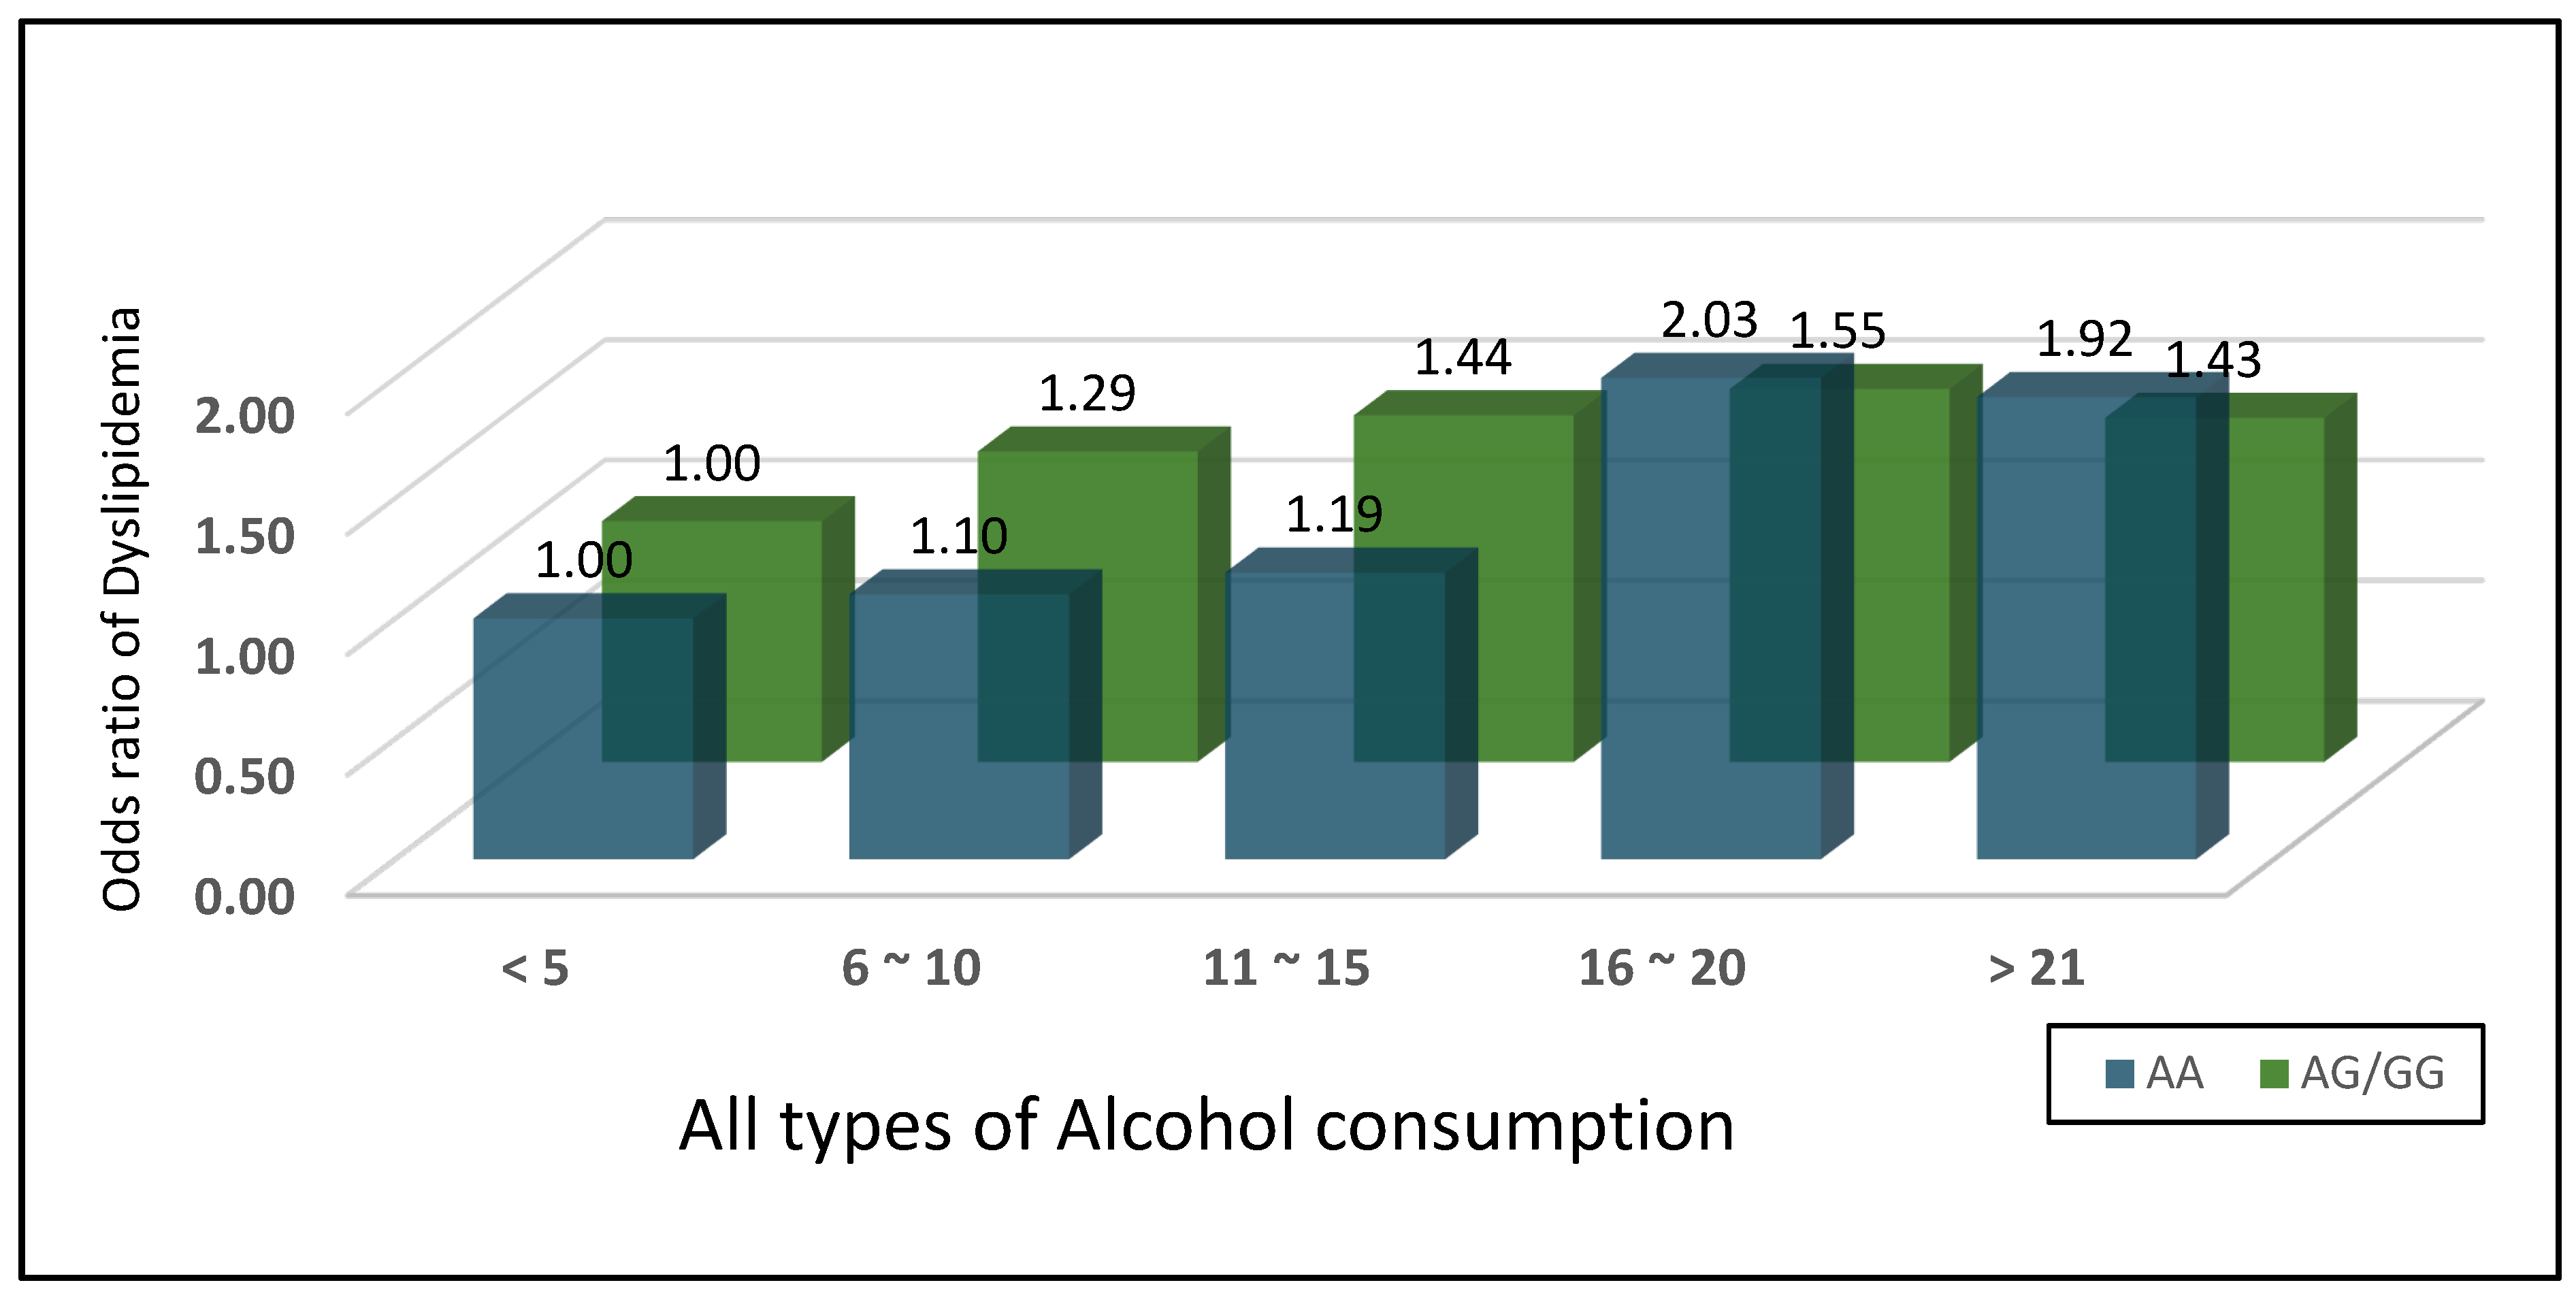
Figure 2.
Tissue-specific expression profile of CCDC63. (A)Gene expression levels of CCDC63 (ENSG00000173093.13) across 54 human tissues from the GTEx Portal (v10). Expression values shown as log-transformed transcripts per million [log(TPM+1)] to stabilize variance across tissues. Highest expression observed in testis and skeletal muscle. Data accessed November 7, 2025. TPM, transcripts per million. Data for these analyses were retrieved from: [https://gtexportal.org/home/gene/ENSG00000173093.13] the GTEx Portal on 11/07/2025.(B) Skeletal muscle eQTL effect of rs10849915 on CCDC63 expression. Violin plots display expression distribution across genotypes (TT: n=354, TC: n=357, CC: n=105). The C allele shows a positive effect on CCDC63 expression (normalized effect size = 0.13, P = 6.26 × 10⁻⁷). GTEx genotype labels (TT/TC/CC) use GRCh38 reference with T/C allele notation; the C allele corresponds to the G allele in our GRCh37-based Korean dataset (A/G notation), where G is the minor allele associated with increased dyslipidemia risk (OR = 1.15). Data from GTEx Portal v10 (accessed November 7, 2025; dbGaP Accession phs000424.v10.p2).
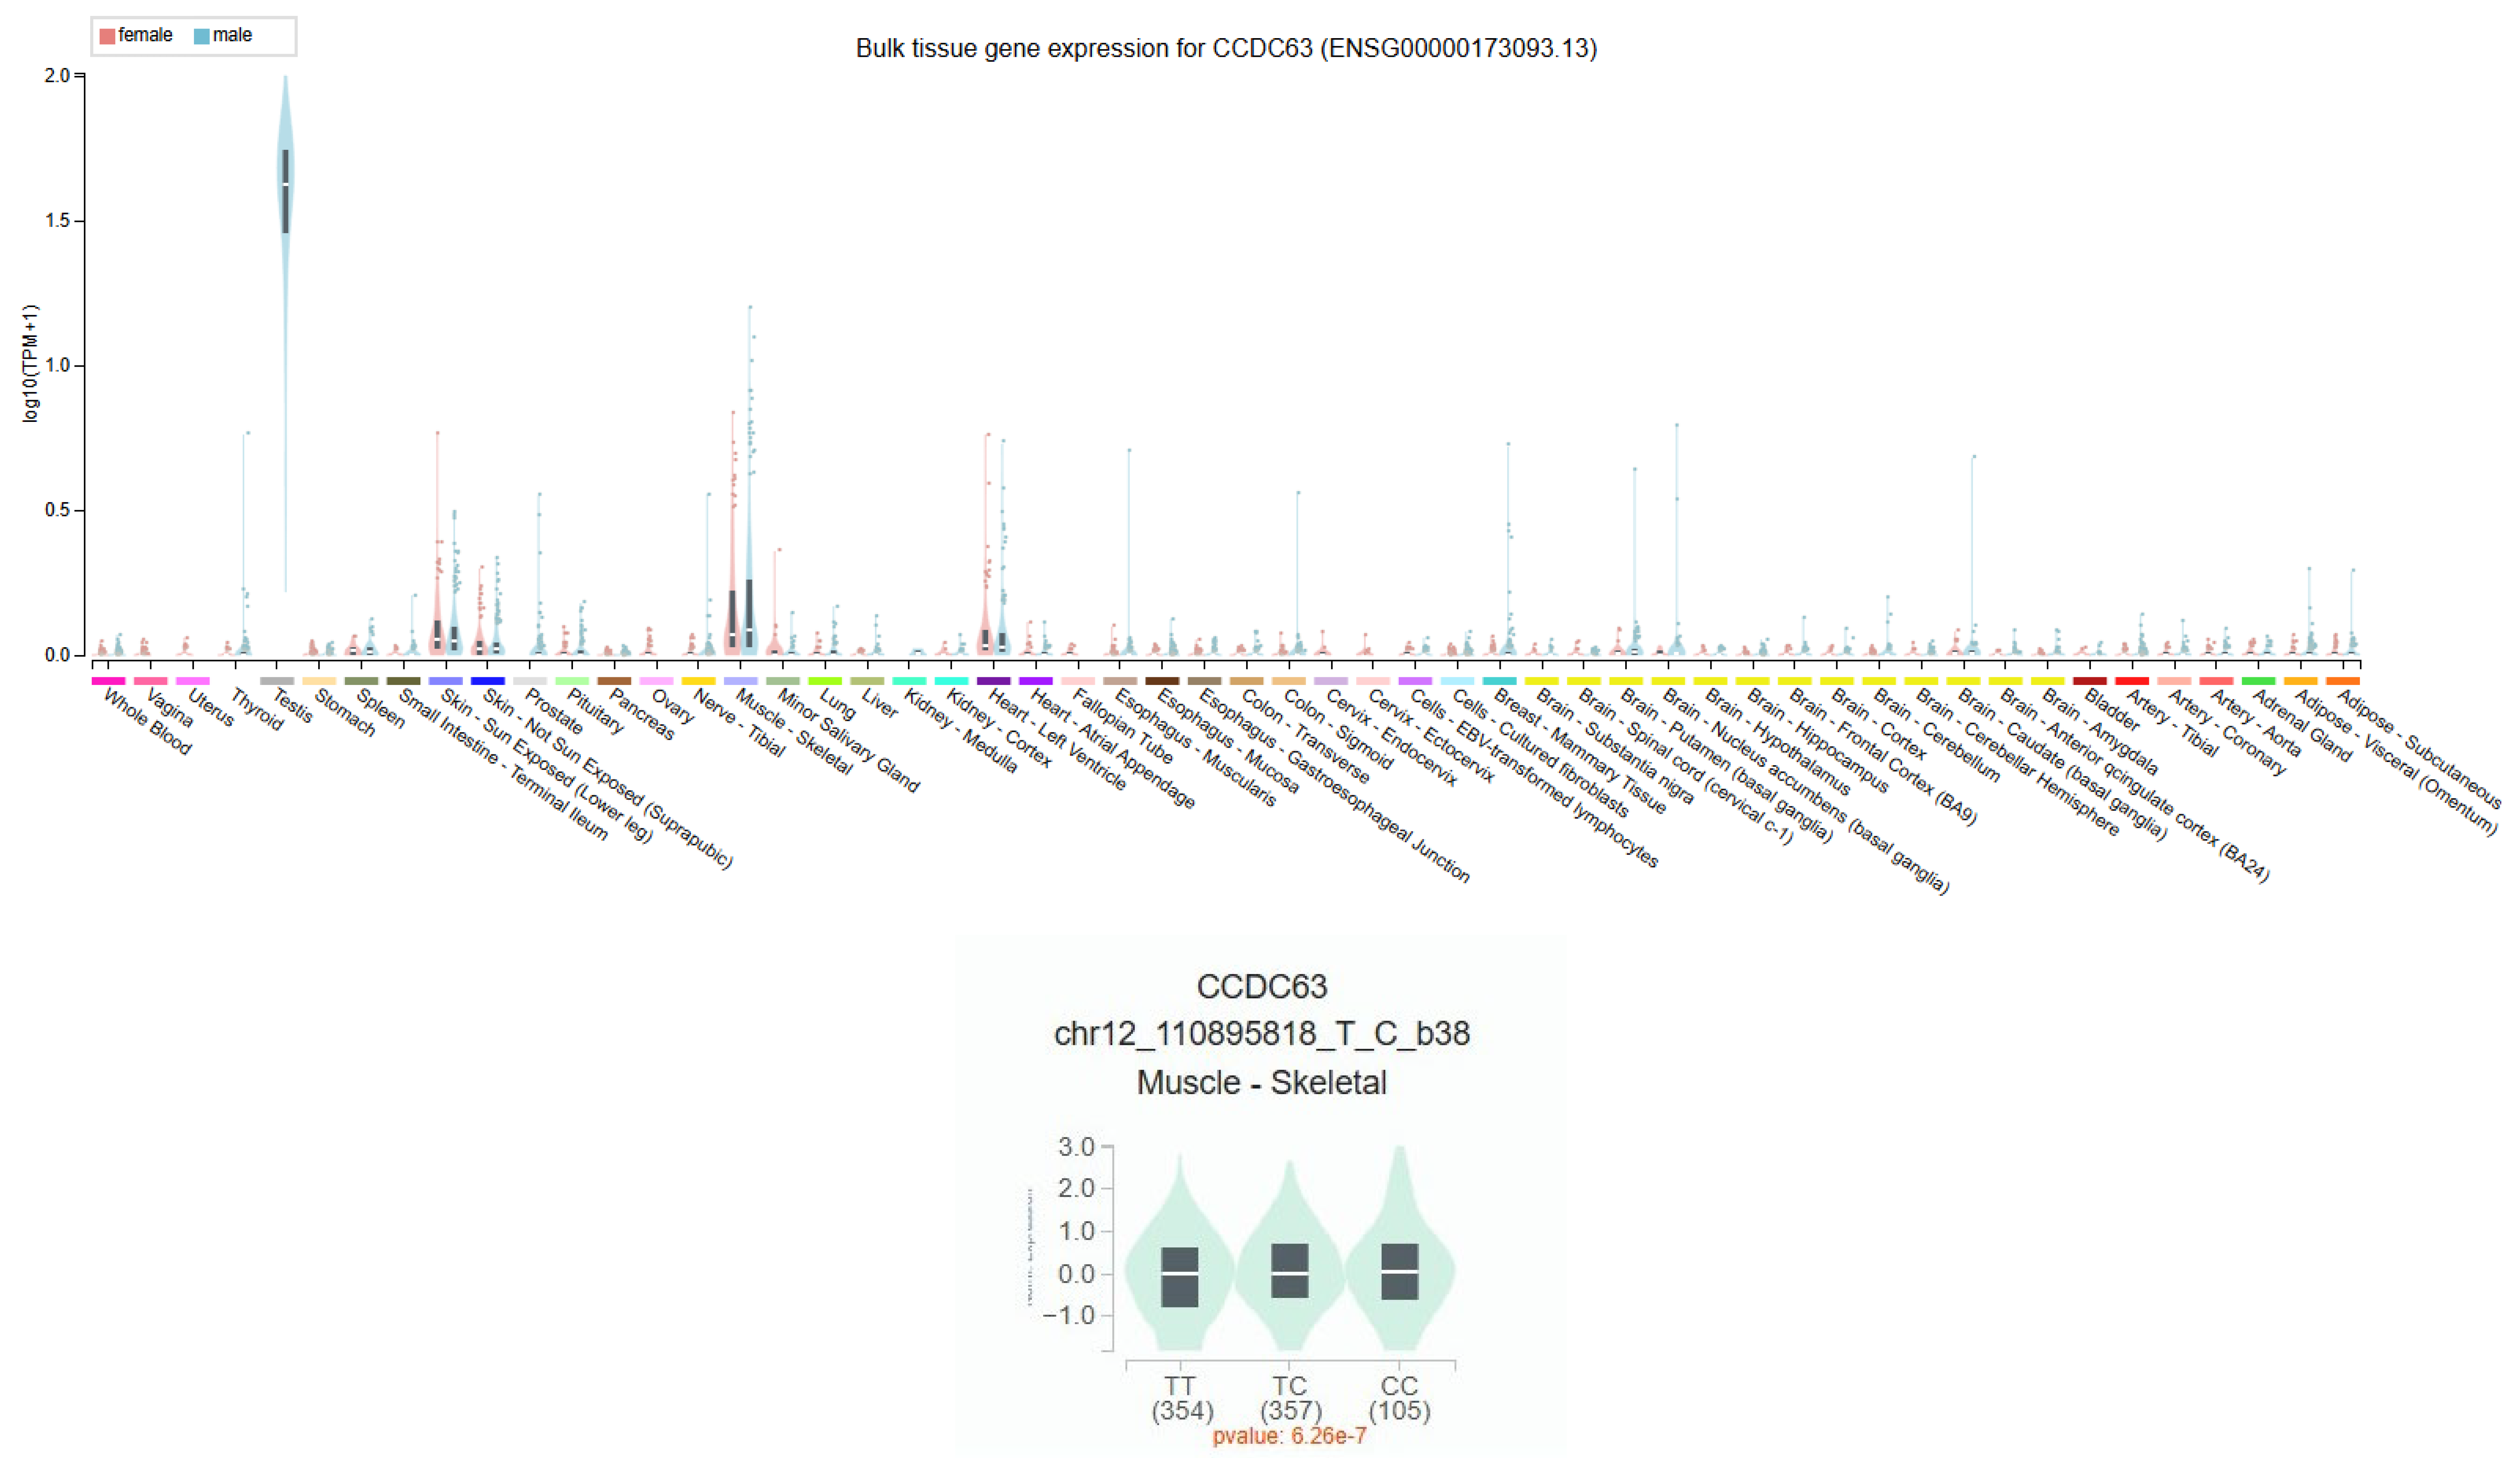

Table 1.
Characteristics of the study participants with the Korean association REsource (KARE) cohort.
Table 1.
Characteristics of the study participants with the Korean association REsource (KARE) cohort.
| Characteristics* | Quantitative trait analysis | Case-control analysis** | ||
|---|---|---|---|---|
| Normal | Dyslipidemia | P value*** | ||
| number of subjects | 6,655 | 2,328 | 4,327 | |
| Sex [male(%)/female(%)] | 3,177(47.7)/3,478(52.3) | 908(39.0)/1,420(61.0) | 2,269(52.4)/2,058(47.6) | <0.001 |
| Age (M years ± SD) | 52.10 ± 8.92 | 51.12 ± 9.08 | 52.68 ± 8.79 | 0.013 |
| Body mass index (BMI) (M kg/m2 ± SD) | 24.56 ± 3.14 | 23.31 ± 3.12 | 25.22 ± 2.94 | 0.003 |
| Total cholesterol (Tchl) (M ㎎/㎗ ± SD) | 186.43 ± 36.96 | 168.71 ± 19.12 | 195.97 ± 40.56 | <0.001 |
| Triglyceride (TG) (M ㎎/㎗ ± SD) | 154.99 ± 74.94 | 99.41 ± 24.44 | 184.90 ± 75.90 | <0.001 |
| High density lipoprotein cholesterol (HDL) (M ㎎/㎗ ± SD) | 43.32 ± 9.78 | 50.71 ± 7.94 | 39.35 ± 8.24 | 0.001 |
| Low density lipoprotein cholesterol (LDL) (M ㎎/㎗ ± SD) | 112.11 ± 33.36 | 98.12 ± 18.92 | 119.64 ± 36.84 | <0.001 |
*Abbreviations: M, mean; SD, standard deviation. Data are shown as mean ± SD for continuous variables or n (%) for categorical variables. **Normal group: Tchl < 200 mg/㎗, HDL > 40 mg/㎗, LDL < 130 mg/㎗, TG < 150 mg/㎗ (all four criteria met); Dyslipidemia group: Tchl ≥ 240 mg/㎗ or HDL ≤ 40 mg/㎗ or LDL ≥ 160mg/㎗ or TG ≥ 200 mg/㎗ (≥1 criterion met) *** Statistical comparisons between-groups were performed using two-tailed Student’s t-test (P < 0.05).
Table 2.
CCDC63 genetic polymorphisms associated with dyslipidemia susceptibility.
| No. | SNP | A1 | A2 | Function | MAF | Dyslipidemia | ||
|---|---|---|---|---|---|---|---|---|
| (controls 2,328: cases 4,327) | ||||||||
| controls | cases | OR (95% CI) | Add P | |||||
| 1 | rs2283348 | T | C | intron | 0.3877 | 0.3768 | 0.95 (0.89~1.03) | 0.2162 |
| 2 | rs10219717 | T | C | intron | 0.3899 | 0.3798 | 0.96 (0.89~1.03) | 0.2520 |
| 3 | rs756838 | T | A | intron | 0.3901 | 0.3799 | 0.96 (0.89~1.03) | 0.2457 |
| 4 | rs2238149 | G | A | intron | 0.1554 | 0.1749 | 1.15 (1.05~1.27) | 0.0043 |
| 5 | rs10849915 | G | A | intron | 0.1645 | 0.1852 | 1.15 (1.05~1.27) | 0.0032 |
| 6 | rs11065756 | A | G | intron | 0.1634 | 0.1844 | 1.16 (1.05~1.27) | 0.0026 |
Logistic regression analysis under an additive genetic model adjusting for age, sex, body mass index, and region. Abbreviations: SNP, single nucleotide polymorphism; A1, minor allele; A2, major allele; MAF, minor allele frequency; OR, odds ratio; CI, confidence interval; Add P, P-value under additive genetic model. *Bold values highlight P < 0.05.
Table 3.
Comparison of rs10849915 associations with alcohol consumption in previous Genome-Wide Association Study.
Table 3.
Comparison of rs10849915 associations with alcohol consumption in previous Genome-Wide Association Study.
| Phenotype | Previous studies | Replication in Koreans | |||||
|---|---|---|---|---|---|---|---|
| EA | β ± SE, OR(95% CI) | P value*** | Research study | EA | β ± SE, OR(95% CI) | P value*** | |
| Alcohol consumption | G | -0.55 ± 0.05 | 1.0 X 10⁻²³ | Inkyung Baik et al. | G | -0.31 ± 0.02 | 1.31X 10-60 |
| C | 0.04 | 4.0 X 10⁻²⁸ | Eric Jorgenson et al. | NA | |||
Comparison of rs10849915 effect sizes across population. All analyses adjusted for age, sex, and body mass index. Previous studies examined alcohol consumption as continuous variable (drinks per week or grams per day). Current study validated associations in Korean cohort using identical phenotype definition. Abbreviations: β, regression coefficient; CI, confidence interval; EA, effect allele; NA, not available; OR, odds ratio; SE, standard error.
Table 4.
Three CCDC63 polymorphisms associated with alcohol-related hepatic enzymes and serum lipid profiles.
Table 4.
Three CCDC63 polymorphisms associated with alcohol-related hepatic enzymes and serum lipid profiles.
| Traits | rs10849915 | rs11065756 | rs2238149 | |||
|---|---|---|---|---|---|---|
| Effect size | P -value | Effect size | P -value | Effect size | P -value | |
| (β±s.e) | (β±s.e) | (β±s.e) | ||||
| Alcohol-related liver enzyme levels | ||||||
| ALT (U/L) | -1.18 ± 0.51 | 0.02214 | -1.13 ± 0.52 | 0.02966 | -0.95 ± 0.53 | 0.07174 |
| AST (U/L) | -1.20 ± 0.37 | 0.00125 | -1.19 ± 0.37 | 0.00134 | -1.16 ± 0.38 | 0.00220 |
| γ-GTP (U/L) | -6.99 ± 1.29 | 5.68X10⁻⁸ | -7.24 ± 1.29 | 2.07X10⁻⁸ | -7.55 ± 1.31 | 8.67X10⁻⁸ |
| Serum lipid levels | ||||||
| HDL (㎎/㎗) | -0.87 ± 0.29 | 0.00244 | -0.91 ± 0.29 | 0.00148 | -0.79 ± 0.29 | 0.00704 |
| TG (㎎/㎗) | -3.49 ± 2.19 | 0.11080 | -3.68 ± 2.20 | 0.09409 | -3.93 ± 2.24 | 0.07923 |
Linear regression analysis under additive genetic model adjusting for age, sex, body mass index, and residential area. Effect sizes (β) represent change in trait levels per additional minor allele. Hepatic enzymes measured in U/L; lipid parameters measured in mg/dL. Abbreviations: ALT, alanine aminotransferase; AST, aspartate aminotransferase; γ-GTP, gamma-glutamyl transpeptidase; HDL, high-density lipoprotein cholesterol; TG, triglycerides. *Bold values indicate P < 0.05.
Table 5.
rs10849915 genotype-stratified analysis of alcohol exposure duration and dyslipidemia risk.
Table 5.
rs10849915 genotype-stratified analysis of alcohol exposure duration and dyslipidemia risk.
| AA genotype (n=2,554) | AG/GG genotype (n=821) | |||
|---|---|---|---|---|
| OR (95% CI) | P value*** | OR (95% CI) | P value*** | |
| Sex | 0.41 (0.34~0.50) | <.001 | 1.17 (0.59~2.33) | 0.646 |
| Age | 1.01 (1.00~1.02) | 0.264 | 1.13 (1.08~1.18) | <.001 |
| BMI | 1.33 (1.29~1.37) | <.001 | 1.29 (1.15~1.44) | <.001 |
| γ-GTP | 1.00 (1.00~1.01) | <.001 | 1.00 (1.00~1.00) | <.001 |
| Alcohol consumption | ||||
| < 5 | 1(ref) | <.001 | 1(ref) | 0.05 |
| 6 ~ 10 | 1.10 (0.76~1.58) | 0.062 | 1.29 (0.70~2.40) | 0.04 |
| 11 ~ 15 | 1.19 (0.81~1.77) | 0.038 | 1.44 (0.75~2.79) | 0.03 |
| 16 ~ 20 | 2.03 (1.44~2.85) | <.001 | 1.55 (0.84~2.84) | 0.02 |
| > 21 | 1.92 (1.47~2.49) | <.001 | 1.43 (0.93~2.20) | 0.01 |
Logistic regression analysis stratified by rs10849915 genotype. Alcohol consumption duration categories: ≤5 years (reference), 6-10 years, 11-15 years, 16-20 years, and >21 years. Models adjusted for age, sex, body mass index, and γ-glutamyl transferase levels. Odds ratios (OR) with 95% confidence intervals (CI) represent dyslipidemia risk relative to ≤5 years exposure within each genotype group. P-values calculated from Wald test. Abbreviations: BMI, body mass index; CI, confidence interval; γ-GTP, gamma-glutamyl transferase; OR, odds ratio.
Table 6.
Sex-specific effects of rs10849915 on dyslipidemia and metabolic traits.
| Traits | Male | Female | ||
|---|---|---|---|---|
| Effect size | P -value | Effect size | P -value | |
| β ± SE, OR(95% CI) | β ± SE, OR(95% CI) | |||
| Dyslipidemia | 1.24 (1.07~1.43) | 0.00340 | 1.07 (0.95~1.22) | 0.27370 |
| Alcohol consumption | -0.40 ± 0.02 | 2.71 X10-74 | -0.23 ± 0.02 | 1.66 X10⁻²² |
| Clinical indicators of alcohol consumption | ||||
| ALT (U/L) | -1.45 ± 0.94 | 0.01223 | -0.97 ± 0.45 | 0.03138 |
| AST (U/L) | -1.98 ± 0.64 | 0.00215 | -0.51 ± 0.38 | 0.18140 |
| γ-GTP (U/L) | -13.02 ± 2.51 | 2.16 X10⁻⁷ | -1.60 ± 0.65 | 0.01461 |
| Dyslipidemia Clinical Indicators | ||||
| HDL (㎎/㎗) | -1.86 ± 0.33 | 0.00000 | 0.06 ± 0.45 | 0.90240 |
| TG (㎎/㎗) | -9.83 ± 3.57 | 0.00591 | 2.19 ± 2.55 | 0.39110 |
Logistic regression (for dyslipidemia) and linear regression (for continuous traits) under additive genetic model. Analyses performed separately in males (n=3,177) and females (n=3,478). Models adjusted for age, body mass index, and residential area. Effect sizes shown as odds ratios (OR) for dyslipidemia and regression coefficients (β ± SE) for continuous variables. Abbreviations: ALT, alanine aminotransferase; AST, aspartate aminotransferase; γ-GTP, gamma-glutamyl transferase; HDL, high-density lipoprotein cholesterol; TG, triglycerides. Bold values indicate P < 0.05.
Disclaimer/Publisher’s Note: The statements, opinions and data contained in all publications are solely those of the individual author(s) and contributor(s) and not of MDPI and/or the editor(s). MDPI and/or the editor(s) disclaim responsibility for any injury to people or property resulting from any ideas, methods, instructions or products referred to in the content. |
© 2026 by the authors. Licensee MDPI, Basel, Switzerland. This article is an open access article distributed under the terms and conditions of the Creative Commons Attribution (CC BY) license.
Copyright: This open access article is published under a Creative Commons CC BY 4.0 license, which permit the free download, distribution, and reuse, provided that the author and preprint are cited in any reuse.


