Submitted:
09 January 2026
Posted:
09 January 2026
You are already at the latest version
Abstract
This study focuses on the factors influencing the performance of agribusiness MSME clusters in Central Java Province, an area that has not been previously studied. The novelty of this study lies in the use of cluster performance variables and indicators that differ from those in previous studies. This study uses a descriptive analytical method. The research locations were determined purposively, specifically in Pati Regency, Rembang, Demak, Purbalingga, Pekalongan, Sukoharjo, and Magelang City, which have a larger number of agribusiness MSME clusters compared to other regions. The research sample consisted of 251 agribusiness MSMEs, selected proportionally across seven areas. Data analysis used the SEM method with PLS tools. The results of the study indicate that social capital is the factor influencing the performance of agribusiness MSME clusters. Social capital drives the performance of agribusiness MSME clusters. While collective efficiency, social and economic benefits, and MSME performance do not affect the performance of agribusiness MSME clusters. Collective efficiency influences social capital, meaning that collective efficiency drives the development of social capital. Additionally, collective efficiency also influences socioeconomic benefits, indicating that collective efficiency drives socioeconomic benefits. However, collective efficiency does not affect MSME performance. Social capital influences socioeconomic benefits, meaning that it drives these benefits; however, social capital does not directly affect MSME performance. Socioeconomic benefits influence the performance of MSMEs, which means that socioeconomic benefits drive their performance.
Keywords:
performance
; social capital
; cluster
; MSMEs
; agribusiness
1. Introduction
Central Java Province is one of the provinces in Indonesia with a growing potential for Micro, Small, and Medium Enterprises (MSMEs). To strengthen the MSME development network in Central Java Province, an agribusiness MSME cluster has been established. However, intersectoral roles and coordination are still suboptimal, with overlapping programs in cluster development often occurring, requiring further improvement (Wulandari et al., 2023). This situation has led to the less-than-optimal implementation of MSME development programs in Central Java Province, necessitating more integrated efforts to develop MSMEs within a single area for the development of leading commodities (Yunus et al., 2021). MSME data in Central Java Province is presented in Table 1.
The potential for agribusiness MSMEs in Central Java Province is substantial, as indicated by the number of progressive agribusiness MSMEs. This condition can be a potential for the development of agribusiness MSME Clusters, but it can also be problematic if the MSME cluster is not managed correctly. In the development of agribusiness MSMEs in Central Java Province, in addition to developing MSMEs individually based on business type, it is also implemented with a cluster approach, where the development of agribusiness MSMEs is carried out by involving not only agribusiness MSME actors but also related stakeholders (Indreswari et al., 2021) (Bappeda dan Litbang Kabupaten Wonogiri, 2022).
Industrial clusters are not only determined by geographical proximity, but primarily by real economic linkages through input-output relationships, knowledge flows, and functional interactions between business actors (Feser & Sweeney, 2000; Delgado et al., 2016). Clusters are understood as regional economic systems that are formed when the intensity of ongoing financial and institutional relationships accompanies the spatial concentration of companies. (Feser & Bergman, 2010). The success of clusters also depends on the evolutionary dynamics of market relationships, institutions, and social networks, not solely on geographic location (Martin & Sunley, 2011). Intense economic interactions within clusters foster collective learning, knowledge diffusion, innovation, and improved firm performance, particularly through vertical and horizontal relationships between business actors (Cainelli & Iacobucci, 2012; Giuliani, 2013). In the context of MSMEs, economically connected clusters can increase productivity, competitiveness, and regional growth through mutually beneficial relationships between companies and supporting institutions (Delgado et al., 2014).
Several issues persist in the agribusiness MSME cluster, including suboptimal coordination among members, infrequent meetings, and challenging market access, which result in suboptimal sales despite the availability of well-known products. Further challenges include suboptimal sectoral coordination within local governments, hindering strategic partnerships, particularly those related to technology adoption and capital access. The performance of the agribusiness MSME cluster in Central Java generally ranges from the initial to the development stage, with strengths in specialty superior commodities but weaknesses in coordination and marketing (Adi et al., 2016).
Several researchers have previously studied the performance of MSME clusters. A study in Purbalingga found that business networks were the most dominant factor influencing the performance of agribusiness MSMEs, as determined through multiple linear regression (Wulandari et al., 2023). In contrast, an analysis of batik business funding in Pekalongan revealed a positive relationship with both financial and operational performance (Rachmawati & Widowati, 2021). Further mapping includes the Klaten cluster (ceramics) that explores the financial-technical-marketing aspects via Spearman correlation (Apriliyani & Amalia, 2019), while the Central Java Investment Board emphasizes the role of FPESD in resource coordination for collective efficiency. Previous studies tend to use descriptive quantitative and regression methods, do not explore the relationships or interactions between variables themselves and have not described the factors that influence cluster performance holistically. This study examines the impact of collective efficiency, social capital, and social and economic benefits on the performance of MSME clusters.
Based on the aforementioned urgency, this study aims to examine the influence of collective factors of efficiency, social capital, social and economic benefits, and MSMEs' performance on the performance of the agribusiness MSME cluster in Central Java Province. The novelty of this study lies in the use of more holistic cluster performance indicators and the use of SEM analysis to determine the interactions between variables. The results of this study are beneficial as a reference for relevant stakeholders in the development of agribusiness MSME clusters in Central Java Province in the future.
2. Literatur Review and Hypothesis
2.1. Literatur Review
Micro, Small, and Medium Enterprises (MSMEs) play a strategic role in the Indonesian economy. MSMEs in the agribusiness sector play a crucial role in driving rural development and maintaining national food security (Dharmadjaya et al., 2022). Agribusiness MSMEs are the driving force of the rural economy, as they can absorb labor and increase household incomes. Food security and the smooth supply chain of agricultural products are also strengthened through agribusiness MSME activities. The scope of agribusiness MSMEs includes food processing, horticulture, livestock, and herbal products that process agricultural products into value-added products. Efficient production process management and the application of modern technology to increase MSME productivity (Kumari & Dhingra, 2024).
Agribusiness MSMEs possess several advantages that significantly contribute to economic growth, job creation, and innovation development. The presence of MSMEs in this sector plays a significant role in creating employment opportunities, particularly in rural and underdeveloped areas, thereby reducing regional disparities and promoting income equality (Srinvasan et al., 2015). Agribusiness MSMEs are also known to be adaptable to change by implementing various new practices and technologies. The use of digital technology and environmentally friendly innovations is widely employed to enhance production efficiency while promoting business sustainability (Khomah et al., 2021).
Agribusiness MSMEs face limited access to financing due to complex loan requirements and procedures, resulting in low investment in technology and production facilities, as well as the continued dominance of conventional production practices, which leads to suboptimal business efficiency (Bisht & Singh, 2020). This situation has been further exacerbated by the COVID-19 pandemic, which has created liquidity pressures and disrupted the availability of working capital for MSMEs (Gupta & Kumar, 2023).
A cluster refers to a group of business actors that are interconnected and mutually reinforcing through the use of shared resources and cooperation among members. This business grouping approach can improve the operational efficiency, competitiveness, and innovation capacity of MSMEs. Cluster formation can be based on various characteristics, such as asset size, turnover, workforce, and business licensing (Alamanda et al., 2023). The performance of an MSME cluster reflects the success rate of a connected group of businesses in achieving higher productivity, growth, and competitive advantage than if they operated individually. Grouping MSMEs into clusters also takes into account their readiness to implement technology, ranging from small-scale clusters to large-scale clusters (Purnomo et al., 2021).
Cluster performance determinants include the strength of business networks, the quality of human resources, and institutional support. Effectively established collaborative relationships within a cluster act as a bridge between cluster characteristics and the performance of individual businesses (Wudu et al., 2024). A strong network enables information exchange, technology utilization, and access to market opportunities among members, enabling faster innovation and production efficiency. Human resource capacity, from managerial, technical, and entrepreneurial perspectives, directly influences a cluster's ability to increase productivity and adapt to market demand. The role of the government and supporting institutions through cluster policies, training, and partnership facilitation helps strengthen the cluster ecosystem and encourages increased collective performance. Furthermore, cluster performance is influenced by broader institutional conditions, including governance patterns and the macroeconomic situation, which determine the level of cluster integration within the economic system and its contribution to growth. (Parto, 2008).
Measuring cluster performance involves various interrelated aspects, such as economic, social, and institutional. The impact of clusters on economic performance varies across business sectors, with some industries, such as automotive, engineering, and nanotechnology, showing more pronounced performance improvements than others (Zizka & Stichhauerova, 2023). However, improved economic performance within clusters is not always accompanied by the creation of strong social ties in the surrounding area, as economic benefits can coexist with less positive social impacts (Rocha et al., 2020). Institutional roles, including governance systems and macroeconomic conditions, significantly determine whether clusters can integrate well into the economic system and contribute to growth. The use of information systems for benchmarking can help clusters compare performance, improve collective efficiency, and strengthen cooperation among members (Carpinetti & Oiko, 2008). Cluster success is strongly influenced by the ability to share knowledge, collective efficiency, good governance, and attention to human and social resources so that cluster benefits can be felt sustainably. The conceptual model used in this study refers to Carpinetti (2008), which is presented in Figure 1.
Referring to (Carpinetti et al., 2008), there are four variables used in this study: collective efficiency, social capital, company performance, and social and economic benefits. The design of the cluster performance measurement model produces KPIs (Key Performance Indicators) as a tool to measure performance through the stages carried out. The first stage is determining the objectives of the research model. Each variable has different objectives: collective efficiency aims to reduce costs incurred and increase cooperation among cluster members (Schmitz, 1995). Social capital aims to increase employment opportunities in the surrounding environment and improve employee performance to produce optimal products. (Cohen & Prusak, 2021). The performance of MSME clusters aims to improve marketing, productivity, and company profits (MSMEs). This is supported by Royo-Vela, M., Amezquita Salazar, J. C., & Puig Blanco, F. (2022), who stated that MSME clusters improve marketing performance through collective promotion and branding, expanding market access, and increasing business productivity through collaboration between actors. The ultimate impact is seen in improving MSME financial performance and profits. Meanwhile, Faisol, Aliami, S., & Anas, M. (2022) stated that MSME cluster performance encourages increased productivity and innovation through collaboration and resource sharing, while strengthening product marketing and distribution. This synergy contributes directly to sales growth and company profits. This is also supported by Hoetoro, A. (2020), who stated that MSME cluster development focuses on increasing production efficiency, market access, and competitiveness, which ultimately impacts the profitability and sustainability of MSME businesses.
The social and economic benefits experienced by cluster members—such as trust, collaboration, and mutual benefits—are the main attractions for new companies to join, thus driving the growth of cluster membership. Gerke, A. (2023) states that economic benefits (market access, cost efficiency) and social benefits (networking, legitimacy) serve as membership incentives, which increase participation and expansion of the number of cluster members. Meanwhile, Guimarães, L. G. d. A., Blanchet, P., & Cimon, Y. (2021) state that clusters that are able to generate real economic benefits and collaborative benefits show higher attractiveness to other companies, thus accelerating the growth and expansion of membership. Meanwhile, Kim, N., & Shim, C. (2018) also state that social benefits such as trust and knowledge exchange, along with economic benefits in the form of better business performance, increase the intention of companies to join and remain in the cluster, which has an impact on increasing the number of members.
The next step is to determine the elements that influence the objectives to achieve them. Once the elements are defined, KPIs will be generated as a tool to measure performance and achieve the objectives of the model. Indicator determination refers to the Feser approach and the Carpinetti model. After each indicator is compiled into a variable, a KPI confirmation check is performed. This KPI confirmation check is conducted to determine which indicators are needed and which are unnecessary.
2.2. Hypothesis
Collective efficiency is formed through the interconnectedness and synergy between core industries, related industries, supporting industries, and other supporting services, which ultimately impacts the performance of agribusiness MSME clusters and community welfare (Chaminade dan Vang, 2008; Hadi et al, 2022; Lema dan Vang, 2018). Improved soft locational factors encourage network expansion, build greater trust, and encourage innovation and specialization within the cluster. The combination of these factors can strengthen collective efficiency and ultimately improve the overall performance of agribusiness MSME clusters (Dornberger dan Utama, 2006).
H1.
Collective efficiency has a significant and positive effect on the performance of agribusiness MSME clusters.
Social capital significantly influences the operational activities of MSMEs, especially under conditions of limited resources (Collins and Clark, 2023; Easmon et al., 2019; Ho, 2025; Luo et al., 2004; Tomlinson and Fai, 2013). Social capital plays a crucial role in increasing the efficiency of MSME operations. This increased efficiency ultimately has a positive impact on the overall performance of agribusiness MSME clusters.
H2.
Social capital has a significant and positive effect on the performance of agribusiness MSME clusters.
Socioeconomic benefits are a crucial factor contributing to the improved performance of small and medium enterprises (MSMEs). Socioeconomic benefits significantly influence business performance within clusters (Hoetoro, 2020; Ramez et al., 2022; Seo et al., 2023; Tran et al., 2024). Socioeconomic benefits not only impact the social environment but also play a strategic role in improving business sustainability and performance.
H3.
Socioeconomic benefits significantly and positively influence the performance of agribusiness MSME clusters.
Company or MSME performance is closely related to cluster performance or MSME group dynamics. Improved company performance, as reflected in various performance indicators, significantly shapes and influences cluster performance (Temouri, 2012; Monni et al., 2017). Similarly, individual MSME performance is also used as an indicator of the success of MSME networks or clusters (Susanto, 2021). This suggests that company performance and cluster conditions mutually influence each other, so that MSME performance at the individual level can impact overall cluster dynamics and performance (Zhao et al., 2023).
H4.
Company (MSME) performance has a positive and significant effect on agribusiness MSME Cluster Performance.
Collective efficiency in MSME clusters is reflected in the ability of business actors to work together in a coordinated manner through resource sharing, information exchange, and production and marketing collaboration. These collective practices encourage the formation of repeated and intensive relationships among business actors, thereby strengthening trust, shared norms, and social networks, which are the core of social capital (Schmitz, 1999; Nadvi, 2004). Social capital develops when economic interactions are sustainable and mutually beneficial, as business actors become increasingly dependent on one another to achieve collective efficiency (Putnam, 2000). Therefore, the higher the collective efficiency in an agribusiness MSME cluster, the stronger the social capital formed among cluster members (Woolcock & Narayan, 2000).
H5.
Collective efficiency has a positive and significant effect on social capital.
Collective efficiency enables MSMEs within a cluster to gain economic benefits through reduced production costs, increased business scale, and broader market access. In addition to economic benefits, collective cooperation also generates social benefits such as increased solidarity, a sense of community, and stable relationships among business actors (Schmitz, 1995; Humphrey & Schmitz, 2002). In the context of agribusiness clusters, collective efficiency creates an inclusive business environment, where MSMEs not only gain financial benefits but also social and institutional support (Becattini, 1990). Therefore, collective efficiency plays a crucial role in simultaneously increasing social and economic benefits for cluster members.
H6.
Collective efficiency has a positive and significant effect on social and economic benefits.
Collective efficiency directly contributes to improved company performance by increasing productivity, product quality, and the competitiveness of MSMEs. Collaboration among business actors within a cluster enables companies to capitalize on shared advantages, such as sharing technology, market information, and production process innovations (Porter, 1998; Schmitz, 1999). Company performance within a cluster is also influenced by the ability of MSMEs to access resources previously difficult to obtain individually. Thus, collective efficiency is an important mechanism for sustainably improving the performance of agribusiness MSMEs (Giuliani et al., 2005).
H7.
Collective efficiency has a positive and significant effect on MSME performance.
Strong social capital is characterized by trust, norms of reciprocity, and solid social networks among MSMEs. This social capital facilitates economic cooperation and facilitates the flow of information, thereby increasing business efficiency and income opportunities (Putnam, 1993; Coleman, 1988). In addition to economic benefits, social capital also generates social benefits in the form of increased social cohesion, a sense of belonging, and a strengthened collective bargaining position of MSMEs in the marketplace and external parties (Woolcock, 2001). Therefore, social capital is a crucial foundation for creating sustainable social and economic benefits for agribusiness MSME clusters.
H8.
Social capital has a positive and significant impact on social and economic benefits.
Social capital acts as an intangible asset that can improve company performance through easier access to information, reduced transaction costs, and increased trust among business partners. MSMEs with high social capital tend to be more adaptive, innovative, and better able to manage business risks (Nahapiet & Ghoshal, 1998; Adler & Kwon, 2002). In the agribusiness MSME cluster, social capital strengthens relationships between business actors and encourages collaboration, which positively impacts productivity and company performance (Susanto, 2021). This indicates that social capital is a crucial determinant in improving individual MSME performance.
H9.
Social capital has a positive and significant effect on MSMEs' performance.
The social and economic benefits obtained by MSMEs, such as increased income, market access, social support, and business stability, directly contribute to improved company performance. Economic benefits strengthen MSMEs' financial capacity, while social benefits increase motivation, loyalty, and the sustainability of business relationships (Monni et al., 2017; Zhao et al., 2023). In the agribusiness MSME cluster, the synergy between social and economic benefits creates a conducive business environment for sustainable company performance improvement. Therefore, the greater the social and economic benefits received by MSMEs, the higher the company's performance can be achieved.
H10.
Socioeconomic benefits have a positive and significant effect on MSMEs' performance.
3. Materials and Methods
3.1. Variables and Indicators
The exogenous variables in this study are Collective Efficiency (X1), Social Capital (X2), Social and Economic Benefits (X3), and Company Performance (MSMEs) (X4).
Meanwhile, endogenous variables are dependent variables whose outcomes are influenced by several independent (exogenous) variables. In the SEM method, endogenous variables are characterized by arrows pointing to them. The endogenous variable in this study is MSME Cluster Performance (Y). The variables and indicators used in this study refer to the Feser and Carpinetti Model approaches. The variables and indicators are presented in Table 2 below:
The factors influencing the performance of MSME clusters were measured using a Likert scale. According to Sugiyono (2013), a Likert scale is used to measure the attitudes, opinions, and perceptions of an individual or group of people regarding social phenomena. Using a Likert scale, the variables to be measured are broken down into variable indicators.
3.2. Sampling and Data Collecting
The research locations and respondents were determined purposively (Ahmad & Wilkins, 2025), (Tongco, 2007), (Campbell et al., 2020), (Memon et al., 2025), and (Tsang et al., 2019), based on specific characteristics or considerations relevant to the research problem. The distribution of locations and respondents is described in Table 3
Primary data collection used a survey through direct interviews with MSME entrepreneurs. Secondary data collection from stakeholders was conducted through note-taking.
Data Analysis Method
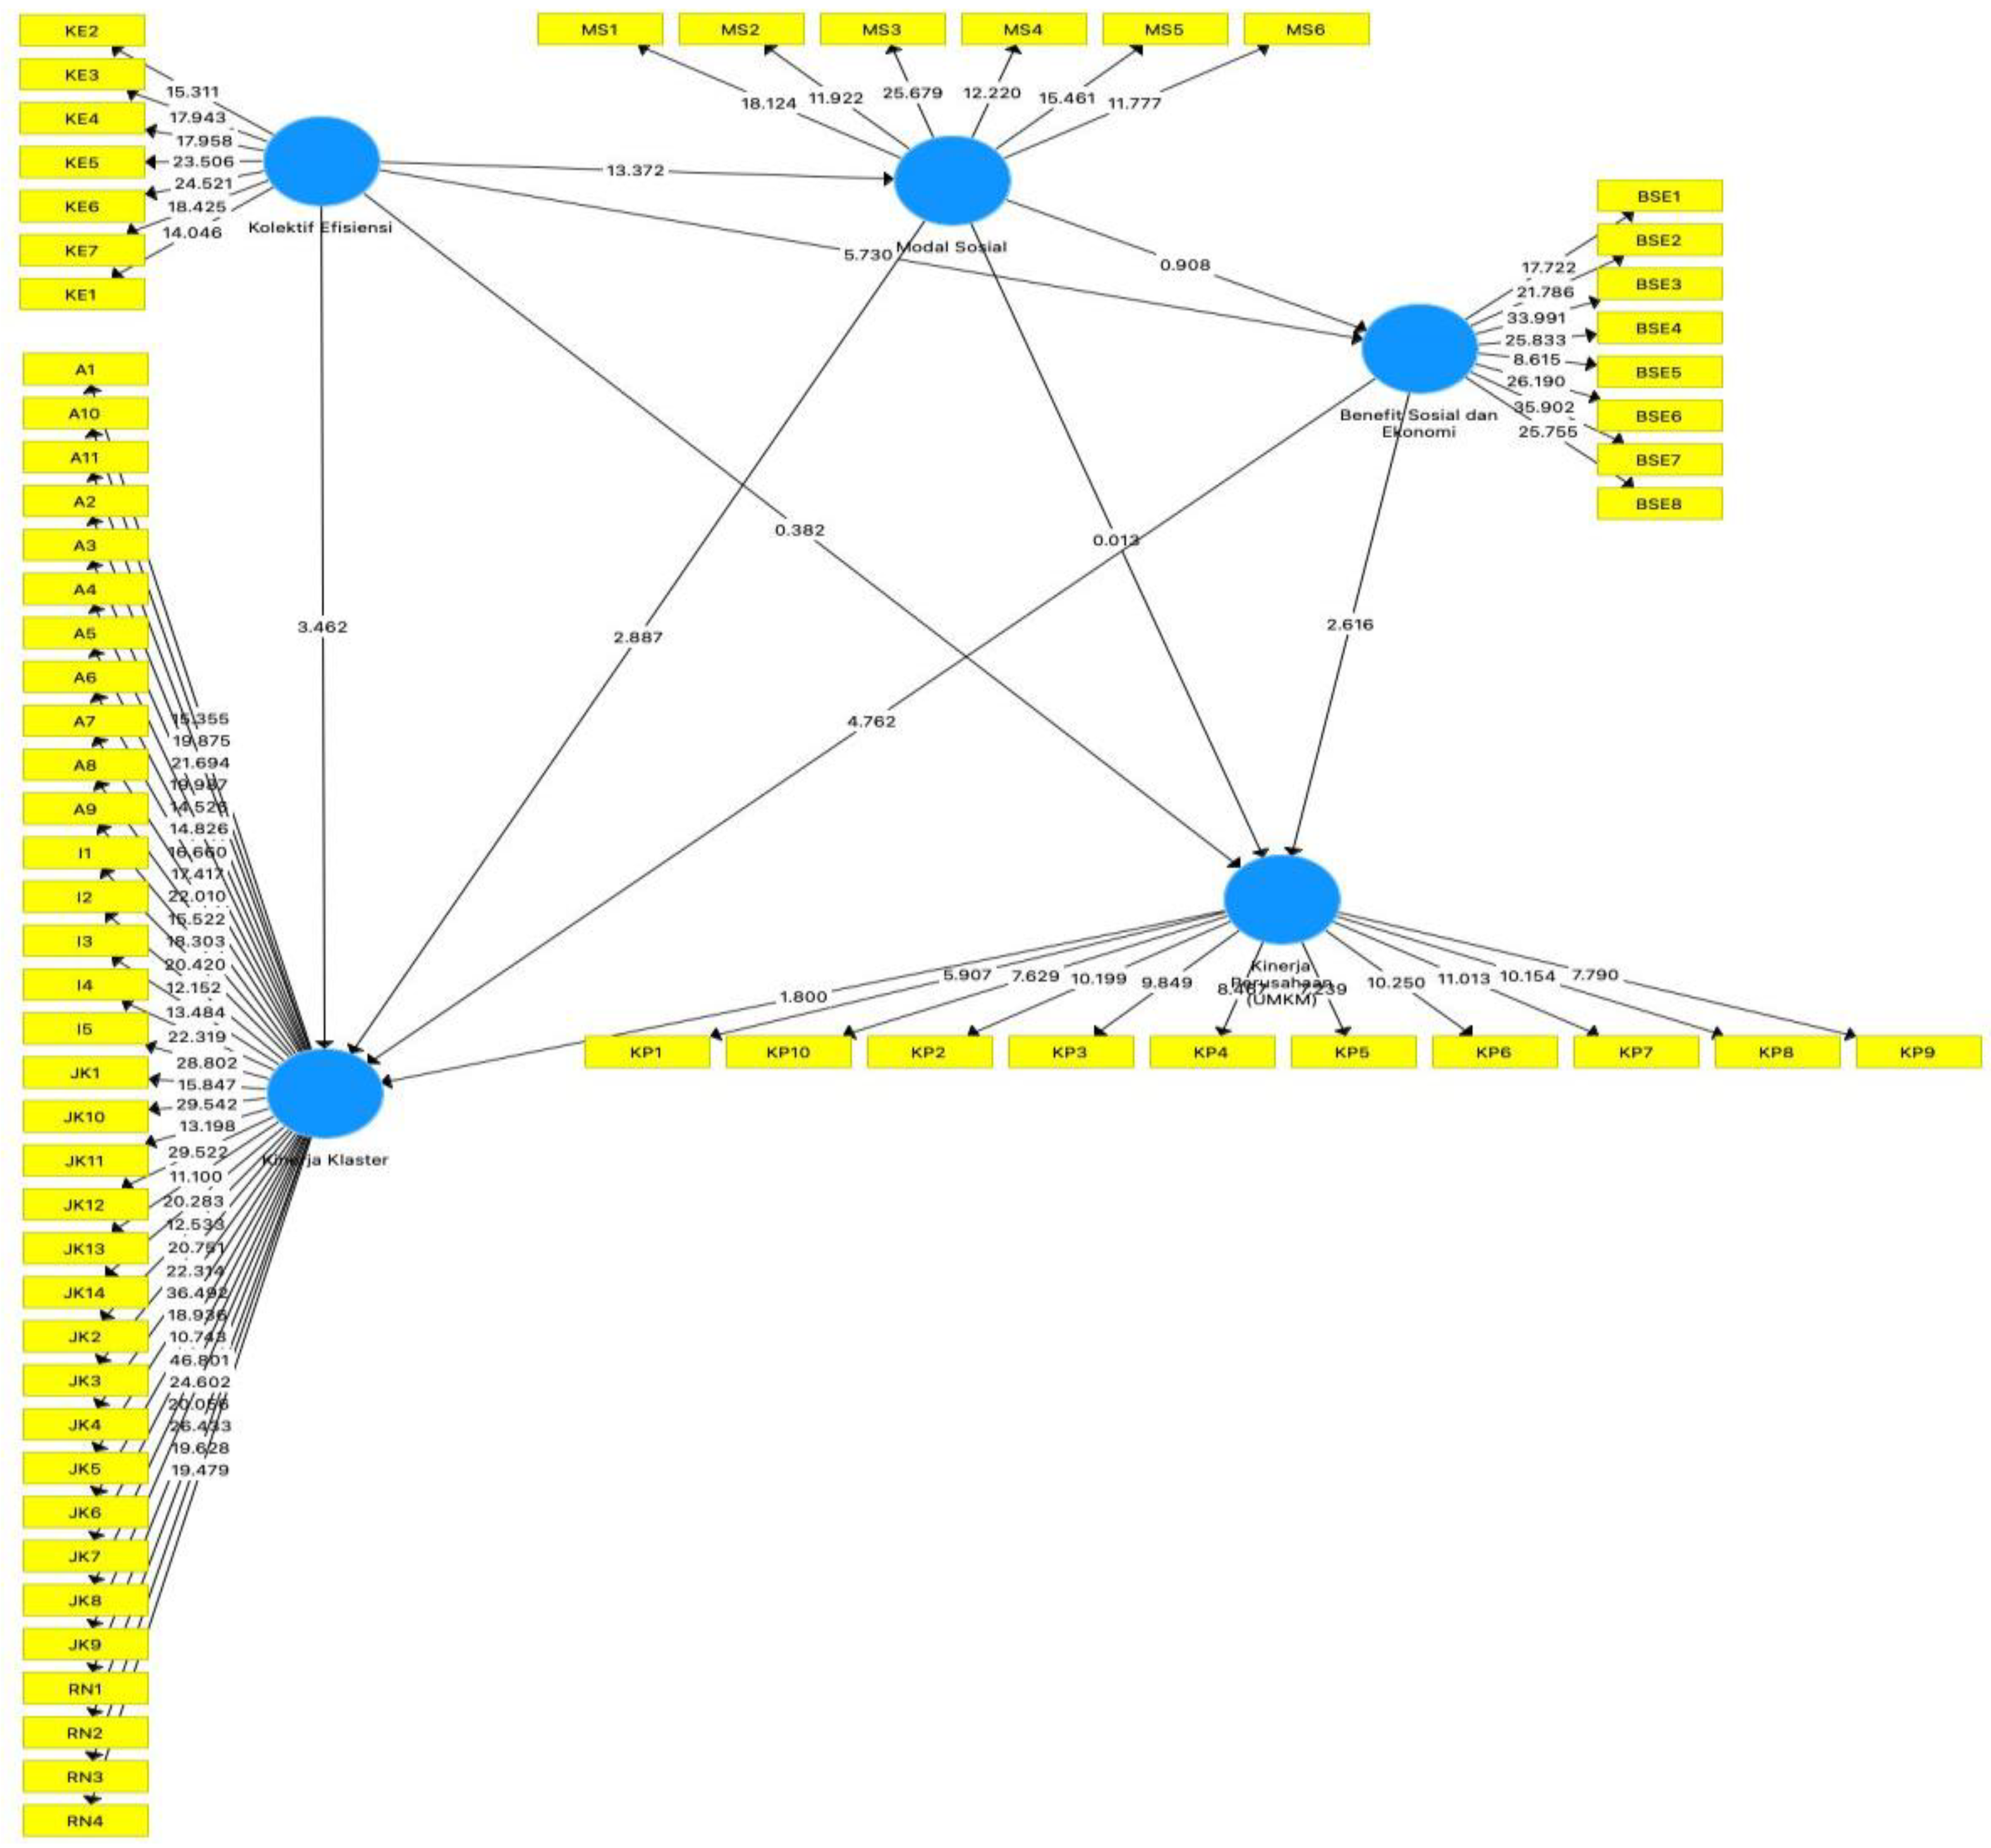
The data analysis method used Structural Equation Modeling (SEM) with SMART PLS 4 software. SEM is a statistical technique capable of analyzing the relationship patterns between latent constructs and their indicators, one latent construct with another, and directly measuring error. SEM allows for direct analysis between multiple dependent and independent variables (Hair et al., 2014) (Purwanto & Sudargini, 2021). SEM is a statistical technique used to build and test statistical models, typically in the form of cause-and-effect models (Weiser, 2020) (Manhas et al., 2012). SEM is a statistical tool used to simultaneously solve multilevel models that cannot be solved by linear regression equations.. The SEM model for this study, shown in Figure 2,as follow:
According to Lubis et al. (2019), the advantages of SEM in research include: (1) the ability to test causal relationships, validity, and reliability simultaneously; (2) the ability to observe the direct and indirect influences between variables; (3) the ability to test multiple dependent variables simultaneously with multiple independent variables; (4) the ability to measure the extent of the influence of indicator variables on corresponding factor variables; and (5) the ability to measure factor variables that cannot be directly measured by indicator variables. This study also used quantitative analysis using Partial Least Squares (PLS). PLS is a powerful analysis method because it does not rely on many assumptions (Purwanto and Sudargini, 2021). The advantages of the PLS method are that the data does not have to be multivariate data with a normal distribution, the sample size does not have to be large, and PLS can be used not only to strengthen the theory but also to explain whether it is true or not (Edeh et al., 2022). The stages of data analysis are as follows:
3.3. Measurement Model Evaluation (Outer Model)
Testing with an external model improves reliability and validity. The tests performed on the outer model are as follows:
3.3.1. Convergent Validity
The convergent validity value indicates the validity of the measurement indicators. Convergent validity can be seen from the loading factor values of endogenous and exogenous variables. The recommended convergent validity value is >0.7 for relatively well-studied models (Musyaffi et al., 2022).
3.3.2. Discriminant Validity
The discriminant validity value is the cross-loading factor value, which aims to identify the differentiating factors within the research construct. The adequacy of structural partitioning is determined by comparing the higher value between the proposed structural stress rating and the stress ratings of other structures. The indicator's ability to explain the measured variable must be higher than its ability to explain other variables.
3.3.3. Reliability
To measure reliability, Cronbach's Alpha and Composite Reliability parameters are used. These values can be used to gauge the actual reliability of the designed structure. The expected CA and CR values are at least 0.7 (Sarstedt et al., 2017), indicating that the available data can be concluded as highly reliable.
3.4. Structural Model Evaluation (Inner Model)
The first step in evaluating a structural model is to examine collinearity between constructs and the model's predictive ability (Sarstedt et al., 2017). This is followed by measuring the model's predictive ability using four criteria: the coefficient of determination (R2), cross-validated redundancy (Q2), effect size (f2), and path coefficients (Sarstedt et al., 2017).
3.4.1. R2 (R Square)
The coefficient of determination (R2) is a method for estimating the extent to which an endogenous construct can be explained by an exogenous construct. The coefficient of determination (R2) is estimated to be between 0 and 1. R2 values of 0.75, 0.50, and 0.25 indicate a strong, moderate, and weak model, respectively (Sarstedt et al., 2017). Chin categorizes R2 values of 0.67, 0.33, and 0.19 as strong, moderate, and weak, respectively (Chin, 2014).
3.4.2. Q2 (Predictive Relevance)
The cross-validated redundancy (Q2) or Q-square test is used to assess predictive relevance. A 2 value > 0 indicates that the model has accurate predictive relevance for a particular construct, while a Q2 value < 0 indicates that the model has poor predictive relevance (Sarstedt et al., 2017).
3.4.3. F2 (Effect Size)
In addition to evaluating whether there is a significant relationship between variables, researchers must also evaluate the effect size or f-square effect size between variables (Wong, 2013). An F2 value of 0.02 indicates a small relationship, 0.15 indicates a medium relationship, and 0.35 indicates a large relationship. Values below 0.02 can be ignored or considered insignificant (Sarstedt et al., 2017).
3.5. Hypothesis Testing
The bootstrapping procedure produces a t-statistic value for each relationship path used to test the hypothesis. The t-statistic value will be compared with the t-table value. Test at a 95% confidence level so that the precision limit or inaccuracy limit (α) = 5% = 0.05, the t-table value is 1.96. If the t-statistic value is smaller than the t-table value (t-statistic < 1.96), then Ho is accepted and Ha is rejected. If the t-statistic value is greater than or equal to the t-table (t-statistic > 1.96), then Ho is rejected and Ha is accepted.
4. Results and Discussion
4.1. Measurement Model Test
The results of the data validity and reliability tests using the SEM PLS algorithm are presented in Table 4.
Based on Table 4, it shows that all variables, namely socio-economic benefits, collective efficiency, social capital, MSME performance and MSME cluster performance, have values above the Cronbach's Alpha value of 0.70, so the question items in the questionnaire are reliable.
The results of the measurement model analysis are presented in Table 5. The table illustrates the relationships between construct variables and their indicators or manifest variables. The discriminant validity results (cross loadings) are also reported.
4.1.1. Discriminant Validity (Cross Loading) Result

Table 6.
Heterotrait-monotrait ratio (HTMT) – Matrix.
| Socioeconomic Benefit | MSMEs Cluster Performance | MSMEs Performance | Efficiency Collective | Social Capital | |
|---|---|---|---|---|---|
| Socioeconomic Benefit | |||||
| MSMEs Cluster Performance | 0,569 | ||||
| MSMEs Performance | 0,194 | 0,129 | |||
| Efficiency Collective | 0,684 | 0,649 | 0,112 | ||
| Social Capital | 0,539 | 0,596 | 0,162 | 0,826 |
Source: Primary data analysis, 2023.
Table 7.
Fornell-Larcker criterion.
| Socioeconomic Benefit | MSMEs Cluster Performance | MSMEs Performance | Efficiency Collective | Social Capital | |
|---|---|---|---|---|---|
| Socioeconomic Benefit | 0,777 | ||||
| MSMEs Cluster Performance | 0,557 | 0,711 | |||
| MSMEs Performance | 0,197 | 0,005 | 0,779 | ||
| Efficiency Collective | 0,636 | 0,615 | 0,105 | 0,764 | |
| Social Capital | 0,487 | 0,547 | 0,083 | 0,705 | 0,726 |
Source : Primary data analysis, 2023.
4.1.2. Hypothesis Test Results
Bootstrap tests were used to test the hypotheses in this study, and the results are presented in Table 8.
Figure 3.
Research Model.
4.2. The Influence of Collective Efficiency on the Performance of Agribusiness MSME Clusters.
The results of the hypothesis test indicate that collective efficiency affect the performance of agribusiness MSME clusters. This is evidenced by the p-value of 0.001, which is below α = 0.05 (α = 0.05), thus the hypothesis is accepted This means that collective efficiency affect the performance of MSME clusters. This finding is consistent with research (Chaminade & Vang, 2008; Dornberger & Utama, 2006; Hadi et al., 2022; Lema & Vang, 2018), which states that collective efficiency in agribusiness MSME clusters is formed through synergy between core, related, and supporting industries, as well as strengthening non-physical location factors such as networks, trust, innovation, and specialization, which collectively improve cluster performance and business actor welfare.
4.3. The Influence of Social Capital on the Performance of Agribusiness MSME Clusters
Based on the results of the bootstrapping test, social capital has a positive and significant effect on the performance of agribusiness MSME clusters. This finding is indicated by a p-value of 0.004, which is below α = 0.05 (α = 0.05), thus the hypothesis is accepted. This means that social capital influences the performance of MSME clusters. These results align with research (Collins & Clark, 2023; Easmon et al., 2019; Ho, 2025; Luo et al., 2004; Tomlinson & Fai, 2013), which states that social capital plays a crucial role in improving the operational efficiency of MSMEs, particularly under conditions of limited resources, which directly impacts the performance of agribusiness MSME clusters.
4.4. The Influence of Socioeconomic Benefits on the Performance of Agribusiness MSME Clusters
Social and economic benefits have a positive and significant effect on the performance of agribusiness MSME clusters, as indicated by a p-value of 0.000, which is below α = 0.05 (α = 0.05); therefore, the hypothesis is accepted. This study's results align with those of Hoetoro (2020), Ramez et al. (2022), Seo et al. (2023), and Tran et al. (2024), who stated that socioeconomic benefits significantly influence the performance and sustainability of MSMEs within business clusters.
4.5. The Influence of MSME Performance on the Performance of Agribusiness MSME Clusters
Bootstrapping results suggest that the performance of MSMEs does not significantly impact the performance of agribusiness MSME clusters. This finding is supported by a p-value of 0.072, which is above α = 0.05 (α = 0.05); therefore, the hypothesis is rejected. The results of this study contradict those of Temouri (2012), Monni et al. (2017), Susanto (2021), and Zhao et al. (2023), who found that MSME performance influences cluster performance. Improved company performance is a key indicator of the success and dynamics of MSME clusters.
4.6. The Effect of Collective Efficiency on Social Capital
The results of the hypothesis test indicate that collective efficiency has a positive and significant effect on social capital, based on a p-value of 0.000, which is below α = 0.05 (α = 0.05); therefore, the hypothesis is accepted. This means that collective efficiency influences social capital. These results align with research (Schmitz, 1999; Nadvi, 2004; Putnam, 2000; Woolcock & Narayan, 2000), which suggests that collective efficiency in MSME clusters fosters stronger interactions, trust, and social networks among business actors, thereby encouraging the formation of more substantial social capital within the cluster.
4.7. The Effect of Collective Efficiency on Socioeconomic Benefits
In this study, collective efficiency has a positive and significant effect on social and economic benefits, as indicated by a p-value of 0.000, which is below α = 0.05 (α = 0.05); therefore, the hypothesis is accepted. This means that collective efficiency has a significant impact on socioeconomic benefits. The results of this study are in line with (Schmitz, 1995; Humphrey & Schmitz, 2002; Becattini, 1990), which states that collective efficiency in MSME clusters provides economic benefits through reduced costs, increased scale, and market expansion, while also producing social benefits in the form of solidarity, togetherness, and social and institutional support for business actors.
4.8. The Influence of Collective Efficiency on MSME Performance
The results of the hypothesis test indicate that collective efficiency has a positive and significant effect on MSME performance. This is supported by a p-value of 0.703, which is above α = 0.05 (α = 0.05), therefore the hypothesis is rejected. This means that collective efficiency not influences to MSME performance. These research findings contradict with those of Porter (1998; Schmitz, 1999; Giuliani et al., 2005), who stated that collective efficiency within clusters improves MSME performance through increased productivity, quality, and competitiveness, supported by collaboration in sharing technology, market information, innovation, and access to shared resources.
4.9. The Influence of Social Capital on Socioeconomic Benefits
Social capital has a positive and significant effect on social and economic benefits, as indicated by a p-value of 0.364, which is above α = 0.05 (α = 0.05). Therefore, the hypothesis is rejected. This means that social capital not influences to socioeconomic benefits. The results of this study contradict with research showing that substantial social capital, characterized by trust, norms of reciprocity, and social networks, increases business efficiency, income opportunities, and social cohesion and collective bargaining power for MSMEs (Putnam, 1993; Coleman, 1988; Woolcock, 2001).
4.10. The Influence of Social Capital on MSME Performance
This study found that social capital did not affect MSME performance, based on a p-value of 0.990, which is above α = 0.05 (α = 0.05), thus rejecting the hypothesis. This finding is inconsistent with research findings (Nahapiet & Ghoshal, 1998; Adler & Kwon, 2002; Susanto, 2021), which state that social capital, as an intangible asset, improves MSME performance through access to information, reduced transaction costs, and trust, as well as encouraging adaptability, innovation, and collaboration within agribusiness clusters.
4.11. The Influence of Socioeconomic Benefits on MSME Performance
Bootstrapping results indicate that socioeconomic benefits have a positive and significant effect on MSME performance. This finding is supported by a p-value of 0.009, which is below α = 0.05 (α = 0.05), thus the hypothesis is accepted. This means that socioeconomic benefits influence MSME performance. These results align with research (Monni et al., 2017; Zhao et al., 2023), which states that social and economic benefits, such as increased income, market access, social support, and business stability, directly contribute to improved MSME performance by strengthening financial capacity and sustaining business relationships. 96
5. Conclusions and Implications
5.1. Conclusions
This study provides a nuanced picture of the performance of agribusiness MSME clusters. The Collective efficiency, social capital and socioeconomic benefits influence MSME cluster performance, meaning they drive agribusiness MSME cluster performance. MSME performance do not influence MSME cluster performance. Social capital can enhance socioeconomic benefits. Collective efficiency can also strengthen social capital. Collective efficiency does not influence MSME cluster performance. MSME performance does not influence MSME cluster performance. Collective efficiency influences social capital, meaning collective efficiency drives social capital. Collective efficiency influences socioeconomic benefits, meaning collective efficiency drives socioeconomic benefits. Collective efficiency influences MSME performance, meaning collective efficiency drives MSME performance. Social capital influences socioeconomic benefits, meaning social capital drives socioeconomic benefits. However, social capital does not influence MSME performance. Socioeconomic benefits influence MSME performance, indicating that socioeconomic benefits have a significant impact on MSME performance.
Strengthening social capital and socioeconomic benefits influences the performance of agribusiness MSME clusters in Central Java Province. This means that enhancing social capital and socioeconomic benefits will further boost the performance of agribusiness MSME clusters. Social capital is strengthened when collective efficiency is also improved. Improved social capital will increase socioeconomic benefits. Improved collective efficiency will lead to increased socioeconomic benefits. Strengthened socioeconomic benefits will enhance the performance of MSME clusters and boost MSMEs' performance.
5.2. Implications
This study found that the performance of agribusiness MSME clusters in Central Java Province can be boosted by strengthening collective efficiency, social capital and socio-economic benefits. Efforts to enhance social capital and socio-economic benefits, such as motivation related to honesty, strong commitment, and intense coordination among cluster members, are essential. Collaboration with stakeholders (government, MSMEs, universities, the private sector, and NGOs) is needed to boost the performance of agribusiness MSME clusters in Central Java Province.
The findings of this study provide a different picture regarding the determinants of agribusiness MSME cluster performance. Performance of agribusiness MSME companies do not necessarily drive the performance of agribusiness MSME clusters. Future research can examine other factors that may improve MSME cluster performance, such as knowledge sharing, innovation performance, and others.
References
- Adi, R. K.; Harisudin, M.; Ferichani, M. Kajian Efektifitas Peran Klaster Pertanian Terpadu di Kabupaten Sukoharjo. In Proceeding Seminar Nasional Peningkatan Kapabilitas UMKM dalam Mewujudkan UMKM Naik Kelas sebenarnya; Irianto, H., Handayanta, E., Setyowati, N., Cahyadin, M., Eds.; UNS Press, 2016; pp. 93–111. [Google Scholar]
- Adler, P. S.; Kwon, S. W. Social capital: Prospects for a new concept. Academy of Management Review 2002, 27, 17–40. [Google Scholar] [CrossRef]
- Ahmad, M.; Wilkins, S. Purposive sampling in qualitative research: a framework for the entire journey. Quality & Quantity 2025, 59, 1461–1479. [Google Scholar] [CrossRef]
- Alamanda, D. T.; Kusmiati, E.; Shiddieq, D. F.; Roji, F. F. MSME clusterization using K-means clustering in Garut Regency, Indonesia. Review of Integrative Business and Economics Research 2023, 12, 199–211. [Google Scholar]
- Apriliyani, A.; Amalia, N. Analisis Hubungan Aspek Keuangan, Teknis dan Produksi, Pasar dan Pemasaran, serta Kebijakan Pemerintah dengan Kinerja Usaha Mikro Kecil dan Menengah (Studi pada UMKM Klaster Keramik di Desa Melikan, Kecamatan Wedi, Kabupaten Klaten. 2019. Available online: http://etd.repository.ugm.ac.id/.
- Bappeda dan Litbang Kabupaten Wonogiri. Laporan Perkembangan Klaster UMKM Kabupaten Wonogiri Tahun 2022. 2022. [Google Scholar]
- Becattini, G. The Marshallian industrial district as a socio-economic notion. In Industrial districts and inter-firm co-operation in Italy; Pyke, F., Becattini, G., Sengenberger, W., Eds.; International Labour Organization, 1990; pp. 37–51. [Google Scholar]
- Bisht, H. S.; Singh, D. Challenges faced by micro, small, and medium enterprises: a systematic review. World Review of Science, Technology and Sustainable Development 2020, 16, 205–220. [Google Scholar] [CrossRef]
- Cainelli, G.; Iacobucci, D. Agglomeration, related variety, and firm performance. Journal of Economic Geography 2012, 12, 307–334. [Google Scholar] [CrossRef]
- Campbell, S.; Greenwood, M.; Prior, S.; Shearer, T.; Walkem, K.; Young, S.; Bywaters, D.; Walker, K. Purposive sampling: complex or simple? Research case examples. Journal of Research in Nursing 2020, 25, 652–661. [Google Scholar] [CrossRef]
- Carpinetti, C. R.; Luiz; Galdámez, C.; EdwinVladimir; Cecilio Gerolamo, M. A measurement system for managing performance of industrial clusters. International Journal of Productivity and Performance Management 2008, 57, 405–419. [Google Scholar] [CrossRef]
- Carpinetti, L. C. R.; Oiko, O. T. Development and application of a benchmarking information system in clusters of SMEs. Benchmarking: An International Journal 2008, 15, 292–306. [Google Scholar] [CrossRef]
- Chaminade, C.; Vang, J. Globalisation of knowledge production and regional innovation policy: Supporting specialized hubs in the Bangalore software industry. Research policy 2008, 37, 1684–1696. [Google Scholar] [CrossRef]
- Chin, W. W. Partial least squares is to LISREL as principal components analysis is to standard factor analysis; 2014. [Google Scholar]
- Cohen, D.; Prusak, L. Good Company: How Social Capital Makes Organizations Work; Havard Business School Press, 2021. [Google Scholar]
- Coleman, J. S. Social capital in the creation of human capital. American Journal of Sociology 1988, 94, S95–S120. [Google Scholar] [CrossRef]
- Collins, C. J.; Clark, K. D. Strategic human resource practices, top management team social networks, and firm performance: The role of human resource practices in creating organizational competitive advantage. Academy of management Journal 2003, 46, 740–751. [Google Scholar]
- Delgado, M.; Porter, M. E.; Stern, S. Clusters, convergence, and economic performance. Research Policy 2014, 43, 1785–1799. [Google Scholar] [CrossRef]
- Delgado, M.; Porter, M. E.; Stern, S. Defining clusters of related industries. Journal of Economic Geography 2016, 16, 1–38. [Google Scholar] [CrossRef]
- Dharmadjaya, J. E.; Purnama, J.; Permana, T. Pasporumkm Online Platform Development For Self-Guided Halal Assurance System Preparation On The Case Of Smes In The Food Sector. Proceedings Of The 2022 International Conference On Engineering And Information Technology For Sustainable Industry, 2022, September; pp. Pp. 1–5. [Google Scholar]
- Dornberger, U.; Utama, I. B. Collective Efficiency and Enterprise Performance in Different Stages of the Cluster Life Cycle. Presentation in The Cluster Conference, Lyon, 2006. [Google Scholar]
- Easmon, R. B.; Kastner, A. N. A.; Blankson, C.; Mahmoud, M. A. Social capital and export performance of SMEs in Ghana: the role of firm capabilities. African Journal of Economic and Management Studies 2019, 10, 262–285. [Google Scholar] [CrossRef]
- Edeh, E.; Lo, W.-J.; Khojasteh, J. Review of Partial Least Squares Structural Equation Modeling (PLS-SEM) Using R: A Workbook. In Structural Equation Modeling: A Multidisciplinary Journal; 2022. [Google Scholar] [CrossRef]
- Faisol; Aliami, S.; Anas, M. Pathway of building SMEs performance in cluster through innovation capability. Economic Development Analysis Journal 2022, 11, 140–152. [Google Scholar] [CrossRef]
- Feser, E. J.; Bergman, E. M. National industry cluster templates: A framework for applied regional cluster analysis. Regional Studies 2010, 44, 1–19. [Google Scholar] [CrossRef]
- Feser, E. J.; Sweeney, S. H. A Test for the Coincident Economic and Spatial Clustering of Business Enterprises. Journal of Geographical Systems 2000, 2, 349–373. [Google Scholar] [CrossRef]
- Gerke, A. SME upgrading in emerging market clusters: The case of Taiwan’s bicycle industry. Journal of Business Research 2023, 164, 113967. [Google Scholar] [CrossRef]
- Giuliani, E. Network dynamics in regional clusters. Journal of Economic Geography 2013, 13, 1–28. [Google Scholar] [CrossRef]
- Giuliani, E.; Pietrobelli, C.; Rabellotti, R. Upgrading in global value chains: Lessons from Latin American clusters. World Development 2005, 33, 549–573. [Google Scholar] [CrossRef]
- Guimarães, L. G. d. A.; Blanchet, P.; Cimon, Y. Collaboration among small and medium-sized enterprises as part of internationalization. Administrative Sciences 2021, 11, 153. [Google Scholar] [CrossRef]
- Gupta, A.; Kumar Singh, R. Managing resilience of micro, small and medium enterprises (MSMEs) during COVID-19: analysis of barriers. Benchmarking: An International Journal 2023, 30, 2062–2084. [Google Scholar] [CrossRef]
- Hadi, D. P.; Widodo, S.; Purnamasari, I.; Handayani, P. M. MSME Cluster Development Strategy Become a Leading Product Tegalrejo Jatijajar Village, Bergas District, Semarang Regency Based on Collaborative. KnE Social Sciences 2022, 313–325. [Google Scholar] [CrossRef]
- Hair, J. F.; Sarstedt, M.; Hopkins, L.; Kuppelwieser, V. G. Partial least squares structural equation modeling (PLS-SEM): An emerging tool in business research. European Business Review 2014, 26, 106–121. [Google Scholar] [CrossRef]
- Hidayat, A. Menyusun Instrumen Penelitian & Uji Validitas-Reabilitas, 1st ed.; Health Books Publishing, 2021. [Google Scholar]
- Ho, D. D. The Role of Social Capital and Shared Leadership in the Digital Transformation and Firm Performance. SAGE Open 2025, 15, 21582440251347340. [Google Scholar] [CrossRef]
- Hoetoro, A. The dynamics of performance improvement among SMEs clusters in East Java. In Proceedings of the 23rd Asian Forum of Business Education (AFBE 2019), 2020; Atlantis Press; pp. 291–296. [Google Scholar] [CrossRef]
- Humphrey, J.; Schmitz, H. How does insertion in global value chains affect upgrading in industrial clusters? Regional Studies 2002, 36, 1017–1027. [Google Scholar] [CrossRef]
- Indreswari, R.; Wijianto, A.; Yunindanova, M. B.; Apriyanto, D.; Agustina, A.; Adi, R. K. Model Pengembangan Agribisnis Pertanian Terpadu dengan Pendekatan Klaster Pertanian Terpadu di Kabupaten Sukoharjo, Jawa Tengah, Indonesia. Agro Bali: Agricultural Journal 2021, 5, 10–19. [Google Scholar] [CrossRef]
- Khomah, I.; Setyowati, N.; Harisudin, M.; Adi, R. K.; Qonita, A. The factors contributing to the sustainability of agribusiness MSMEs in Sukoharjo Regency during the Covid-19 pandemic. IOP Conference Series: Earth and Environmental Science, 2021, April; IOP Publishing; Vol. 746, p. 012013. [Google Scholar]
- Kim, N.; Shim, C. Social capital, knowledge sharing and innovation of small- and medium-sized enterprises in a tourism cluster. International Journal of Contemporary Hospitality Management 2018, 30, 2417–2437. [Google Scholar] [CrossRef]
- Kumari, B.; Dhingra, A. Role of Agribusiness Management in Food Industry. In Agribusiness Management; Routledge, 2024; pp. 127–137. [Google Scholar]
- Lema, R.; Vang, J. Collective efficiency: a prerequisite for cluster development? World review of entrepreneurship, management and Sustainable Development 2018, 14, 348–376. [Google Scholar] [CrossRef]
- Lis, A. M.; Rozkwitalska, M.; Lis, A. Sustainability objectives and collaboration lifecycle in cluster organizations. Quality & Quantity 2023, 57, 4049–4068. [Google Scholar] [CrossRef]
- Lubis, F. S.; Rahima, A. P.; Isnaini, M.; Umam, H.; Industri, J. T.; Sains, F.; Sultan, U. I. N.; Kasim, S.; Hr, J.; No, S.; Baru, S. Analisis Kepuasan Pelanggan dengan Metode Servqual dan Pendekatan Structural Equation Modelling ( SEM ) pada Perusahaan Jasa Pengiriman Barang di Wilayah Kota Pekanbaru. Jurnal Sains Dan Teknologi Industri 2019, 16, 25–31. [Google Scholar] [CrossRef]
- Luo, X.; Griffith, D. A.; Liu, S. S.; Shi, Y. Z. The effects of customer relationships and social capital on firm performance: A Chinese business illustration. Journal of International Marketing 2004, 12, 25–45. [Google Scholar] [CrossRef]
- Manhas, P. S.; Manrai, A. K.; Manrai, L. A.; Ramjit. Role of Structural Wquation Modelling in Theory Testing and Development. Quantitative Modelling in Marketing and Management 2012, 27–42. [Google Scholar] [CrossRef]
- Martin, R.; Sunley, P. Conceptualizing cluster evolution: Beyond the life cycle model? Regional Studies 2011, 45, 1299–1318. [Google Scholar] [CrossRef]
- Memon, M. A.; Thurasamy, R.; Ting, H.; Cheah, J. H. Purposive Sampling: a Review and Guidelines for Quantitative Research. Journal of Applied Structural Equation Modeling 2025, 9, 1–23. [Google Scholar] [CrossRef] [PubMed]
- Monni, S.; Palumbo, F.; Tvaronavičienė, M. Cluster performance: an attempt to evaluate the Lithuanian case. 2017. [Google Scholar] [CrossRef]
- Monni, S.; Palumbo, F.; Tvaronavičienė, M. Cluster performance: A literature review. Journal of Business Economics and Management 2017, 18, 281–297. [Google Scholar] [CrossRef]
- Musyaffi, A.; Khairunnisa, H.; Respati, D. Konsep Dasar Structural Equation Model-Partial Least Square (SEM-PLS) Menggunakan SMART PLS; Pascal Books, 2022. [Google Scholar]
- Nahapiet, J.; Ghoshal, S. Social capital, intellectual capital, and the organizational advantage. Academy of Management Review 1998, 23, 242–266. [Google Scholar] [CrossRef]
- Parto, S. Innovation and economic activity: an institutional analysis of the role of clusters in industrializing economies. Journal of economic issues 2008, 42, 1005–1030. [Google Scholar] [CrossRef]
- Porter, M. E. Clusters and the new economics of competition. Harvard Business Review 1998, 76, 77–90. [Google Scholar]
- Purnomo, R. A.; Sarungu, J. J.; Samudro, B. R.; Mulyaningsih, T. The dynamics of technology adoption readiness of micro, small, and medium enterprises and affecting characteristics: the experience from Indonesia. REVIEW OF INTERNATIONAL GEOGRAPHICAL EDUCATION 2021, 11, 834–854. [Google Scholar]
- Purwanto, A.; Sudargini, Y. Partial Least Squares Structural Squation Modeling (PLS-SEM) Analysis for Social and Management Research: A Literature Review. Journal of Industrial Engineering & Management Research 2021, 2, 114–123. [Google Scholar]
- Putnam, R. D. Making democracy work: Civic traditions in modern Italy; Princeton University Press, 1993. [Google Scholar]
- Putnam, R. D. Bowling alone: The collapse and revival of American community; Simon & Schuster, 2000. [Google Scholar]
- Rachmawati, R.; Widowati, W. Analisis Pendanaan Usaha Dan Kinerja Usaha UMKM Batik Pekalongan. Prosiding Pendidikan Teknik Boga … 2021, 16, 6. Available online: https://journal.uny.ac.id/index.php/ptbb/article/view/44546.
- Ramez, A. A. M.; Ateik, A. H. A. M.; Raymond, S. A. Clusteriing Activities on The Performance of Small and Medium Scales Enterprises in Nigeria. Arabian Journal of Business and Management Review (Kuwait Chapter) 2022, 11, 159–166. [Google Scholar]
- Rocha, H.; Kunc, M.; Audretsch, D. B. Clusters, economic performance, and social cohesion: a system dynamics approach. Regional Studies 2020, 54, 1098–1111. [Google Scholar] [CrossRef]
- Royo-Vela, M.; Amezquita Salazar, J. C.; Puig Blanco, F. Market orientation in service clusters and its effect on the marketing performance of SMEs. European Journal of Management and Business Economics 2022, 31, 1–21. [Google Scholar] [CrossRef]
- Sarstedt, M.; Ringle, C. M.; Hair, J. F. Partial Least Squares Structural Equation Modeling; 2017. [Google Scholar] [CrossRef]
- Schmitz, H. Collective efficiency: Growth path for small-scale industry. Journal of Development Studies 1995, 31, 529–566. [Google Scholar] [CrossRef]
- Schmitz, H. Collective efficiency: Growth path for small-scale industry. The Journal of Development Studies 1995, 31, 529–566. [Google Scholar] [CrossRef]
- Schmitz, H. Collective efficiency and increasing returns. Cambridge Journal of Economics 1999, 23, 465–483. [Google Scholar] [CrossRef]
- Seo, J.; Lee, J.; Jung, S.; Park, S. The role of creating shared value and entrepreneurial orientation in generating social and economic benefits: Evidence from Korean SMEs. Sustainability 2023, 15, 6168. [Google Scholar] [CrossRef]
- Srinvasan, R.; Lohith, C. P.; Kadadevaramth, R. S.; Shrisha, S. Strategic Marketing and Innovation Performance of Indian MSMEs. 2015 Portland International Conference on Management of Engineering and Technology (PICMET), 2015, August; IEEE; pp. 127–133. [Google Scholar]
- Sugiyono. Metode Penelitian Kuantitatif; Alfabeta, 2013. [Google Scholar]
- Susanto, A. Modal sosial dan kinerja UMKM dalam klaster industri. Jurnal Ekonomi dan Bisnis Indonesia 2021, 36, 123–137. [Google Scholar]
- Susanto, D. A. Sme Inter-Clustering Linkage of East Java: Among Business Strategy and Cooperatives. Journal of Developing Economies 2021, 6, 174–185. [Google Scholar] [CrossRef]
- Temouri, Y. The cluster scoreboard: measuring the performance of local business clusters in the knowledge economy. 2012. [Google Scholar]
- Tomlinson, P. R.; Fai, F. M. The nature of SME co-operation and innovation: A multi-scalar and multi-dimensional analysis. International Journal of Production Economics 2013, 141, 316–326. [Google Scholar] [CrossRef]
- Tongco, M. D. C. Purposive Sampling as a Tool for Informant Selection. Ethnobotany Research & Applications 2007, 5, 147–158. [Google Scholar]
- Tran, N. G.; Trung, N. T.; Long, N. T.; Dat, N. H. A. Social capital and entrepreneurial performance of SMEs: the mediating role of access to entrepreneurial resources. In Management Systems in Production Engineering; 2024. [Google Scholar]
- Tsang, K. K.; Liu, D.; Hong, Y. Challenges and Opportunities in Qualitative Research. In Challenges and Opportunities in Qualitative Research: Sharing Young Scholars’ Experiences; Tsang, K. K., Liu, D., Hong, Y., Eds.; Springer Singapore, 2019. [Google Scholar] [CrossRef]
- Weiser, E. B. Structural Equation Modeling in Personality Research. In The Wiley Encyclopedia of Personality and Individual Differences Vol. II; Wiley, 2020; pp. 137–142. [Google Scholar] [CrossRef]
- Wong, K. Partial Least Squares Structural Equation Modeling (PLS-SEM) Techniques Using SmartPLS. Marketing Bulletin 2013, 24, 1–32. [Google Scholar]
- Woolcock, M. The place of social capital in understanding social and economic outcomes. Canadian Journal of Policy Research 2001, 2, 11–17. [Google Scholar]
- Woolcock, M.; Narayan, D. Social capital: Implications for development theory, research, and policy. World Bank Research Observer 2000, 15, 225–249. [Google Scholar] [CrossRef]
- Wudu, A.; Singh, K.; Kassahun, S. Industry clusters and firm performance: Evidence from the leather product industry in Addis Ababa. Heliyon 2024, 10. [Google Scholar] [CrossRef]
- Wulandari, C.; Agustono; Adi, R. K. Analisis Faktor-Faktor yang Mempengaruhi Kinerja UMKM pada Klaster UMKM Agribisnis di Kabupaten Purbalingga. Agrista 2023, 11, 23–33. [Google Scholar]
- Yunus, M.; Sari, I. A.; Wahyuhastuti, N. Strategi Pengembangan UMKM di Provinsi Jawa Scorecard. Kajian Ekonomi & Keuangan 2021, 5, 2018–2228. [Google Scholar] [CrossRef]
- Yusup, F. Uji Validitas dan Reliabilitas Instrumen Penelitian Kuantitatif. Jurnal Tarbiyah: Jurnal Ilmiah Kependidikan 2018, 7, 17–23. [Google Scholar] [CrossRef]
- Zhao, L.; Liang, Y.; Tu, H. How do clusters drive firm performance in the regional innovation system? A causal complexity analysis in Chinese strategic emerging industries. Systems 2023, 11, 229. [Google Scholar] [CrossRef]
- Zhao, S.; Zhang, W.; Li, X. Social and economic benefits and firm performance in SME clusters. Small Business Economics 2023, 60, 987–1005. [Google Scholar] [CrossRef]
- Zizka, M.; Stichhauerova, E. Effect of cluster initiatives and natural clusters on business performance. Competitiveness Review: An International Business Journal 2023, 33, 1118–1144. [Google Scholar] [CrossRef]
Figure 1.
Conceptual Model of Cluster Performance Measurement (Carpinetti et al., 2008).
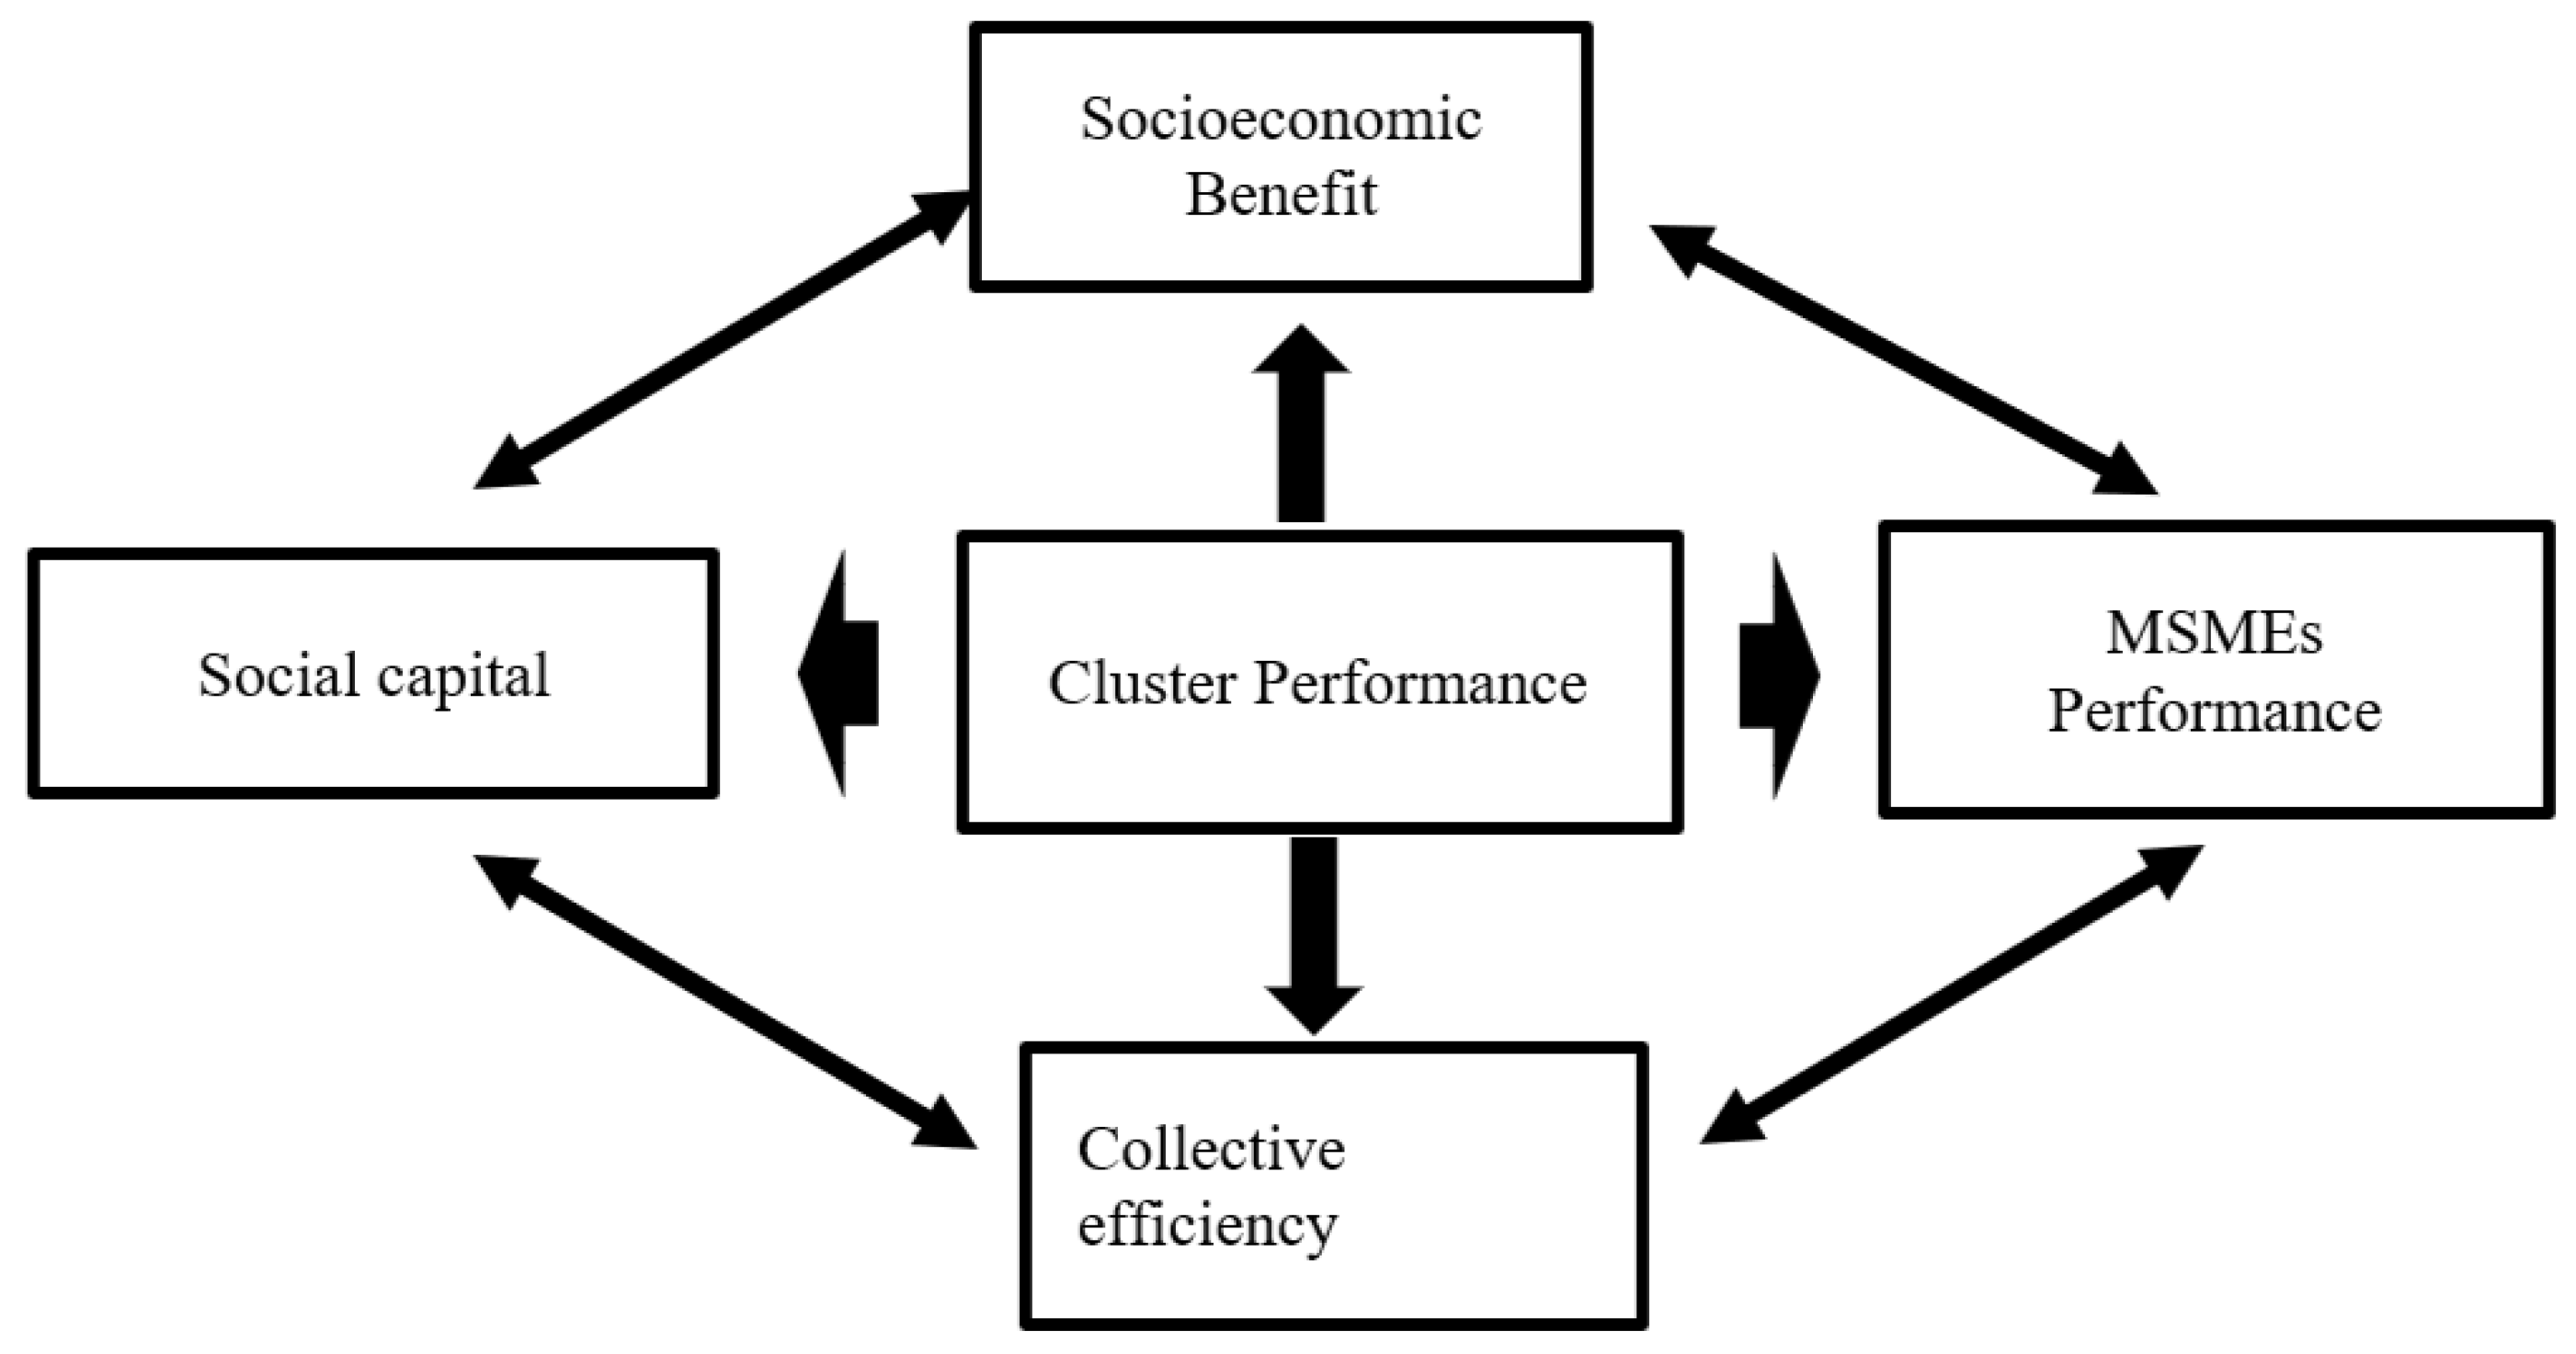
Figure 2.
Proposed Research Model.
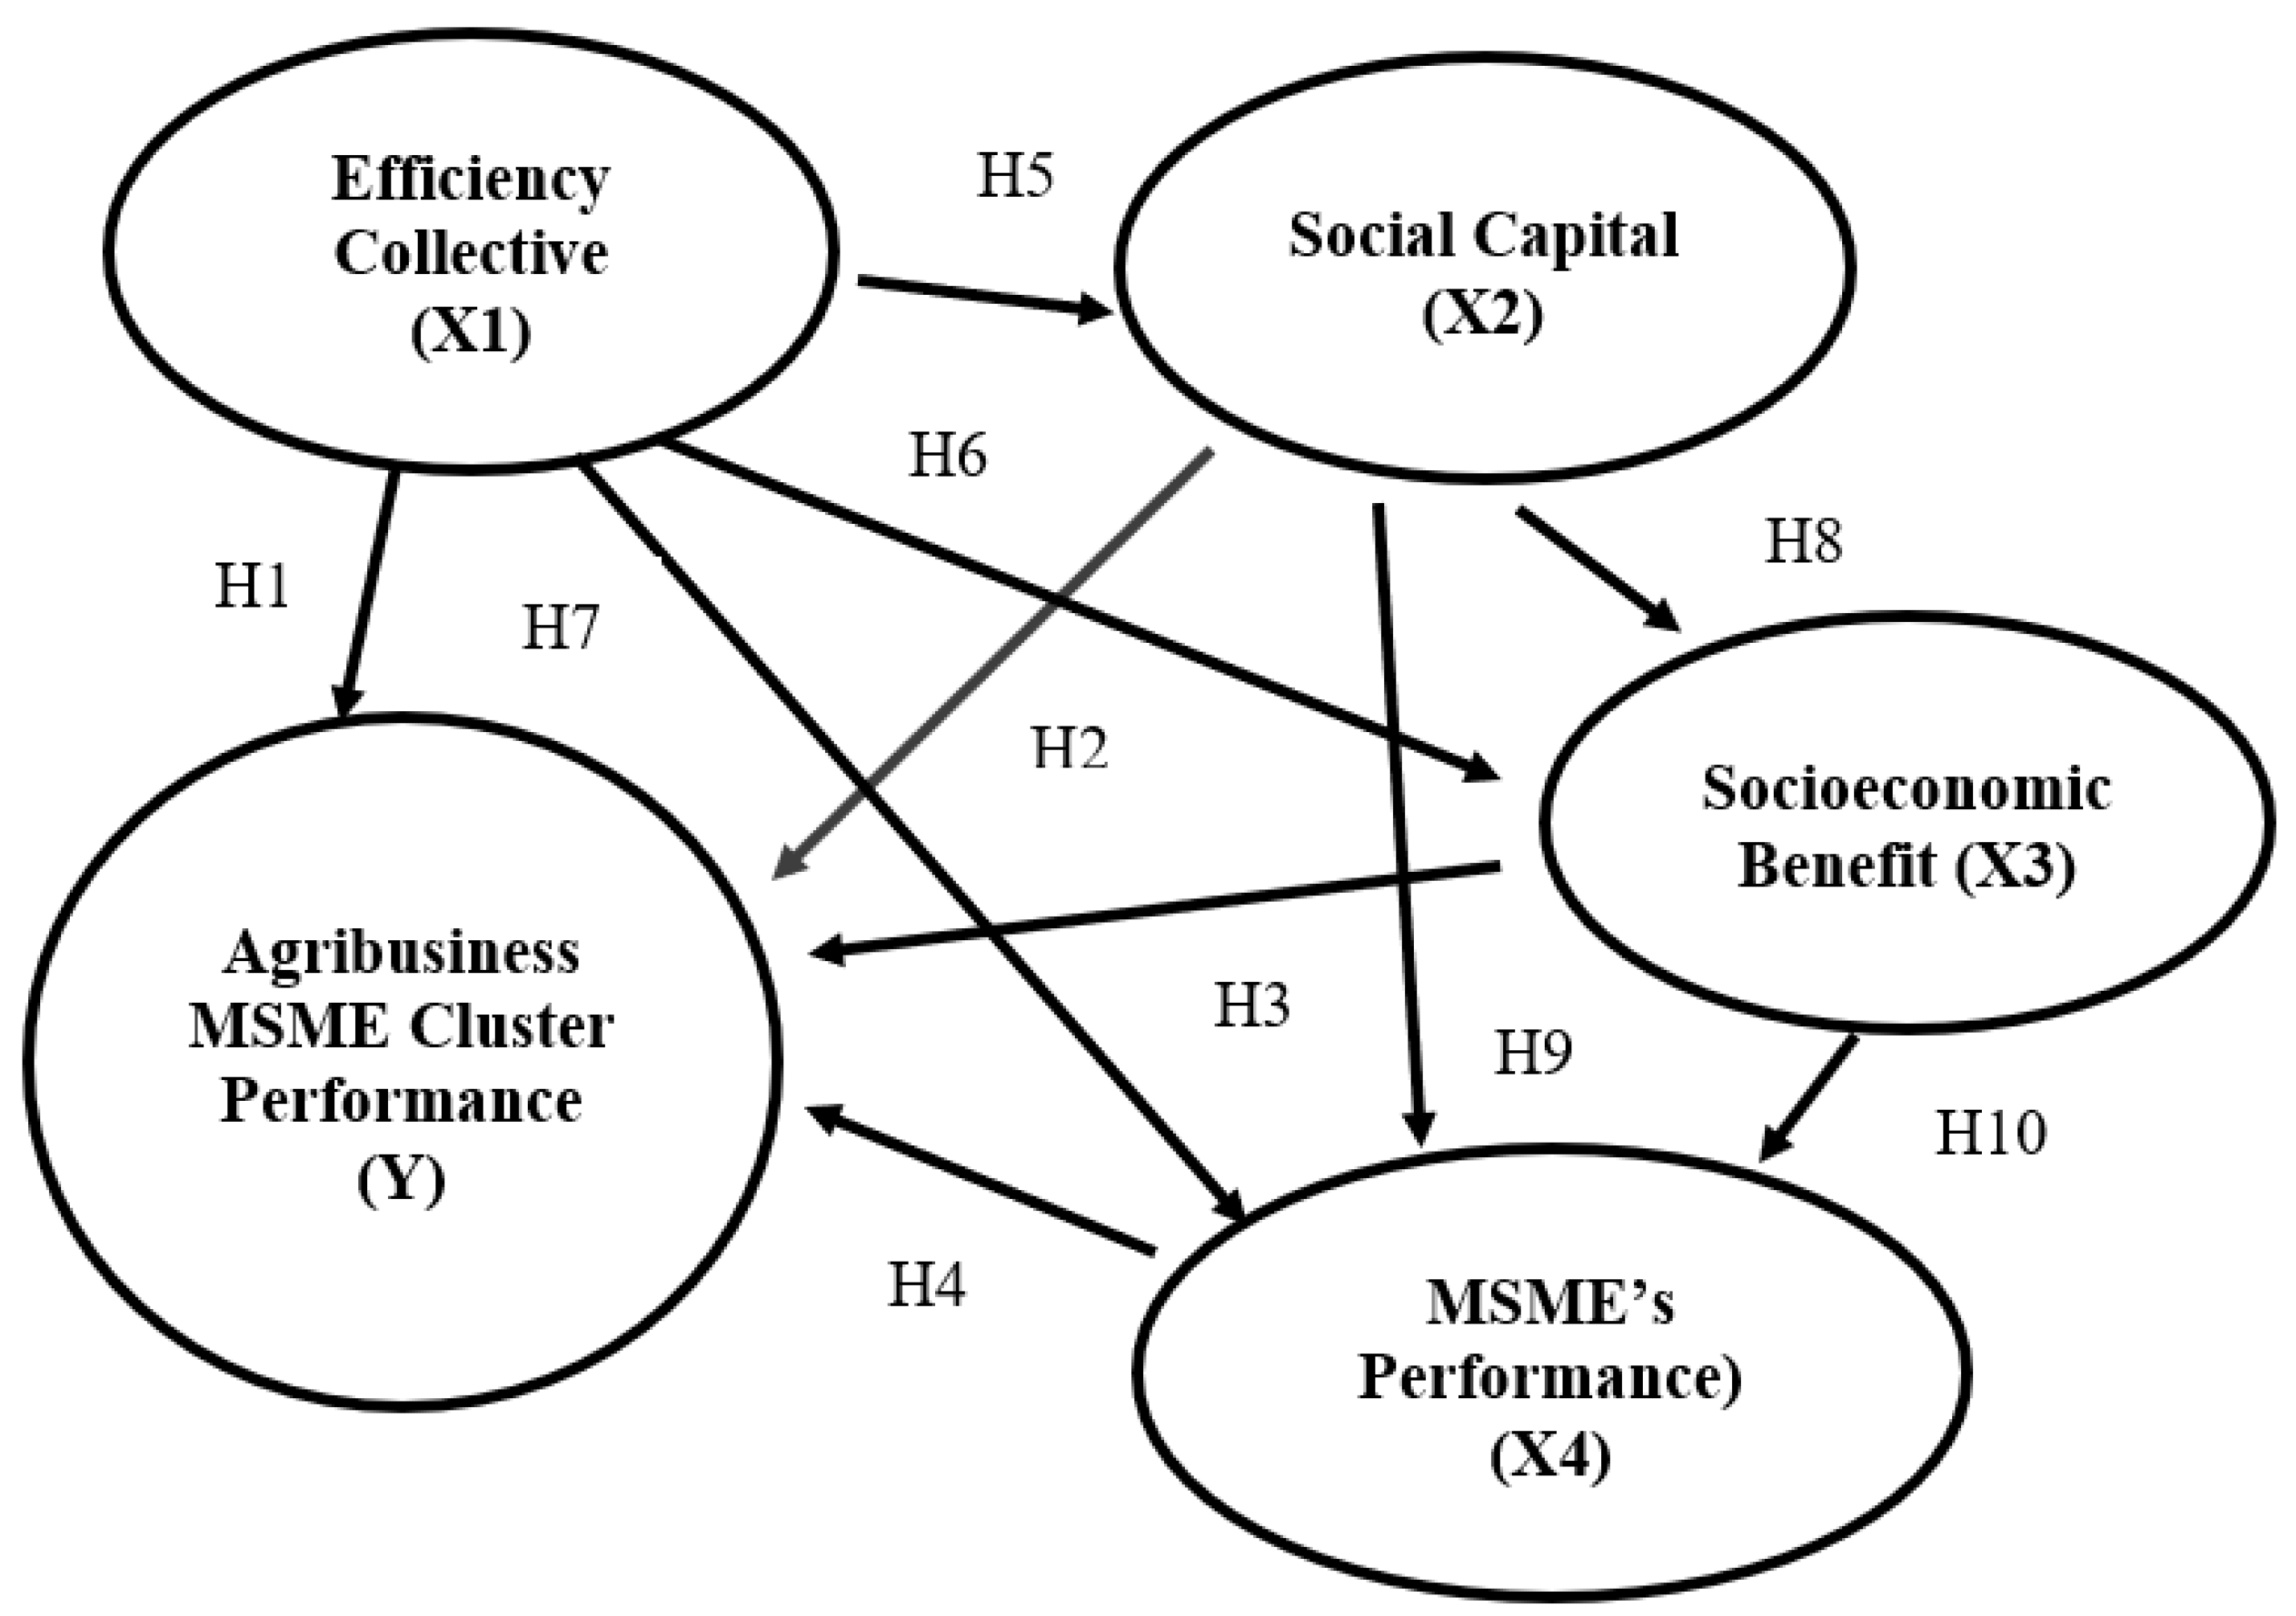
Table 1.
MSME data in Central Java Province 2017 – 2022.
| No | Description | Unit | Year | |||||
|---|---|---|---|---|---|---|---|---|
| 2017 | 2018 | 2019 | 2020 | 2021 | 2022 | |||
| 1 | Number of MSME | unit | 133.679 | 143.738 | 161.458 | 167.391 | 173.431 | 177.256 |
| Non Agriculture | unit | 45.963 | 49.328 | 55.275 | 57.527 | 60.449 | 63.311 | |
| Agriculture | unit | 22.329 | 23.956 | 26.833 | 27.653 | 28.284 | 28.357 | |
| Trading | unit | 49.198 | 53.063 | 59.836 | 62.083 | 63.965 | 64.707 | |
| Services | unit | 16.189 | 17.391 | 19.514 | 20.128 | 20.733 | 20.881 | |
| 2 | Labor | orang | 918.455 | 1.043.320 | 1.312.400 | 1.298.007 | 1.311.015 | 1.320.953 |
| 3 | Asset | Rp. Milyar | 26.249 | 29.824 | 38.158 | 38.353 | 38.521 | 38.719 |
| 4 | Omzet | Rp. Milyar | 49.247 | 55.691 | 67.550 | 67.087 | 68.242 | 68.387 |
Source: Central Java Province Cooperatives and SMEs Service (2022).
Table 2.
Variables and Indicators.
| No | Variable | Indicator | Reference |
|---|---|---|---|
| 1 | Agribusiness MSME Cluster Performance | Land access Water, electricity, and communication accessibility Research and development accessibility Transportation accessibility Downstreaming achievement Number of MSMEs Number of processing industries Number of supporting material suppliers Number of raw material suppliers Existence of associations Existence of related service industries Existence of educational institutions Existence of financing institutions Cluster cooperation Cooperation between processing industries Industry association cooperation Cooperation with related service industries Cooperation with educational institutions Cooperation with training institutions Cooperation with financing institutions Cooperation with research institutions Marketing cooperation Cooperation with supporting raw material suppliers Cooperation with primary raw material suppliers Availability of technological equipment Leading clusters Product quality Technology utilization Role of working groups in clusters Role of government in clusters Role of government in clusters The role of the private sector in clusters |
Model Carpinetti, Feser Approach |
| 2 | Social Capital | Cluster Activities Honesty Completeness of Technology Components Commitment Coordination Public perception |
(Carpinetti, 2008) Handayani et al (2016) (Cohen dan Prusak, 2001) |
| 3 | Socioeconomic Benefit | Brand Image Product Quality Workforce Training Services Industrial Waste Management Labor Absorption Workforce Rewards Working atmosphere |
|
| 4 | Collective Efficiency | Existence of research institutions Local government policies Efficiency collaboration Geographical location |
(Carpinetti, 2008) Handayani et al (2016) (Schmitz, 1995) |
|
Establishing good relationships with suppliers Cluster growth and development |
|||
| 5 | MSME’s Performance | Resource Utilization Product Development Competition Profit Growth Capital Growth Market Growth Labor Force Growth Sales Growth Facilities and Infrastructure Tingkat komplain |
(Carpinetti, 2008) Handayani et al (2016) |
Table 3.
Research Location and Sample.
| Location | Number of Sample |
|---|---|
| Pekalongan Regency | 40 |
| Pati Regency | 42 |
| Magelang City | 32 |
| Purbalingga Regency | 39 |
| Rembang Regency | 32 |
| Demak Regency | 36 |
| Sukoharjo Regency | 30 |
| Total | 251 |
Table 4.
AVE, CR and CA.
| Cronbach's Alpha | Composite Reliability | AVE | |
|---|---|---|---|
| Socioeconomic Benefit | 0,906 | 0,924 | 0,604 |
| MSMEs Cluster Performance | 0,970 | 0,972 | 0,505 |
| MSMEs Performance | 0,928 | 0,938 | 0,607 |
| Efficiency Collective | 0,880 | 0,907 | 0,583 |
| Social Capital | 0,818 | 0,869 | 0,527 |
Source: Primary data Analysis (2023).
Table 5.
Outer loadings.
| Socioeconomic Benefit | MSMEs Cluster Performance | MSMEs Performance | Efficiency Collective | Social Capital | |
|---|---|---|---|---|---|
| A1 | 0,662 | ||||
| A10 | 0,711 | ||||
| A11 | 0,697 | ||||
| A2 | 0,656 | ||||
| A3 | 0,637 | ||||
| A4 | 0,618 | ||||
| A5 | 0,692 | ||||
| A6 | 0,693 | ||||
| A7 | 0,707 | ||||
| A8 | 0,666 | ||||
| A9 | 0,693 | ||||
| BSE1 | 0,744 | ||||
| BSE2 | 0,779 | ||||
| BSE3 | 0,808 | ||||
| BSE4 | 0,803 | ||||
| BSE5 | 0,616 | ||||
| BSE6 | 0,776 | ||||
| BSE7 | 0,842 | ||||
| BSE8 | 0,829 | ||||
| I1 | 0,776 | ||||
| I2 | 0,609 | ||||
| I3 | 0,682 | ||||
| I4 | 0,755 | ||||
| I5 | 0,775 | ||||
| JK1 | 0,729 | ||||
| JK10 | 0,782 | ||||
| JK11 | 0,705 | ||||
| JK12 | 0,810 | ||||
| JK13 | 0,600 | ||||
| JK14 | 0,732 | ||||
| JK1 | 0,626 | ||||
| JK3 | 0,719 | ||||
| JK4 | 0,685 | ||||
| JK5 | 0,780 | ||||
| JK6 | 0,744 | ||||
| JK7 | 0,609 | ||||
| JK8 | 0,836 | ||||
| JK9 | 0,765 | ||||
| KE2 | 0,671 | ||||
| KE3 | 0,762 | ||||
| KE4 | 0,721 | ||||
| KE5 | 0,832 | ||||
| KE6 | 0,832 | ||||
| KE7 | 0,766 | ||||
| KP1 | 0,614 | ||||
| KP10 | 0,621 | ||||
| KP2 | 0,848 | ||||
| KP3 | 0,828 | ||||
| KP4 | 0,808 | ||||
| KP5 | 0,748 | ||||
| KP6 | 0,849 | ||||
| KP7 | 0,903 | ||||
| KP8 | 0,830 | ||||
| KP9 | 0,679 | ||||
| MS1 | 0,789 | ||||
| MS2 | 0,742 | ||||
| MS3 | 0,749 | ||||
| MS4 | 0,755 | ||||
| MS5 | 0,617 | ||||
| MS6 | 0,691 | ||||
| RN1 | 0,662 | ||||
| RN2 | 0,773 | ||||
| RN3 | 0,728 | ||||
| RN4 | 0,764 | ||||
| KE1 | 0,748 |
Source : Primary data analysis, 2023.
Table 8.
Path coefficients Mean, STDEV, T values, p values.
| Original Sample (O) | T Statistics (|O/STDEV|) | P-Values | |
|---|---|---|---|
| Socioeconomic Benefit -> MSME Cluster Performance | 0,286 | 4,762 | 0,000 |
| Socioeconomic Benefit -> MSME’s Performance | 0,218 | 2,616 | 0,009 |
| MSME’s Performance -> MSME Cluster Performance | -0,100 | 1,800 | 0,072 |
| Efficiency collective -> Benefit Sosial dan Ekonomi | 0,582 | 5,730 | 0,000 |
| Efficiency collective -> MSME Cluster Performance | 0,298 | 3,462 | 0,001 |
| Efficiency collective -> MSME’s Performance | -0,035 | 0,382 | 0,703 |
| Efficiency collective -> Social capital | 0,705 | 13,372 | 0,000 |
| Social capital -> Socioeconomic Benefit | 0,077 | 0,908 | 0,364 |
| Social capital -> MSME Cluster Performance | 0,206 | 2,887 | 0,004 |
| Social capital -> MSME’s Performance | 0,001 | 0,013 | 0,990 |
Source : Primary data analysis, 2023.
Disclaimer/Publisher’s Note: The statements, opinions and data contained in all publications are solely those of the individual author(s) and contributor(s) and not of MDPI and/or the editor(s). MDPI and/or the editor(s) disclaim responsibility for any injury to people or property resulting from any ideas, methods, instructions or products referred to in the content. |
© 2026 by the authors. Licensee MDPI, Basel, Switzerland. This article is an open access article distributed under the terms and conditions of the Creative Commons Attribution (CC BY) license (http://creativecommons.org/licenses/by/4.0/).
Copyright: This open access article is published under a Creative Commons CC BY 4.0 license, which permit the free download, distribution, and reuse, provided that the author and preprint are cited in any reuse.


