
Submitted:
09 January 2026
Posted:
12 January 2026
You are already at the latest version
Abstract
This paper examines the determinants of export performance in Asian landlocked developing countries and evaluates the impact of the United States-China trade war on their export outcomes. The study aims to extend the gravity model framework by incorporating trade-war phases alongside macroeconomic, logistical, and institutional factors to better understand the exposure of landlocked economies to external policy shocks. An augmented gravity model is applied to panel data covering twelve Asian landlocked developing countries and their major trading partners over the period from 2010 to 2024. The analysis employs Ordinary Least Squares and Poisson Pseudo Maximum Likelihood estimators with fixed effects to address heteroskedasticity, zero trade flows, and unobserved heterogeneity. The model includes economic size, geographic distance, logistics performance, regional integration, tariff measures, and interaction terms that capture different phases of the trade war. The results confirm the core predictions of the gravity model. Exporter and importer gross domestic product have positive and statistically significant effects on export flows, whereas geographical distance reduces trade intensity. Tariffs and trade-war-related shocks exert a significant negative impact on exports, with more potent effects during the second phase of the trade war. Improvements in logistics performance and participation in regional trade agreements enhance export performance. Although genuine exchange rate appreciation and higher importer income levels support exports, their positive effects are attenuated by increased trade policy uncertainty. The study relies on aggregate bilateral trade data, which may not capture firm-level adjustment dynamics. The findings highlight the importance of reducing trade costs, improving logistics infrastructure, and strengthening regional integration to enhance export resilience. The paper provides novel evidence on phase-specific trade-war effects on export performance in Asian landlocked developing countries, using an augmented gravity model.
Keywords:
landlocked countries
; gravity model
; export performance
; PPML estimation
; trade war
1. Introduction
Exports represent a key driver of national economic development and constitute a primary source of foreign exchange earnings, particularly for developing economies (Dewi Solikhah Noviyani, 2019). Their role is especially critical in promoting regional economic growth in landlocked developing countries, where external trade serves as a significant channel for economic integration. In 2024, Asian landlocked developing countries accounted for approximately 0.8 percent of global export performance while representing about 2.2 percent of the world population. Over recent years, both population size and export performance in these countries have increased steadily. China and the United States remain the principal export destinations for Asian landlocked developing countries. In 2024, China absorbed 3.2 percent of total exports from Asian landlocked countries, whereas the United States accounted for 0.5 percent. Table 1 presents the export shares of China and the United States across Asian landlocked developing countries. China dominates export destinations in the region, with robust trade linkages with Mongolia, Laos, and Turkmenistan, where export shares reach 91.4 percent, 75.5 percent, and 69.6 percent, respectively. These patterns highlight the importance of geographical factors, especially proximity to China and connectivity associated with the Belt and Road Initiative, in shaping the export performance of Asian landlocked developing countries.
Landlocked developing countries face persistent challenges in integrating into the global trading system, as geographical constraints increase transportation costs, weaken competitiveness, and limit export potential (Ramesh C. Paudel, 2018). In Asia, landlocked developing countries such as Mongolia, Kazakhstan, Turkmenistan, Azerbaijan, and Uzbekistan remain highly dependent on energy and mineral exports, reflecting a typical regional pattern of export concentration. In many of these economies, exports are dominated by raw materials and mining products, which makes export revenues and government budgets particularly vulnerable to external shocks. In recent years, several Asian landlocked developing countries have experienced declining export earnings and fiscal revenues. Falling commodity prices have further intensified this trend, as have the escalation of the global trade war and persistent geopolitical tensions, all of which have contributed to widening balance-of-payments pressures.
The first and second phases of the US-China trade war in 2018 and 2019 led to pronounced changes in the export flows of Asian landlocked developing countries. During this period, rising tariffs, supply chain disruptions, and heightened trade policy uncertainty adversely affected export performance, with the effects more pronounced in the second phase, as evidenced by the augmented gravity model results. Moreover, the positive impact of currency competitiveness, as measured by the real effective exchange rate, and the economic size of importing countries weakened during the trade war, indicating that the export performance of landlocked developing countries is susceptible to external policy risks. Consequently, a quantitative assessment of how each phase of the trade war interacts with macroeconomic and logistical factors represents a central focus of this study. It is essential for informing future trade policy decisions. Accordingly, this study examines the determinants of export performance in Asian landlocked developing countries amid the US-China trade war, using both traditional and augmented gravity models on panel data covering 2010-2024.
2. Literature Review and Theoretical Framework
In recent years, U.S. tariff policy and its implications for global and regional economies have attracted growing scholarly attention, particularly in studies examining the U.S.-China tariff war. In the context of Asian landlocked developing countries, a limited number of studies have applied augmented gravity models using panel data to analyze the effects of trade-war phases, macroeconomic conditions, and logistics factors on export performance. More broadly, gravity model approaches have been widely employed in international trade research, and this study draws on a comprehensive review of more than thirty international empirical contributions. Existing research on the US-China trade war has focused primarily on tariff effects in the United States and China, as well as on spillover effects on ASEAN, African, and Asia-Pacific economies. These studies commonly assess indirect consequences for third countries through channels such as capital markets, labor markets, cross-border capital flows, and changes in trade patterns. However, empirical evidence focusing specifically on Asian landlocked developing countries remains limited. Swenson (2025) emphasizes that the effects of trade-war tariffs are not immediate and that country- and region-specific responses vary substantially.
Numerous influential studies have examined the economic consequences of the tariff conflict between the two major economies. Fajgelbaum (2019) analyzes the welfare and distributional effects of the initial tariff rounds on the United States economy. Chor and Li (2021) employ satellite-based nighttime light data to demonstrate a decline in regional economic activity and export performance in China following increased U.S. tariff pressure. Kahn, McLaren, and Zhang (2024) investigate the effects of the trade war on Asian and ASEAN economies, with particular focus on Vietnamese cities, and find that production relocation has been concentrated in coastal areas with well-developed transportation infrastructure, thereby benefiting Vietnam. Similarly, Hayakawa and Ito (2022) examine trade diversion effects in ASEAN, showing that countries such as Vietnam and Cambodia experienced gains in both exports to the United States and imports from China during the trade dispute.
Paudel and Cooray (2018) analyze the impact of landlockedness on the export performance of developing countries by comparing landlocked and non-landlocked developing countries. Using a standard gravity model and panel data from 1995 to 2015, the study examines how geographical constraints, trade policy, and openness shape trade outcomes. The findings demonstrate that landlockedness exerts a significant adverse effect on export performance even after controlling for income levels and trade openness. At the same time, the results suggest that greater trade liberalization and participation in regional trade agreements can partially mitigate the disadvantages associated with being landlocked (Ramesh C. Paudel, 2018).
Paudel and Wagle (2017) focus on Nepal as a case study of an Asian landlocked developing country and investigate its export performance using bilateral trade data with 134 partner countries for the period 2009-2011. Their analysis incorporates variables such as gross domestic product, gross domestic product per capita, geographical distance, tariff levels, contiguity, cultural proximity, and remoteness. The study shows that many Asian landlocked least-developed countries, including Nepal, record some of the lowest export-to-gross domestic product ratios worldwide, even when compared with economies at similar income levels. This persistent underperformance is attributed primarily to structural constraints rather than tariff or policy barriers, including landlocked geography, inadequate infrastructure, high transportation costs, political instability, and limited competitiveness.
Kingsley E. Dogah (2021) examined the effects of trade and economic policy uncertainties on regional systemic risk, drawing on evidence from ASEAN and employing the TVR-VAR connectedness model. The findings from this study indicate that the effects of trade and economic policy uncertainty vary depending on the specific policies and countries involved. A key factor influencing market exposure is the strength of bilateral trade relations (E.Dogah, 2021). Since late 2013, the United States’ influence on regional markets has diminished. Additionally, China’s policy uncertainty has a significant contagion effect on ASEAN markets (E.Dogah, 2021).
In resource-dependent landlocked economies, external trade shocks and policy uncertainty may be further amplified through exchange-rate channels. Empirical evidence from Mongolia demonstrates that mineral export booms contributed to real effective exchange rate appreciation and weakened the competitiveness of non-resource tradable sectors, reflecting classic Dutch disease dynamics (Dansranbavuu, Sodnomdavaa, & Tsedendorj, 2018). This mechanism suggests that Asian landlocked developing countries may be structurally more vulnerable to external trade policy shocks, including tariff escalations and trade wars.
In previous studies, most found that the GDPs of exporters and importers were positively and significantly associated with Mongolia’s total trade and export flows. The findings of both the GDP of the exporter and the importer in previous studies were consistent with the theoretical expectation of the basic gravity model. In the gravity model, total foreign trade and export flows are negatively related to distance. In most empirical studies, distance is found to be negative or positive. The datasets used in previous studies covered various trading partners across different periods. Most studies emphasize the importance of foreign trade flows, especially export flows, to the economy. Most previous studies have focused on total export performance. Research has focused on the impact of the US-China trade war on regions such as ASEAN and on countries such as Vietnam. However, there is a lack of research examining its effects on the exports of Asian landlocked developing countries (LLDCs). Our study is unique as it aims to address this gap.
3. Methodology
3.1. Purpose and Design of Study
The objective of this study is to identify the determinants of the export performance of Asian landlocked developing countries (LLDCs) and to quantitatively assess their economic, logistical, institutional, and policy impacts (related to the US-China trade war).
3.2. Data and Sources
The research dataset comprises export trade flows between 12 Asian LLDCs (Mongolia, Laos, Nepal, Bhutan, Kyrgyzstan, Kazakhstan, Tajikistan, and Afghanistan) and their top 15 export trading partners for the period 2010 to 2024.
The dependent variable, export flows (EXPVALUE), represents the total value of goods exported from country (i) to country (j) in a given year, expressed in U.S dollars (USD). The data were obtained from the United Nations Comtrade Database (UN COMTRADE) and consist of bilateral export trade flows measured in nominal terms, compiled annually at the country-pair level. The independent variables include factors classified into five categories: economic, geographical, logistical, institutional, and policy shocks.

Table 2.
Dataset.
| Variable | Description | Source | Expected impact |
|---|---|---|---|
| EXPVALUE | Export size (log version) | UN Comtrade | Target variable |
| GDPexp, GDPimp | GDP of exporting and importing countries | World Bank (WDI) | (+) |
| Distance | Distance between two countries (km) | CEPII | (–) |
| LPIEXP, LPIIMP | Logistics index (exporter, importer) | World Bank (LPI) | (+) |
| ASEAN, EAEU, APTA, NEA | Institutional and regional integration variables | WTO, FTU | (+) |
| TWPHASE1, TWPHASE2 | Phases of the US-China trade war | IMF, WTO | (–) |
| TariffRate, REER | Tariff level and real exchange rate | UNCTAD, IMF | (±) |
3.3. Theoretical Basis of the Model
The Gravity model, widely used in international trade theory, is based on Newton’s law of gravitation. According to Newton’s theory of gravitation, the gravitational force between two objects is directly proportional to each of their masses and inversely proportional to the square of the distance between them.
The gravity model analyzes the relationship between distance and economic indicators (GDP, GDP per capita, population) for countries i and j. The gravity model has been developed for more than half a century. In 2003, Anderson and Van Wincoop (2003) developed the gravity model, which was based on the equilibrium of demand and supply in microeconomics and established a theoretical basis (Anderson, 2003). Linneman (1966), Bergstrand (1985), Eaton and Kortum et al. (1997), Deardorff (1998), and Anderson and Van Wincoop et al. (2003) developed the theoretical basis of gravity based on Ricardo’s theory and the Heckscher-Ohlin model.
Because the gravity model has a solid theoretical basis, it is widely used in empirical studies across sectors such as trade, services, migration, and transport. The gravity model has some advantages. It can forecast the export performance of Asian LLDCs to be influenced by geographical, economic, institutional, and logistical factors, as well as by the interaction between the US-China trade war, and it has a solid theoretical basis grounded in the equilibrium of demand and supply. In addition, this model can examine the predictors affecting air passenger demand and identify potential demand. Therefore, the augmented gravity model with OLS estimation was employed in this study, using panel data.
Similar to this theoretical consideration, bilateral trade flows between trading countries are positively related to their GDPs and negatively related to the distance between them. Export flows are positively related to economic mass and negatively related to distance. Previous studies widely apply the gravity model to explain the predictors of export flows. Therefore, this study employs an Augmented Gravity Model to account for logistical, institutional, and policy influences.
(1) Theoretical basis of logistics factors
The logistics indices (LPIEXP, LPIIMP) are based on the Trade Facilitation Theory and the New Economic Geography (Krugman, 1991). According to these theories, a well-developed logistics system increases trade flows by reducing transportation costs and shortening delivery times. Hausman, Lee, and Subramanian (2013) found that logistics improvements have a positive impact on trade that is as large as tariff reductions.
(2) Basis of institutional and regional integration factors
The institutional and regional integration variables (ASEAN, EAEU, APTA, NEA) are grounded in the principles of Institutional Economics (North, 1990) and Transaction Cost Theory. A good institutional environment reduces market uncertainty and limits transaction costs. According to Baldwin (2011), “regionalism as the second unbundling” theory, regional integration is a key mechanism for reducing trade costs and expanding supply chains.
(3) Theoretical basis of trade wars and policy uncertainty
The interaction variables (TWPHASE1, TWPHASE2, TWPD × EAEU) are based on Policy Uncertainty Theory (Bloom, 2014) and Trade Diversion Theory (Viner, 1950). Bloom (2014) showed that investment and trade shrink in the short term as policy uncertainty increases, whereas Viner (1950) explained that tariff restrictions have a trade-diversion effect.
The standard gravity model can be expressed as follows:
where:
—the economic sizes of the exporter and importer countries, respectively;
—the geographical distance between the two countries;
—a set of additional control variables affecting trade flows (e.g., everyday language, common border, regional cooperation, tariff levels, exchange rates, logistics indicators, institutional factors);
—the error term.
Most previous studies applied the log–log functional form of the gravity model. The advantage of this form is that it helps reduce heteroscedasticity and obtain variable elasticities, and it also enables the introduction of additional policy variables.
According to neoclassical trade theory and new trade theory (Krugman, 1980), larger economies are expected to exhibit greater trade flows because they can produce a wider variety of goods and benefit from economies of scale. Thus, higher GDP levels in both exporting and importing countries increase trade volume. In contrast, in the theoretical model proposed by Anderson & van Wincoop (2003), distance functions as a composite measure of trade costs, encompassing transportation, information, and time-related costs. As distance increases, these costs rise, reducing trade volume. The augmented gravity model employed the following log–log form for analysis.
Augmented Gravity Model:
Where group vectors are defined as follows:
country-pair fixed effects,: year fixed effects
This model enhances the reliability of estimation results by addressing issues of overdispersion, heteroskedasticity, and zero trade flows using the Poisson Pseudo Maximum Likelihood (PPML) estimator with country-pair and year fixed effects (FE). The logarithmic transformation of variables facilitates flexible interpretation of coefficients. At the same time, interaction terms enable a more precise assessment of the combined effects of trade policy changes, macroeconomic fundamentals, and regional cooperation. Accordingly, the model not only tests the core postulates of the standard gravity framework but also captures the dynamic and interaction impacts of structural factors and policy shocks, thereby offering a more comprehensive understanding of trade flows.
Export performance: Export performance is determined by export trade flows (Ramesh C. Paudel, 2018; Ha Suik Yee, 2023).
GDP per capita: Previous studies have used GDP per capita as a measure of economic performance or economic growth. For example, some researchers (Ha Suik Yee, 2023; Andreas M. Tillmann, 2023; Yones, 2023) used GDP per capita.
Distance between countries: This variable is one of the primary variables in the gravity model. Most researchers measure it as the geographical distance between cities or between countries in the gravity model. In addition, trade costs, as a proxy for distance, have estimated and published for more than 180 countries for the period 1995-2022. We have yet to incorporate trade costs into this model.
3.4. Statistical Methods and Interaction Analysis
This study employed an augmented gravity model to examine the determinants of international trade flows among Asian landlocked developing countries (LLDCs). To ensure the robustness and reliability of the results, several complementary econometric techniques were applied. First, the traditional log-linearized gravity model was estimated using ordinary least squares (OLS). Expressing all continuous variables in logarithmic form allowed for direct elasticity-based interpretation of the coefficients and facilitated comparison across model specifications. However, despite its extensive use in gravity model literature, the OLS estimator is prone to bias when trade flows contain zero observations or exhibit high variability and heteroskedasticity.
To overcome these limitations, the Poisson pseudo-maximum likelihood (PPML) estimator proposed by Santos Silva and Tenreyro (2006) was employed. This method addresses issues of heteroskedasticity and zero trade values by providing consistent parameter estimates even when the variance structure of the data departs from that of a pure Poisson process. In cases where the data exhibited overdispersion, that is, when the variance exceeded the mean, the negative binomial regression model was adopted as a more appropriate alternative to the standard Poisson specification. Similarly, the Poisson generalized linear model (GLM) was estimated to further control for overdispersion and heteroskedasticity, thereby yielding more stable and efficient parameter estimates. Finally, the Poisson quasi-maximum likelihood (QML) model with country-pair and year fixed effects was employed to control for unobserved heterogeneity. Incorporating these fixed effects captured latent, time-invariant, and spatially heterogeneous factors that could otherwise bias the results. This comprehensive estimation strategy strengthens the validity of the findings and provides a robust empirical basis for analyzing the trade performance of Asian LLDCs.
This model enhances the reliability of estimation results by addressing issues of overdispersion, heteroskedasticity, and zero trade flows using the Poisson Pseudo Maximum Likelihood (PPML) estimator with country-pair and year fixed effects (FE). The logarithmic transformation of variables facilitates flexible interpretation of coefficients. At the same time, interaction terms enable a more precise assessment of the combined effects of trade policy changes, macroeconomic fundamentals, and regional cooperation. Accordingly, the model not only tests the core postulates of the standard gravity framework but also captures the dynamic and interaction impacts of structural factors and policy shocks, thereby offering a more comprehensive understanding of trade flows.
Export performance: Export performance is determined by the export trade flows (Ramesh C. Paudel, 2018; Ha Sui Kee, 2023).
GDP per capita: Previous studies have used GDP per capita as a measure of economic performance or economic growth. For example, some researchers (H a S uik Y ee, 2023), such as Andreas M. Tillmanna (Andreas M. Tillmanna, 2023) and Yones (Yones, 2023), used GDP per capita.
Distance between countries: This variable is one of the primary variables in the gravity model. Most researchers measure it as the geographical distance between cities or between countries in the gravity model. In addition, trade costs, as a proxy for distance, have estimated and published for more than 180 countries for the period 1995-2022. We have yet to incorporate trade costs into this model.
Model evaluation methods and rationale
| Method | Purpose of use | Theoretical and practical basis |
| OLS (log–log regression) | Baseline assessment | Easily interpretable, flexible, and able to detect the direction of correlation (Head & Mayer, 2014) |
| PPML (Poisson Pseudo Maximum Likelihood) | Main assessment method | “Zero trade flow”, commonly used to correct heteroskedasticity problems (Santos Silva & Tenreyro, 2006) |
| Negative Binomial (NB) | Control overdispersion | More suitable in the case of variance > mean (Cameron & Trivedi, 2010) |
| Poisson GLM (Fixed Effects) | Verification | Reduce unobserved differences by controlling for cross-country and time fixed effects. |
The PPML method is suitable for addressing the zero-trade problem common in trade data and reliably estimates log-linear relationships. The following tests were performed to verify the reliability of the model:
Multicollinearity test (VIF): VIF < 5 for all variables → not highly correlated
Heteroskedasticity test: Breusch–Pagan test → stable error distribution
Autocorrelation test: Durbin–Watson statistic 1.8–2.2 → no autocorrelation detected
Robustness test: Validated by comparing the results of four variants: OLS, PPML, NB, and GLM
Research questions and methodological coherence
| Research question | Method used | Relationship under review |
| 1. What are the determinants of export performance? | OLS, PPML | GDP, Distance, REER |
| 2. What are the logistical and institutional implications? | PPML, NB | LPIEXP, LPIIMP, ASEAN, EAEU |
| 3. What are the moderating effects of the phases of the trade war? | PPML + Interaction Terms | TWPHASE1, TWPHASE2 × EAEU |
The methodology of this study is developed within a theoretical and numerical framework grounded in gravity theory and consistent with the trading conditions of LLDC. It is believed that combining PPML and NB models mitigates the effects of zero flow and overdispersion, thereby improving statistical reliability.
4. Result
4.1. Annual Export Changes and the Impact of External Shocks
The study first analyzed the annual percentage change in exports for the 12 Asian LLDCs between 2000 and 2024, comparing these changes with those of significant regional and global economic groupings. As illustrated in Figure 1, although LLDCs’ exports declined during the 2009 global financial crisis, the magnitude of the contraction was relatively small compared with that in some advanced economies. This resilience may be attributed to their export structure and the stable demand for certain commodities during that period. Between 2018 and 2022, however, external shocks, including the US-China trade war, tariff increases, and supply chain disruptions, slowed export growth.
The sharpest decline occurred in 2020, primarily due to the COVID-19 pandemic, driven by logistical factors such as cross-border shipping restrictions and port closures. In 2021-2022, global economic activity rebounded, commodity prices rose, and LLDCs’ exports recovered faster than those of other groupings. These results indicate that sustaining export growth requires reducing trade costs, improving logistics infrastructure, diversifying markets, and actively engaging with regional and global trade agreements. These are strategically crucial.
The fluctuations in LLDCs’ exports are significantly greater than in other economic groupings. This is directly linked to the structural factors such as trade composition, logistical limitations, and landlockedness. During the post-pandemic recovery, Armenia (+91.9% in 2022), Mongolia (+53.5% in 2023), and Kyrgyzstan (+60% in 2023, +55.6% in 2024) recorded the highest export growth. This performance was primarily driven by rising commodity prices, improved transportation conditions, and reduced trade barriers. Conversely, resource-dependent countries such as Kazakhstan, Azerbaijan, and Turkmenistan were susceptible to commodity price cycles in global markets. Their exports contracted sharply during years of price declines but grew steadily during periods of price increases. Smaller economies such as Bhutan, Laos, and Tajikistan experienced higher volatility due to product concentration, limited market diversification, and supply chain vulnerabilities. In some cases, these countries recorded negative export growth for several consecutive years, although rapid rebounds were observed in subsequent periods.
4.2. Estimation Results of the Baseline Gravity Model
This section presents the estimation results for bilateral trade flows among the 12 Asian LLDCs using the core explanatory variables of the gravity model. The models include OLS (log-log) specification, PPML (Baseline), and PPML specifications with fixed effects (year and country-pair). A balanced panel dataset of 2700 observations was used. Given the absence of trade flows, the PPML method was selected as the primary estimation approach. By introducing fixed effects, unobservable heterogeneity related to time and country-pair characteristics was controlled for, thereby enabling more accurate estimation of the net effect of the explanatory variables. The results are presented in Table 3.
Across all four models, the economic size of exporters and importers has a stable and statistically significant positive effect on trade flows. The logarithm of the exporting country’s GDP (LOG(GDPEX)) is 1.716 (t = 21.31, p < 0.01) in the OLS (Log-Log) model and 0.962 (z = 19.42, p < 0.01) in the PPML baseline model. This effect remains consistent even when year and country-pair fixed effects are included. Similarly, the logarithm of the importing country’s GDP (LOG(GDPIMP)) is positive and highly significant in all models, confirming the core assumption of the gravity model that larger markets generate greater trade flows.
The coefficient of distance (LOG(DISTANCE)) is negative and highly significant, indicating that greater geographical distance increases transportation costs and reduces trade volumes. By contrast, the presence of a common border (BORDER) and a common language (COMLANG) both have statistically significant positive effects on trade flows. Regarding diagnostic indicators, the R2 for the OLS model is 0.473. In contrast, the Pseudo R2 of the PPML models increases to 0.573–0.590, indicating improved explanatory power when fixed effects are included. The number of observations remains the same across all models (n=2700). Overall, the findings are consistent with economic theory and demonstrate that the PPML method yields more reliable estimates than the OLS log-log model, reducing the risk of overestimation.
4.3. Estimation Results of the Augmented Gravity Model
In this subsection, the study employed the augmented gravity model to examine the effects of the phases of the US-China trade war, as well as logistical, institutional, tariff levels, and regional integration variables, on trade flows. Three estimation methods were applied: (i) the Negative Binomial model to account for overdispersion, (ii) the traditional Poisson GLM with a log-link function, (iii) the Poisson QML with country-pair and year fixed effects.
These models incorporated variables such as the Logistic Performance Index (LPI), tariffs, trade-war phases, and regional integration, alongside traditional determinants of trade, including economic size, distance, contiguity, and common language.
Table 4.
Estimation Results of the Augmented Gravity Model Approach.
| Variables | Negative Binomia | Poisson GLM | Poisson QML + FE | |||
|---|---|---|---|---|---|---|
| Coefficient | p-value | Coefficient | p-value | Coefficient | p-value | |
| C | -17.714 | 0.000 *** | -18.357 | 0.000 *** | -17.352 | 0.000 *** |
| LOG(GDPEX) | 1.011 | 0.000 *** | 1.004 | 0.000 *** | 0.980 | 0.000 *** |
| LOG(GDPIMP) | 0.263 | 0.000 *** | 0.367 | 0.000 *** | 0.394 | 0.000 *** |
| LOG(DISTANCE) | -1.167 | 0.000 *** | -0.886 | 0.000 *** | -0.917 | 0.000 *** |
| BORDER | 0.344 | 0.000 *** | -0.041 | 0.000 *** | -0.181 | 0.000 *** |
| COMLANG | 0.259 | 0.074 * | 0.248 | 0.001 *** | 0.190 | 0.000 *** |
| LOG(LPIEXP) | 4.653 | 0.000 *** | 2.204 | 0.000 *** | 2.249 | 0.000 *** |
| LOG(LPIIMP) | 3.004 | 0.036 ** | 1.644 | 0.000 *** | 1.201 | 0.000 *** |
| TARIFFRATE | -0.034 | 0.006 *** | -0.084 | 0.000 *** | -0.088 | 0.000 *** |
| TWPHASE1 | -0.196 | 0.097 * | -0.025 | 0.000 *** | -0.026 | 0.000 *** |
| TWPHASE2 | -0.228 | 0.054 * | -0.081 | 0.000 *** | -0.078 | 0.000 *** |
| NEA | 1.057 | 0.000 *** | 0.690 | 0.000 *** | 0.721 | 0.000 *** |
| TWPD × EAEU | -0.585 | 0.084 * | -0.323 | 0.000 *** | -0.302 | 0.000 *** |
| @CROSSID | -0.004 | 0.000 *** | ||||
Notes: All models are estimated using the Newton-Raphson/Marquardt method. Model 5.3 includes country-pair fixed effects (CROSSID).
The results from the three estimation methods indicate that the logarithm of GDP is positive and highly significant across all models for both exporting and importing countries, confirming the core assumption of gravity theory that trade flows increase with economic size. Distance (LOG(DISTANCE)) is negative and highly significant in all models, indicating that greater distance raises transportation costs and reduces trade flows. The logistic indicators (LOG(LPIEXP), LOG(LPIIMP)) are positive and highly significant across all models, suggesting that the quality of infrastructure and logistics services plays an important role in enhancing trade intensity. The tariff variable (TARIFFRATE) is negative across all models, indicating that higher tariffs reduce trade flows.
The trade war phase variables (TWPHASE1, TWPHASE2) generally exert adverse effects, with the second phase (TWPHASE2) having a more substantial adverse effect on trade flows. Moreover, the interaction term for regional integration (TWPD × EAEU) also has an adverse effect, suggesting that certain regional agreements may undermine trade flows amid the trade war.
4.4. The Impact of Trade War Phases and Macroeconomic Indicators on Exports
To further clarify the effects of the phases of the US-China trade war on the export flows of LLDCs, this study examined the interaction between trade-war dummy variables (TWPhase1: 2018, TWPhase2: 2019, TWPD: 2020) and key macroeconomic indicators. The macroeconomic indicators include the tariff rate, real exchange rate weighted average (REER), and gross domestic product of the importing country (GDPIMP). Conducting this interaction analysis enables a deeper understanding of the combined effects of trade policy uncertainty, tariff fluctuations, and macroeconomic fundamentals. This approach further explained how these factors jointly shaped the volatility and trends of export flows.
Figure 2.
The impact of trade war phases and macroeconomic indicators on export.
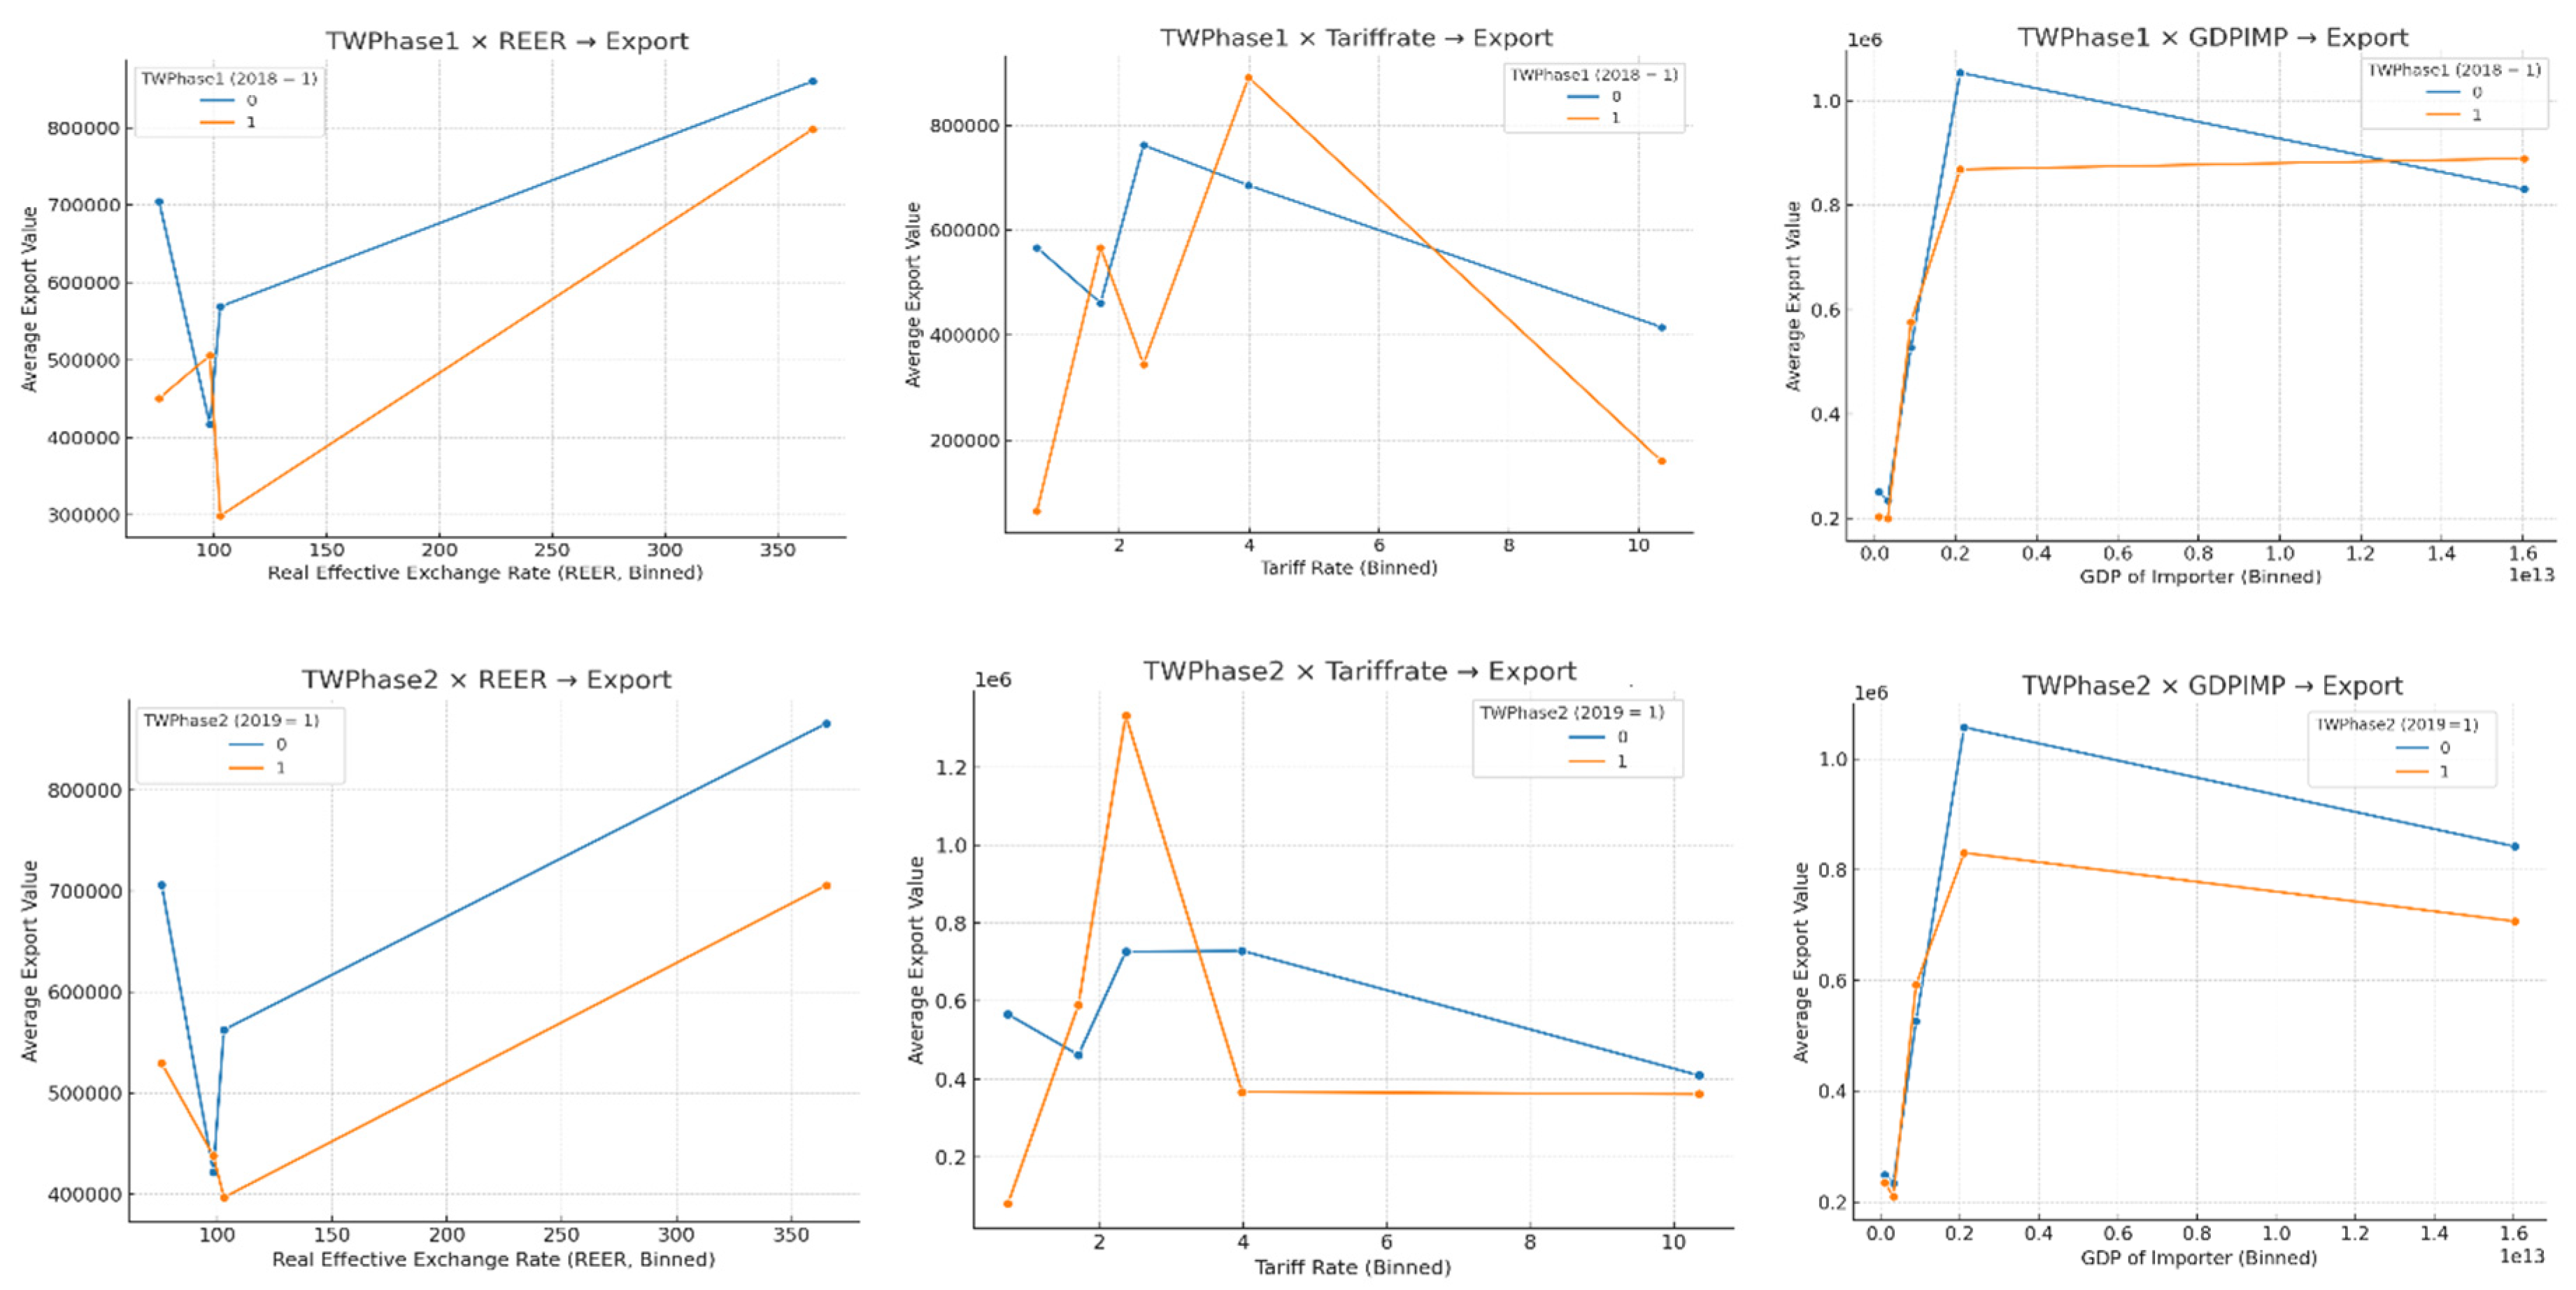
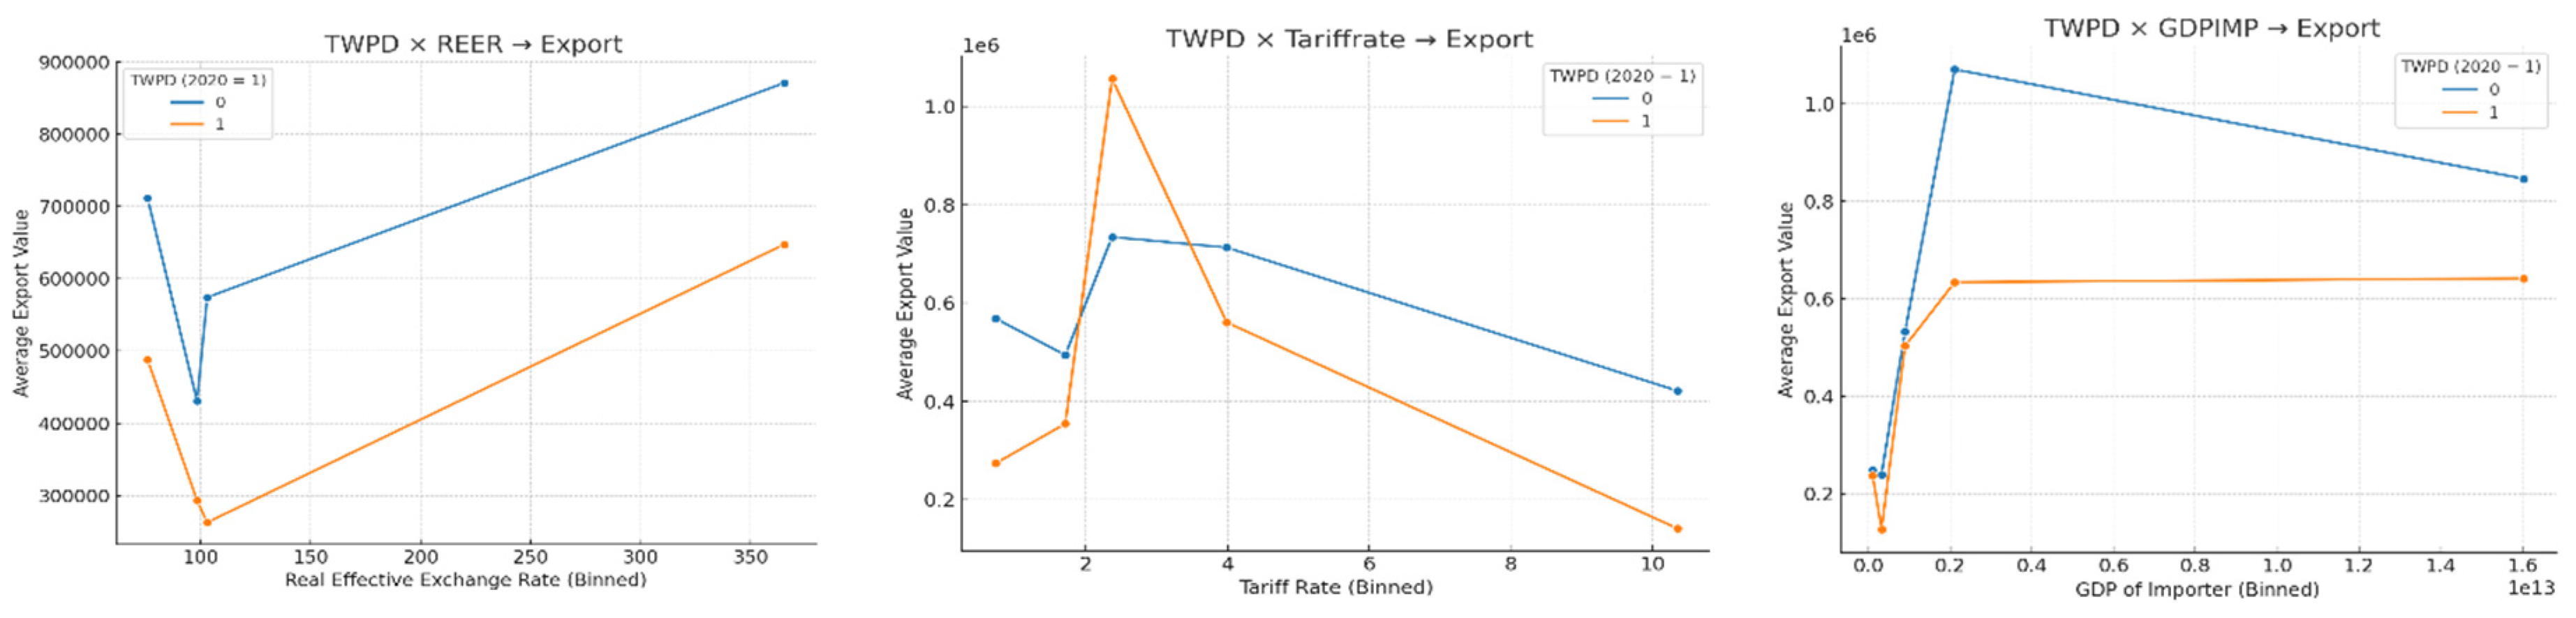
In this section, the impact of the US-China trade war phases (2018, 2019) and the post-deal period (2020) on export performance was examined through the interaction effects of macroeconomic indicators, including the real exchange rate (REER), tariff levels, and the importing country’s GDP (GDPIMP). The findings revealed that across all phases, tariff levels exerted the most substantial negative impact on exports. Specifically, exports declined sharply as tariffs increased, with the decrease being particularly pronounced during the second phase of the trade war. This outcome can be attributed to the escalation of bilateral sanctions and heightened policy uncertainty.
Although REER continued to have a positive effect on exports, the strength of this relationship weakened following the onset of the trade war. Similarly, while exports generally increased as the importing country’s GDP rose, this trend slowed under trade-war conditions. These results indicate that trade policy uncertainty and non-tariff barriers constrained export flows.
In contrast, following the preliminary agreement reached in 2020, export conditions improved modestly, and the positive effects of REER and importing country GDP gradually re-emerged. However, a full recovery was not observed, which may reflect persistent structural imbalances and the agreement’s limited effectiveness.
Figure 3.
Marginal effects of REER, tariff rate, and importer GDP on export performance across trade war phases.
Figure 3.
Marginal effects of REER, tariff rate, and importer GDP on export performance across trade war phases.
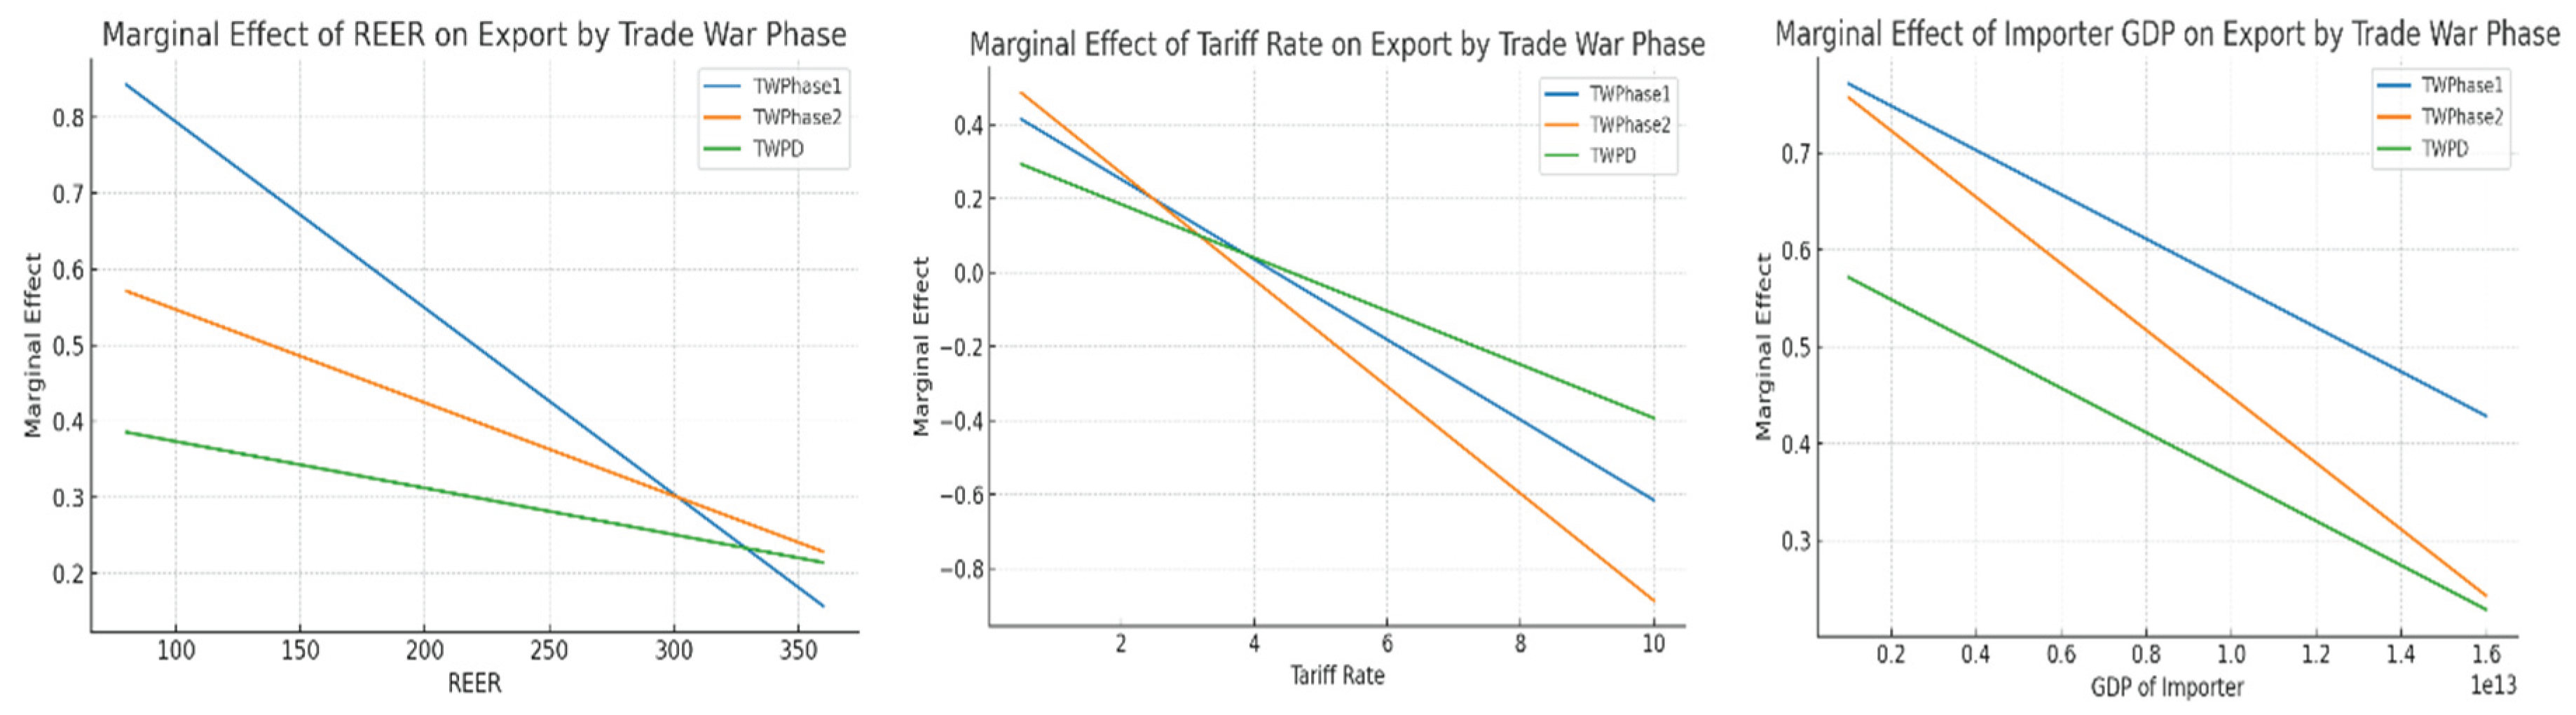
Marginal effect analysis of the interaction between the three phases of the trade war and key economic fundamentals showed that export performance varied significantly across contexts. In TWPhase1, the positive impact of REER on exports was strongest when REER increased. However, in TWPhase2 and TWPD, this relationship weakened, reflecting reduced currency competitiveness due to trade policy uncertainty, non-tariff barriers, and loss of confidence. Tariff increases negatively affected exports in all phases, with the most substantial effect observed in TWPhase2, and this adverse effect persisted during TWPD. Importer GDP (GDPIMP) generally had a positive effect on exports; however, its impact weakened considerably during the trade war, which can be attributed to supply-demand distortions and heightened policy risks. Overall, these findings suggest that LLDCs are highly sensitive to trade wars, tariff policies, exchange rate fluctuations, and abrupt changes in external demand.
5. Conclusions
We conducted this study to analyze the determinants of the export performance of Asian LLDCs amid the US-China trade war, using traditional and augmented gravity models with panel data on 12 Asian LLDCs for the period 2000-2024. This study employs both the traditional and augmented gravity model approaches using panel data to analyse the effects of trade-war phases, macroeconomic indicators, and logistical factors on the export performance of landlocked developing countries (LLDCs).
This study highlights the export performance vulnerabilities of landlocked developing countries (LLDCs) from 2018 to 2022, particularly in response to external shocks like the US–China trade war, tariff escalations, and the COVID-19 pandemic. Although global economic recovery and rising commodity prices facilitated a rebound in 2021–2022, the volatility of LLDC exports remained higher than that of other economic groups. This volatility is attributed to structural challenges, including landlockedness, a narrow export composition, and limited market diversification.
The results from the gravity model confirm key theoretical expectations: the economic size of trading partners has a strong positive effect on trade flows, while distance significantly reduces them. Additionally, common borders and shared languages help to lower trade costs and encourage exchanges. The use of Poisson Pseudo-Maximum Likelihood (PPML) estimation yields more reliable and unbiased results compared to traditional log-linear ordinary least squares (OLS) models. An analysis of the trade war phases, in conjunction with key macroeconomic indicators, reveals that tariffs had the most significant negative impact on LLDC exports, particularly during the second phase of the trade war. While genuine exchange rate appreciation and higher GDP in importing countries generally benefited exports, their positive effects weakened amidst increased policy uncertainty and non-tariff barriers. The post-deal period showed only partial recovery, indicating that temporary policy adjustments cannot fully address structural vulnerabilities and supply chain disruptions.
Overall, these findings emphasize the necessity for LLDCs to reduce trade costs through investments in logistics infrastructure, diversify their export markets and product offerings, and actively engage in regional and global trade agreements. Strengthening resilience to external shocks and policy uncertainty is crucial for sustaining long-term export growth and economic stability.
Supplementary Materials
The following supporting information can be downloaded at the website of this paper posted on Preprints.org.
References
- Anderson, J.E.; van Wincoop, E. Gravity with gravitas: A solution to the border puzzle. Am. Econ. Rev. 2003, 93, 170–192. [Google Scholar] [CrossRef]
- Tillmann, A.M.; Jung, I.J. Reproducible air passenger demand estimation. J. Air Transp. Manag. 2023, 106, 102320. [Google Scholar] [CrossRef]
- Baumol, W.J. The Free-Market Innovation Machine: Analyzing the Growth Miracle of Capitalism; Princeton University Press: Princeton, NJ, USA, 2002; Available online: https://press.princeton.edu/books/paperback/9780691090927/the-free-market-innovation-machine.
- Chor, D.; Li, J. Illuminating the effects of the U.S.–China trade conflict in Southeast Asia (NBER Working Paper No. 29349); National Bureau of Economic ResearchL: Cambridge, MA, USA. [CrossRef]
- Dansranbavuu, L.; Sodnomdavaa, T.; Tsedendorj, E. Dutch disease symptoms in Mongolian economy and ways to reduce its negative effects. Int. J. Emerg. Multidiscip. Res. 2018, 2, 7–14. [Google Scholar] [CrossRef]
- Noviyani, D.S.; Tanjung, W.T. Indonesian export efficiency: A stochastic frontier gravity model approach. Int. J. Sci. Eng. Technol. 2019, 8, 488–497. [Google Scholar] [CrossRef]
- Dogah, K.E. Effect of trade and economic policy uncertainties on regional systemic risk: Evidence from ASEAN. Econ. Model. 2021, 99, 105497. [Google Scholar] [CrossRef]
- Fajgelbaum, P.D.; Goldberg, P.K.; Kennedy, P.J.; Khandelwal, A.K. The Return to Protectionism (NBER Working Paper No. 25638); National Bureau of Economic Research: Cambridge, MA, USA, 2019. [Google Scholar] [CrossRef]
- Ha, S.Y.; Mahendran, S. Determinants of export: A gravity model analysis of Malaysia’s electrical and electronic industries. J. High. Educ. Orient. Stud. 2023, 3, 24–36. [Google Scholar] [CrossRef]
- Hayakawa, K.; Ito, T. The Trade Impact of the U.S.–China Conflict in Southeast Asia (IDE Discussion Paper No. 873); Institute of Developing Economies, JETRO: Chiba, Japan, 2022; Available online: https://www.ide.go.jp/English/Publish/Discussion_Papers/873.html.
- Kahn, M.E.; McLaren, J.; Zhang, M. How the U.S.–China Trade War Accelerated Urban Economic Growth and Environmental Progress in Northern Vietnam (NBER Working Paper No. 33126); National Bureau of Economic Research: Cambridge, MA, USA, 2024. [Google Scholar] [CrossRef]
- Paudel, R.C.; Cooray, A. Export performance of developing countries: Does landlockedness matter? World Econ. 2018, 41, 2861–2886. [Google Scholar] [CrossRef]
- Swenson, D.L. Trade-war tariffs and supply chain trade. Asian Econ. Pap. 2025, 24, 66–86. [Google Scholar] [CrossRef]
- Yones, R.F. Macroeconomic determinants of air passenger demand in Egypt. Sci. J. Financ. Commer. Stud. Res. 2023, 4, 43–60. [Google Scholar] [CrossRef]
- Varadhan, S. U.S. Tariffs and Europe’s Slowdown Reshape Global Solar Panel Trade; Reuters: Seoul, Republic of Korea, 2025; Available online: https://www.reuters.com/sustainability/boards-policy-regulation/us-tariffs-europe-slowdown-reshape-global-solar-panels-trade-2025-05-07/.
- World Trade Organization. Easing Trade Bottlenecks in Landlocked Developing Countries; WTO: Geneva, Switzerland, 2021; Available online: https://www.wto.org/english/res_e/publications_e/landlocked2021_e.htm.
- United Nations Development Programme. Landlocked Developing Countries: Looking Back and Ahead—Accelerating Action in the Next 10 Years; UNDP: New York, NY, USA, 2025; Available online: https://www.undp.org/sites/g/files/zskgke326/files/2025-08/undp-landlocked-developing-countries-looking-back-and-ahead-v2.pdf.
- United Nations Conference on Trade and Development. Mapping the Size of New U.S. Tariffs for Developing Countries; UNCTAD: Geneva, Switzerland, 2025; Available online: https://unctad.org/news/mapping-size-new-us-tariffs-developing-countries.
- International Trade Centre. U.S. Tariffs Impact; United Nations Office at Geneva Multimedia Newsroom: Geneva, Switzerland, 2025; Available online: https://www.unognewsroom.org/story/en/2710/us-tariffs-impact-itc.
- Economic and Social Commission for Asia and the Pacific. Asia-Pacific Trade and Investment Report 2019: Navigating the New Normal in Trade and Investment; United Nations ESCAP: Bangkok, Thailand, 2019; Available online: https://repository.unescap.org/server/api/core/bitstreams/93123bda-646d-42e1-a689-fb7c7d37ef77/content.
Figure 1.
Annual percentage change in the volume of exports of goods and services for LLDCs and selected economic groupings, 2000-2024.
Figure 1.
Annual percentage change in the volume of exports of goods and services for LLDCs and selected economic groupings, 2000-2024.
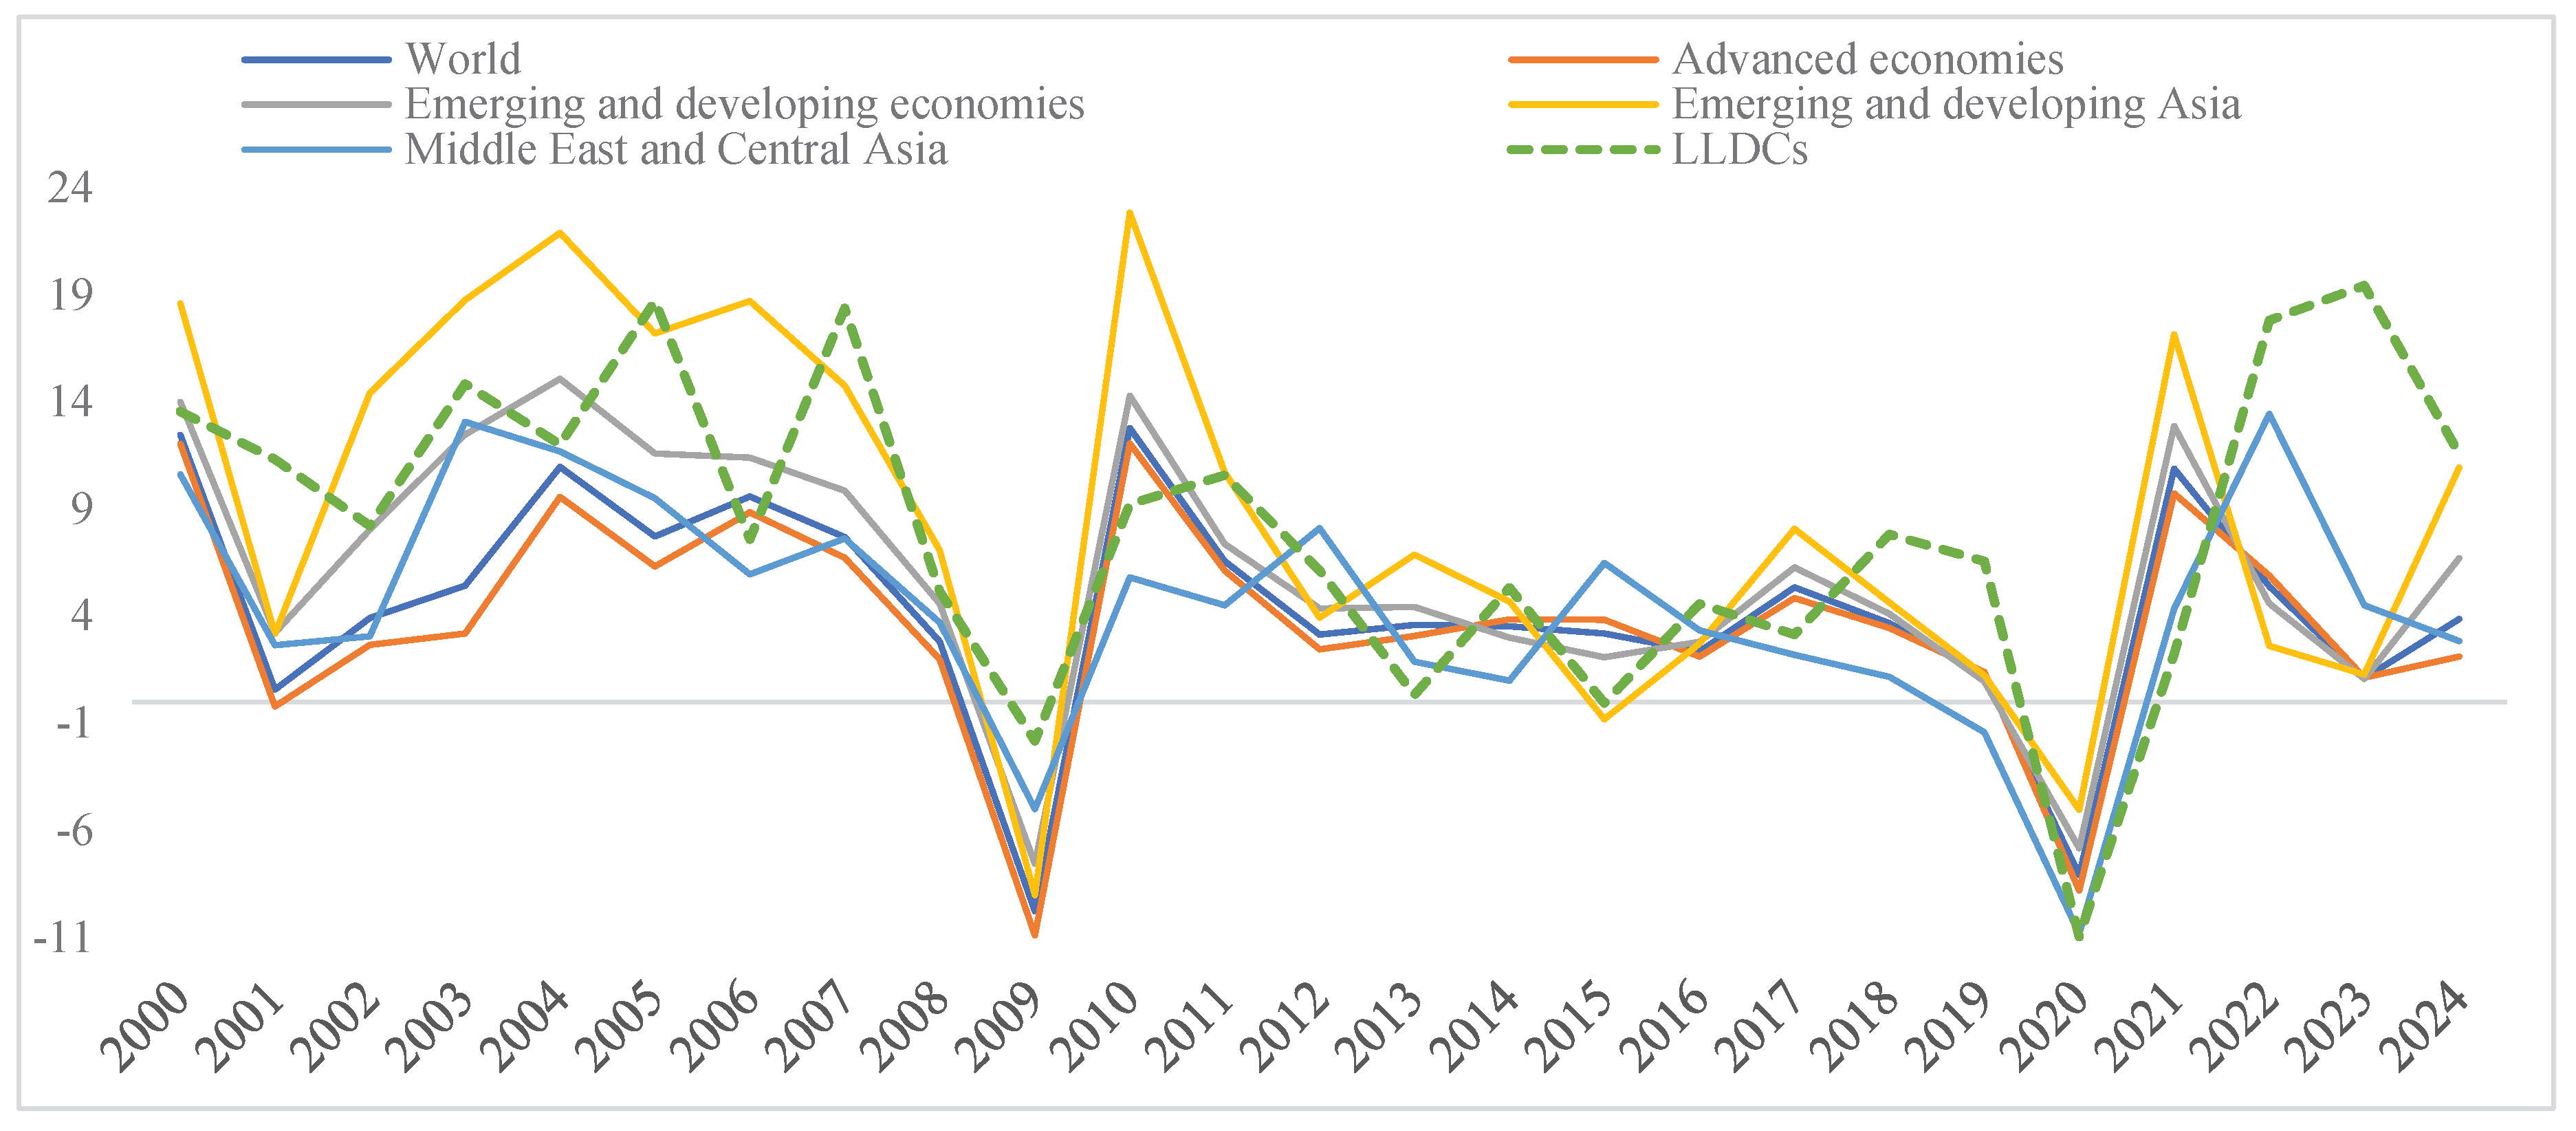
Table 1.
The share of China and USA in total export performances by Asian LLDCs.
| Country | China | USA | Country | China | USA |
|---|---|---|---|---|---|
| Afghanistan | 2.1 | 0.3 | Laos | 75.5 | 1.6 |
| Armenia | 8.4 | 0.0 | Mongolia | 91.4 | 1.1 |
| Azerbaijan | 0.0 | 0.0 | Nepal | 12.0 | 0.4 |
| Bhutan | 0.9 | 0.1 | Tajikistan | 27.6 | 0.0 |
| Kazakhstan | 18.3 | 2.4 | Turkmenistan | 69.6 | 0.1 |
| Kyrgyzstan | 3.3 | 0.0 | Uzbekistan | 5.8 | 0.7 |
Table 3.
Empirical results for the Baseline Gravity model under different specifications.
| Variables | OLS (Log-Log) | PPML (Baseline) | PPML+ Year FE | PPML+ Pair&Year FE | ||||
|---|---|---|---|---|---|---|---|---|
| Coef. | t-stat | Coef. | z-stat | Coef. | z-stat | Coef. | z-stat | |
| Intercept | -17.352 *** | -15.22 | -18.210 *** | -18.97 | -18.045 *** | -18.65 | -18.002 *** | -18.61 |
| LOG(GDPEX) | 1.716 *** | 21.31 | 0.962 *** | 19.42 | 0.947 *** | 19.05 | 0.950 *** | 19.10 |
| LOG(GDPIMP) | 0.522 *** | 13.18 | 0.406 *** | 11.97 | 0.402 *** | 11.86 | 0.398 *** | 11.75 |
| LOG(DISTANCE) | -1.258 *** | -25.44 | -0.887 *** | -23.50 | -0.873 *** | -23.15 | -0.865 *** | -22.91 |
| BORDER | 0.384 ** | 2.55 | 0.283 *** | 3.89 | 0.275 *** | 3.78 | 0.270 *** | 3.72 |
| COMLANG | 0.840 *** | 5.69 | 0.207 *** | 3.11 | 0.203 *** | 3.05 | 0.200* ** | 3.00 |
| Observations=2700 | Pseudo | Pseudo | Pseudo | |||||
Note: *** p < 0.01, ** p < 0.05, * p < 0.1; t-statistics (OLS) and z-statistics (PPML) are reported in parentheses. The OLS model is estimated in log-log form, whereas the PPML models are estimated at the level of exports. The PPML + Year FE specification includes year fixed effects, while the PPML + Pair & Year FE specification includes both country-pair and year fixed effects.
Disclaimer/Publisher’s Note: The statements, opinions and data contained in all publications are solely those of the individual author(s) and contributor(s) and not of MDPI and/or the editor(s). MDPI and/or the editor(s) disclaim responsibility for any injury to people or property resulting from any ideas, methods, instructions or products referred to in the content. |
© 2026 by the authors. Licensee MDPI, Basel, Switzerland. This article is an open access article distributed under the terms and conditions of the Creative Commons Attribution (CC BY) license (http://creativecommons.org/licenses/by/4.0/).
Copyright: This open access article is published under a Creative Commons CC BY 4.0 license, which permit the free download, distribution, and reuse, provided that the author and preprint are cited in any reuse.


