Submitted:
08 January 2026
Posted:
09 January 2026
You are already at the latest version
Abstract
PRRSV-2 represents a major threat to the swine industry. Canada is one of the world’s leading pork producers and a major trading partner of live pigs with the United States, yet PRRSV-2 evolutionary dynamics in these two countries are often studied independently, partly due to limited publicly available Canadian data. We analyzed more than 3,000 PRRSV-2 ORF5 sequences collected between 2000 and 2024 from five Canadian provinces. Thirteen distinct sub-lineages were detected in Canada, while approximately one-third of the sequences could not be assigned to any known sub-lineage. Phylogenetic analyses incorporating global reference sequences revealed that most unclassified sequences clustered into four distinct monophyletic clades, exhibiting genetic distances greater than 9.5% from recognized sub-lineages. We propose two new sub-lineages, 1K and 1L, cor-responding to clades that were prevalent and persistent over time, whereas the remaining two clades were rare and last detected in 2021. We reconstructed cross-border transmission histories and found that sub-lineages 1C, 1H, 1I, 1K, and 1L originated in Canada, whereas 1A, 1B, 1E, and 1F originated in the United States. Transmission patterns varied across sub-lineages, ranging from unidirectional to bidirectional movement. Our findings refine PRRSV-2 classification and provide insights to inform targeted surveillance, par-ticularly at national borders.
Keywords:
molecular epidemiology
; phylogeography
; transboundary
; viral evolution
; PRRSV-2
; Arterivirida
1. Introduction
Since its emergence in the late 1980s [1], Porcine reproductive and respiratory syndrome virus type 2 (PRRSV-2) has caused substantial losses to the swine industry globally. The virus is endemic in Canada, where annual losses are estimated at approximately $150 million dollars annually [2]. Canada is the seventh-largest pork producer in the world, accounting for 2% of global pork production with an estimated total of 2.1 million tons produced between 2024 and 2025 [3]. The Canadian swine herd is estimated at 13.9 million animals in 2025, distributed across 7,160 farms nationwide. Canada also plays a major role in the international swine trade. According to FAO data, in 2023 the country exported $3.1 billion in swine products and imported $3.9 billion [4]. Around 65% of the pork imported by the United States comes from Canada. In addition, the USA also imports live animals, with approximately 6.4 million pigs imported annually from Canada to the USA [5], underscoring the potential for cross-border dissemination of PRRSV-2 through animal movement and trade.
Betaarterivirus americense (Porcine Reproductive and Respiratory Syndrome Virus 2, PRRSV-2) belongs to the family Arteriviridae and is an enveloped, positive-sense single-stranded RNA virus. It has a 15 kb genome containing 10 open reading frames (ORFs). ORF1a and ORF1b encode genes involved in replication [6,7]. The 3' portion of the genome encodes eight structural proteins, including five glycoproteins (GP2, GP3, GP4, GP5, GP5a), envelope (E), matrix (M) and nucleocapsid (N). PRRSV infects macrophage and dendritic cells, affecting the regulation of the inflammatory response and the induction of the adaptive immune response [8]. The main consequences of PRRSV-2 infection include reproductive losses, abortions, the birth of weak piglets, and respiratory disease. [9].
PRRSV-2 exhibits remarkably high genetic diversity, driven by elevated substitution rates and frequent recombination. Substitution rates in regions encoding structural proteins range from 1.6 × 10⁻³ to 4.7 × 10⁻² substitutions per site per year [10,11,12], placing PRRSV-2 among the highest reported for positive-sense RNA viruses [13]. This accelerated molecular evolution contributes to the emergence of novel genetic variants, sometimes associated with perceived distinct phenotypic traits. Accurate classification of this genetic diversity is crucial for effective surveillance, epidemiological investigations, and the implementation of targeted biosecurity strategies [14]. Based on genetic distance and phylogenetic relationship of the ORF5 gene, PRRSV-2 has been classified into lineages, sub-lineages and variants [14,15,16,17,18,19]. To date, eleven lineages (L1–L11) have been formally described, which are further divided into 21 sub-lineages (e.g., 1A, 1B, 1C, etc.) [14,15,16,19]. In the USA context, sub-lineages are further divided into genetic variants for more fine-scale epidemiological tracking. From 2015 to date, 205 variants have been documented (https://stemma.shinyapps.io/PRRSLoom-variants/). The average genetic distance between lineages ranges from 9.1% to 17.2% [19]. Within lineages, the pairwise genetic distance between sub-lineage ranges from 6.9% to 14.7% [19]. Within sub-lineages, the average genetic distances between variants is ~5% (IQR 2.5–5.6%) [18].
Previous studies have reported that lineages 1 (L1), 2 (L2) and 5 through 9 (L5 - L9) have circulated in Canada [20,21,22]. Sequence analyses of samples collected between 1998 and 2016 showed that L1 was prevalent in Quebec and Ontario, while most sequences from Manitoba were vaccine-like, belonging to L5 and L8 [21,22]. Non-vaccine sequences were rarely detected in Manitoba, although only a limited number of sequences originated from this province [21,22]. Evidence points to Canada as a source of PRRSV-2 to USA; it has been suggested that PRRSV-2 L1 first emerged in Canada and was later imported into the USA [20,21]. Pamornchainavakul et al [20] provided a more recent overview of PRRSV-2 spatiotemporal dynamics in North America, providing further evidence that the L1 viruses circulating in the USA emerged in Canada and additionally providing evidence that certain L1 sub-lineages moved back from the USA to Canada. However, the number of Canadian sequences analyzed was limited to fewer than one hundred [20]. The limited number of publicly available PRRSV-2 sequences from Canada prevents us from obtaining a comprehensive view of the genetic diversity of PRRSV-2 in the country. More recently, Lambert et al explored the spatiotemporal dynamics of PRRSV-2 in Quebec, describing the presence of 38 genetic clusters, some of which were widely dispersed across the province and persisted for long periods, while others were more restricted to specific areas [23]. However, the placement of these clusters within the context of PRRSV-2 lineage and sub-lineage classification utilized lineages established using sequences from ≤2008 [14,24], which differs from the updated lineage classification system established by Paploski et al. and Yim-im et al. [16,19] that accounts for the more recent diversification of the virus (particularly lineage 1, which is predominant in the USA)[15,16].
A current and comprehensive overview of PRRSV diversity in Canada is presented here. A total of 3,000 ORF5 sequences were analyzed and classified using the global lineage classification system, allowing us to characterize the composition of Canadian viral populations. In addition, we mapped the spatial-temporal distribution of Canadian sub-lineages over a 24-year period (2000–2024). Finally, to gain insight into cross-border transmission patterns, we employed coalescent-based phylogeographic models to reconstruct the dispersal trajectories of sub-lineages shared between Canada and the United States. We focused our analysis of dispersal pathways solely on these two North American countries, as the United States and Canada are major trade partners.
2. Materials and Methods
2.1. Data Source
A total of 3,573 PRRSV-2 ORF5 sequences from Canada were provided by Demeter Services Vétérinaires inc. (Canada), which accounts for 20–30% of national swine production. These sequences span the years 2000 to 2024 and were sampled across five Canadian provinces: Quebec (n = 2,678), Ontario (n = 563), Manitoba (n = 316), Alberta (n = 11), and Saskatchewan (n = 5). To contextualize the diversity of PRRSV-2 circulating in Canada on a global scale, we analyzed the Canadian sequences alongside 78,496 ORF5 sequences representing worldwide diversity: 39,980 from GenBank (1990–2023, representing global diversity) and 35,162 from the Morrison Swine Health Monitoring Project (MSHMP) (1998–2024, representing USA diversity)[25,26]. Sequences lacking information on date or location (n = 13,986) or containing ambiguities or premature stop codons (n = 1365) were excluded from the analysis.
2.2. Sequence Classification, Estimation of Genetic Distances, and Sequences Filtering
The sequences were classified to lineage, sub-lineage and variant using the PRRS-Loom webtool [17]. Genetic distances among PRRSV-2 sub-lineages were calculated using the Sequence Demarcation Tool (SDT v1.2)[27], and expressed as the complement of the pairwise nucleotide identity (i.e., 100 − pairwise identity percentage). As our analyses were designed to focus on wild-type PRRSV-2, sequences with ≥95% identity to commercial vaccine strains were excluded [19]. For this purpose, ORF5 sequences assigned to vaccine-associated sub-lineages (5A, 7, 8A, and 8C) were compared with vaccine reference strains (Prevacent PRRS, KU131568; Ingelvac PRRSV MLV, AF066183.4; Prime Pac PRRSV RR, DQ779791.1; Ingelvac PRRSV ATP, DQ988080.1; and Fostera PRRSV, AF494042). Following the application of all filters, a total of 42,808 ORF5 sequences were retained for analysis, comprising 2,361 from Canada, 13,110 from GenBank, and 27,337 from the MSHMP (Supplement figure S2A). This dataset was divided into lineage-specific sets for further analysis.
2.3. Dataset Down-Sampling
Many of the analyses performed in this study are computationally intensive. To reduce computational burden, we adopted the spatiotemporal stratified subsampling methodology tested by Pamornchainavakul et al [20]. This approach aims to equalize the number of samples included from each region/year. To ensure the consistency and reproducibility of our results, we repeated the subsampling process five times, resulting in five distinct datasets per lineage (Supplement figure S1 and S3-S8), each of which were used to perform the subsequent analyses[20]. All sub-samplings were performed with replacement. Sub-sampling was conducted using TreeTrimmer [28], which utilizes a phylogenetic tree to estimate genetic distances based on branch lengths. To assess consistency, we compared the results obtained from each of the runs conducted on the individual subsets. Below, we detail each of the subsets constructed for specific analyses.
Down-sampling for recombination analysis:
Evidence of recombination that may have occurred in the Canadian sequences was investigated at different levels: within sub-lineages and between sub-lineages. To infer evidence of recombination within sub-lineages, the dataset was stratified by sub-lineage, and subsampling was performed as described above. Each resulting subset was then scanned for evidence of recombination (see Recombination Analysis). To reduce computational cost, the number of sequences in each sub-lineage-specific subset was limited to 600 (Supplement figure S1). For inter-lineage recombination investigation, we assembled a dataset in which at least 15 representative sequences from each sub-lineage circulating in Canada were present. In addition, at least 15 sequences were selected from each of the 21 recognized sub-lineages (Supplement figure S2C). The sequences were selected based on their geographic and temporal distribution, as well as their representation of the genetic diversity within each sub-lineage. The subsampling procedure was repeated five times, and each individual subset was subsequently screened for recombination
Down-sampling for Phylogeographic analysis:
To infer the geographic origin and determine the spread pathways for each sub-lineage, the dataset was stratified by sub-lineage, and subsampling was then performed using the strategy described above. Sequences were down-sampled ensuring representation of genetic diversity, spatial distribution, and temporal distribution. In the end, we obtained five datasets for each sub-lineage, each containing up to 500 sequences (Supplement figure S1 and S3-S8). Exceptions were made for sub-lineages with fewer than 500 sequences available in our database; for these, subsampling was not necessary (Supplement figure S1 and S8). These datasets were then used to reconstruct the spatiotemporal trajectories of each sub-lineage (see Phylogeographic Analysis).
Down-sampling for Estimation of Divergence Times:
To estimate the divergence time of the ORF5 gene for the two newly identified sub-lineages and the two undetermined Canadian clades, we employed the same subsampling strategy described in the previous section. We selected sequences from each sub-lineage belonging to lineage 1, along with four additional novel Canadian clades (Supplement figure S2D). Our subsampling aimed to capture genetic diversity, as well as geographical and temporal representativeness.
2.4. Phylogenetic Analysis
We constructed a comprehensive phylogenetic tree comprising 6,399 sequences representing the global diversity of PRRSV-2 (Supplement figure S2B). All 2,361 wild-type sequences from Canada, were included in their entirety, while the remaining global sequences were subsampled using TreeTrimmer [28]. These additional sequences were drawn from a global dataset that included GenBank and MSHMP data. Subsampling was guided by representativeness in terms of genetic diversity, as well as geographic and temporal distribution. The phylogenetic trees were reconstructed using RAxML-NG [29] with the nucleotide substitution model determined by ModelTest-NG based on the Akaike Information Criterion [29]. The resulting phylogenetic trees were annotated with sub-lineage assignments generated by the PRRS-Loom classification webtool, as described in the previous section. Tree annotation was carried out using Microreact [30], enabling visualization of each sub-lineage’s taxonomic position and resolving the phylogenetic placement of Canadian sequences that were not assigned to any previously described sub-lineage, i.e., returned as “undetermined” by PRRS-Loom. Finally, a phylogenetic tree was reconstructed containing only reference sequences (anchors) defined by Paploski et al. 2019 [16] and Yim-im et al. 2023 [19], along with the anchor sequences selected for the new sub-lineages established in this study. Fifty sequences from each clade representing proposed sub-lineages were selected using TreeTrimmer, prioritizing representativeness of each group’s genetic diversity.
2.5. Recombination Analysis
Down-sampled alignments for each sub-lineage (to assess intra-lineage recombination) and the multi-lineage dataset (inter-lineage recombination) were scanned for recombination using seven different methods: Rdp[31], Geneconv [32], Bootscan [33], Maximum χ2 [34], Chimaera[35], Siscan [36] and 3Seq [37], all implemented in the RDP5 program [38] using default parameters. Recombination events were considered reliable only when statistically supported by at least four different methods with p-values below 0.05.
2.6. Phylogeographic Analysis
Phylogeographic analyses were conducted after the removal of sequences with evidence of recombination. Sequences in the US were attributed to tree geographic regions (defined by the Swine Health Information Center (SHIC) based on the US swine density): Midwest (defined by SHIC as Region 3), Southwest (Region 2), and Eastern USA (Regions 4 and 5 combined) [39]. We focused our investigation on these regions because they represent the areas with the greatest data availability and the highest relevance for swine production. Regions 4 and 5 were analyzed jointly, owing to the limited number of sequences available from Region 4, which reflects the comparatively lower swine production in this area. For Canadian sequences, we employed official geopolitical demarcations, with regions corresponding to provinces. The analyses were conducted individually for each of the five down-sampled subsets (see above) for each sub-lineage. Phylogenetic trees were reconstructed using RAxML-NG [29] with the nucleotide substitution model determined by ModelTest-NG based on the Akaike Information Criterion [29]. Evidence for temporal signal was evaluated through root-to-tip regression on ML phylogenetic trees using TempeEst [40]. To infer sub-lineage origin, i.e., the location of the most recent common ancestor, and to determine patterns of spread, we utilized discrete-space phylogeographic models using BEAST v1.10.4 [41]. We employed the GTR+I+G substitution model, which was determined using ModelTest-NG [29], and an uncorrelated relaxed clock with a log-normal distribution, which was identified as the best molecular clock model based on the Bayes factor estimated from the difference in maximum likelihood between competing molecular clock models [42,43]. We used a non-reversible CTMC for the asymmetric discrete trait substitution model [44]. The coalescent model applied was the Bayesian Skygrid’s Gaussian Markov Random Field (GMRF) [45]. The analyses were performed with a Markov chain Monte Carlo (MCMC) chain length of 3 × 10⁸ iterations. Convergence was evaluated using Tracer based on the effective sample size (ESS > 200) and the degree of independence between samples [41]. The phylogenetic trees were summarized as a Maximum Clade Credibility (MCC) tree in TreeAnnotator, discarding the initial 10% of the chains as burn-in [46]. Based on the results of the discrete space model, we estimated the number of transitions between pairs of regions using the relative transition rates and the BSSVS indicators. For each pair of regions, the number of transitions was calculated as the median of the relative transition rates, weighted by the mean tree length and the average substitution rate. As the analyses were performed in five subsampled datasets, the final number of transitions was estimated based on the average across the five runs.
2.7. Estimation of Divergence Times
To estimate the time to the most recent common ancestor (tMRCA) and the nucleotide substitution rate, we used the Bayesian Markov chain Monte Carlo (MCMC) method implemented in BEAST v1.4.10 [41]. The nucleotide substitution model (GTR+I+G) was selected using ModelTest-NG [29], and an uncorrelated lognormal relaxed molecular clock was applied based on log10 Bayes Factor comparison [42]. The analyses were run for 3 × 10⁸ MCMC iterations. Convergence was assessed in Tracer based on effective sample sizes (ESS > 200) and the degree of independence between samples. Phylogenetic trees were summarized using the Maximum Clade Credibility (MCC) tree in TreeAnnotator, with the first 10% of trees discarded as burn-in [46].
3. Results
3.1. Assignment of Sub-Lineages and Variants
A total of 3,573 ORF5 sequences collected between 2000 and 2024 from five Canadian provinces were analyzed. The distribution of sequences was as follows: Alberta (n = 11), Manitoba (n = 316), Ontario (n = 563), Quebec (n = 2,678), and Saskatchewan (n = 5). The median annual number of sequences per year was 143 (interquartile range [IQR]: 72–220); during the first five years, the annual number of sequences remained below 50 (Figure 1B). For context, according to the Canadian Department of Agriculture, the swine population in 2023 was estimated at approximately 13.9 million animals, with 81% concentrated in three provinces: Quebec (31%), Ontario (26%), and Manitoba (24%)[3].
In total, we identified five lineages (1, 5, 7, 8 and 9), subdivided into 13 sub-lineages (1A, 1B, 1C, 1E, 1F, 1H, 1I, 1J, 5A, 7, 8A, 8C and 9A) (Figure 1a). A substantial number of the analyzed sequences (n=954) were “undetermined” at the lineage level, representing 26.7% of the Canadian sequence set. Due to their high divergence from the lineage reference sequences used by PRRS-Loom, the model was unable to assign them to any known sub-lineage. At the genetic variant level, only 8 previously described variants (1C.23, 1E.1, 1F.1, 1I.1, 5A.1, 7.1, 8A.1 and 8C.1) were identified in the Canadian dataset, with a large portion of the sequences labeled as unclassified variants. Interestingly, some sequences for which sub-lineage could not be determined were classified as variant 1C.23 (89). The 1C.23 variant appears to be highly diverged from other sequences within sub-lineage 1C.
3.2. Phylogenetic Analyses and Sequence Comparisons Warrant Two New PRRSV-2 Sub-Lineages
After filtering out vaccine-like sequences (n = 1,211, representing 33.89% of the dataset), a total of 2,361 wild-type PRRSV-2 sequences from Canada were retained. Of these, 954 could not be assigned to any recognized sub-lineage. To better understand the relationship of sequences with undetermined lineage (n=954) with recognized lineages, we constructed an ORF5 phylogenetic tree incorporating Canadian sequences alongside representative sequences from the 11 previously described lineages [19]. For the dataset representing these 11 lineages (21 sub-lineages), we included the reference sequences described by Paploski et al. (2021) [15] and Yim-im et al. (2023) [19], henceforth referred to as anchor sequences. In addition to the anchor sequences, for each lineage, a subset of ORF5 sequences available in GenBank and MSHMP was also included to obtain a more comprehensive representation of the genetic diversity of the 11 sub-lineages. In total, 6,399 sequences were used to reconstruct the phylogenetic tree (Figure S10).
The majority of the described sub-lineages formed highly supported monophyletic clades (Supplement Figure S10). Interestingly, the 1C and 1H sub-lineages from Canada clustered into separate monophyletic branches from other sequences of the same sub-lineages, suggesting that Canadian 1H and 1C sequences are genetically distinct from the 1C and 1H viruses circulating in the rest of the world (Supplement Figure S10B). This likely indicates that 1C and 1H circulating in Canada are undergoing local differentiation with minimal viral exchange with other countries. 954 Canadian sequences were undetermined at the lineage level, and 646 of these clustered into four monophyletic clades with strong branch support (bootstrap > 99), here referred to as Undetermined 1 (55 sequences), Undetermined 2 (49 sequences), Undetermined 3 (239 sequences), and Undetermined 4 (303 sequences). This suggests that these sequences may represent previously undescribed sub-lineages. The four undetermined clades clustered near sub-lineage 1F, indicating they possibly share a common ancestor with this group (Figure 2 and Supplement Figure S10).
To further investigate whether the four undetermined monophyletic clades should be allocated to new sub-lineages, we performed sequence comparisons to estimate the genetic distance between the four undetermined clades and all 21 previously described sub-lineages. These comparisons were performed with all available sequences, without employing any subsampling.
Undetermined-4 was most closely related to Undetermined-1 (mean genetic distance: 10.3%, IQR: 9.4–11.1), followed by 1F (11.1%, IQR: 10.3–11.9) and Undetermined-2 (11.3%, IQR: 10.4–12.5); distances to all other sub-lineages exceeded 11.8% (Figure 3, Table S1). A similar pattern was observed for Undetermined-3, which also was most closely related to Undetermined-1(10.8%, IQR: 9.6–11.8), followed by 1F (11.6%, IQR: 10.4–12.6) and Undetermined-4 (12.1%, IQR: 11.1–13.1), with all other distances >13% (Figure 3, Table S1). Consistent with these findings, Undetermined-1 was most closely related to Undetermined-2 (9.1%, IQR: 8.3–9.9), then 1F (9.5%, IQR: 8.7–10.3) and Undetermined-4 (10.3%, IQR: 9.4–11.1) (Figure 3, Table S1). Finally, Undetermined-2 mirrored this relationship, being most similar to Undetermined-1 (9.1%, IQR: 8.3–9.9), followed by 1F (10.9%, IQR: 10.1–11.9) and Undetermined-4 (11.3%, IQR: 10.4–12.5). Intra-clade distances further support their distinctiveness, with mean genetic distances of 6.5% (IQR: 4–9.4) for Undetermined-4, 10.4% (IQR: 7.6–12.1) for Undetermined-3, 5.3% (IQR: 3.8–6.5) for Undetermined-1, and 6.5% (IQR: 3.6–8.1) for Undetermined-2 (Table S1). These values reinforce that the four clades found in Canada are highly divergent from other sub-lineages while also exhibiting considerable internal diversity.
Based on the frequency of each undetermined clade, their persistence over time, and their genetic distinctiveness, we propose the establishment of two new PRRSV-2 sub-lineages within L1 to accommodate two of the four undetermined clades: sub-lineage 1K, comprised of the 303 sequences in the Undetermined-3 clade, and sub-lineage 1L (239 sequences), comprised of the Undetermined-4 clade. Undetermined clades 1 and 2 represent approximately 1.6% and 1.4% of the sampled sequences in Canada and were last identified in our dataset in 2015 and 2021, respectively (Figure 2). Therefore, we believe that the creation of new sub-lineages to classify rare clades that are no longer circulating is not justified. However, we should not rule out the possibility of the future re-emergence of these clades.
Interestingly, one of the two of the newly proposed sub-lineages, 1L, and the other two undetermined clades appear to circulate exclusively in Canada (Supplement Figure S10B, Table S3). On the other hand, 1K has been detected previously in the USA (Supplement Table S3), with sequences being placed in as divergent clade of sub-lineage 1C (variant 1C.23). These findings suggest that the classification of variant 1C.23 should be revised, with those sequences being reassigned to sub-lineage 1K, as new data reveals that it belongs to sub-lineage 1K rather than 1C.
As part of the establishment of the new sub-lineages, we selected 50 anchor sequences for sub-lineages 1K, 1L and 1H to represent the genetic diversity within each group (GenBank accession numbers PV179105 to PV179253, PV179365 to PV179414). Finally, we reconstructed a phylogenetic tree containing only the anchor sequences, representing the 21 previously described sub-lineages along with the two newly proposed sub-lineages, as well as the two remaining undetermined clades, Undetermined 1 and Undetermined 2. The anchor-based tree (Figure 2) mirrored the topology of the global PRRSV-2 phylogeny (Supplement Figure S10).
3.3. Establishment of New PRRSV-2 Genetic Variants
To create a systematic and unified nomenclature across the USA and Canada for denoting genetic variants of PRRSV-2 below the sub-lineage level, the Canadian PRRSV-2 sequences were assigned to either existing or new variants following the criteria for genetic variants and naming conventions used in the USA [17,18] and widely adopted by USA diagnostic labs and monitoring programs to facilitate communication between producers, practitioners, diagnostic labs, and disease monitoring programs [17,18]. Briefly, variants are defined by identifying phylogenetic clusters in the tree consisting of at least 5 sequences with mean patristic distances <7%, and with bootstrap values >85 for the ancestral node in the phylogeny [17,18]. Using this criteria, two new variants within 1C were established, 1C.41 and 1C.42. Of the 97 Canadian sequences assigned to lineage 1E, only 20 were attributed to a previously described variant (variant 1E.1) found in the USA. To accommodate Canadian 1E sequences, variants 1E.10 through 1E.12 were created. In contrast, none of the 1H variants present within the USA were detected in Canada. Thus, for 1H, we established new variants 1H.36 to 1H.49 to cover the diversity found in Canada. For 1K, we created 1K.1 to 1K.4, which include the former 1C.23 variant, and finally, to accommodate 1L, variants 1L.1 to 1L.4 were created. The average genetic distance within sequences belonging to the same variant ranges 0.33 to 8.29% with a median of 3.31% (Supplement table S4), and the average distance from the most closely related variant ranges 5.63 to 10.91% (Supplement table S4). Some sequences remain unclassified due to uncertainties in properly positioning them within the classification because they represent poorly resolved phylogenetic subgroups (low bootstrap values) or due to a lack of closely related sequences in sufficient numbers to support the creation of new variants.
The sub-lineages and variants presented in this manuscript have been incorporated into the PRRS-Loom webtool so that end-users can determine the classifications of their own sequences (sub-lineages: https://stemma.shinyapps.io/PRRSLoom/; variants: https://stemma.shinyapps.io/PRRSLoom-variants/).
3.4. Evidence of Intra-Sub-Lineage Recombination was Detected in a Small Number of 1K and 1L Sequences
We did not find evidence suggesting that sub-lineages 1K and 1L emerged as a result of recombination on the ORF5 gene. Based on the ORF5 gene, evidence of inter-lineage recombination was not detected in the Canadian PRRSV-2 population. Evidence of recombination was only found within sequences of the same sub-lineage, but only for a small number of sequences within sub-lineages 1K and 1L. Two recombination events were detected, one involving 27 sequences in 1L, and the other one in 1K, evidenced in only one sequence (Supplement Table S2).
3.5. Differential Spatial Distribution of Sub-Lineages
Variation in the spatial distribution and abundance of PRRSV-2 sub-lineages was observed across Canadian provinces. A total of 13 distinct sub-lineages were identified in Quebec (1B, 1C, 1E, 1F, 1H, 1I, 1K, 1L, 5A, 7, 8A, 8C, and 9A), making it the province with the highest sub-lineage diversity. In Quebec, sub-lineage 1H was the most abundant (n=908, representing 33.9% of Quebec sequences), followed by the vaccine-like sub-lineage 5A (n=664, 24.8%), 1L (n=304, 11.3%), and 1K (n=141, 0.05%) (Supplementary Figure S9). Notably, sub-lineage 1L and the undetermined clades 1 and 2 were detected exclusively in Quebec.
In Ontario, eight distinct sub-lineages were identified in the province (1B, 1E, 1F, 1H, 1I, 1K, 5A, and 8A). 1H was also the most prevalent sub-lineage (n=156, representing 27.7% of Ontario sequences), followed by 5A (n=133, 23.6%), 1K (n=97, 17.2%), and 1E (n=89, 15.8%) (Supplementary Figure S9 and Table S3). In Manitoba, a total of four sub-lineages were detected. Among them, 1K was the only wild-type sub-lineage found in this province. The others, 5A, 8A, and 8C, were vaccine-related, showing less than 5% genetic divergence from vaccine strains, corroborating previous findings that PRRSV-2 strains circulating in Manitoba are predominantly closely related to vaccine strains [21,22]. In Alberta, sub-lineage 1A (n=6) and vaccine-associated 5A (n=5) were detected, while in Saskatchewan, all five sampled sequences belonged to sub-lineage 5A. Sub-lineage 1A was found exclusively in Alberta.
Spatial distributions should be interpreted with caution because the number of Canadian sequences analyzed per province did not necessarily mirror the distribution of the swine population across provinces, as some provinces are overrepresented relative to others. While Quebec accounts for 31% of the national swine herd, it contributed 74% of the sequences. Ontario, with 26% of the national swine herd, contributed 15% of sequences; Manitoba, representing 24% of the swine population, contributed 8%; Alberta accounts for 10% of the herd but contributed only 3% of the sequences; and Saskatchewan, which holds 8% of the swine population, accounted for just 1.3% of the sequences. This pattern suggests one of two possibilities: either PRRSV-2 prevalence outside Quebec is lower, or that our dataset has a more limited ability to capture sequences from regions outside Quebec. As a result, our capacity to assess viral diversity in regions beyond Quebec, especially during the first decade of the study, may be disproportional.
3.6. Quebec and the USA Midwest are Potential Hubs for the Dispersal of PRRSV-2 sub-Lineages Between Canada and the United States:
Canada and the USA share a border and engage in animal trade [5], which serves as a pathway for the spread of PRRSV-2 between the two countries [20,21]. To investigate the geographic origins of ancestral populations of each wild-type sub-lineage and patterns of spread between the two countries, we conducted a discrete-space phylogeographic analysis, considering four Canadian provinces (Quebec, Ontario, Alberta, Manitoba) and three USA regions: the Midwest, the Eastern USA, and the Southwest. Other Canadian provinces and USA regions were not considered due to lack of data. For this analysis, only sub-lineages identified in these two countries were analyzed. Sub-lineages related to modified live vaccine strains were not analyzed, as these sub-lineages are repeatedly seeded to different areas through vaccine use [21].
Our analysis indicates that the Canadian province of Quebec, along with the USA Midwest are key regions where certain sub-lineages originated. Specifically, sub-lineages 1C, 1H, 1I, 1K, 1L, as well as the undetermined clade 1 and clade 2, appear to have originated in Quebec (Figure 4, Figure 5 and Figure 6 S10 and S11). Sub-lineages 1A, 1B and 1E, originated in the USA Midwest, consistent with previous findings (Figures S13, 7, 8) [20], and were introduced to Canada. Sub-lineage 1L, as well as the undetermined clades 1 and 2, were restricted to Canada.
Our results indicate that the common ancestor of sub-lineage 1H viruses circulating in the USA and Canada was in Canada, specifically in the province of Quebec (Figure 4A). 1H spread from Canada to the USA, with both Ontario and Quebec as source regions for introduction events into USA (Figure 4B and 4C). The earliest introduction event appears to have occurred before 2010 (Figure 4A). A total of ~3.7 transitions from Quebec and ~17.5 from Ontario to the Midwest were inferred (Figure 4B). At the intra-country level, we also observed bidirectional dispersion dynamics of 1H between Quebec and Ontario (Figure 4B and 4C).
Sub-lineage 1K emerged in Canada and subsequently spread to the USA Midwest (Figure 5C), with five introduction events apparent in the consensus phylogenetic tree (Figure 5A). However, because this is a consensus tree, some possible transition events identified in the analysis did not appear in the tree. In total, ~6.8 transition events between Ontario and the USA, and ~3.6 transitions between Quebec and Midwest were detected (Figure 5B). Most of these events occurred in the 2020s, though there was one introduction that occurred in the early 2010s (Figure 5A). However, 1K occurred at low frequencies in the USA, suggesting that it has yet to become established in the country. Some 1K sequences from the USA lacked precise regional information, making it difficult to determine their internal dispersion patterns within the country. Within Canada, bidirectional movements of 1K were observed between Quebec and Ontario, as well as dispersal from Ontario to Manitoba.
The dispersion patterns of 1C between Canada and the USA were unidirectional. 1C was introduced from Quebec to the Midwest of the USA (Figure 6B and 6C). Additionally, the dispersion of 1C from Quebec to Ontario was observed. Approximately 4.8 transitions were identified from Quebec to the Midwest, with the earliest transition likely occurring around 2004 (Figure 6A and 6B).
Sub-lineage 1E exhibited a complex dynamic with multiple introduction events from the USA into Canada (Figure 7). The Midwest and Eastern USA were identified as potential sources of dispersal from the United States to Canada (Figure 7B and 7C). Local dispersal events were also observed within Canada, specifically from the province of Ontario to Quebec (Figure 7B and 7C). Additionally, we found evidence of reintroductions from Canada into the United States, including from Manitoba to the Midwest and from Quebec to the Eastern USA (Figure 7B and 7C). Our results indicate that the earliest introduction event of 1E in Canada occurred in the early 2000s in Ontario. All of the additional introduction events between the two countries appear to have taken place throughout the first two decades of the 2000s (Figure 7A).
Sub-lineage 1B also followed a unidirectional dispersal pattern between the two countries, having been introduced into Quebec and Ontario as separate introductions from the USA Midwest (Figure 8B and 8C). The absence of evidence for inter-provincial transmission within Canada suggests that these introduction events in Ontario and Quebec may have been independent (Figure 8B and 8C). Our inferences suggest that the introduction events likely occurred between 2005 and 2010 (Figure 8A).
The number of available 1I sequences was very limited, with only 46 sequences in total, all which date to before 2010. We reconstructed the spread pathway of sub-lineage 1I (Supplementary Figure S11), which exhibited a pattern of exportation and reintroduction between Canada and the USA, initially migrating from Quebec to the USA Midwest, and subsequently from the Midwest back to Ontario (Supplementary Figure S11B, and S11C). The introduction events in the USA occurred in the late 1990s and early 2000s (Supplementary Figure S11A).
In contrast to previously reported findings [20], our analyses suggest that 1F originated in the Midwest region of the United States rather than in Canada and was introduced into Quebec (Supplementary Figure S12A). However, we believe that this discrepancy may be because our analysis only included 1F sequences, whereas the previous work showing a Canadian origin of 1F included older unclassified lineage 1 sequences that were circulating in Canada and that may have been ancestrally related to 1F. From Quebec, 1F likely dispersed to Ontario (Supplementary Figure S12B and S12C). Other early work on Lineage 1 PRRS suggest a Canadian origin of older sub-lineages such as 1F [14].
Finally, we reconstructed the spread pathways for sub-lineage 1A. 1A exhibited a unidirectional dispersal pattern between countries, originating in the United States and being introduced into Canada only in Alberta, where it remained confined and was only detected by six sequences (Supplementary Figure S13B and S13C). The introduction of 1A in Alberta appears to have occurred between 2007 and 2010 (Supplementary Figure S13A).
3.7. Age of Sub-Lineages 1K, 1L, and Undetermined Clades
To determine the emergence time of new sub-lineages and undetermined clades, we reconstructed a single time-scaled phylogenetic tree with all of lineage 1 viruses (Figure 9). The estimated substitution rate per site per year was 9.63 x 10⁻³ (95% HPD: 8.77 x 10⁻³ to 1.10 x 10⁻²), which aligns with estimates reported in previous studies [10]. 1K emerged in Canada around 1995 (95% HPD: 1992–1996, table 2). 1L emerged in approximately 2001 (95% HPD: 2000-2004, table 2). The two undetermined clades, Undetermined 1 and Undetermined 2, emerged almost simultaneously, the first in ~2000 (95% HPD: 1998-2003) and the second in ~2001 (95% HPD: 1998-2004) (table 2). These dates align well with the notion that most current sub-lineages resulted from evolutionary diversification in the 1990s [20].
4. Discussion
PRRSV-2 remains one of the major threats to the swine industry. Its rapid evolutionary dynamics, driven by high rates of mutation and recombination, continually drive the emergence of new genetic variants and pose significant challenges to control efforts [11,12,15,47,48,49,50]. Although substantial progress has been made toward classifying and organizing PRRSV-2 diversity [14,15,17,18,19], our understanding remains fragmented due to uneven regional sampling and the limited availability of genomic data in public repositories. To partially address this gap and expand our understanding of PRRSV-2 diversity, we analyzed more than 3,000 ORF5 sequences from Canada. Our results reveal that Canada harbors distinct PRRSV-2 diversity. We also describe two new sub-lineages designated as 1K and 1L. Phylogeographic analyses indicate clear patterns of geographic structuring, suggesting that viral populations circulating in Canada are, to some extent, distinct from those in the United States, likely reflecting local diversification following introduction events. Moreover, our analyses corroborate previously reported emergence and dispersal patterns and provide further evidence that sub-lineages 1C and 1H emerged in Canada, while Lineages 1B, 1E, and 1A originated in the USA [20].
The identification of two new sub-lineages, 1K and 1L, represents a significant advance in expanding our understanding of the global diversity of PRRSV-2 and highlights how much remains to be uncovered before a comprehensive picture of this pathogen’s evolution can be achieved. Sub-lineages 1K and 1L form well-supported, highly divergent monophyletic clades (>11% mean nucleotide divergence) that have circulated in Canadian herds for over a decade, yet had remained unrecognized in global classification schemes.
In a previous study, Lambert et al. [22] characterized the diversity of PRRSV-2 in Canada, contrasting the composition of Canadian PRRSV-2 diversity with a subset of reference sequences representing lineages L1 through L9 as defined by Shi et al. [14], which described global diversity at that time (2008). Lambert et al. [22] reported a distinct monophyletic clade within lineage L1 that appeared to be endemic to Canada, first detected as early as 2007 and continuously expanding thereafter [22]. Interestingly, the oldest sequences of 1K and 1L analyzed here date from the same period as this highly divergent L1 cluster described by Lambert et al. [22]. However, any correspondence between these genetic clusters and our newly proposed sub-lineages was not possible, as reference sequences from the clades described by Lambert et al. are not publicly available. In our study, we adopted the nomenclature and classification framework proposed by Paploski et al. and Yim-im et al. [15,19] to name these newly identified sub-lineages. This system has become widely used in the United States and internationally [51,52,53], promoting greater consistency in PRRSV-2 lineage definitions. Recognizing, naming, and standardizing PRRSV-2 lineages is more than a taxonomic exercise, it is a necessary step toward building a coherent global framework that enables clear communication among stakeholders, improves the interpretation of epidemiological connections, supports coordinated regional and international control efforts, and helps prevent the reintroduction or undetected spread of previously absent viral groups.
Our phylogeographic analyses revealed clear patterns of geographic structuring between PRRSV-2 populations from Canada and the United States, evidenced by distinct separations among viral populations from the two countries. In some cases, this structuring was particularly pronounced, as observed for sub-lineages 1H and 1C, which formed two well-supported monophyletic clades largely restricted to one country, suggesting infrequent viral exchange between Canada and the U.S. for these groups.
The restricted geographic distribution and infrequent cross-border movements observed for sub-lineages 1C and 1H can be readily explained by the timing of their emergence. Most of the introduction events detected between Canada and the United States occurred before the 2010s, when neither 1C and 1H had yet expanded substantially in either country. The expansion of 1C in the United States began toward the end of the first decade of the 2000s, whereas 1H only became widespread after 2010 in both countries [15,16,20]. A plausible explanation for the limited evidence of more recent introductions is that strengthened biosecurity measures related to animal movement may now play a key role in restricting cross-border transmission. However, we did not have access to detailed data to formally evaluate this hypothesis.
For the other sub-lineages, clustering by geographic location was still apparent, although not as clearly dichotomous as that observed for 1H and 1C. This pattern suggests comparatively higher levels of cross-border viral exchange and more occasional introductions between Canada and the United States than those inferred for 1H and 1C. Sub-lineage 1K exhibited evidence of multiple importation events from Canada into the United States, though it does not appear to have become well established there. In contrast, the phylogenies of sub-lineages 1B and 1E suggest more frequent bidirectional spread across the border. Sub-lineage 1A, although widespread in the United States, was detected only at very low frequency in Canada (n = 6) and exclusively in the province of Alberta. This lineage became prevalent in the U.S. around 2014 [16], and its limited presence in Canada may reflect localized introduction events. Finally, sub-lineage 1F appears to have originated in the U.S., in contrast to earlier reports suggesting a Canadian origin [20], introducing some uncertainty regarding its true geographic source. Precise conclusions regarding the movements of 1I and 1A between the two countries are constrained by the representativeness of the available dataset; 1I appears to have ceased circulating in both countries after 2010, with only a few sequences detected.
Overall, our findings support a scenario in which PRRSV-2 Lineage 1 was initially introduced into the United States through imports from Canada, subsequently diversified locally, and certain sub-lineages were later reintroduced into Canada, consistent with observations from previous studies [5]. Most introduction events from Canada to the United States appear to have occurred in the late 1990s and early 2000s, with the exception of more recent introductions of 1K during the 2020s, which may suggest failures in biosecurity protocols.
The U.S. imports approximately 6 million live pigs from Canada each year, whereas Canada imported a total of only 82,137 pigs from the U.S. over the entire 2000–2024 period [5]. Considering this asymmetry, it is reasonable to expect that introductions of PRRSV-2 from the United States into Canada via infected pigs are possible but likely occur at a much lower frequency than in the opposite direction. Additionally, this lower risk is particularly evident given that 41.8% of pigs imported into Canada during this period were breeding animals, which likely originated from high-biosecurity premises with active PRRSV monitoring [5]. In the early 2000s, there was a substantial increase in the trade of live pigs between the two countries, which is consistent with the timing of most PRRSV-2 sub-lineage exchanges inferred from our phylogeographic analyses [5].
In contrast, 73.3% of pigs exported from Canada to the United States over the past 24 years were feeder pigs weighing less than 50 kg, populations typically managed under lower biosecurity and biocontainment conditions after arrival in the U.S [5]. These movement patterns help explain the greater number of inferred lineage transitions from Canada to the United States observed in our phylogeographic analyses. Most Canadian imports from the U.S. occur through northern and central states, supporting our inference that the central U.S. represents a key source region for PRRSV-2 introductions into Canada.
Additional introduction routes may also contribute to cross-border transmission. Trucks transporting animals can act as mechanical vehicles for PRRSV-2 [54], and imported semen has been identified as another potential pathway [55], although boar studs are generally subject to strict biosecurity and continuous PRRSV surveillance. It is also possible that other uncharacterized routes play a role, underscoring the complexity of PRRSV-2 transmission dynamics across national borders.
Despite providing one of the most comprehensive assessments of PRRSV-2 diversity in Canada to date, our study has several limitations that should be acknowledged. Although our dataset encompasses the five provinces responsible for more than 97% of Canadian swine production, there is a sampling imbalance among regions, particularly in Alberta and Saskatchewan, which together account for nearly 18% of national production [3]. This uneven representation may reflect genuinely lower PRRSV-2 prevalence outside Québec and Ontario, but it also likely stems from the origin of our dataset, which was largely derived from a major swine health clinic with fewer clients in other provinces, especially in earlier years. Consequently, early introduction and transition events may be underrepresented, limiting our ability to fully reconstruct the timing and geographic context of sub-lineage emergence.
Given the large volume of data used for phylogenetic inference, conducting full-scale analyses was computationally prohibitive. Therefore, we were required to perform subsampling of our dataset, a process that inherently carries the risk of introducing bias if not carefully executed. To minimize such artifacts, subsampling was conducted at least five times for each dataset, with replacement, ensuring that the temporal and spatial diversity within each sub-lineage was adequately represented. Results were consistent across all independent replicates and aligned with previous studies [20], supporting the robustness of the phylogeographic patterns observed here.
Nonetheless, we acknowledge that the true number of viral transitions between regions is likely higher than inferred, as temporal clustering and uneven sequencing intensity may have led to an underestimation of these events. Despite these limitations, the dataset presented here represents a substantial improvement over what was previously available in public repositories and provides a critical foundation for future research. Expanding genomic surveillance in under-sampled regions will be essential to refine our understanding of PRRSV-2 diversity, elucidate viral dispersal pathways, and strengthen coordinated regional and continental control strategies.
5. Conclusions
In this study, we expand the understanding of PRRSV-2 genetic diversity in North America. We propose the establishment of two new PRRSV-2 sub-lineages from Canada that likely emerged between the late 1990s and early 2000s. In addition, we identified two other highly divergent monophyletic clades related to these novel sub-lineages; however, these clades do not appear to be currently circulating in the country. Our phylogenetic analyses indicate that the PRRSV-2 sub-lineages circulating in Canada genetically divergent from those found in the United States. To further organize this genetic diversity, we defined new PRRSV-2 variants, thereby expanding the recently implemented variant classification system [17]. Our findings suggest that Canada may be considered one of the centers of diversification for PRRSV, with the provinces of Quebec and Ontario, in particular, acting as sources for the dispersal of sub-lineages 1C, 1H, 1I, and 1K. Most sub-lineages exhibited a unidirectional dispersal pattern to or from the USA, except for sub-lineages 1E and 1I, which originated in the USA, were introduced into Canada, and later dispersed back into the USA These results indicate that the PRRSV-2 dispersal route between Canada and the USA is largely unidirectional for most sub-lineages. These findings offer important insights for guiding targeted surveillance and biosecurity strategies aimed at preventing the cross-border introduction of PRRSV-2 variants not yet detected in either country.
Supplementary Materials
The following supporting information can be downloaded at the website of this paper posted on Preprints.org.
Author Contributions
Conceptualization: J.P.H.d.S., I.A.D.P. and K.V.; methodology: J.P.H.d.S., N.P., and K.V.; Investigation: J.P.H.d.S., and K.V.; database curation: J.P.H.d.S., R.C., L.D., S.M., J.B. and M.K.; formal analysis: J.P.H.d.S., and K.V.; original draft writing: J.P.H.d.S.; review and editing: J.P.H.d.S., K.V., I.A.D.P., R.C., L.D., S.M., J.B., M.K., N.P., C.A.C. and K.V.; Supervision: K.V.; Funding acquisition: K.V. All authors have read and agreed to the published version of the manuscript
Funding
This study was funded by the Intramural Research Program of the U.S. Department of Agriculture, National Institute of Food and Agriculture, Data Science for Food and Agricultural Systems Program, grant number 2023-67021-40018 and Swine Health Information Center (SHIC), grant number 25-058.
Institutional Review Board Statement
Not applicable. The study was conducted with routine diagnostic data submitted to the UMN VDL. No identification of submitter was provided.
Data Availability Statement
Portions of the dataset are privately owned by the production systems and may be subject to restrictions. However, the data can be made available upon reasonable request to the corresponding author, contingent upon permission from the respective production systems. Reference sequences for the newly established sub-lineages (anchor sequences for 1K and 1L), as well as for undetermined clades 1 and 2, are available in GenBank under accession numbers PV179104 to PV179253 and PV179270 to PV179414
Acknowledgments
The authors would like to thank the Morrison Swine Health Monitoring Project (MSHMP) participants and the Veterinary Diagnostic Laboratory, University of Minnesota, for sharing its PRRSV-2 genetic sequences.,
Conflicts of Interest
The authors declare no conflict of interest.
References
- Albina, E. Epidemiology of porcine reproductive and respiratory syndrome (PRRS): An overview. Vet. Microbiol. 1997, 55, 309–316. [Google Scholar] [CrossRef]
- Mussell, A; Oginskyy, A; Grier, K; Morin, M; Lachance, M; Whittington, L; Friendship, R. A risk, benefit, strength, weakness, opportunity and threat analysis for the control and possible eradication of porcine reproductive and respiratory syndrome (PRRS) virus within the Canadian swine herd; Canadian Swine Health Board (Ed): Ottawa, ON, Canada, 2011. [Google Scholar]
- Government-of-Canada. Agriculture and Agri-Food Canada - Hogs and pork; Government of Canada, 2025. [Google Scholar]
- FAOSTAT Food Balance Sheets. 2020. Available online: http://www.fao.org/faostat/en/#data/FBS (accessed on 24 April 2020).
- USDA. Hogs & Pork - Sector at a Glance Economic Research Service U.S. Department of Agriculture2025. Available online: https://www.ers.usda.gov/topics/animal-products/hogs-pork/sector-at-a-glance#Loc6.
- Snijder, E.J.; Meulenberg, J.J. The molecular biology of arteriviruses. J Gen Virol. 1998, 79, 961–80. [Google Scholar] [CrossRef]
- Brinton, M.A.; Gulyaeva, A.A.; Balasuriya, U.B.R.; Dunowska, M.; Faaberg, K.S.; Goldberg, T.; Leung, F.C.C.; Nauwynck, H.J.; Snijder, E.J.; Stadejek, T.; et al. ICTV Virus Taxonomy Profile: Arteriviridae 2021. J. Gen. Virol. 2021, 102, 001632. [Google Scholar] [CrossRef]
- Van Breedam, W.; Delputte, P.L.; Van Gorp, H.; Misinzo, G.; Vanderheijden, N.; Duan, X.; Nauwynck, H.J. Porcine reproductive and respiratory syndrome virus entry into the porcine macrophage. J. Gen. Virol. 2010, 91, 1659–1667. [Google Scholar] [CrossRef] [PubMed]
- Syndrome TOAHGoPRR. PRRS: The Disease, Its Diagnosis, Prevention and Control. Available online: https://www.oie.int/fileadmin/Home/eng/Our_scientific_expertise/docs/pdf/PRRS_guide_web_bulletin.pdf.
- Hanada, K.; Suzuki, Y.; Nakane, T.; Hirose, O.; Gojobori, T. The Origin and Evolution of Porcine Reproductive and Respiratory Syndrome Viruses. Mol. Biol. Evol. 2005, 22, 1024–1031. [Google Scholar] [CrossRef]
- Pamornchainavakul, N.; Kikuti, M.; Paploski, I.A.D.; Makau, D.N.; Rovira, A.; Corzo, C.A.; VanderWaal, K. Measuring How Recombination Re-shapes the Evolutionary History of PRRSV-2: A Genome-Based Phylodynamic Analysis of the Emergence of a Novel PRRSV-2 Variant. Front. Veter- Sci. 2022, 9, 846904. [Google Scholar] [CrossRef] [PubMed]
- Cui, X.; Xia, D.; Huang, X.; Sun, Y.; Shi, M.; Zhang, J.; Li, G.; Yang, Y.; Wang, H.; Cai, X.; et al. Analysis of Recombinant Characteristics Based on 949 PRRSV-2 Genomic Sequences Obtained from 1991 to 2021 Shows That Viral Multiplication Ability Contributes to Dominant Recombination. Microbiol. Spectr. 2022, 10, e02934-22. [Google Scholar] [CrossRef] [PubMed]
- Duffy, S.; Shackelton, L.A.; Holmes, E.C. Rates of evolutionary change in viruses: patterns and determinants. Nat. Rev. Genet. 2008, 9, 267–276. [Google Scholar] [CrossRef]
- Shi, M.; Lam, T.T.; Hon, C.C.; Murtaugh, M.P.; Davies, P.R.; Hui, R.K.; Li, J.; Wong, L.T.; Yip, C.W.; Jiang, J.W.; et al. Phylogeny-Based Evolutionary, Demographical, and Geographical Dissection of North American Type 2 Porcine Reproductive and Respiratory Syndrome Viruses. J. Virol. 2010, 84, 8700–8711. [Google Scholar] [CrossRef]
- Paploski, I.A.D.; Pamornchainavakul, N.; Makau, D.N.; Rovira, A.; Corzo, C.A.; Schroeder, D.C.; Cheeran, M.C.-J.; Doeschl-Wilson, A.; Kao, R.R.; Lycett, S.; et al. Phylogenetic Structure and Sequential Dominance of Sub-Lineages of PRRSV Type-2 Lineage 1 in the United States. Vaccines 2021, 9, 608. [Google Scholar] [CrossRef]
- Paploski, I.A.D.; Corzo, C.; Rovira, A.; Murtaugh, M.P.; Sanhueza, J.M.; Vilalta, C.; Schroeder, D.C.; VanderWaal, K. Temporal Dynamics of Co-circulating Lineages of Porcine Reproductive and Respiratory Syndrome Virus. Front. Microbiol. 2019, 10, 2486. [Google Scholar] [CrossRef]
- VanderWaal, K.; Pamornchainavakul, N.; Kikuti, M.; Zhang, J.; Zeller, M.; Trevisan, G.; Rossow, S.; Schwartz, M.; Linhares, D.C.L.; Holtkamp, D.J.; et al. PRRSV-2 variant classification: a dynamic nomenclature for enhanced monitoring and surveillance. mSphere 2025, 10, e0070924. [Google Scholar] [CrossRef] [PubMed]
- VanderWaal, K.; Pamornchainavakul, N.; Kikuti, M.; Linhares, D.C.L.; Trevisan, G.; Zhang, J.; Anderson, T.K.; Zeller, M.; Rossow, S.; Holtkamp, D.J.; et al. Phylogenetic-based methods for fine-scale classification of PRRSV-2 ORF5 sequences: a comparison of their robustness and reproducibility. Front. A J. Women Stud. 2024, 4, 1433931. [Google Scholar] [CrossRef]
- Yim-Im, W.; Anderson, T.K.; Paploski, I.A.D.; VanderWaal, K.; Gauger, P.; Krueger, K.; Shi, M.; Main, R.; Zhang, J. Refining PRRSV-2 genetic classification based on global ORF5 sequences and investigation of their geographic distributions and temporal changes. Microbiol. Spectr. 2023, 11, e02916-23. [Google Scholar] [CrossRef] [PubMed]
- Pamornchainavakul, N.; Paploski, I.A.D.; Makau, D.N.; Kikuti, M.; Rovira, A.; Lycett, S.; Corzo, C.A.; VanderWaal, K. Mapping the Dynamics of Contemporary PRRSV-2 Evolution and Its Emergence and Spreading Hotspots in the U.S. Using Phylogeography. Pathogens 2023, 12, 740. [Google Scholar] [CrossRef]
- Shi, M.; Lemey, P.; Brar, M.S.; Suchard, M.A.; Murtaugh, M.P.; Carman, S.; D’aLlaire, S.; Delisle, B.; Lambert, M.; Gagnon, C.A.; et al. The spread of Type 2 Porcine Reproductive and Respiratory Syndrome Virus (PRRSV) in North America: A phylogeographic approach. Virology 2013, 447, 146–154. [Google Scholar] [CrossRef]
- Lambert, M.; Delisle, B.; Arsenault, J.; Poljak, Z.; D'ALlaire, S. Positioning Quebec ORF5 sequences of porcine reproductive and respiratory syndrome virus (PRRSV) within Canada and worldwide diversity. Infect. Genet. Evol. 2019, 74, 103999. [Google Scholar] [CrossRef]
- Lambert, M.; Arsenault, J.; Côté, J.-C.; D’allaire, S. A descriptive study on spatial and temporal distributions of genetic clusters of porcine reproductive and respiratory syndrome virus infecting pig sites in Quebec, Canada, between 2010 and 2019. Porc. Heal. Manag. 2024, 10, 1–14. [Google Scholar] [CrossRef]
- Shi, M.; Lam, T.T.-Y.; Hon, C.-C.; Hui, R.K.-H.; Faaberg, K.S.; Wennblom, T.; Murtaugh, M.P.; Stadejek, T.; Leung, F.C.-C. Molecular epidemiology of PRRSV: A phylogenetic perspective. Virus Res. 2010, 154, 7–17. [Google Scholar] [CrossRef]
- Perez, A.M.; Linhares, D.C.L.; Arruda, A.G.; VanderWaal, K.; Machado, G.; Vilalta, C.; Sanhueza, J.M.; Torrison, J.; Torremorell, M.; Corzo, C.A. Individual or Common Good? Voluntary Data Sharing to Inform Disease Surveillance Systems in Food Animals. Front. Veter- Sci. 2019, 6. [Google Scholar] [CrossRef] [PubMed]
- Sayers, E.W.; Bolton, E.E.; Brister, J.R.; Canese, K.; Chan, J.; Comeau, D.C.; Connor, R.; Funk, K.; Kelly, C.; Kim, S.; Madej, T.; Marchler-Bauer, A.; Lanczycki, C.; Lathrop, S.; Lu, Z.; Thibaud-Nissen, F.; Murphy, T.; Phan, L.; Skripchenko, Y.; Tse, T.; Wang, J.; Williams, R.; Trawick, B.W.; Pruitt, K.D.; Sherry, S.T. Database resources of the National Center for Biotechnology Information. Nucleic Acids Research 2022, 50, D20–d6. [Google Scholar] [CrossRef]
- Muhire, B.M.; Varsani, A.; Martin, D.P. SDT: A Virus Classification Tool Based on Pairwise Sequence Alignment and Identity Calculation. PLoS ONE 2014, 9, e108277. [Google Scholar] [CrossRef]
- Maruyama, S.; Eveleigh, R.J.; Archibald, J.M. Treetrimmer: a method for phylogenetic dataset size reduction. BMC Res. Notes 2013, 6, 145–145. [Google Scholar] [CrossRef] [PubMed]
- Darriba, D.; Posada, D.; Kozlov, A.M.; Stamatakis, A.; Morel, B.; Flouri, T. ModelTest-NG: A New and Scalable Tool for the Selection of DNA and Protein Evolutionary Models. Mol. Biol. Evol. 37, 291–294. [CrossRef]
- Argimón, S.; AbuDahab, K.; Goater, R.J.E.; Fedosejev, A.; Bhai, J.; Glasner, C.; Feil, E.J.; Holden, M.T.G.; Yeats, C.A.; Grundmann, H.; et al. Microreact: visualizing and sharing data for genomic epidemiology and phylogeography. Microb. Genom. 2016, 2, e000093. [Google Scholar] [CrossRef] [PubMed]
- Martin, D.; Rybicki, E. RDP: detection of recombination amongst aligned sequences. Bioinformatics 2000, 16, 562–563. [Google Scholar] [CrossRef]
- Padidam, M.; Sawyer, S.; Fauquet, C.M. Possible Emergence of New Geminiviruses by Frequent Recombination. Virology 1999, 265, 218–225. [Google Scholar] [CrossRef]
- Martin, D.; Posada, D.; Crandall, K.; Williamson, C. A Modified Bootscan Algorithm for Automated Identification of Recombinant Sequences and Recombination Breakpoints. AIDS Res. Hum. Retroviruses 2005, 21, 98–102. [Google Scholar] [CrossRef]
- Smith, J.M. Analyzing the mosaic structure of genes. J. Mol. Evol. 1992, 34, 126–129. [Google Scholar] [CrossRef] [PubMed]
- Posada, D.; Crandall, K.A. Evaluation of methods for detecting recombination from DNA sequences: Computer simulations. Proc. Natl. Acad. Sci. 2001, 98, 13757–13762. [Google Scholar] [CrossRef]
- Gibbs, M.J.; Armstrong, J.S.; Gibbs, A.J. Sister-Scanning: a Monte Carlo procedure for assessing signals in recombinant sequences. Bioinformatics 2000, 16, 573–582. [Google Scholar] [CrossRef]
- Lam, H.M.; Ratmann, O.; Boni, M.F. Improved Algorithmic Complexity for the 3SEQ Recombination Detection Algorithm. Mol. Biol. Evol. 35, 247–251. [CrossRef] [PubMed]
- Martin, D.P.; Varsani, A.; Roumagnac, P.; Botha, G.; Maslamoney, S.; Schwab, T.; Kelz, Z.; Kumar, V.; Murrell, B. RDP5: a computer program for analyzing recombination in, and removing signals of recombination from, nucleotide sequence datasets. Virus Evol. 7, veaa087. [CrossRef]
- Center, SHI. Emerging Diseases,”Rapid Response Program 2025. Available online: https://www.swinehealth.org/rapid-response-to-emerging-disease-program/.
- Rambaut, A.; Lam, T.T.; Max Carvalho, L.; Pybus, O.G. Exploring the temporal structure of heterochronous sequences using TempEst (formerly Path-O-Gen). Virus Evol. 2016, 2, vew007. [Google Scholar] [CrossRef]
- Rambaut, A.; Drummond, A.J.; Xie, D.; Baele, G.; Suchard, M.A. Posterior Summarization in Bayesian Phylogenetics Using Tracer 1.7. Syst. Biol. 2018, 67, 901–904. [Google Scholar] [CrossRef] [PubMed]
- Kass, RE; Raftery, AE. Bayes Factors. Journal of the American Statistical Association. 1995, 90, 773–95. [Google Scholar] [CrossRef]
- Baele, G.; Lemey, P.; Suchard, M.A. Genealogical working distributions for Bayesian model testing with phylogenetic uncertainty. Systematic Biology. 2016, 65, 250–64. [Google Scholar] [CrossRef]
- Lemey, P.; Rambaut, A.; Drummond, A.J.; Suchard, M.A. Bayesian Phylogeography Finds Its Roots. PLOS Comput. Biol. 2009, 5, e1000520. [Google Scholar] [CrossRef]
- Gill, M.S.; Lemey, P.; Faria, N.R.; Rambaut, A.; Shapiro, B.; Suchard, M.A. Improving Bayesian Population Dynamics Inference: A Coalescent-Based Model for Multiple Loci. Mol. Biol. Evol. 2013, 30, 713–724. [Google Scholar] [CrossRef] [PubMed]
- Drummond, A.J.; Rambaut, A. BEAST: Bayesian evolutionary analysis by sampling trees. BMC Evol. Biol. 2007, 7, 1–8. [Google Scholar] [CrossRef]
- Murtaugh, M.P.; Stadejek, T.; Abrahante, J.E.; Lam, T.T.; Leung, F.C.-C. The ever-expanding diversity of porcine reproductive and respiratory syndrome virus. Virus Res. 2010, 154, 18–30. [Google Scholar] [CrossRef]
- Yoon, SH; Kim, H; Park, B; Kim, H. Tracing the genetic history of porcine reproductive and respiratory syndrome viruses derived from the complete ORF 5-7 sequences: a Bayesian coalescent approach. Arch Virol. 2012, 157, 2143–51. [Google Scholar] [CrossRef]
- Wang, A.; Chen, Q.; Wang, L.; Madson, D.; Harmon, K.; Gauger, P.; Zhang, J.; Li, G. Recombination between Vaccine and Field Strains of Porcine Reproductive and Respiratory Syndrome Virus. Emerg. Infect. Dis. 2019, 25, 2335–2337. [Google Scholar] [CrossRef] [PubMed]
- Cui, X.-Y.; Xia, D.-S.; Luo, L.-Z.; An, T.-Q. Recombination of Porcine Reproductive and Respiratory Syndrome Virus: Features, Possible Mechanisms, and Future Directions. Viruses 2024, 16, 929. [Google Scholar] [CrossRef] [PubMed]
- Kim, S.-C.; Kang, S.C.; Kim, H.-J.; Park, J.; Kim, H.-R.; Park, C.-K.; Kim, W.-I. Nationwide emergence and spread of highly virulent PRRSV-2 mutants in Korea. Porc. Heal. Manag. 2025, 11, 1–15. [Google Scholar] [CrossRef]
- Zhou, L.; Han, J.; Yang, H. The evolution and diversity of porcine reproductive and respiratory syndrome virus in China. Veter- Microbiol. 2024, 298, 110252. [Google Scholar] [CrossRef]
- Shen, Y.-F.; Arruda, A.G.; Koscielny, M.P.; Cheng, T.-Y. Contrasting PRRSV temporal lineage patterns at the individual farm, production system, and regional levels in Ohio and neighboring states from 2017 to 2021. Prev. Veter- Med. 2024, 226, 106186. [Google Scholar] [CrossRef] [PubMed]
- Dee, S.; Deen, J. Evaluation of an industry-based sanitation protocol for transport vehicles contaminated with porcine reproductive and respiratory syndrome virus. Journal of Swine Health and Production. 2006, 14, 126–32. [Google Scholar] [CrossRef]
- Pileri, E.; Mateu, E. Review on the transmission porcine reproductive and respiratory syndrome virus between pigs and farms and impact on vaccination. Veter- Res. 2016, 47, 1–13. [Google Scholar] [CrossRef]
Figure 1.
Number of Canadian sequences assigned to different sub-lineages (a) and their respective proportions per year (b). The numbers above the bars indicate the number of sequences assigned to each specific sub-lineage.
Figure 1.
Number of Canadian sequences assigned to different sub-lineages (a) and their respective proportions per year (b). The numbers above the bars indicate the number of sequences assigned to each specific sub-lineage.
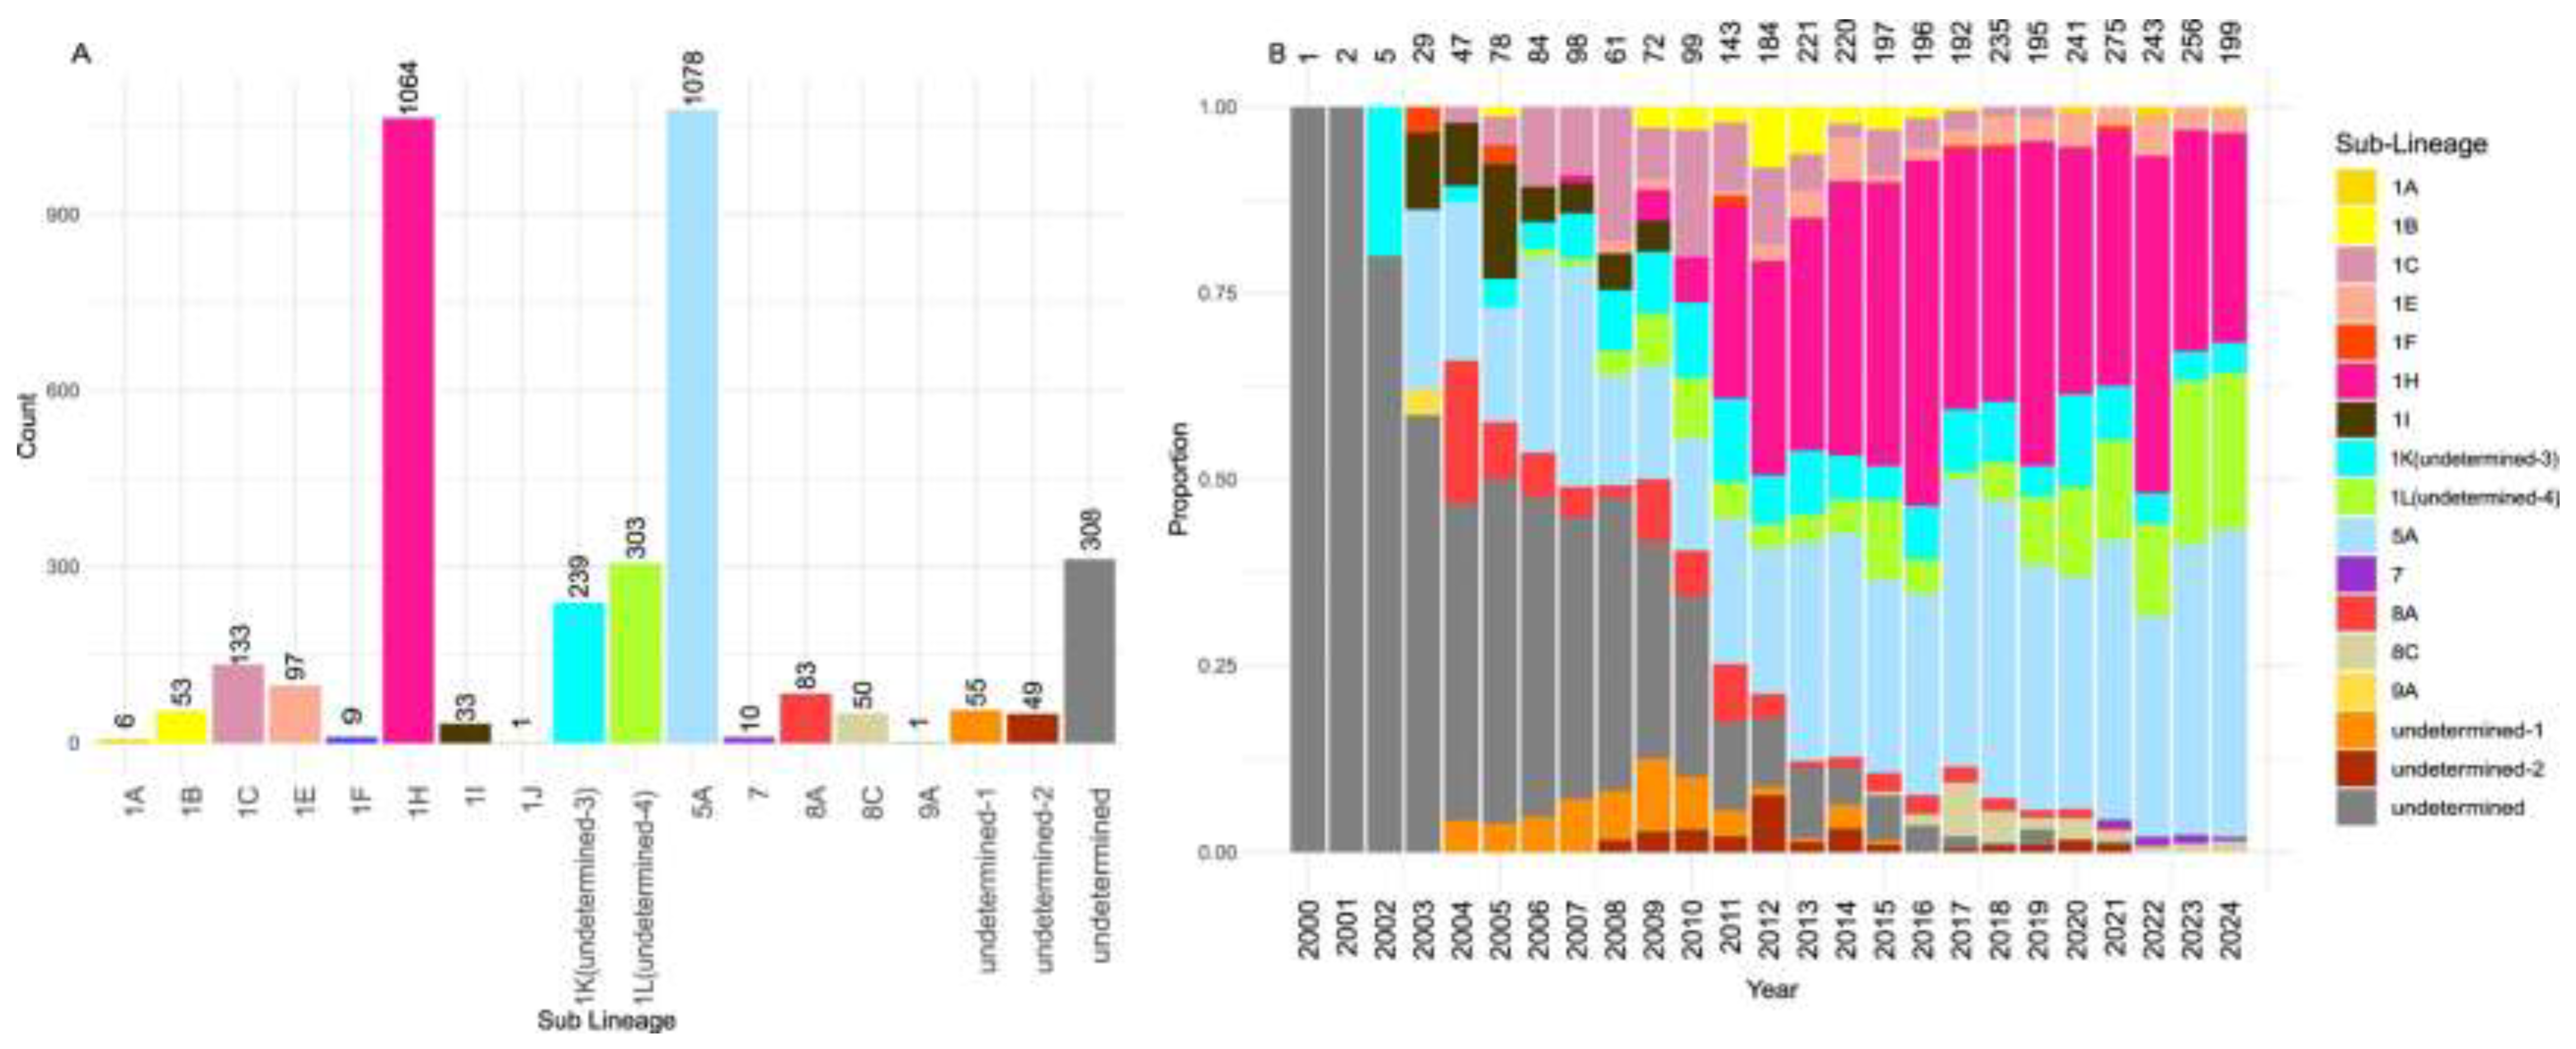
Figure 2.
Unrooted maximum-likelihood phylogenetic tree based on ORF5 anchor sequences representing all sub-lineages globally, including newly identified Canadian sub-lineages and undetermined clades 1 and 2. The tree was constructed using RAxML-NG, employed the GTR+I+G4 substitution model. Numbers on the branches indicate branch support values for the basal nodes of each sub-lineage. The scale bar at the bottom represents the number of substitutions per site.
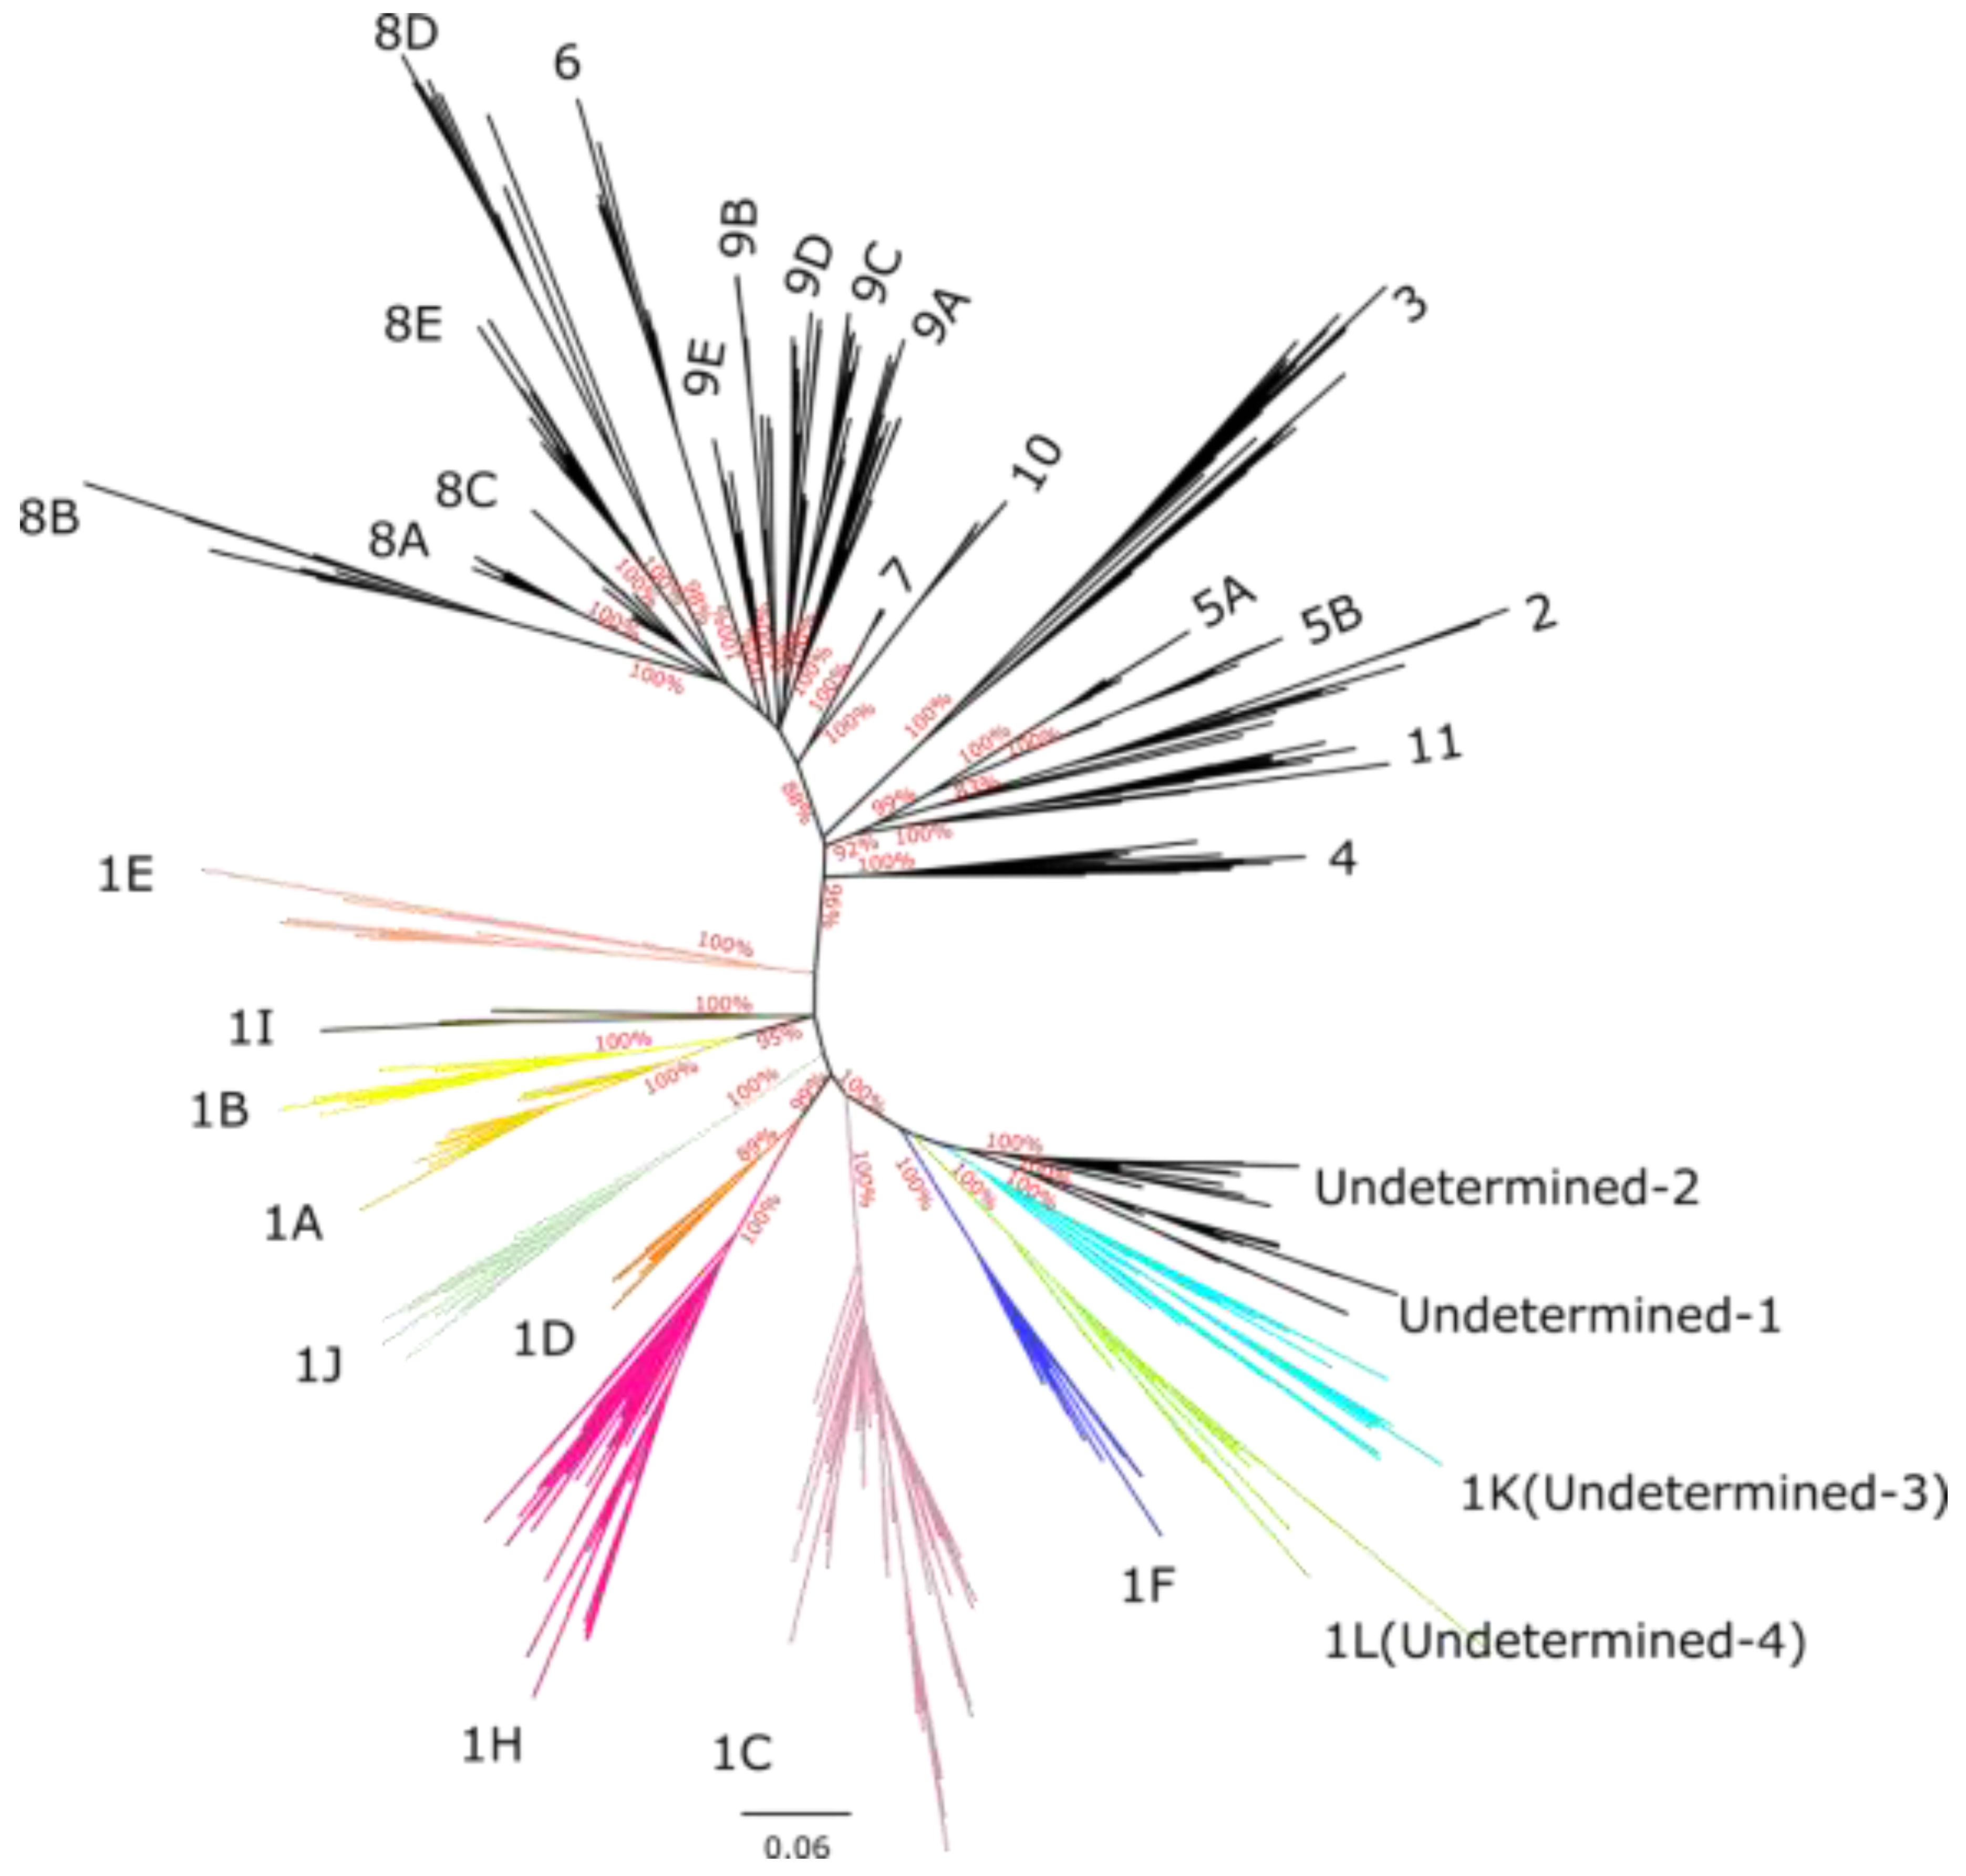
Figure 3.
Genetic distances between newly identified Canadian lineages, undetermined Canadian clades, and all PRRSV-2 sub-lineages. Dots represent the mean genetic distance, and bars indicate the interquartile range. Nucleotide identity percentages were estimated using SDT v1.2.
Figure 3.
Genetic distances between newly identified Canadian lineages, undetermined Canadian clades, and all PRRSV-2 sub-lineages. Dots represent the mean genetic distance, and bars indicate the interquartile range. Nucleotide identity percentages were estimated using SDT v1.2.
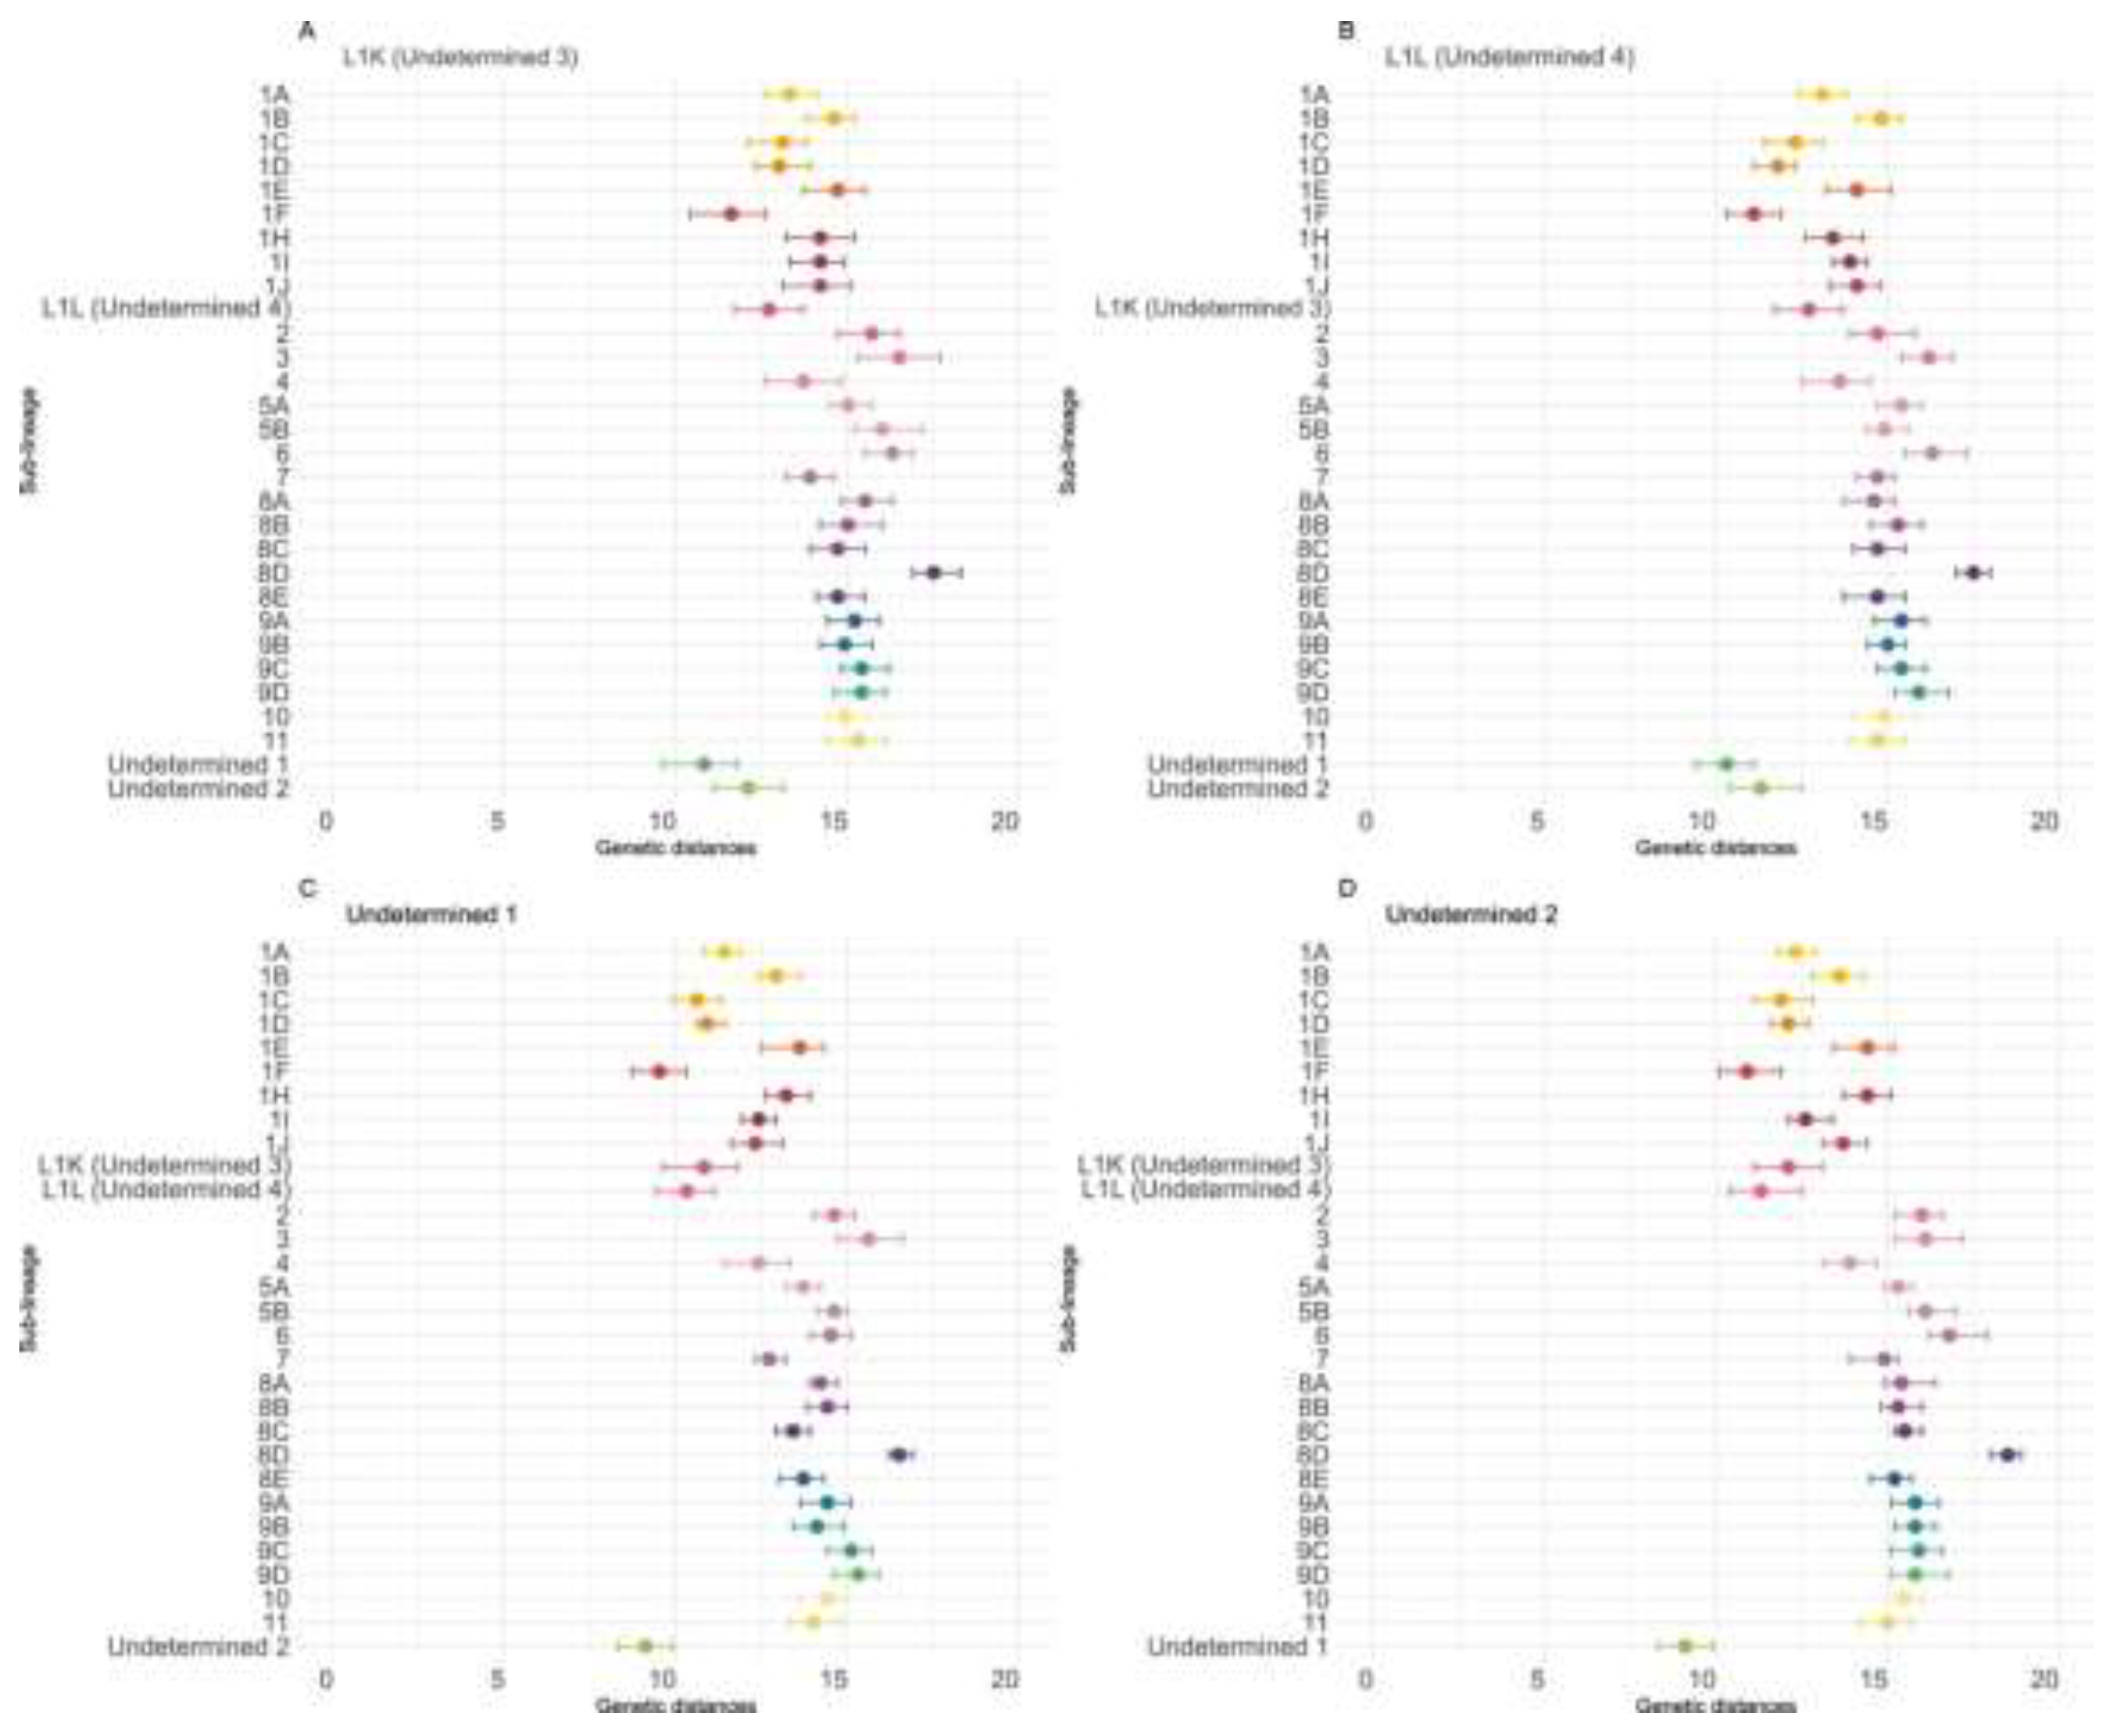
Figure 4.
Spatiotemporal dynamics of the PRRSV-2 1H sub-lineage in North America. A) The panel on the top left shows a maximum clade credibility (MCC) phylogenetic tree reconstructed using a discrete-space diffusion model. B) The heatmap panel on the top right displays number of transition between different regions, represented by color gradients and numerical values within each cell. Warm colors indicate high transition counts, while cool colors indicate low transitions counts. The thickness of the black boxes around the cells indicates the magnitude of the Bayes factor; only Bayes factors above 3 were considered significant. C) The bottom panel shows spread pathway. Arrows indicate the direction of spread, and their thickness represents the transition numbers. The USA regions shown correspond to swine-producing areas, defined based on animal density according to SHIC. The abbreviations on the Canada map refer to different provinces.
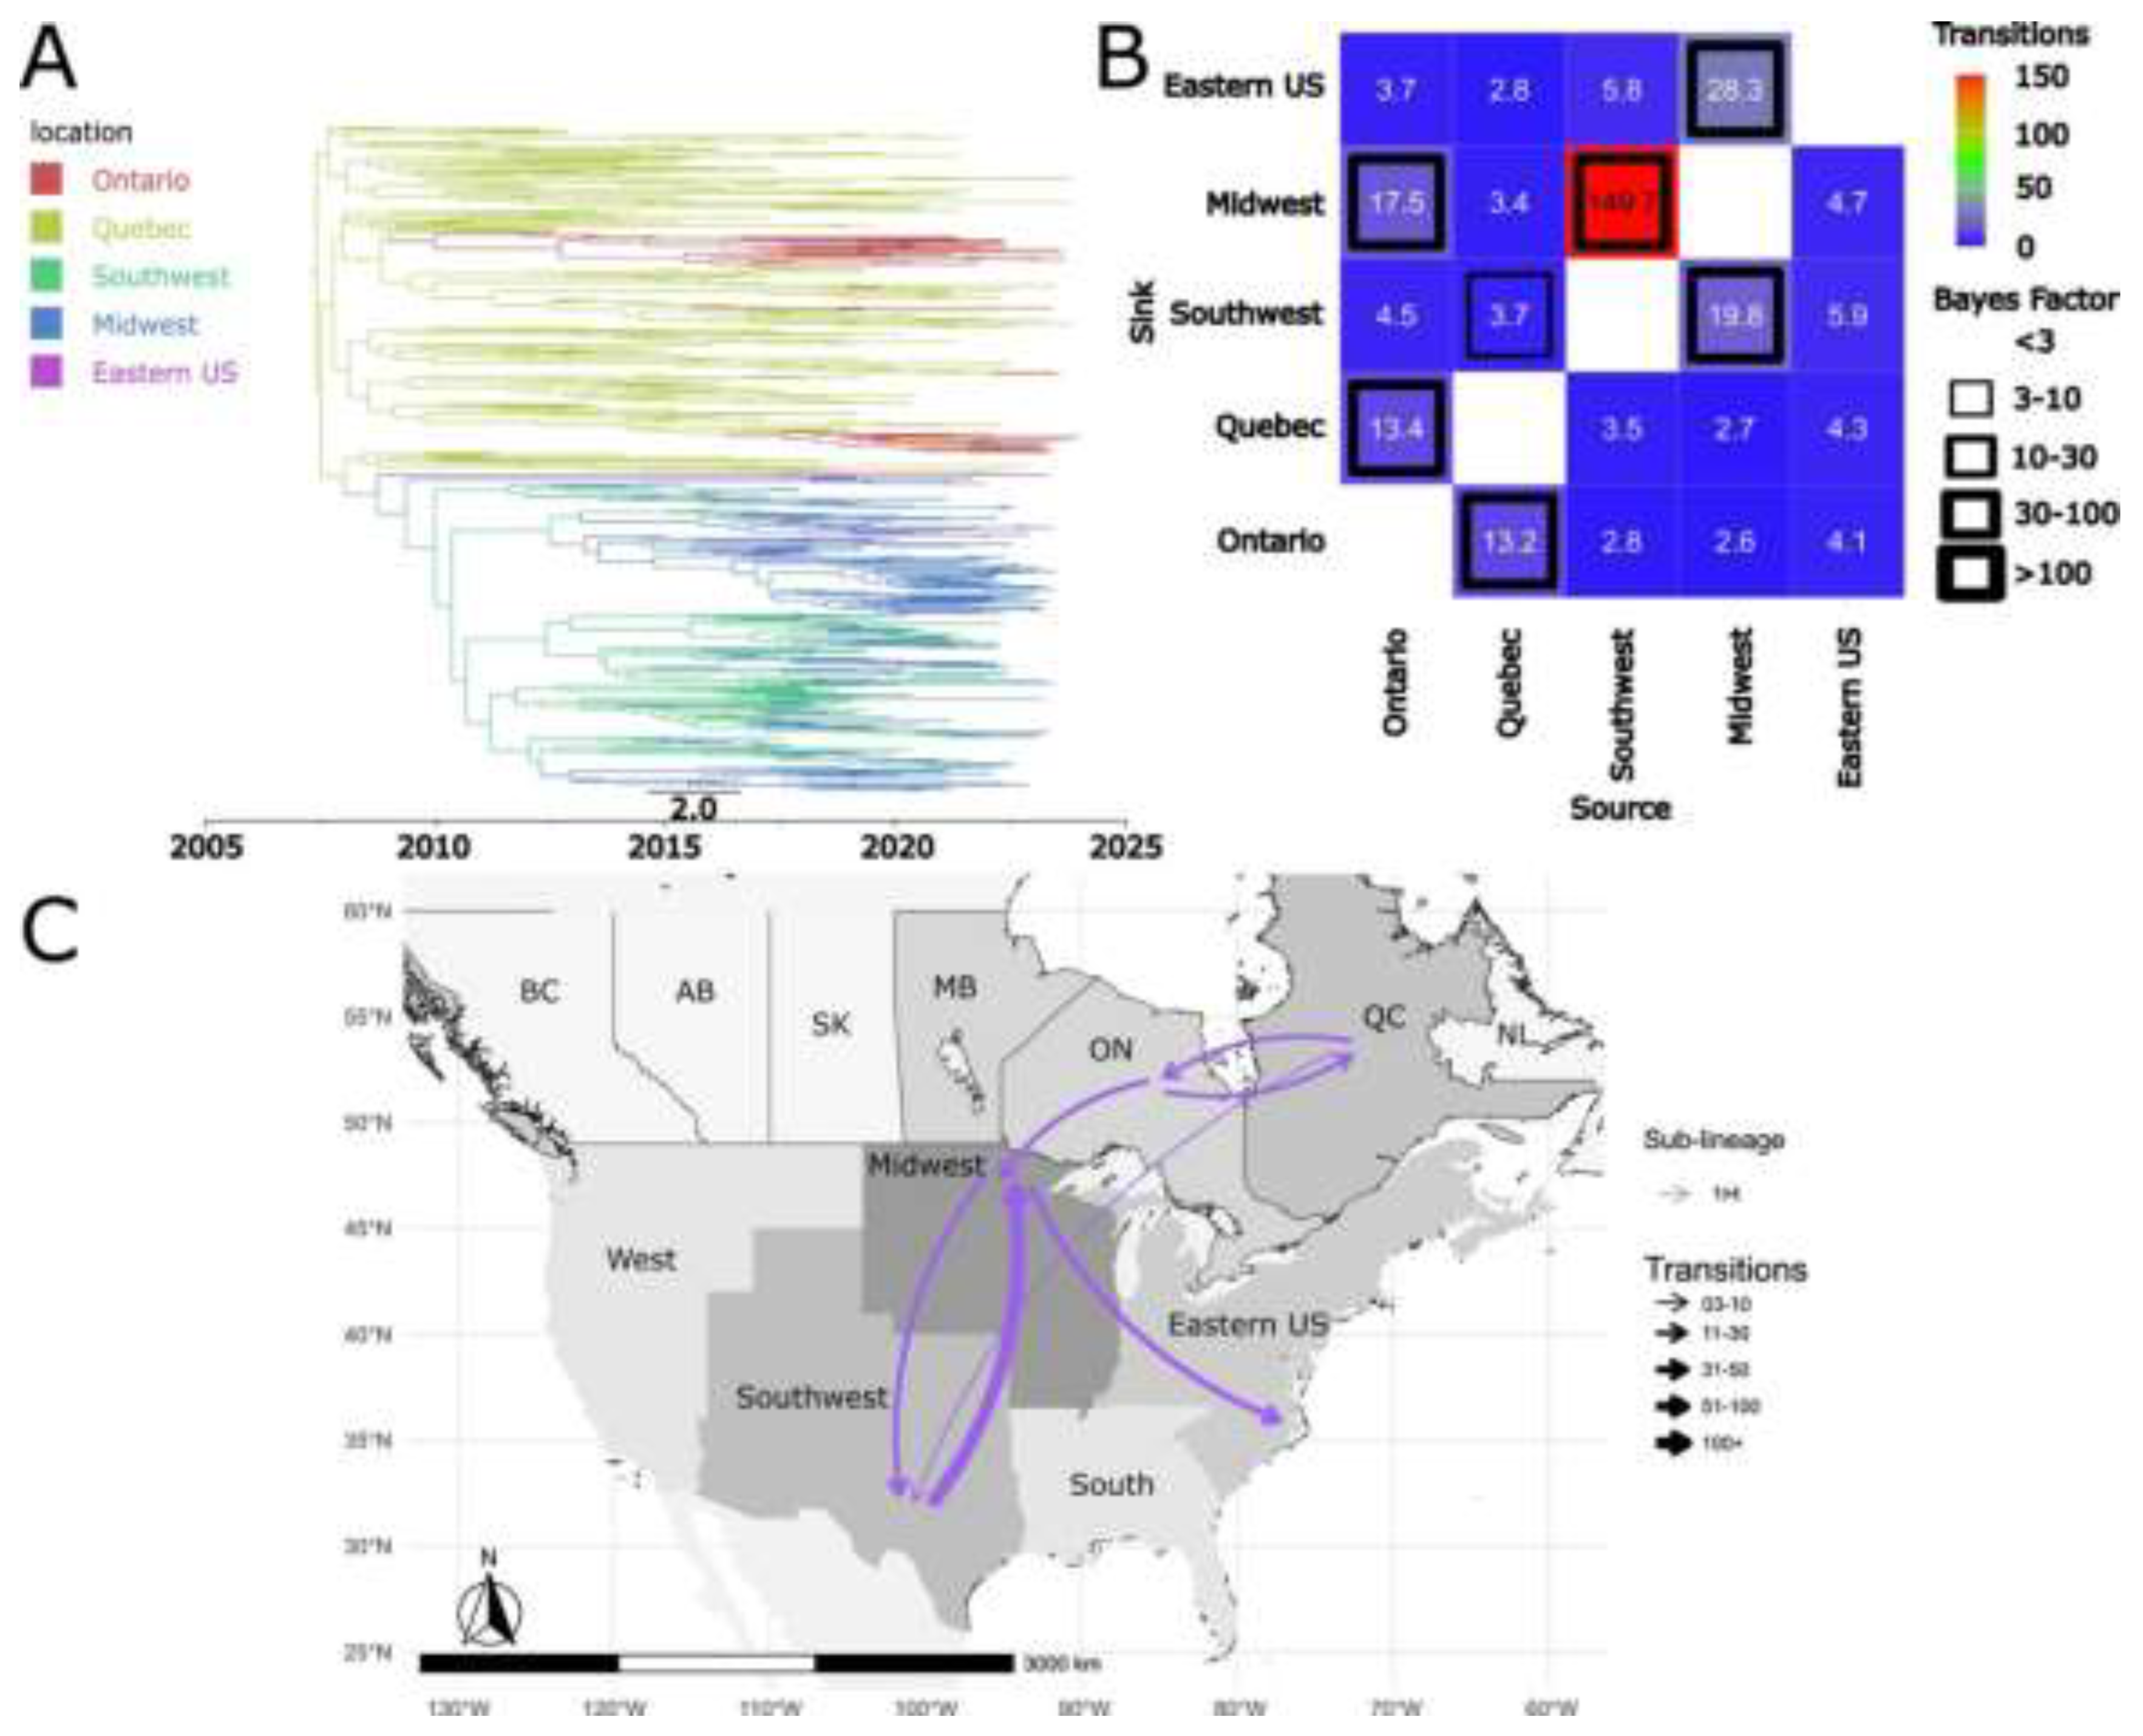
Figure 5.
Spatiotemporal dynamics of the PRRSV-2 1K sub-lineage in North America. A) The panel on the top left shows a maximum clade credibility (MCC) phylogenetic tree reconstructed using a discrete-space diffusion model. B) The heatmap panel on the top right displays number of transition between different regions, represented by color gradients and numerical values within each cell. Warm colors indicate high transition counts, while cool colors indicate low transitions counts. The thickness of the black boxes around the cells indicates the magnitude of the Bayes factor; only Bayes factors above 3 were considered significant. C) The bottom panel shows spread pathway. Arrows indicate the direction of spread, and their thickness represents the transition numbers. The USA regions shown correspond to swine-producing areas, defined based on animal density according to SHIC. The abbreviations on the Canada map refer to different provinces.
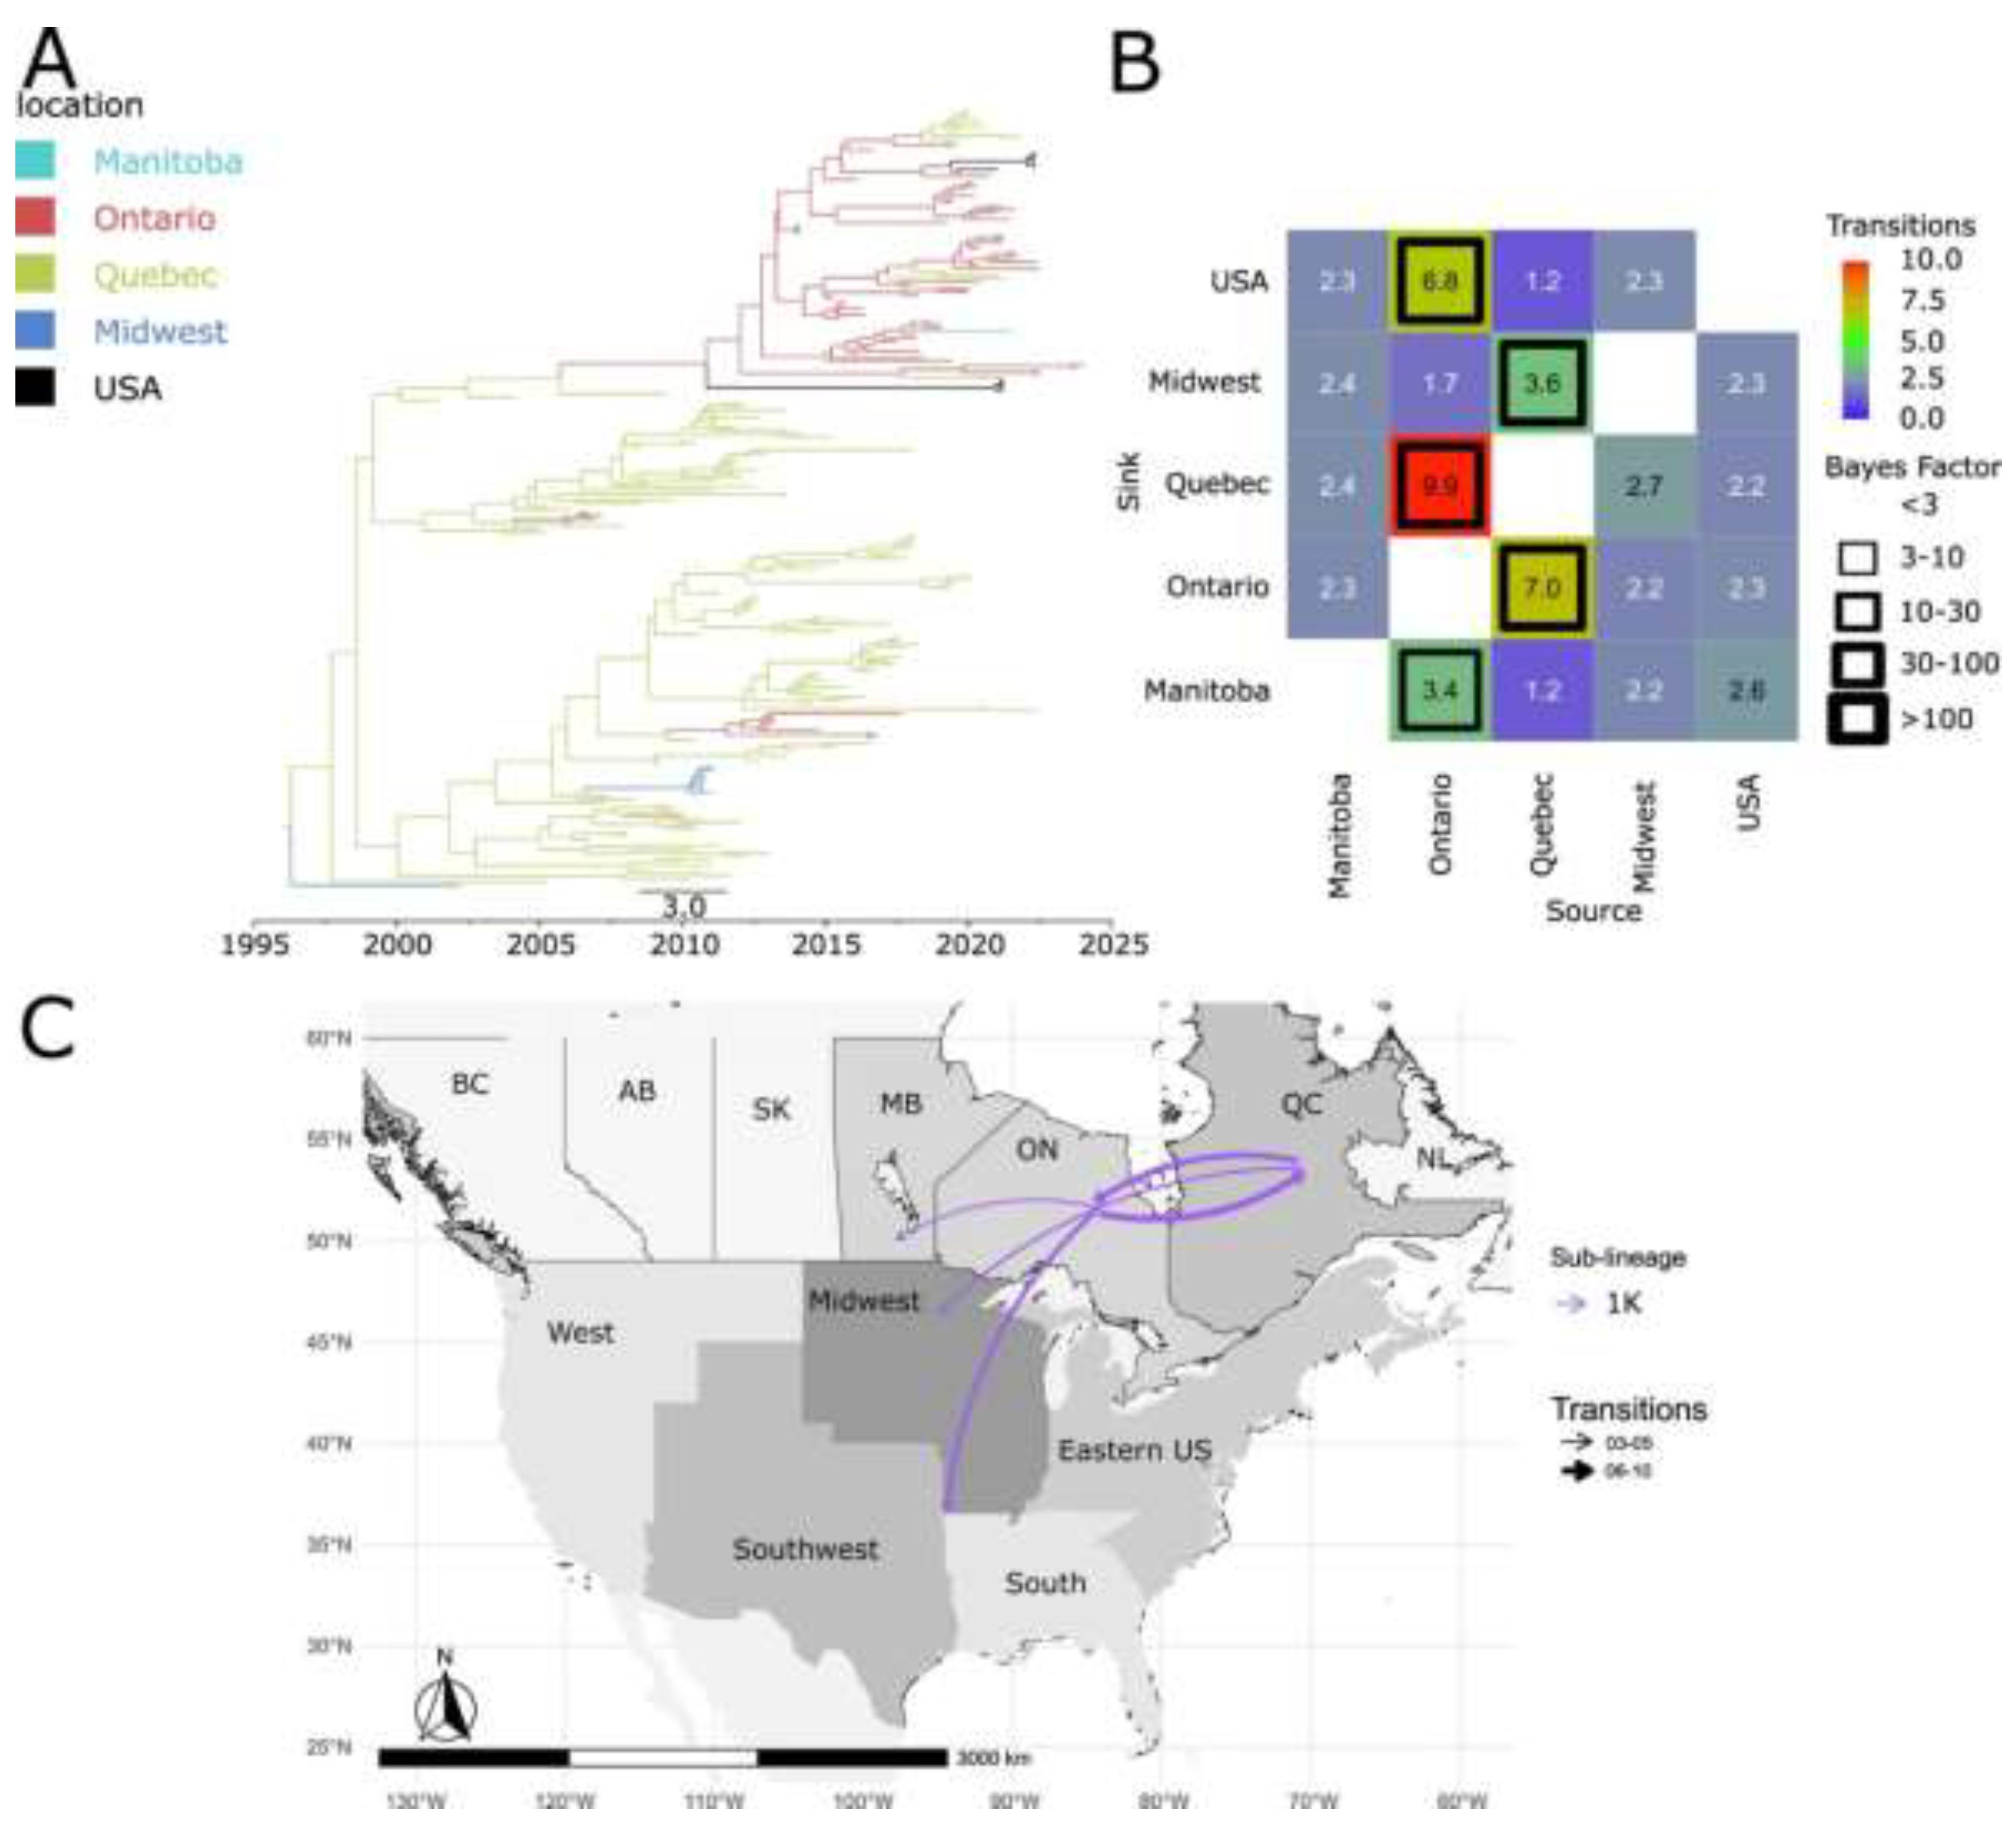
Figure 6.
Spatiotemporal dynamics of the PRRSV-2 1C sub-lineage in North America. A) The panel on the top left shows a maximum clade credibility (MCC) phylogenetic tree reconstructed using a discrete-space diffusion model. B) The heatmap panel on the top right displays number of transition between different regions, represented by color gradients and numerical values within each cell. Warm colors indicate high transition counts, while cool colors indicate low transitions counts. The thickness of the black boxes around the cells indicates the magnitude of the Bayes factor; only Bayes factors above 3 were considered significant. C) The bottom panel shows spread pathway. Arrows indicate the direction of spread, and their thickness represents the transition numbers. The USA regions shown correspond to swine-producing areas, defined based on animal density according to SHIC. The abbreviations on the Canada map refer to different provinces.
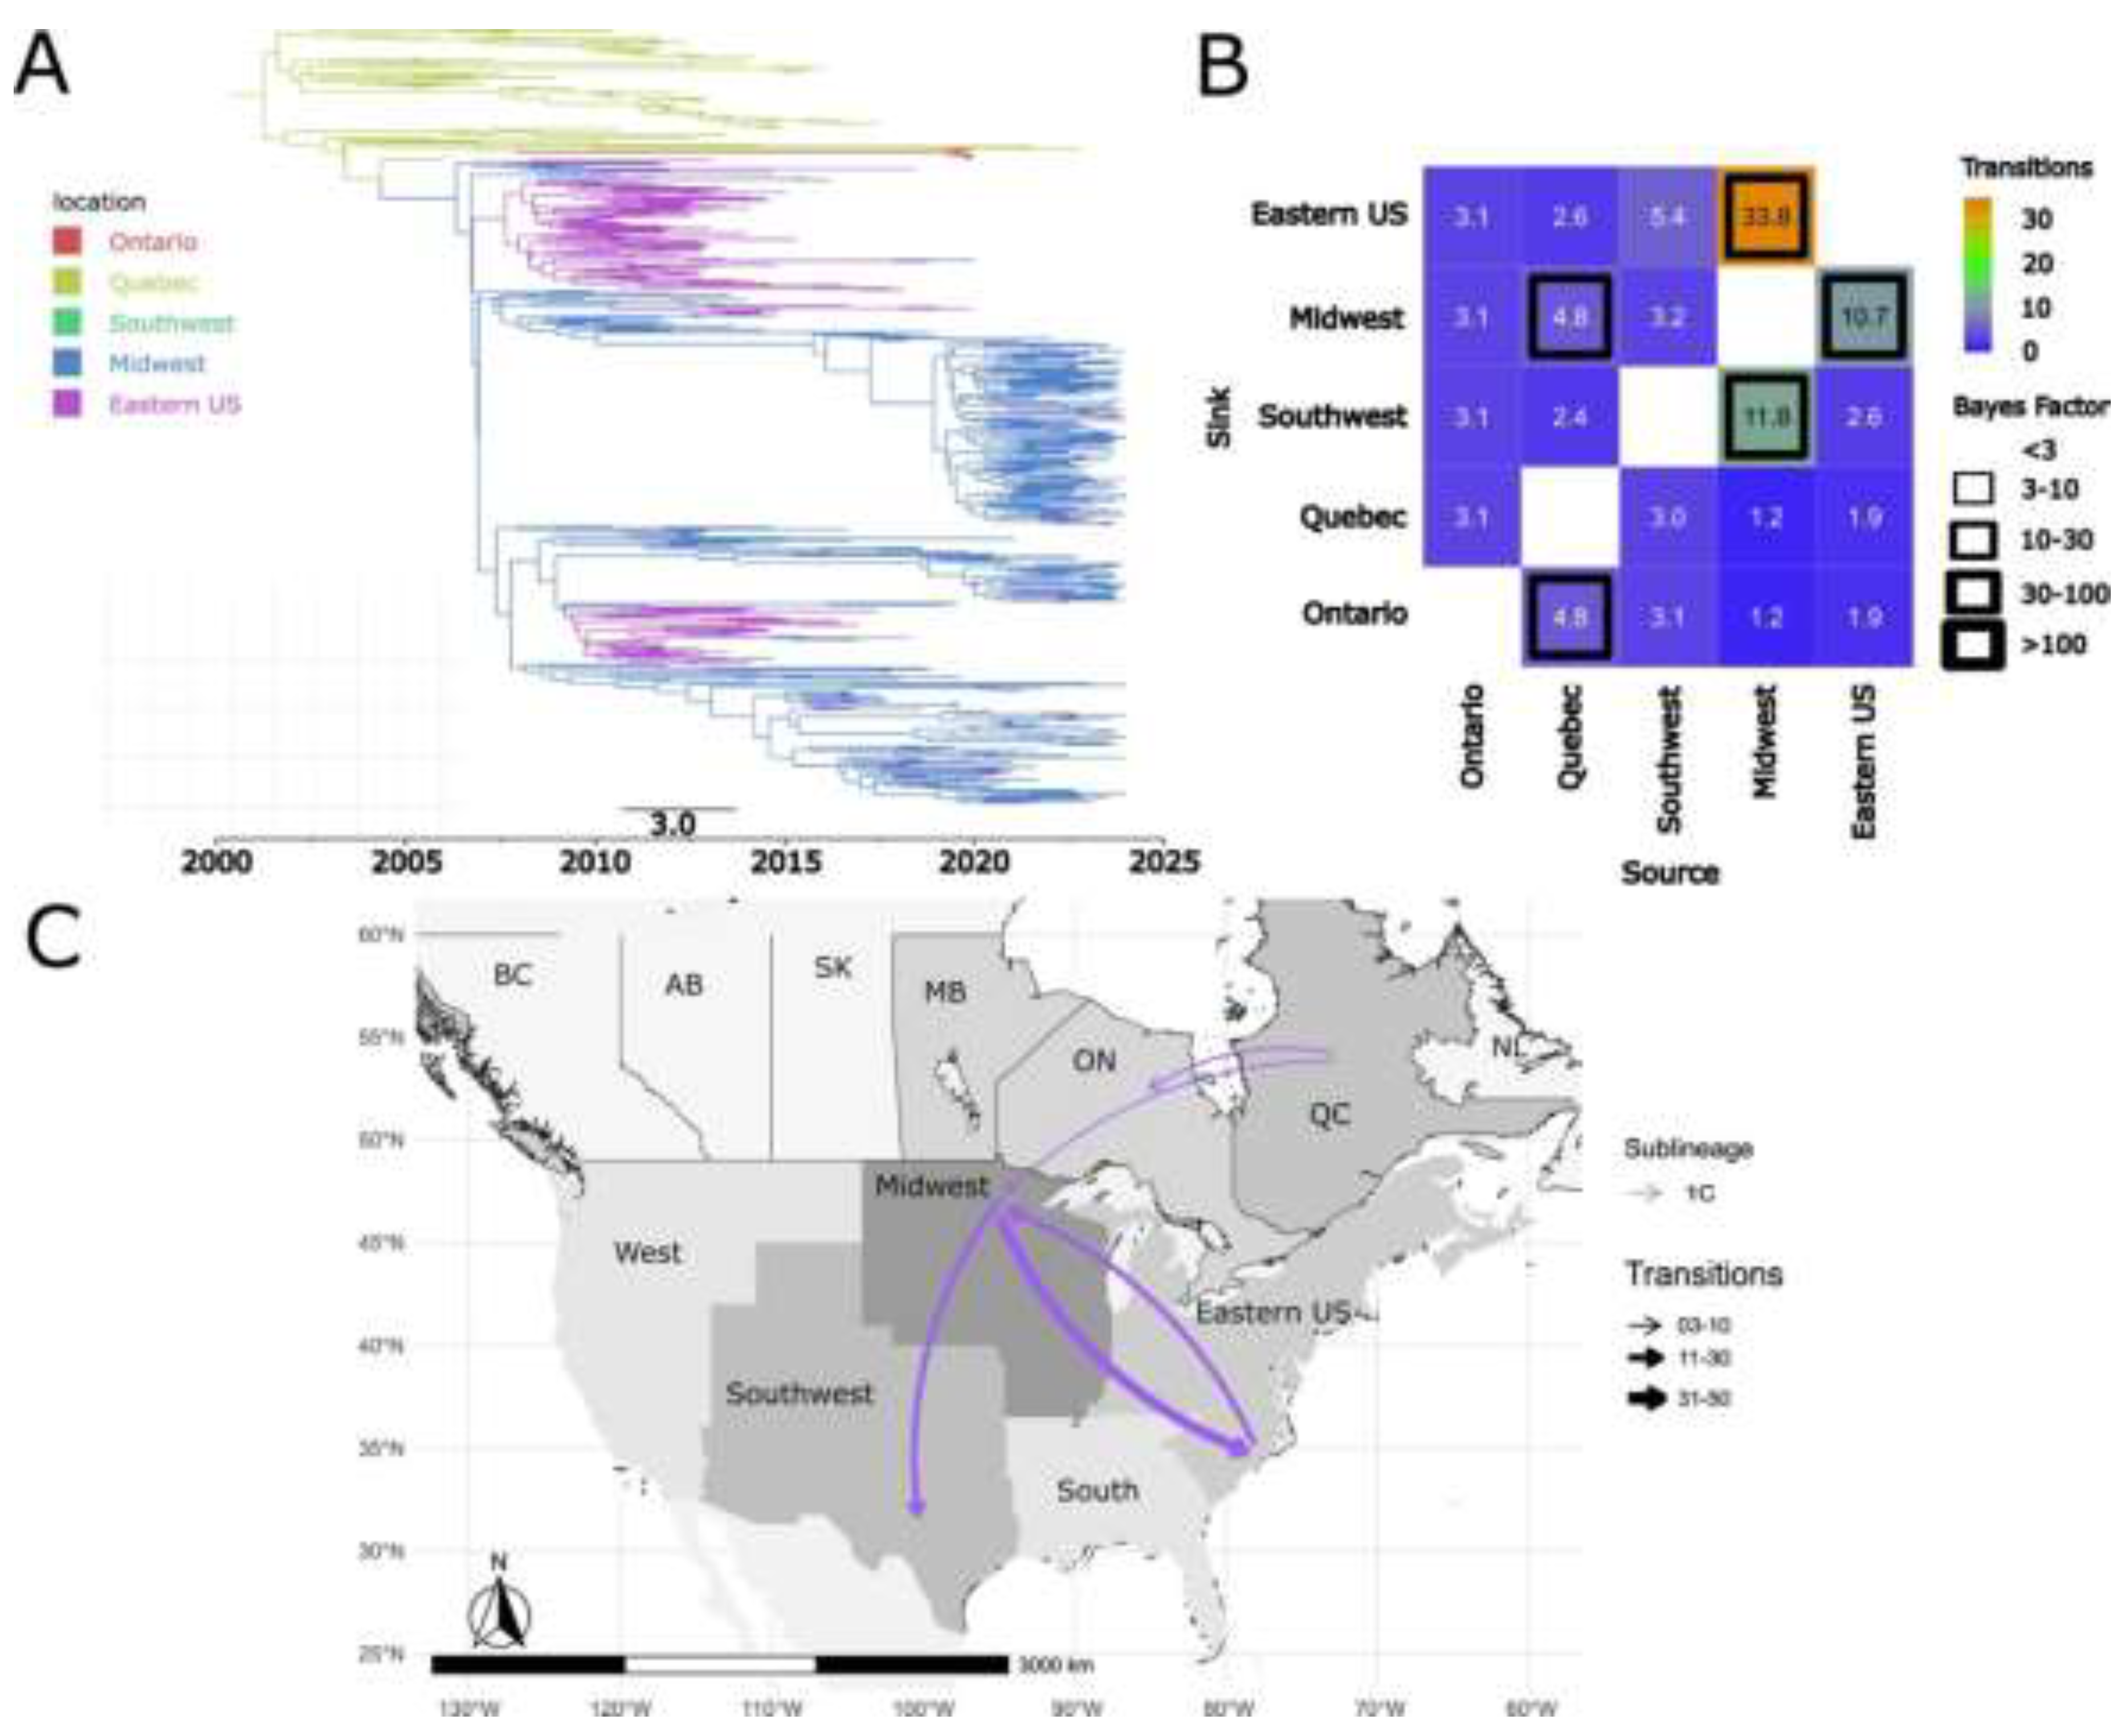
Figure 7.
Spatiotemporal dynamics of the PRRSV-2 1E sub-lineage in North America. A) The panel on the top left shows a maximum clade credibility (MCC) phylogenetic tree reconstructed using a discrete-space diffusion model. B) The heatmap panel on the top right displays number of transition between different regions, represented by color gradients and numerical values within each cell. Warm colors indicate high transition counts, while cool colors indicate low transitions counts. The thickness of the black boxes around the cells indicates the magnitude of the Bayes factor; only Bayes factors above 3 were considered significant. C) The bottom panel shows spread pathway. Arrows indicate the direction of spread, and their thickness represents the transition numbers. The USA regions shown correspond to swine-producing areas, defined based on animal density according to SHIC. The abbreviations on the Canada map refer to different provinces.
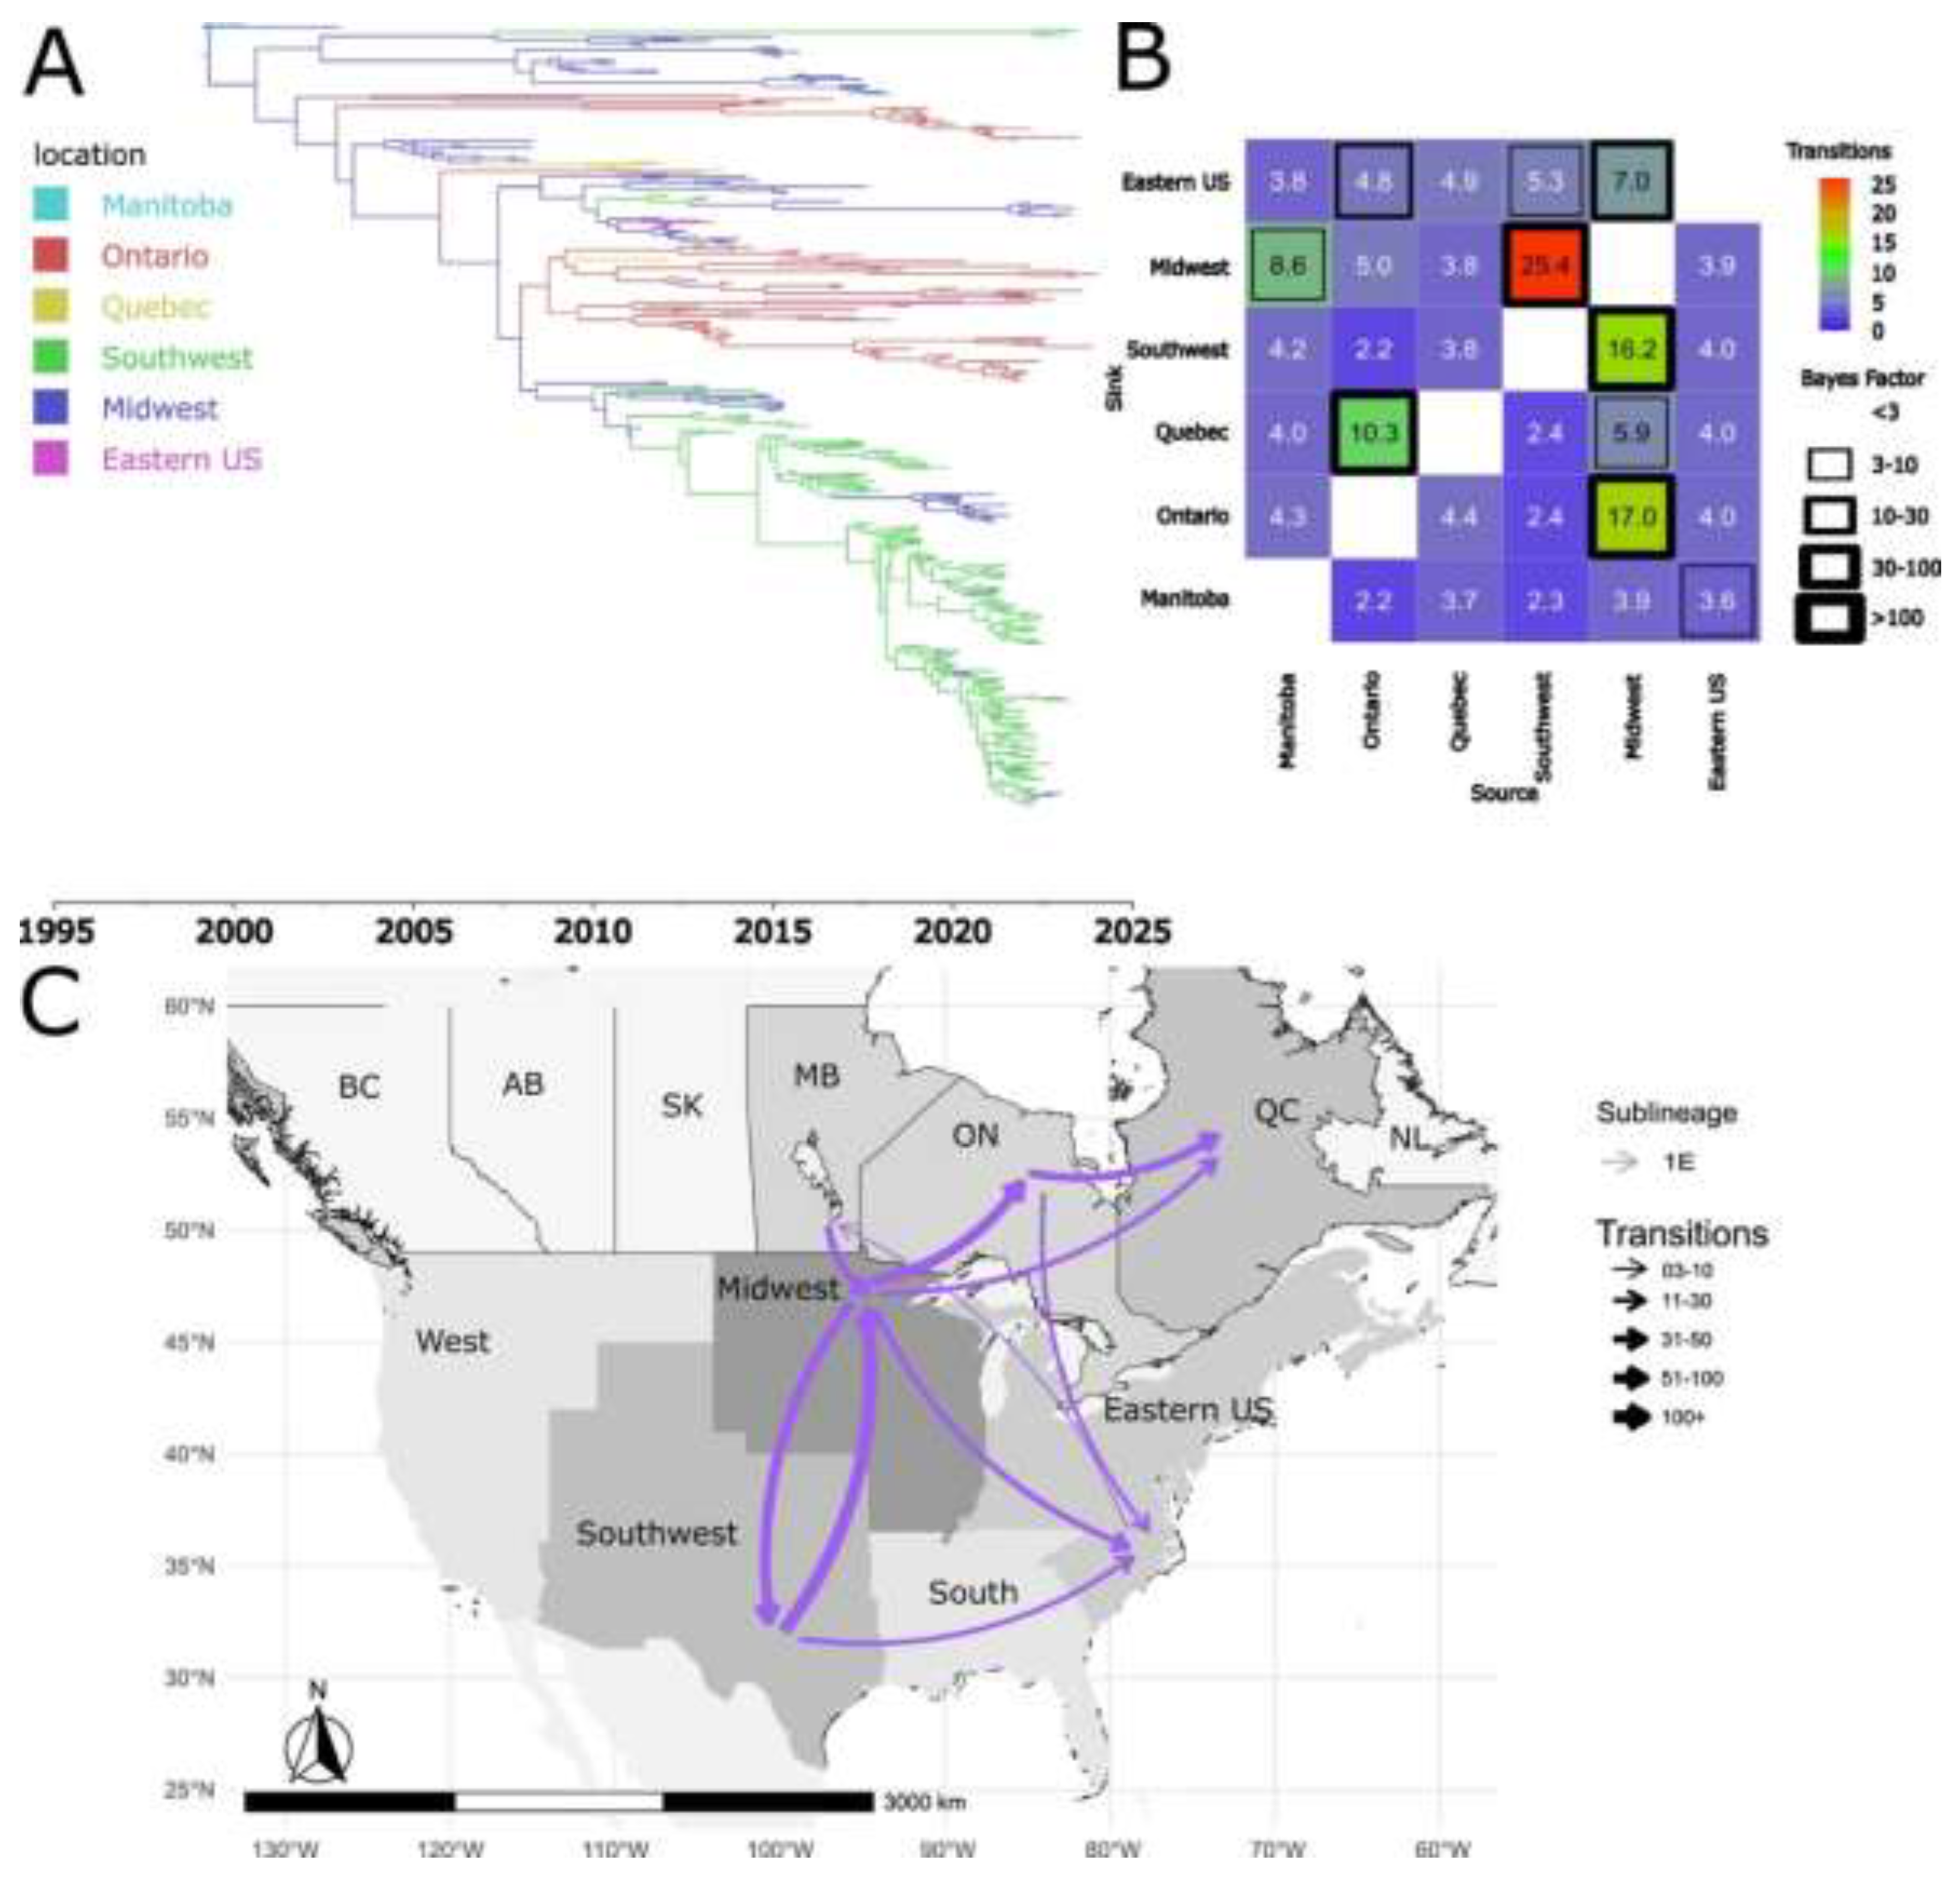
Figure 8.
Spatiotemporal dynamics of the PRRSV-2 1B sub-lineage in North America. A) The panel on the top left shows a maximum clade credibility (MCC) phylogenetic tree reconstructed using a discrete-space diffusion model. B) The heatmap panel on the top right displays number of transition between different regions, represented by color gradients and numerical values within each cell. Warm colors indicate high transition counts, while cool colors indicate low transitions counts. The thickness of the black boxes around the cells indicates the magnitude of the Bayes factor; only Bayes factors above 3 were considered significant. C) The bottom panel shows spread pathway. Arrows indicate the direction of spread, and their thickness represents the transition numbers. The USA regions shown correspond to swine-producing areas, defined based on animal density according to SHIC. The abbreviations on the Canada map refer to different provinces.
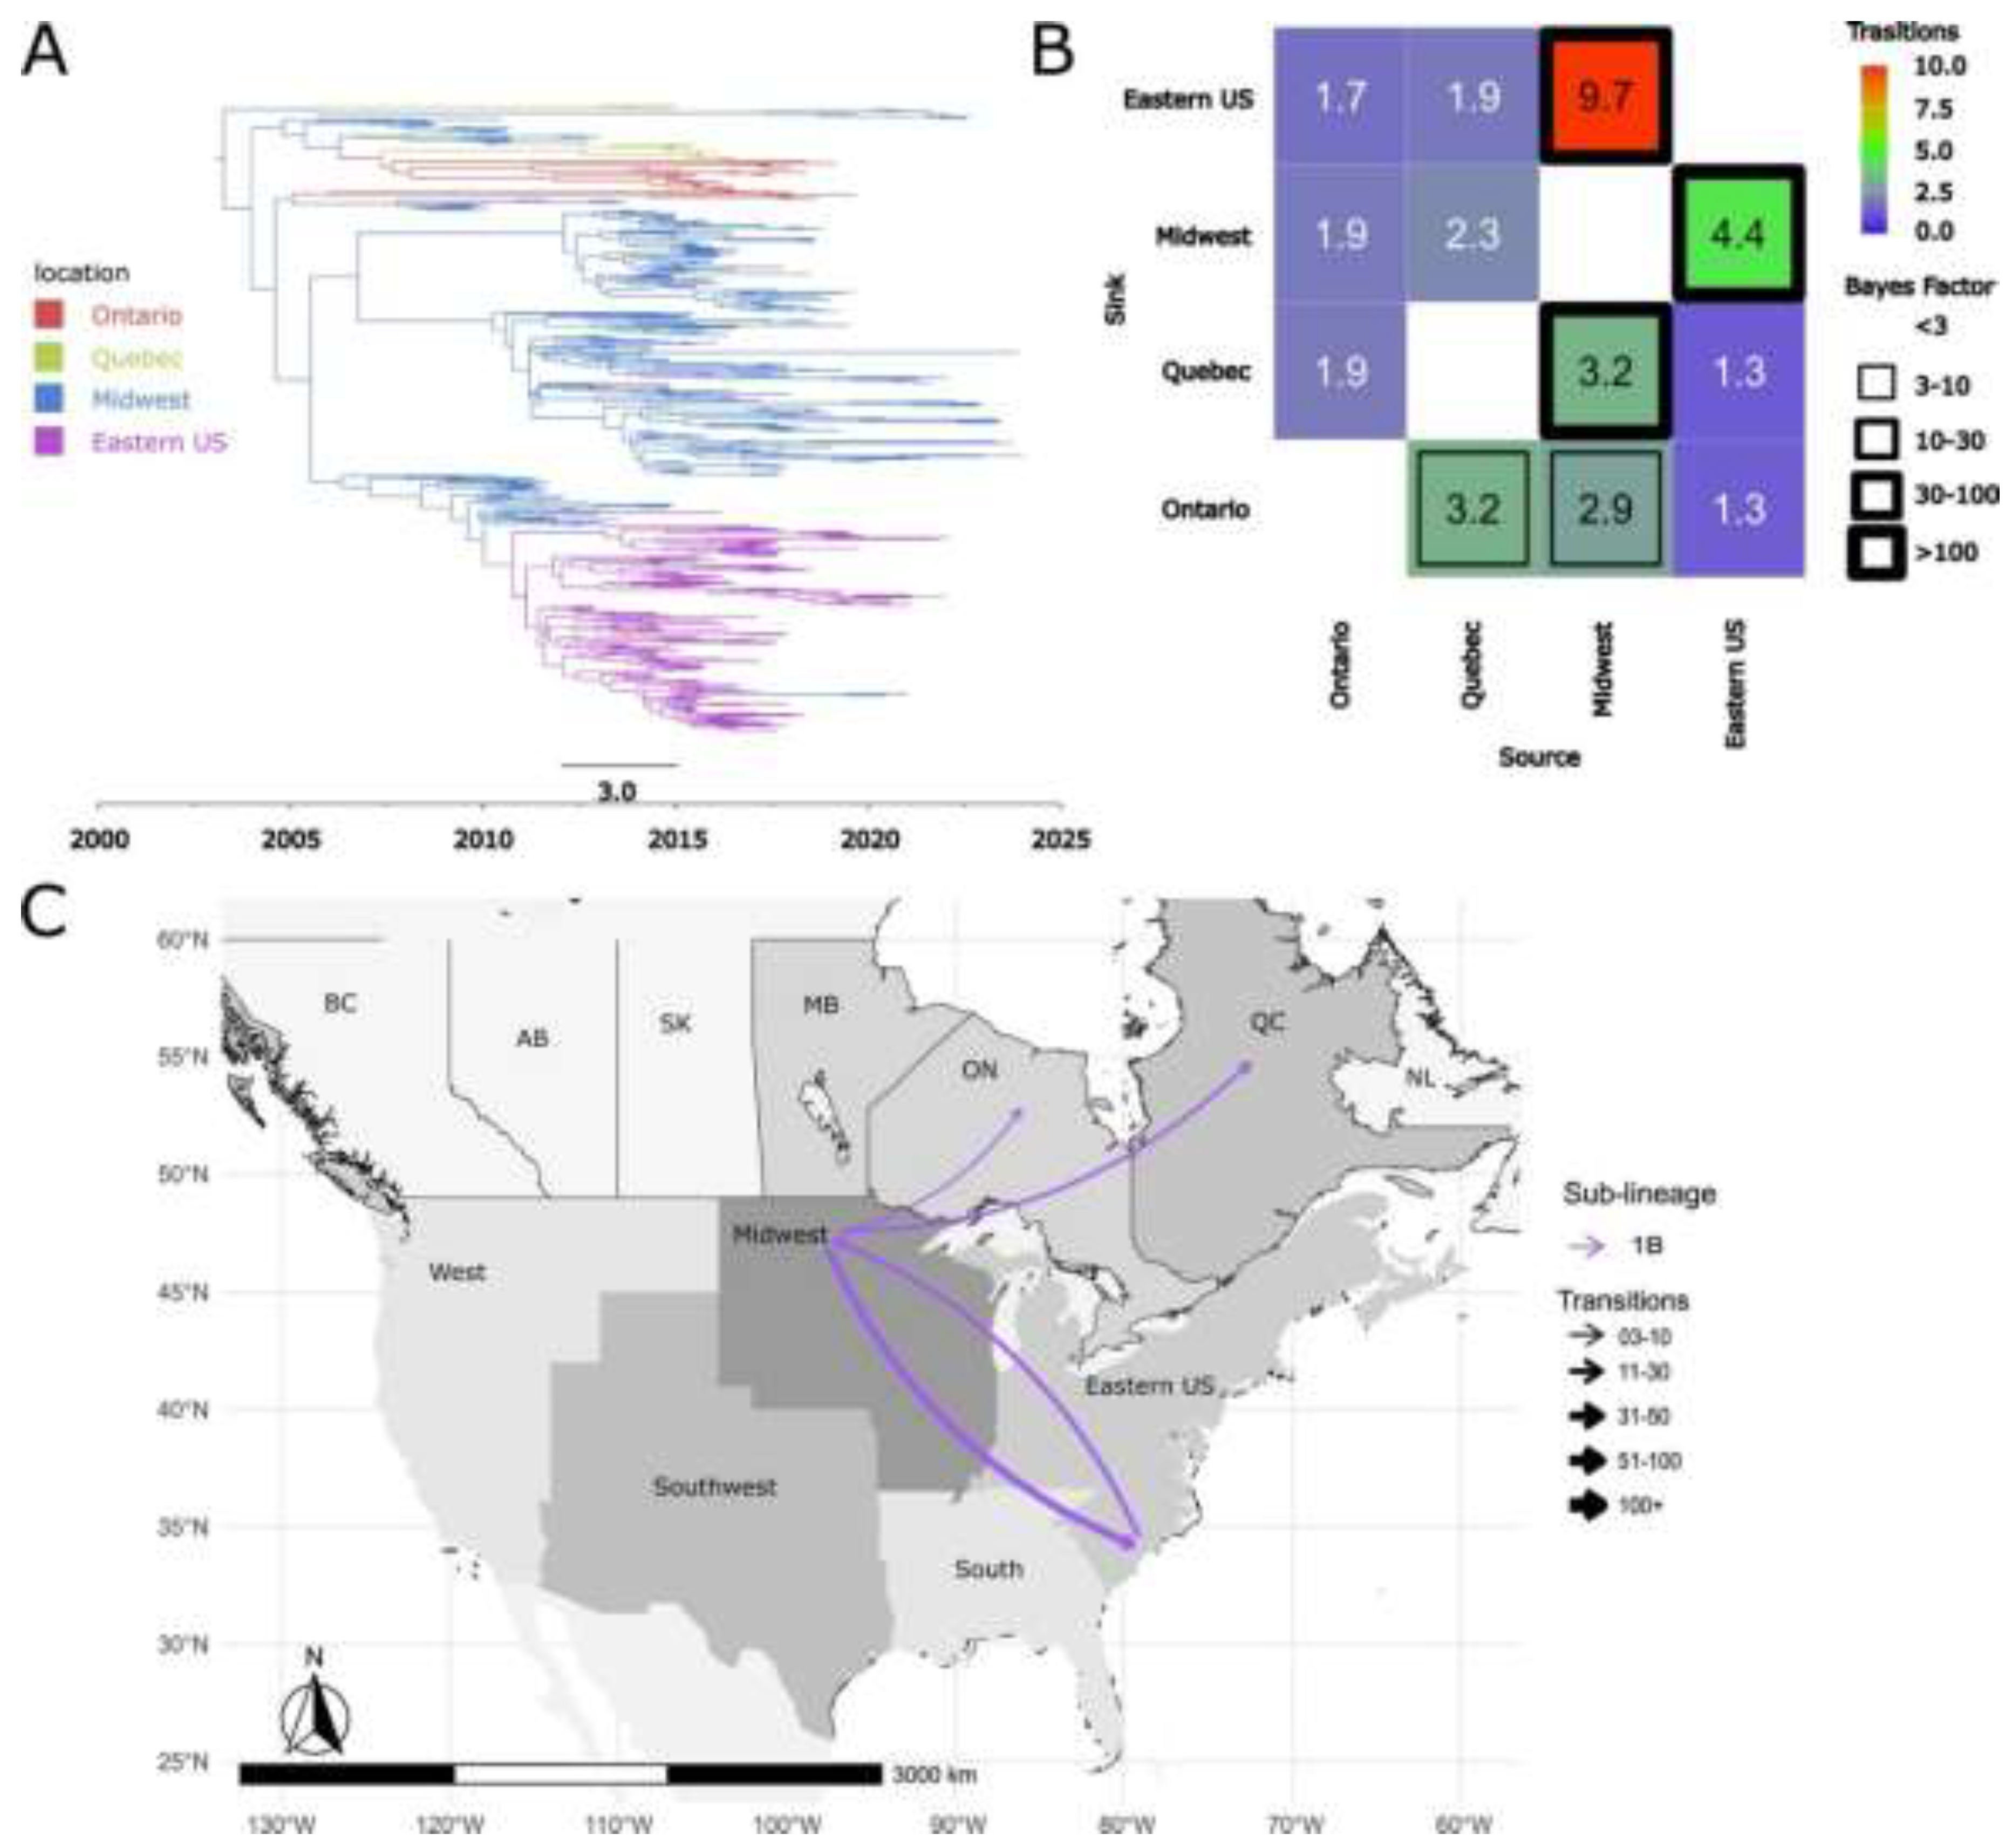
Figure 9.
MCC phylogenetic tree of ORF5 from PRRSV-2 Lineage 1. Branch lengths represent the mean divergence time in years, which is also indicated in the node labels. The different colors represent each of the PRRSV-2 sub-lineages. The tree is automatically rooted using a relaxed log-normal molecular clock.
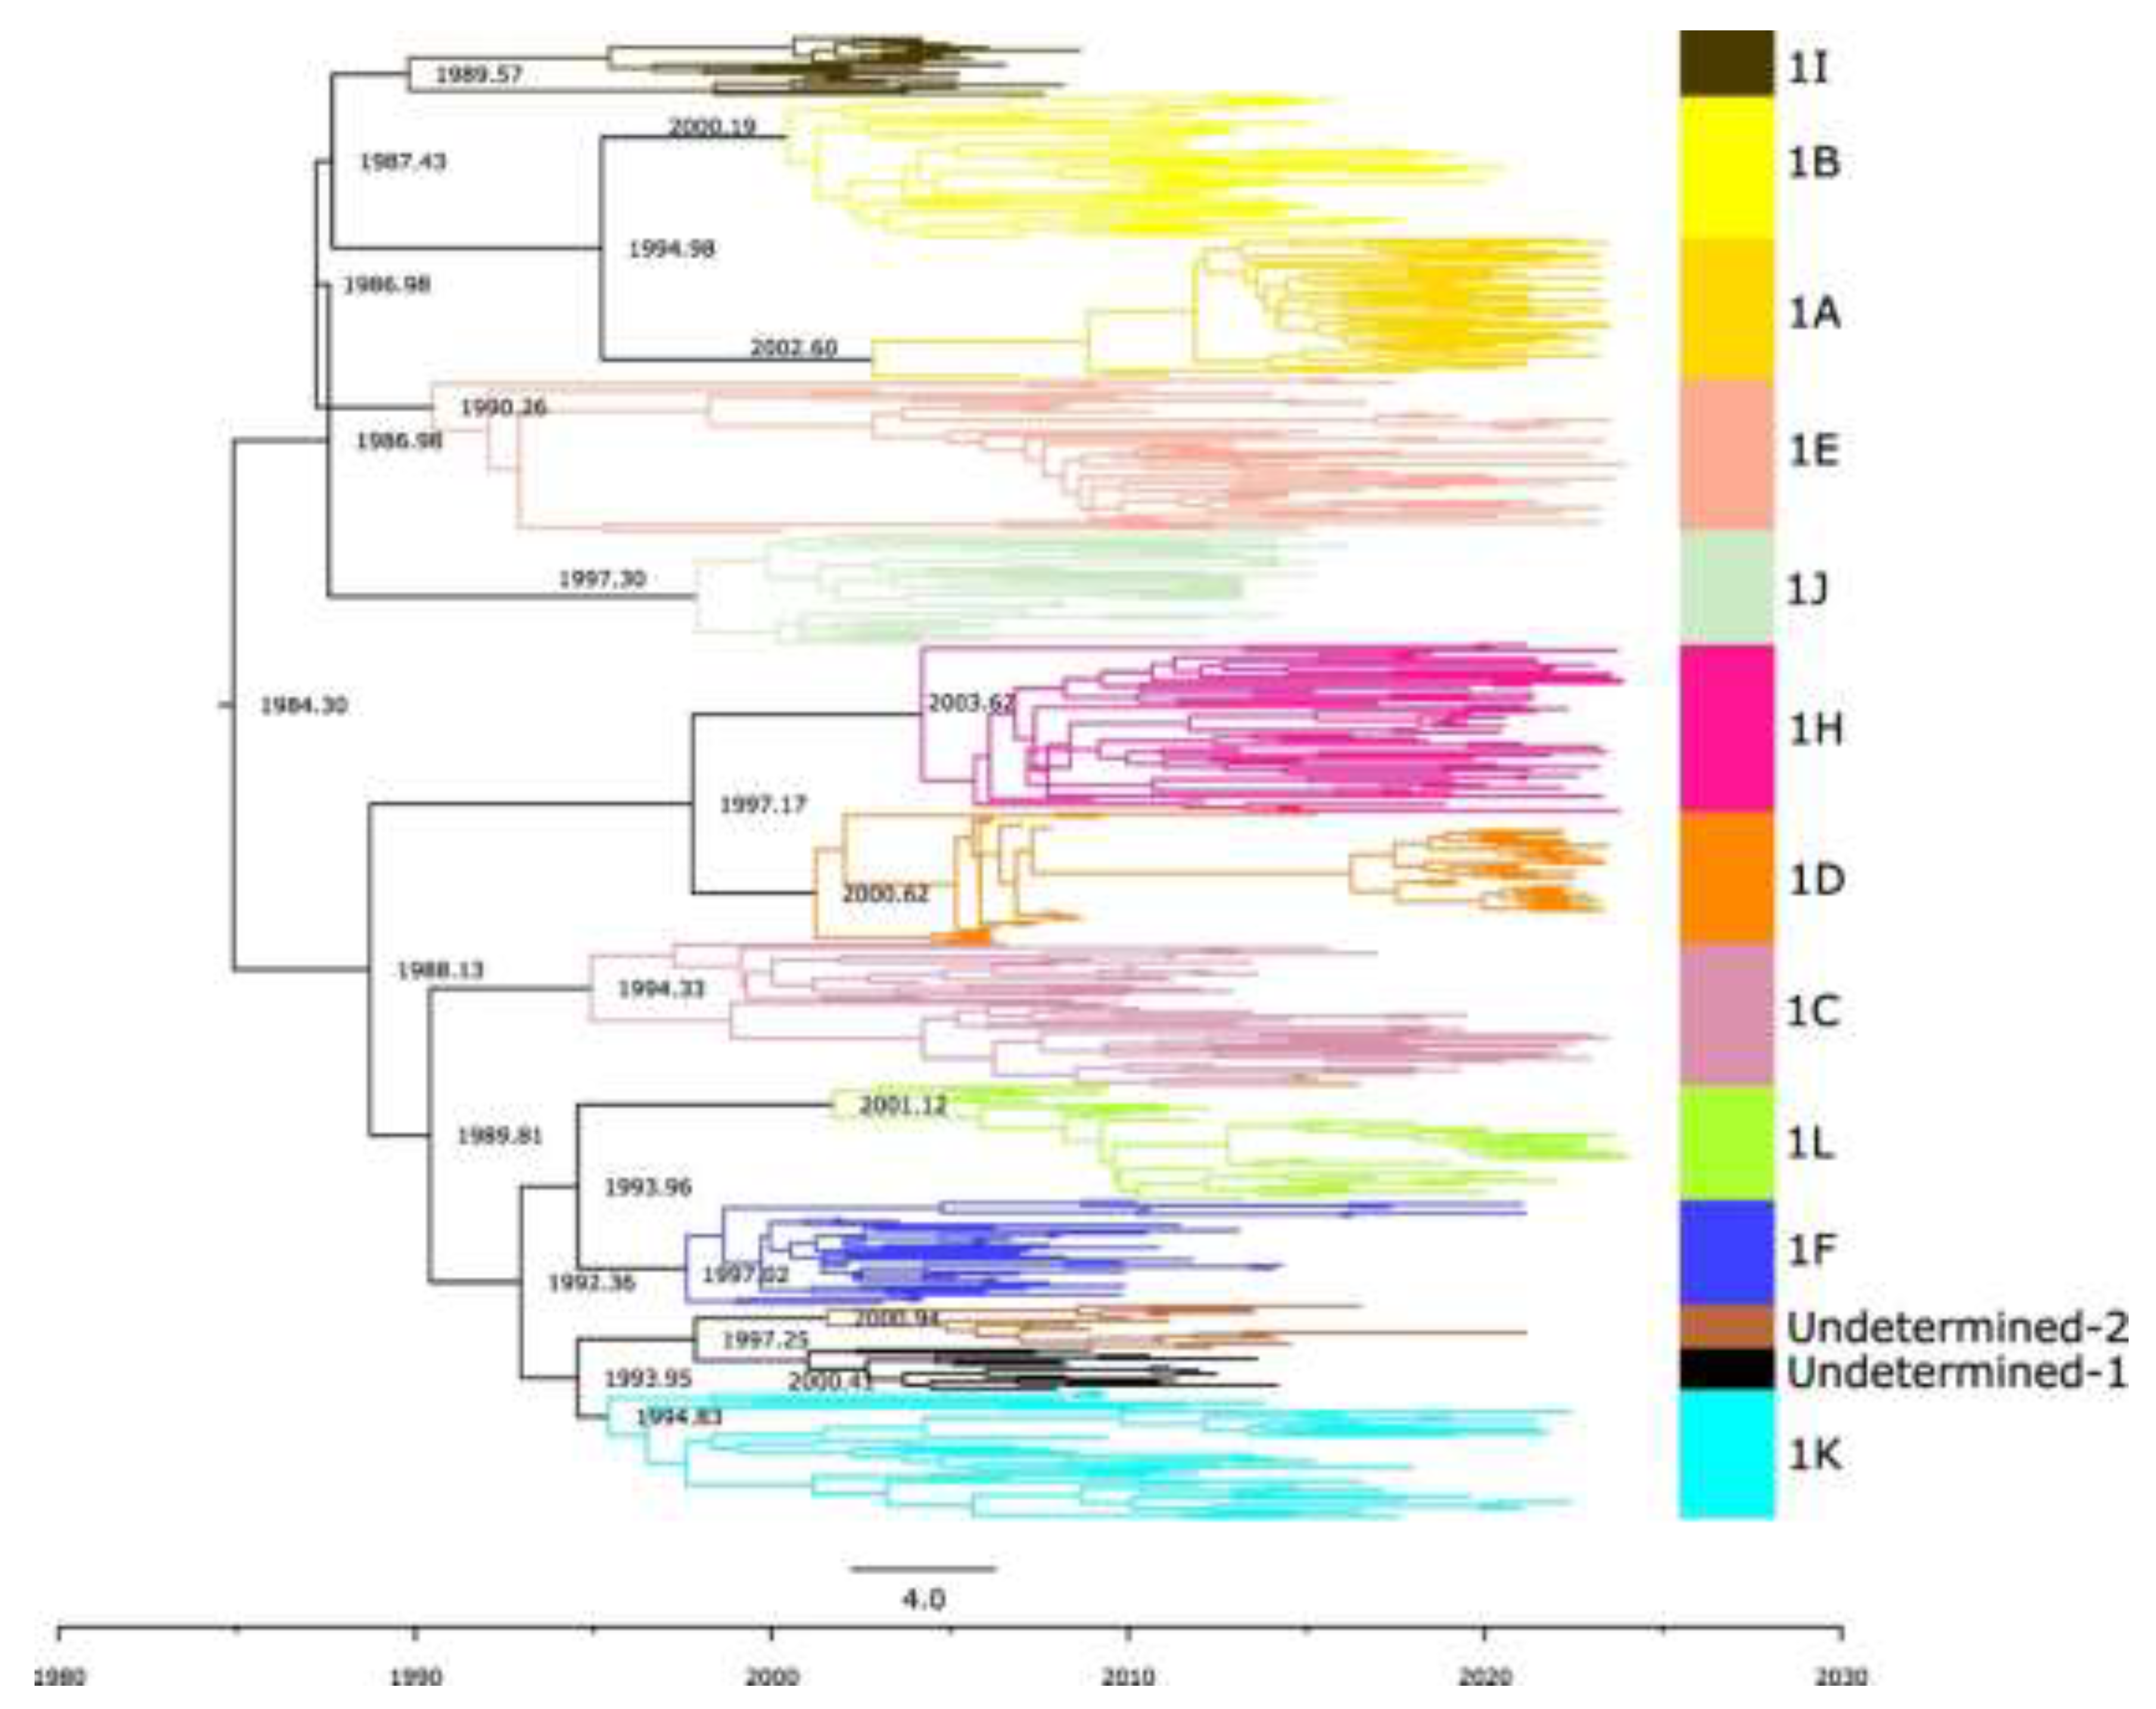
Disclaimer/Publisher’s Note: The statements, opinions and data contained in all publications are solely those of the individual author(s) and contributor(s) and not of MDPI and/or the editor(s). MDPI and/or the editor(s) disclaim responsibility for any injury to people or property resulting from any ideas, methods, instructions or products referred to in the content. |
© 2026 by the authors. Licensee MDPI, Basel, Switzerland. This article is an open access article distributed under the terms and conditions of the Creative Commons Attribution (CC BY) license (http://creativecommons.org/licenses/by/4.0/).
Copyright: This open access article is published under a Creative Commons CC BY 4.0 license, which permit the free download, distribution, and reuse, provided that the author and preprint are cited in any reuse.


