
Submitted:
06 January 2026
Posted:
08 January 2026
You are already at the latest version
Abstract
This study quantified the analytical performance of an automated videotopography system for dry eye disease (DED) and evaluated a novel multivariate composite score to improve diagnostic accuracy. In a prospective, repeated-measures study, 35 adults completed three visits involving automated (Keratograph 5M) and manual (fluorescein break-up time; slit-lamp meniscus height) assessments. Data were analysed using linear mixed-effects models and Bland–Altman plots, while a logistic regression-based Objective Symptom Risk Score (Objective-SRS) was derived to predict symptom status. Results showed that automated meniscus height (NIKTMH) had excellent precision (CV 8.8%) and reliability (ICC 0.727), whereas non-invasive break-up times were highly variable (CV > 40%). Automated and manual measures demonstrated wide limits of agreement and systematic bias, precluding interchangeability. While individual objective tests failed to differentiate symptom groups, the composite Objective-SRS achieved good accuracy (AUC 0.768) and superior net clinical benefit. The study concludes that diagnostically useful information is distributed across multiple signals; thus, automated and manual measures should be used complementarily, with multivariate models offering superior discrimination of DED symptom burden.
Keywords:
dry eye syndromes
; tear break-up time
; corneal topography
; reproducibility of results
; tear film height
1. Introduction
Dry eye disease (DED) is a multifactorial condition characterised by a loss of homeostasis of the tear film, resulting in ocular symptoms and visual disturbances that affect between 5% and 50% of the global population [1,2]. As tear film instability is a core pathophysiological mechanism, its accurate and reliable quantification is critical for both diagnosis and management [1]. Historically, the clinical standard for this assessment has been the fluorescein tear film break-up time (FBUT). However, this method is encumbered by significant limitations: it is inherently subjective, leading to high inter- and intra-observer variability [1,3], and invasive, as the instillation of fluorescein dye alters the surface tension and volume of the tear film, potentially destabilising the very parameter under observation [4].
To address these measurement errors, automated non-invasive technologies have been developed. Systems such as the Oculus Keratograph 5M utilise videotopography, projecting a structured light pattern (e.g., Placido rings) onto the cornea. Automated software algorithms then analyse temporal distortions in the reflected image to quantify tear film break-up time (NIKBUT) and tear meniscus height (NIKTMH) without perturbing the ocular surface [3,5]. Despite the theoretical advantages of these objective systems, validation studies have consistently demonstrated that automated metrics are not interchangeable with manual clinical standards [6,7,8,9,10,11]. Large-scale investigations, such as the Dry Eye Assessment and Management (DREAM) study, reported weak correlations between Keratograph-derived metrics and traditional fluorescein break-up times [12]. Furthermore, a profound disconnect frequently exists between objective signs of instability and patient-reported symptoms, suggesting that single-metric thresholds may be insufficient for accurate diagnosis [1,12].
Current research gaps persist regarding the optimal utilisation of these automated systems. While global averages of tear stability are commonly reported, the spatial distribution of tear film break-up - whether it occurs centrally or paracentrally - may offer distinct diagnostic insights that global averages miss. Additionally, the reliance on isolated cut-off values for NIKBUT or NIKTMH often yields modest diagnostic sensitivity [4,7,13]. From a bioengineering perspective, this suggests that the diagnostic signal may not reside in a single parameter but rather requires a multivariate approach to bridge the sign-symptom gap.
Therefore, this study aimed to perform a comprehensive validation of an automated videotopography system. A prospective, repeated-measures design was employed to quantify the analytical performance (precision, reliability, and measurement error) of automated stability and volume metrics against manual standards. Furthermore, the study investigated the spatial dynamics of tear film instability and evaluated the clinical utility of a novel, device-native multivariate composite score (Objective-SRS). Principal findings indicate that while automated and manual methods are not interchangeable, a multivariate logistic model significantly outperforms individual indices in differentiating symptomatic from asymptomatic individuals, advocating for a computational approach to dry eye diagnostics.
2. Materials and Methods
2.1. Study Design and Participants
This prospective, single-centre validation study was conducted at the Centre for Contact Lens Research (CCLR), University of Waterloo, Canada, between February and April 2012. The study protocol adhered to the tenets of the Declaration of Helsinki and was approved by the University of Waterloo Office of Research Ethics (ORE #17216). All participants provided written informed consent prior to inclusion.
Participants aged 18 years or older were recruited from an existing patient database. Exclusion criteria included any active ocular pathology, use of ocular medications, contact lens wear within 24 hours of a study visit, and pregnancy or lactation. The study comprised three visits conducted on consecutive days at the same time of day (±10 minutes) to minimise diurnal variation. The starting eye and the initial NIKBUT illumination modality (white or infrared light) were randomly assigned to each participant. To minimise potential bias from tear-film disruption, clinical procedures were performed in a fixed sequence from least to most invasive. At each visit, participants first completed the Schein dry eye questionnaire, followed by non-invasive Keratograph 5M measurements (NIKTMH and NIKBUT). A mandatory washout period of at least 10 minutes was observed, during which participants completed the Ocular Surface Disease Index (OSDI) and McMonnies questionnaires. Subsequently, slit-lamp tear meniscus height (TMH) was measured. Following a second washout period of at least 10 minutes, the most invasive test, fluorescein break-up time (FBUT), was performed. All objective endpoints were captured three times per eye at each of the three visits.
2.2. Primary and Secondary Outcome Measures
Subjective Endpoint (Symptom Severity Score): To generate a robust, single measure of patient-reported symptoms, a composite score was derived. Raw scores from three validated questionnaires (OSDI, McMonnies, and Schein) were independently standardised into z-scores. The final Symptom Severity Score (SSS) for each participant was calculated as the arithmetic mean of these three z-scores.
For classification analyses, participants were dichotomised into “symptomatic” and “asymptomatic” groups based on the median split of the composite Symptom Severity Score. While it is acknowledged that dichotomising continuous variables can result in information loss and reduced statistical power, this approach was chosen to facilitate the calculation of standard diagnostic metrics (sensitivity, specificity) and to align with the binary nature of clinical decision-making (treat vs. no-treat). To ensure the robustness of this classification, the continuous relationship between the composite symptom score and the Objective-SRS was also assessed via correlation analysis.
Objective Endpoints (Clinical Tests):
- Fluorescein Break-Up Time (FBUT): The time in seconds from the last blink to the appearance of the first random dry spot, measured manually at the slit lamp.
- FBUT Spatial Location: The corneal segment (Superior, Inferior, Temporal, Nasal, or Central) where the first tear film break-up was detected.
- Tear Meniscus Height (TMH): The meniscus height in millimetres, measured manually at the slit lamp using a reticule scale.
- NIKBUT First: The time in seconds to the first detected distortion of the Placido rings, measured automatically by the Keratograph 5M.
- NIKBUT Average: The mean of all break-up times detected across the cornea during the measurement period.
- NIKTMH: The non-invasive tear meniscus height in millimetres, measured by the Keratograph 5M under infrared illumination.
- NIKBUT Break-up Area: The percentage of the total measurement area exhibiting tear film break-up during the recording period.
- NIKBUT Measurement Period: The total duration of the automated recording in seconds.
2.3. Development of the Objective Symptom Risk Score (Objective-SRS)
To evaluate the capability of automated metrics to predict symptom status, a multivariate Objective Symptom Risk Score (Objective-SRS) was developed using binary logistic regression. The model was trained on baseline (Visit 1) data to predict the binary symptom classification. Prior to modelling, all predictors were standardised (z-scored) to ensure coefficients were comparable and to aid model convergence. Collinearity diagnostics revealed high variance inflation factors (VIF > 70) between stability metrics. To mitigate this multicollinearity and ensure model stability, L2-penalised logistic regression (Ridge) was employed. The model incorporated five key Keratograph parameters: NIKBUT First, NIKBUT Average, NIKBUT Measurement Period, NIKBUT Break-up Area, and NIKTMH (Table 1).
The log-odds (z) for a participant being classified as symptomatic were calculated using Equation (1):
This log-odds value was transformed into a probability score (Objective-SRS) ranging from 0 to 1 using the standard logistic function shown in Equation (2):
The model coefficients, fixed from Visit 1 data, were applied to data from all three visits. Due to poor day-to-day reliability of the visit-specific scores (ICC = 0.426), the median of the three visit-specific scores was calculated for each participant. This median score served as the definitive Objective-SRS for all subsequent diagnostic and comparative analyses.
2.4. Spatial Allocation for Sectoral Analysis
For the automated NIKBUT, the ocular surface was mapped to a two-dimensional matrix of 192 areas, defined by 24 angular segments (s = 0-23) and eight concentric radial zones (f = 0-7). Radial zones were grouped into three categories: central (f=0), paracentral (f=1-3), and peripheral (f=4-7). Consequently, each matrix area was allocated to one of twelve sectors (e.g., central-superior, paracentral-nasal).
For the manual FBUT, a distinct allocation system was applied. The central corneal region was defined as a 3 mm diameter circle. The remaining surface was divided into four anatomical sectors (superior, inferior, nasal, temporal) using axes at 0°–180° and 90°–270°, with intermediate boundaries at 45° and 135°.
2.5. Statistical Analysis
All data processing and statistical analyses were performed using Python (v3.13.7) and relevant scientific libraries. A p-value < 0.05 was considered statistically significant. A hybrid imputation strategy was employed: missing NIKBUT values due to right-censoring (no break-up within 25 s) were imputed with the maximum value of 25 s using Tobit regression. All other missing data were handled using Multiple Imputation by Chained Equations (MICE). Five imputed datasets were combined using Rubin’s rules for the primary analysis, with sensitivity analyses conducted to confirm robustness.
Data from both eyes were pooled following paired t-tests that revealed no significant inter-eye differences (p > 0.05). Systematic changes across visits were assessed using Repeated Measures ANOVA. Group comparisons were performed using independent t-tests, Mann-Whitney U tests, or Chi-squared tests as appropriate. Analytical performance was quantified via: (1) Intra-session precision using the Coefficient of Variation (CV); (2) Inter-session reliability using the Intraclass Correlation Coefficient (ICC 3,k); (3) Measurement error using the Standard Error of Measurement (SEM) and Minimum Detectable Change (MDC95); (4) Method agreement using Bland-Altman analysis with random-effects; and (5) Spatial repeatability using Krippendorff’s Alpha.
Diagnostic accuracy was evaluated using Receiver Operating Characteristic (ROC) analysis to calculate the Area Under the Curve (AUC) with subject-level bootstrapping (resampling participants rather than records) to generate robust confidence intervals. Optimal cut-offs were determined by Youden’s J statistic. Clinical utility was assessed using Decision Curve Analysis (DCA) to quantify net benefit relative to “treat all” or “treat none” strategies, assuming a symptomatic prevalence of 51.4%.[14] Linear Mixed-Effects Models (LMM) assessed the fixed effects of Symptom Group, Visit, and Illumination on objective endpoints, with Subject ID as a random effect. A post-hoc power analysis was conducted based on observed effect sizes; sample size requirements for future validation were calculated to achieve 80% power () using participant-level aggregated data.
3. Results
3.1. Participant Characteristics and the Symptom–Sign Disconnect
The final analysis included 35 participants (69.4% soft contact lens wearers), classified as either symptomatic (n=18) or asymptomatic (n=17). While the groups were demographically similar, the symptomatic group exhibited significantly higher median symptom scores, confirming the validity of the classification method (Symptom Severity Score effect size, r=0.851). Preliminary analyses confirmed that data could be pooled across eyes (all p>0.47) and averaged across visits (all p>0.33).
The results revealed a significant disconnect between reported symptoms and objective signs. As detailed in Table 21, none of the individual objective clinical measures differed significantly between the two groups. The only metric to demonstrate a significant difference was the composite Objective-SRS (p=0.021), which yielded a large effect size (d=0.817). This discordance is further illustrated in Figure 1, where distributions for traditional metrics overlap substantially between groups.

Table 2.
Baseline demographic and clinical characteristics. values are presented as mean ± standard deviation, median [Interquartile Range], or n (%).
Table 2.
Baseline demographic and clinical characteristics. values are presented as mean ± standard deviation, median [Interquartile Range], or n (%).
| Characteristic | Asymptomatic (n=17) | Symptomatic (n=18) | p-value |
|---|---|---|---|
| Age (years) | 32.9 ± 11.5 | 28.1 ± 7.4 | 0.908 |
| Sex (female) | 10 (58.8%) | 9 (50.0%) | 0.854 |
| Contact Lens Wearers | 12 (71.4%) | 14 (79.1%) | 0.514 |
| Schein Score | 3.0 [2.0 - 4.0] | 6.0 [3.2 - 8.0] | 0.003 |
| OSDI Score | 4.0 [2.0 - 5.0] | 11.0 [6.5 - 17.0] | 0.001 |
| McMonnies Score | 2.0 [1.0 - 4.0] | 9.0 [6.0 - 11.0] | 0.001 |
| Symptom Severity Score (SSS) | -0.544 [-0.764 - -0.359] | 0.267 [0.176 - 0.807] | <0.001 |
| Objective-SRS | 0.544 ± 0.106 | 0.627 ± 0.097 | 0.021 |
| FBUT (s) | 9.69 ± 5.56 [6.83, 12.55] | 8.53 ± 4.99 [6.05, 11.01] | 0.525 |
| Slit Lamp TMH (mm) | 0.24 ± 0.05 [0.21, 0.27] | 0.22 ± 0.04 [0.20, 0.24] | 0.306 |
| NIKBUT First BUT (s) | 10.51 ± 4.52 [8.18, 12.83] | 12.23 ± 4.58 [9.95, 14.51] | 0.527 |
| NIKBUT Average (s) | 12.13 ± 4.19 [9.98, 14.29] | 13.78 ± 4.02 [11.78, 15.78] | 0.250 |
| NIKBUT Area (%) | 2.71 ± 1.02 [2.19, 3.24] | 3.09 ± 1.66 [2.26, 3.91] | 0.494 |
| NIKBUT Max measuring time (s) | 17.06 ± 4.06 [14.97, 19.15] | 18.36 ± 3.59 [16.57, 20.14] | 0.378 |
| NIKTMH (mm) | 0.34 ± 0.11 [0.28, 0.39] | 0.31 ± 0.11 [0.26, 0.37] | 0.507 |
3.2. System Characteristics and Linear Mixed-Effects Models
The influence of the illumination source (white vs. infrared) on NIKBUT metrics was minimal (Table S1, Supplementary Materials). Although pairwise comparisons suggested the NIKBUT Break-up Area was slightly larger under white light, the effect was inconsistent and small. A comprehensive Linear Mixed-Effects Model (LMM) confirmed that illumination had no significant main effect on any NIKBUT endpoint (p>0.05).
The LMM analysis further reinforced the central finding of a symptom–sign disconnect (Table S2, Supplementary Materials). With the exception of the composite Objective-SRS, Symptom Group was not a statistically significant predictor for any objective endpoint. Similarly, study visit and illumination type exhibited no significant fixed effects. Based on these outcomes, data from both illumination modalities were pooled for subsequent analyses to increase statistical power.
3.3. Analytical Validation
The analytical performance of the tests varied significantly (Table 3). Automated NIKTMH demonstrated excellent intra-session precision (CV = 8.8%) and the highest day-to-day reliability (ICC = 0.727). In contrast, NIKBUT metrics were highly imprecise (CV > 40%), while both the Objective-SRS and slit-lamp TMH demonstrated poor reliability (ICC approx. 0.4). Notably, the reliability of tear stability measures was consistently lower in the symptomatic group. From a clinical perspective, measurement error was substantial for some tests; the Minimum Detectable Change (MDC95) for FBUT was 9.3 seconds, indicating that only changes exceeding this threshold can be confidently attributed to clinical variation rather than measurement noise.
3.4. Method Comparison
Automated and manual methods were found not to be interchangeable. A correlation matrix revealed only weak correlations between automated and manual methods for both tear volume (NIKTMH vs. Slit Lamp TMH, r=0.33) and stability (Objective-SRS vs. FBUT, r=0.02) (Figure 2a).
Bland-Altman analysis confirmed this poor agreement (Figure 2b–d). For tear stability, NIKBUT measurements were consistently longer than FBUT, exhibiting exceptionally wide 95% limits of agreement and significant proportional bias. For tear volume, NIKTMH measured slightly higher than slit-lamp TMH, again with limits of agreement too wide for clinical substitution.
3.5. Diagnostic Accuracy
The composite Objective-SRS was the most accurate metric for differentiating between symptom groups. As shown in Figure 3 and Table 4, the Objective-SRS demonstrated the highest overall discriminatory power (AUC=0.768), achieving a sensitivity of 72.2% and specificity of 82.4% at its optimal data-driven cut-off. In contrast, all individual tests exhibited only fair discriminatory ability. When using established clinical cut-offs, the tests provided mixed performance, often characterised by high specificity (88.2%) but low sensitivity (27.8%), or vice versa.
3.6. Decision Curve Analysis (DCA)
DCA indicated that the Objective-SRS and manual Slit Lamp TMH offered the most significant clinical utility for decision-making (Figure 4). For tear stability tests, the Objective-SRS was the only metric that consistently provided a clear net benefit over the default strategy of treating all patients. For tear volume, the manual slit-lamp TMH demonstrated slightly superior clinical utility compared to its automated counterpart. The analysis suggested that these diagnostic tools are most useful for clinicians managing patients at moderate risk (i.e., at a 20–50% decision threshold), offering limited advantage in very low- or high-risk scenarios.
3.7. Spatial Dynamics
Analysis of tear film break-up revealed that NIKBUT and FBUT capture fundamentally different spatial phenomena (Figure 5 and Figure 6; detailed analysis in Tables S3 and S4, Supplementary Materials). For NIKBUT, break-up predominantly occurred in the paracentral zone, with a higher incidence in the symptomatic group (62.8%) compared to the asymptomatic group (53.1%). In contrast, FBUT events were heavily concentrated in the central zone for both groups, though significantly more so in asymptomatic (96.7%) than symptomatic (85.9%) patients.
Break-up time analysis also showed significant differences between locations for each method. For NIKBUT (Figure 5), central zones had the shortest break-up times, while paracentral zones (e.g., nasal, temporal) had the longest. For FBUT (Figure 6), symptomatic patients exhibited significantly shorter break-up times in the superior zone (-6.47 s, p<0.001) compared to asymptomatic patients. Despite these clear group-level patterns, the most critical finding was that the intra-subject repeatability of the break-up location was very poor (Krippendorff’s α=0.115–0.308), indicating that while spatial analysis provides mechanistic insight, the high variability of break-up location limits its reliability as a biomarker for individual patients.
3.8. Sensitivity and Power Analysis
A sensitivity analysis confirmed the robustness of the statistical models, demonstrating that the findings were not an artefact of the data imputation process. The post-hoc power analysis revealed that the Objective-SRS was a robust metric, successfully differentiating between symptomatic and asymptomatic participants with a large effect size (Cohen’s d=0.82); the current sample size provided 98% power to detect this difference. For future validation studies, a total of 48 participants would be required to replicate this effect with 80% power, while studies assessing reliability should aim for at least 50 participants.
4. Discussion
This validation study yields four principal inferences that refine the contemporary understanding of diagnostic testing in DED. First, it confirms a profound discordance between patient-reported symptom burden and objective clinical signs [1,18]. In the present dataset, no single objective endpoint differed significantly between symptom-defined groups, with the exception of the multivariable Objective-SRS, which showed significant separation. The mixed-effects models likewise demonstrated no systematic effect of symptom group, reinforcing the absence of a simple signs–symptoms mapping in this cohort. Second, the study quantifies analytical performance, demonstrating excellent precision and moderate-to-good day-to-day reliability for NIKTMH, contrasted with critically poor intra-session precision and symptom-dependent reliability for NIKBUT. Third, rigorous method-comparison statistics corroborate the non-interchangeability of automated and conventional measures. Finally, a multivariate, device-native composite (Objective-SRS) outperforms any single metric for differentiating symptomatic from asymptomatic participants, indicating that an informative diagnostic signal is distributed across parameters rather than concentrated in one measure [19].
The primary finding of a profound disconnect between signs and symptoms reinforces a well-established concept in DED, previously reported in large cohorts like the DREAM study [18,20,21]. By demonstrating this disconnect under rigorously controlled conditions, the results suggest it is a true biological feature of the disease rather than an artefact of testing variability. This aligns with the current TFOS DEWS III framework, which recognises that neurosensory abnormalities - alongside tear film instability and inflammation - are core aetiological drivers [1,22,23]. This sign–symptom disconnect may be explained by a neuropathic phenotype in the symptomatic group, where centrally mediated pain becomes decoupled from peripheral tear-film metrics [24,25]. Clinical data support this view, showing that patients with neuropathic ocular pain often exhibit severe symptoms with minimal objective signs [26]. A key clinical implication is that when a marked sign–symptom mismatch is observed, clinicians should consider targeted assessment for neuropathic pain, for instance, using a topical anaesthetic challenge [27].
Consequently, the lack of difference in individual tests like FBUT or NIKBUT should not be interpreted as instrument failure, but rather as an expected outcome of DED’s heterogeneous pathophysiology. The superior performance of the Objective-SRS is therefore critical. However, it is important to clarify the distinction between analytical validity and clinical utility. While the individual metrics showed poor analytical precision (high CV), the multivariate model demonstrated high diagnostic accuracy (AUC = 0.77). Clinically, the Objective-SRS is not proposed as a standalone diagnostic replacement for clinician judgement, but as a computational decision-support construct. By aggregating diffuse signals that are individually noisy, the algorithm provides a probability index that supports the clinician in managing the ambiguity of the symptom–sign disconnect. This motivates a paradigm shift: multivariable composite scores should be leveraged to broaden evaluation beyond the tear film to include neurosensory mechanisms when signs and symptoms are dissociated.
The analytical performance of volume- and stability-oriented tests diverged substantially, with direct consequences for clinical monitoring. While NIKTMH demonstrated excellent precision and the best day-to-day reliability, NIKBUT was highly imprecise, and its reliability was only moderate and dependent on symptom status. Critically, the large MDC95 for stability tests implies that substantial changes must be observed before they can be confidently attributed to biology rather than measurement noise. These performance differences lead to two key clinical inferences. First, FBUT is poorly suited for tracking incremental change; its large measurement error (MDC95 = 9.3 s) means a change from 4 to 8 seconds cannot be reliably distinguished from noise. In contrast, NIKTMH is a more plausible candidate for longitudinal surveillance of tear volume, provided that observed changes exceed its more modest MDC95 of 0.173 mm.
The finding that NIKBUT reliability was lower in symptomatic participants also has conceptual relevance. This could be explained within a neurosensory framework, where altered blink behaviour and sensory gain in symptomatic patients might inflate measurement variance [28]. This reframes high NIKBUT variability: rather than a simple technical limitation, it could function as an indirect clinical cue for underlying neurosensory dysregulation.
Method comparison analysis confirms the consensus that automated non-invasive indices are not interchangeable with their manual counterparts. Poor agreement was found between NIKBUT and FBUT, characterised by systematic bias (with NIKBUT values being longer) and exceptionally wide limits of agreement. This aligns with a large body of recent evidence demonstrating poor interchangeability across multiple devices [4,7,29]. Mechanistically, it is expected that the instillation of fluorescein for FBUT perturbs the tear film, artificially shortening break-up time values. Similarly, for tear volume, NIKTMH and manual slit-lamp TMH were not interchangeable due to wide limits of agreement. This finding must be contextualised by the fact that the clinical gold standard has since shifted to anterior segment OCT [30]. While early studies suggested the Keratograph underestimated TMH, recent work reports better agreement, likely due to software improvements [31]. This underscores a key challenge in the field: validation evidence for software-driven instruments can become outdated, requiring clinicians to remain vigilant about version-specific performance. Despite this, the findings confirm that automated and manual tests provide related but distinct information and should be used as complementary tools within a multimodal diagnostic strategy.
When using established clinical thresholds, individual tests proved to be poor diagnostic tools due to the classic trade-off between sensitivity and specificity. For example, an FBUT cut-off of <8 s had moderate sensitivity but poor specificity, while TMH and NIKTMH cut-offs achieved high specificity at the cost of very low sensitivity. ROC analysis confirmed the superiority of the composite score. While individual tests like FBUT and NIKBUT demonstrated only poor-to-fair discriminatory power (AUCs 0.56–0.63), the multivariate Objective-SRS was substantially more effective, achieving a good AUC of 0.768. Beyond statistical accuracy, Decision Curve Analysis (DCA) showed that the Objective-SRS was the only stability metric to provide a clear and consistent net benefit over the default strategies of treating all or no patients across a range of clinical scenarios.
Ultimately, these findings indicate that the diagnostic signal in DED is diffuse and cannot be captured by any single test. Meaningful diagnostic power emerges only when multiple parameters are integrated. This conclusion strongly resonates with the TFOS DEWS III diagnostic framework, which emphasises DED’s multifactorial nature and discourages reliance on single-metric cut-offs [1].
The spatial analysis suggests that NIKBUT and FBUT capture fundamentally different physiological phenomena. FBUT events were heavily concentrated in the central cornea, while NIKBUT events occurred predominantly in the paracentral regions. This supports the hypothesis that central FBUT may reflect aqueous deficiency patterns, while paracentral NIKBUT could indicate localised issues like poor wettability or altered lipid spreading, features consistent with evaporative dry eye [32,33]. This mechanistic distinction aligns with recent evidence suggesting that spatial mapping could help differentiate between DED subtypes [28,34]. However, despite these mechanistically plausible group-level findings, the clinical utility of spatial mapping is currently limited by extremely poor intra-subject repeatability. The location of the first tear film break-up appears to be a stochastic event, highly sensitive to micro-variations in blink completeness and local tear composition. Therefore, while spatial analysis is a valuable research tool for understanding disease heterogeneity, its high variability makes it unsuitable for routine clinical decision-making at the individual level.
This study has several notable strengths, including its prospective, repeated-measures design, which allowed for a robust quantification of intra- and inter-session variability and the calculation of clinically crucial metrics like the MDC95. The key innovation, however, is the development and validation of the Objective-SRS. By demonstrating that a multivariate composite index could capture variance missed by single tests, this work provides a template for extracting a more powerful signal from existing hardware.
The study’s findings must be interpreted within the context of the dataset’s age (2012). It is crucial to distinguish between findings that are algorithm-dependent versus those that are platform-invariant. Absolute values of NIKBUT and NIKTMH are subject to proprietary software changes and may differ in contemporary devices [21,31]. However, the platform-invariant findings—specifically the spatial distribution of break-up (central vs. paracentral), the magnitude of measurement noise (MDC95), and the fundamental symptom–sign disconnect - reflect physiological realities that persist regardless of software version. Furthermore, the Objective-SRS framework proposed here is intended to be device-agnostic in principle, serving as a valid engineering template even if specific coefficients require recalibration. Beyond the dataset age, other limitations exist. Methodologically, dichotomising participants into symptomatic and asymptomatic groups via a median split is a simplification of the continuous spectrum of DED, though it is necessary for binary classification modelling. Furthermore, the single-centre design and modest sample size may limit generalisability, although power analysis confirmed the study was well-powered (98%) to detect the large effect size of the Objective-SRS. Finally, while the neuropathic hypothesis provides a compelling framework, this study lacked direct measures of neurosensory function.
Future research should focus on three priorities: (1) External validation of the Objective-SRS in a multi-centre, demographically diverse cohort; (2) Contemporary re-validation benchmarking NIKTMH against anterior segment OCT; and (3) Mechanistic investigation incorporating neurosensory endpoints to directly test the neuropathic hypothesis.
5. Conclusions
This study highlights both the limitations and opportunities of modern non-invasive tear film assessment. It is concluded that the path forward for DED diagnostics does not lie in the search for a single perfect biomarker, but rather in the integration of multiple objective measures. The validation of the Objective-SRS demonstrates that intelligent integration of automated signals can bridge the sign–symptom disconnect, offering a superior method for aligning diagnostic output with the lived experience of patients and enhancing the precision of clinical decision-making.
Supplementary Materials
The following supporting information can be downloaded at the website of this paper posted on Preprints.org. Table S1: Comparison of automated tear film metrics between white and infrared illumination; Table S2: Summary of linear mixed-effects model results for key objective endpoints; Table S3: Distribution of NIKBUT First and FBUT events by corneal zone and symptom group; Table S4: Comparison of mean tear break-up time by method, corneal zone, and symptom group.
Author Contributions
D.O. was responsible for Conceptualisation, Methodology, Software, Validation, Formal Analysis, Investigation, Resources, Data Curation, Writing - Original Draft Preparation, Writing - Review and Editing, Visualisation, Supervision, Project Administration, and Funding Acquisition. The author has read and agreed to the published version of the manuscript.
Funding
This study was financially supported by Oculus GmbH Wetzlar.
Institutional Review Board Statement
The study was conducted in accordance with the Declaration of Helsinki, and approved by the Office of Research Ethics of the University of Waterloo (ORE #17216, approved February 2012).
Informed Consent Statement
Informed consent was obtained from all subjects involved in the study.
Data Availability Statement
The data presented in this study are available on request from the corresponding author. The data are not publicly available due to privacy restrictions inherent to clinical data collected during this period.
Acknowledgments
The author thanks the Centre for Contact Lens Research (CCLR) at the University of Waterloo, Canada, for facilitating the data collection.
Conflicts of Interest
The author declares the following conflict of interest: D.O. was a consultant with Oculus Optikgeraete GmbH at the time of the data collection. The funders had no role in the design of the study; in the collection, analyses, or interpretation of data; in the writing of the manuscript; or in the decision to publish the results.
Abbreviations
The following abbreviations are used in this manuscript:
| MDPI | Multidisciplinary Digital Publishing Institute |
| ANOVA | Analysis of Variance |
| AUC | Area Under the Curve |
| CI | Confidence Interval |
| CV | Coefficient of Variation |
| DCA | Decision Curve Analysis |
| DED | Dry Eye Disease |
| FBUT | Fluorescein Break-Up Time |
| ICC | Intraclass Correlation Coefficient |
| LMM | Linear Mixed-Effects Models |
| LR | Likelihood Ratio |
| MDC95 | Minimum Detectable Change at 95% Confidence |
| MICE | Multiple Imputation by Chained Equations |
| NIKBUT | Non-Invasive Keratograph Break-Up Time |
| NIKTMH | Non-Invasive Keratograph Tear Meniscus Height |
| NPV | Negative Predictive Value |
| Objective-SRS | Objective Symptom Risk Score |
| OSDI | Ocular Surface Disease Index |
| PPV | Positive Predictive Value |
| ROC | Receiver Operating Characteristic |
| SEM | Standard Error of Measurement |
| SSS | Symptom Severity Score |
| TMH | Tear Meniscus Height |
References
- Wolffsohn, J.S., et al., TFOS DEWS III: Diagnostic Methodology. Am J Ophthalmol, 2025. 279: p. 387–450. [CrossRef]
- Stapleton, F., et al., TFOS DEWS III: Digest. Am J Ophthalmol, 2025. 279: p. 451–553. [CrossRef]
- Li, C., et al., Repeatability and agreement of noninvasive Keratograph 5M and invasive tear film breakup time measurements. Frontiers in Medicine, 2022. 9: p. 883017.
- Szczesna-Iskander, D.H. and C. Llorens-Quintana, Agreement between invasive and noninvasive measurement of tear film breakup time. Sci Rep, 2024. 14(1): p. 3852. [CrossRef]
- Oehring, D. and W. Sickenberger. Prospective Study to Compare Two Different Kinds of Illuminations by Measuring the Non-Invasive Tear Film Break-Up Time by Means of a Novel Video Topographer. in American Academy of Optometry Annual Meeting. 2014. Denver, CO.
- Wang, M.T.M. and J.P. Craig, Comparative Evaluation of Clinical Methods of Tear Film Stability Assessment: A Randomized Crossover Trial. JAMA Ophthalmol, 2018. 136(3): p. 291–294.
- Zeri, F., et al., Comparing automated and manual assessments of tear break-up time using different non-invasive devices and a fluorescein procedure. Sci Rep, 2024. 14(1): p. 2516. [CrossRef]
- Lim, J., M.T.M. Wang, and J.P. Craig, Evaluating the diagnostic ability of two automated non-invasive tear film stability measurement techniques. Cont Lens Anterior Eye, 2021. 44(4): p. 101362. [CrossRef]
- Gallo, V., et al., Tear film stability in dry eye syndrome: Time and break-up patterns. Acta Ophthalmologica, 2022. 100(S275). [CrossRef]
- Jeong, S. and S.B. Lee, Reliability of a New Non-invasive Tear Film Break-up Time Measurement Using a Keratograph. Journal of the Korean Ophthalmological Society, 2016. 57(9): p. 1354–1360. [CrossRef]
- Cox, S.M., K.K. Nichols, and J.J. Nichols, Agreement between Automated and Traditional Measures of Tear Film Breakup. Optom Vis Sci, 2015. 92(9): p. e257–63. [CrossRef]
- Sutphin, J.E., et al., Correlation of Measures From the OCULUS Keratograph and Clinical Assessments of Dry Eye Disease in the Dry Eye Assessment and Management Study. Cornea, 2022. 41(7): p. 845–851. [CrossRef]
- Martinez-Plaza, E., et al., Diagnostic Performance of Visionix VX120+ Platform for Dry Eye Screening. Diagnostics (Basel), 2024. 14(20): p. 2276. [CrossRef]
- Vickers, A.J., B. Van Calster, and E.W. Steyerberg, Net benefit approaches to the evaluation of prediction models, molecular markers, and diagnostic tests. BMJ, 2016. 352: p. i6. [CrossRef]
- Paugh, J.R., et al., Efficacy of the Fluorescein Tear Breakup Time Test in Dry Eye. Cornea, 2020. 39(1): p. 92–98. [CrossRef]
- Wolffsohn, J.S., et al., TFOS DEWS II Diagnostic Methodology report. Ocul Surf, 2017. 15(3): p. 539–574. [CrossRef]
- Akiyama, R., T. Usui, and S. Yamagami, Diagnosis of Dry Eye by Tear Meniscus Measurements Using Anterior Segment Swept Source Optical Coherence Tomography. Cornea, 2015. 34 Suppl 11: p. S115–20. [CrossRef]
- Tawfik, A., et al., Association of Dry Eye Symptoms and Signs in Patients with Dry Eye Disease. Ophthalmic Epidemiol, 2024. 31(3): p. 274–282. [CrossRef]
- Vickers, A.J., B. van Calster, and E.W. Steyerberg, A simple, step-by-step guide to interpreting decision curve analysis. Diagn Progn Res, 2019. 3: p. 18. [CrossRef]
- Greco, G., et al., Association of Severity of Dry Eye Disease with Work Productivity and Activity Impairment in the Dry Eye Assessment and Management Study. Ophthalmology, 2021. 128(6): p. 850–856. [CrossRef]
- Chen, A., et al., The repeatability of tests for dry eye signs and symptoms in the dry eye assessment and management (DREAM) study. Cont Lens Anterior Eye, 2025. 48(2): p. 102322. [CrossRef]
- Craig, J.P., et al., TFOS DEWS II Definition and Classification Report. Ocul Surf, 2017. 15(3): p. 276–283. [CrossRef]
- Jones, L., et al., TFOS DEWS III: Management and Therapy. Am J Ophthalmol, 2025. 279: p. 289–386. [CrossRef]
- Belmonte, C., et al., TFOS DEWS II pain and sensation report. Ocul Surf, 2017. 15(3): p. 404–437. [CrossRef]
- Rosenthal, P. and D. Borsook, Ocular neuropathic pain. Br J Ophthalmol, 2016. 100(1): p. 128–34. [CrossRef]
- Le, D.T.-M., et al., Ocular neuropathic pain in a real-world patient cohort with dry eye disease: a Save Sight Dry Eye Registry study. AJO International, 2024. 1(4): p. 100068. [CrossRef]
- Watson, S.L. and D.T. Le, Corneal neuropathic pain: a review to inform clinical practice. Eye (Lond), 2024. 38(12): p. 2350–2358. [CrossRef]
- Guarnieri, A., et al., Ocular surface analysis and automatic non-invasive assessment of tear film breakup location, extension and progression in patients with glaucoma. BMC Ophthalmol, 2020. 20(1): p. 12. [CrossRef]
- Tashbayev, B., et al., Comparison of non-invasive and fluorescein tear film break-up time in a 65-year-old Norwegian population: a cross-sectional study. BMJ Open, 2025. 15(4): p. e090305. [CrossRef]
- Chen, M., et al., Application of Keratograph and Fourier-Domain Optical Coherence Tomography in Measurements of Tear Meniscus Height. J Clin Med, 2022. 11(5): p. 1343. [CrossRef]
- Yik, A.L.P. and F.S. Barodawala, Tear meniscus height comparison between AS-OCT and Oculus Keratograph(R) K5M. Rom J Ophthalmol, 2024. 68(4): p. 398–403. [CrossRef]
- Liu, Q., et al., Pembrolizumab-associated ocular myasthenia gravis. Clin Exp Ophthalmol, 2019. 47(6): p. 796–798. [CrossRef]
- Yokoi, N.G.G.A. and H. Kato, Classification of fluorescein breakup patterns: a novel method of tear film evaluation. Current Eye Research, 2017. 42(9): p. 1237–1244.
- Tong, L., C.H.Y. Teo, and R.K.J. Lee, Spatial Distribution of Noninvasive Break Up Times and Clinical Relevance in Healthy Participants and Mild Dry Eye. Transl Vis Sci Technol, 2019. 8(5): p. 30. [CrossRef]
Figure 1.
Comparison of ocular surface parameters between asymptomatic and symptomatic subjects. (a) Tear film stability assessed by Fluorescein Break-Up Time (FBUT), Non-Invasive Keratograph Break-Up Time (NIKBUT) First, and NIKBUT Average. (b) Tear volume measured via Tear Meniscus Height (TMH) using slit lamp and non-invasive Keratograph (NIKTMH). (c) Symptom scores, including Subjective Symptom Severity and Objective-SRS, differentiate symptomatic from asymptomatic individuals. Boxplots show medians, interquartile ranges, and outliers.
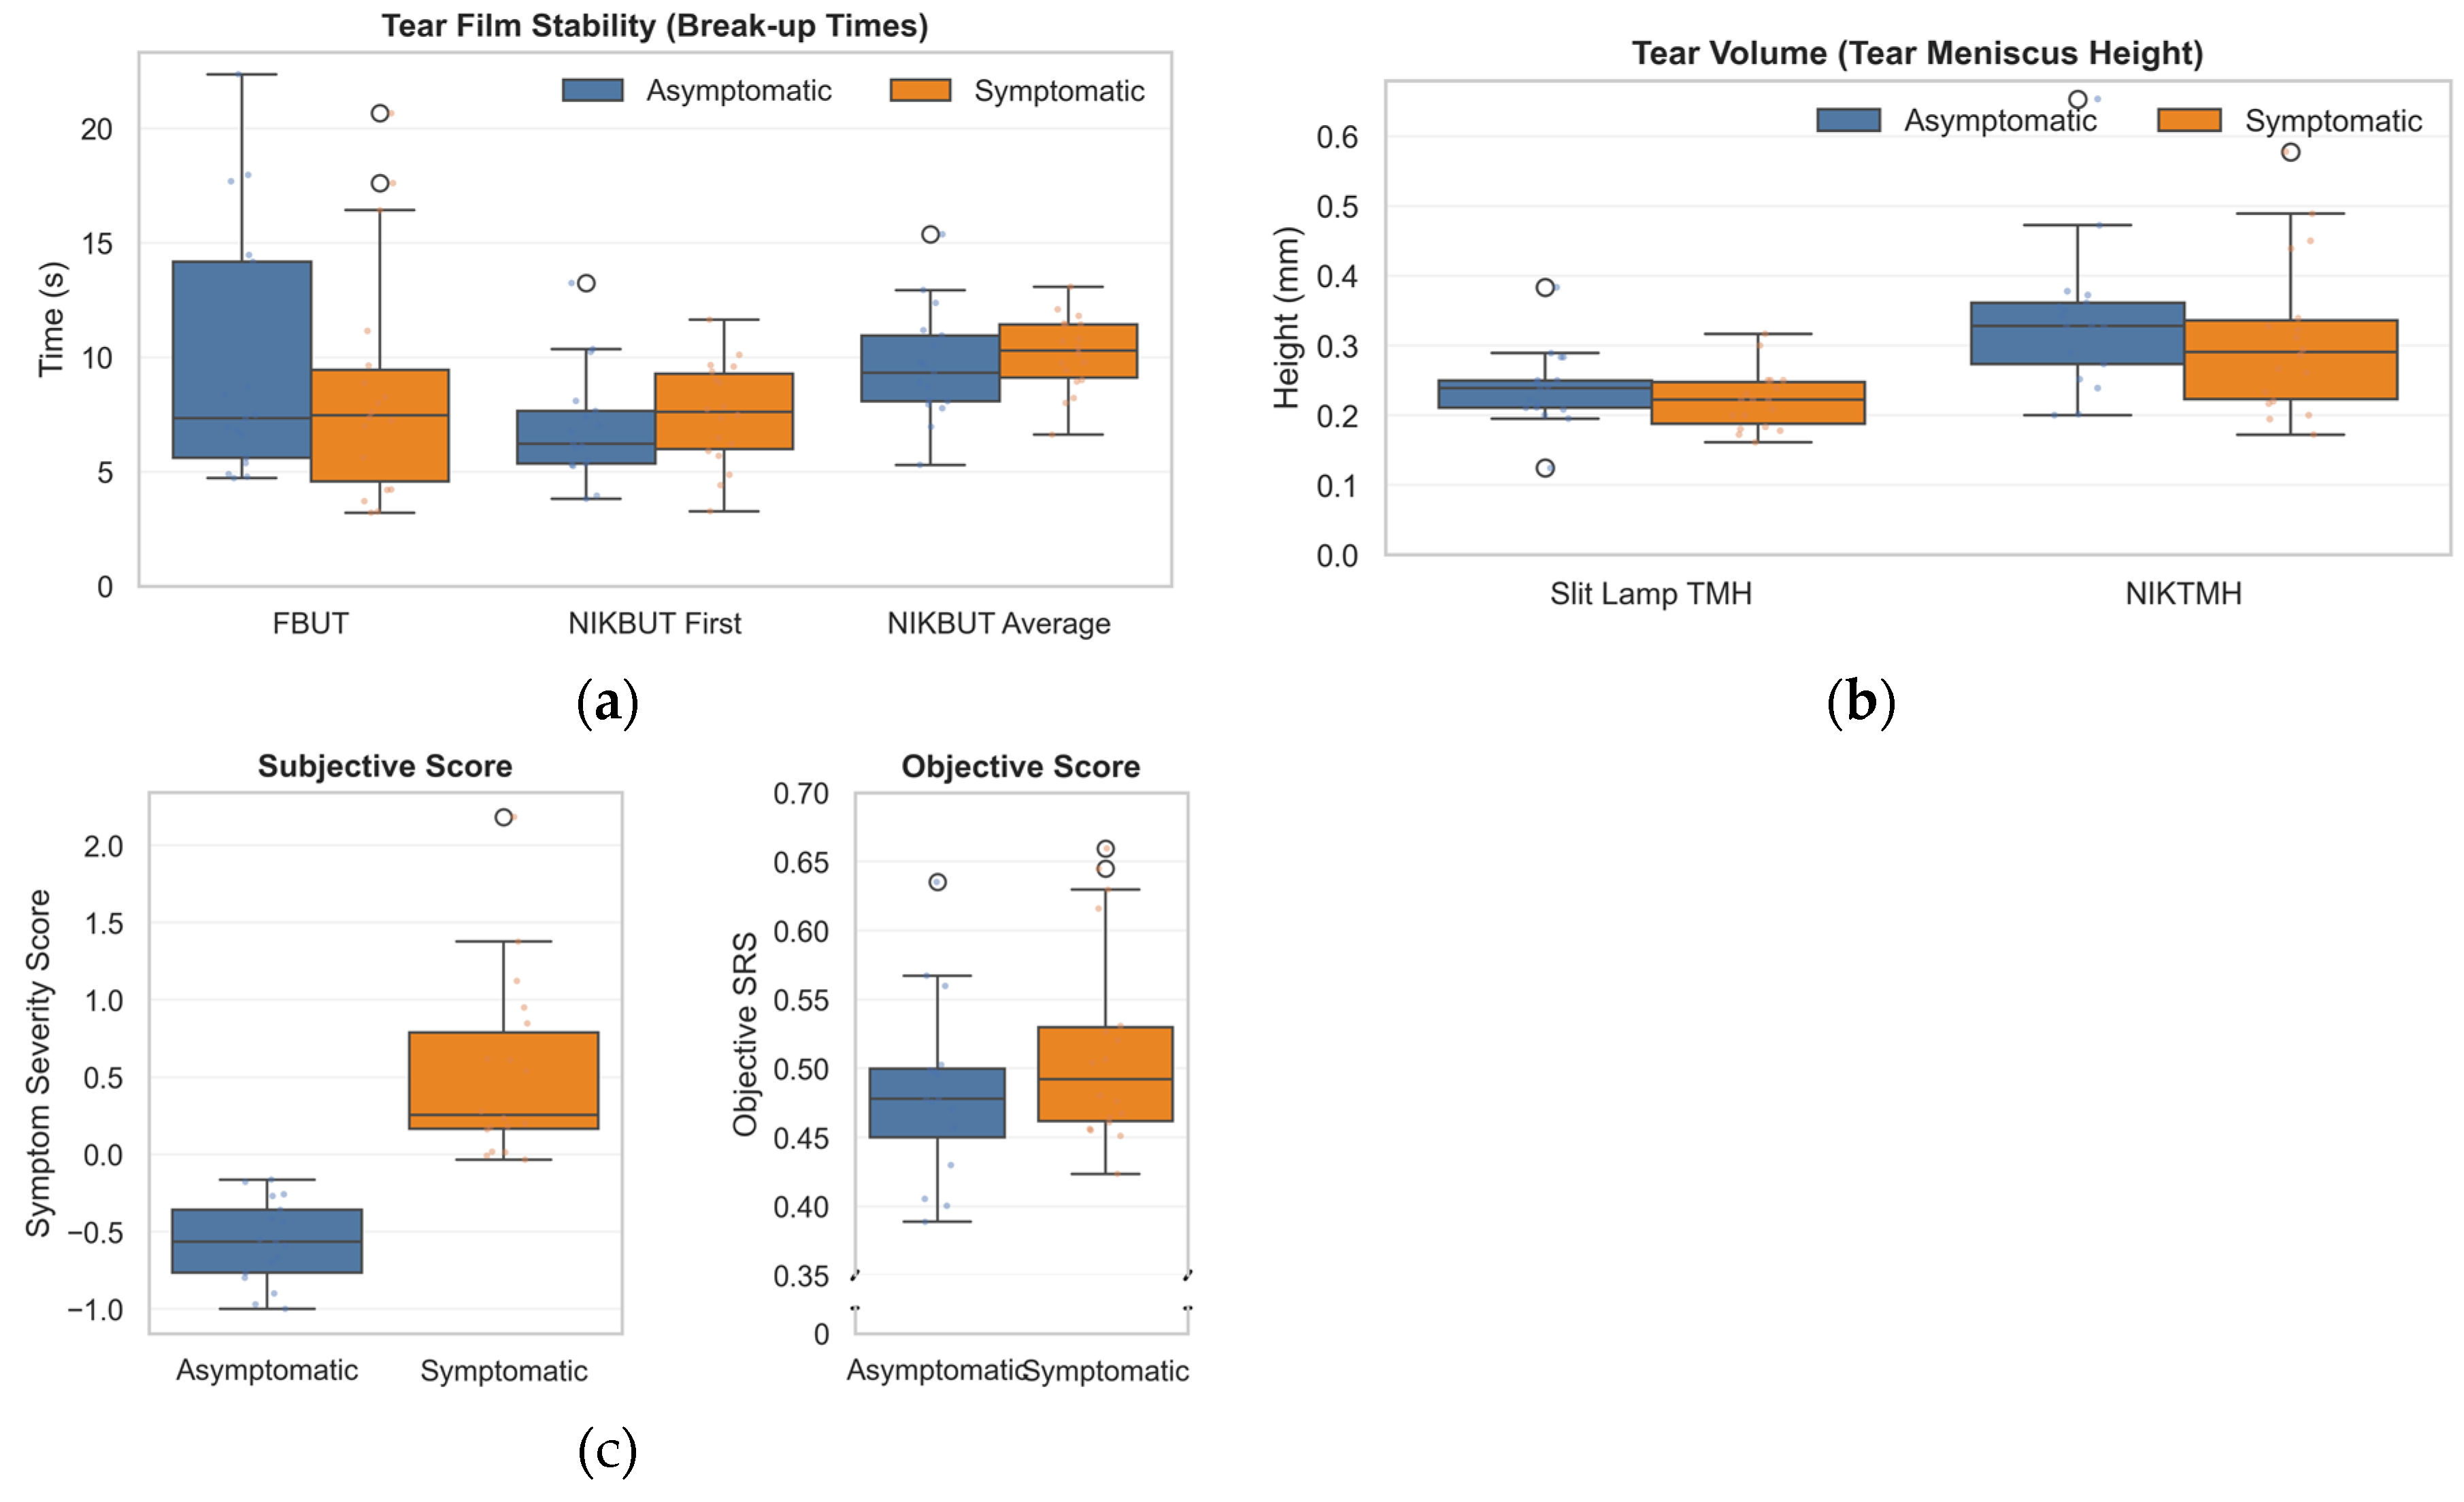
Figure 2.
Method comparison demonstrating poor correlation and agreement between automated and manual clinical measures. (a) Correlation matrix of key subjective and objective endpoints. Note the weak positive correlation between manual slit-lamp tear meniscus height (TMH) and automated non-invasive Keratograph TMH (NIKTMH) (r=0.33), and the near-zero correlation between fluorescein break-up time (FBUT) and the Objective-Symptom Risk Score (Objective-SRS) (r=0.02). (b–d) Bland-Altman plots assessing agreement between methods. The solid line represents the mean bias, and the dashed lines represent the 95% limits of agreement. (b) Comparison of NIKBUT First and FBUT. (c) Comparison of NIKBUT Average and FBUT. Both plots show that NIKBUT measurements are systematically longer than FBUT, with wide and clinically unacceptable limits of agreement. (d) Comparison of NIKTMH and slit-lamp TMH, showing systematic bias and wide limits of agreement.
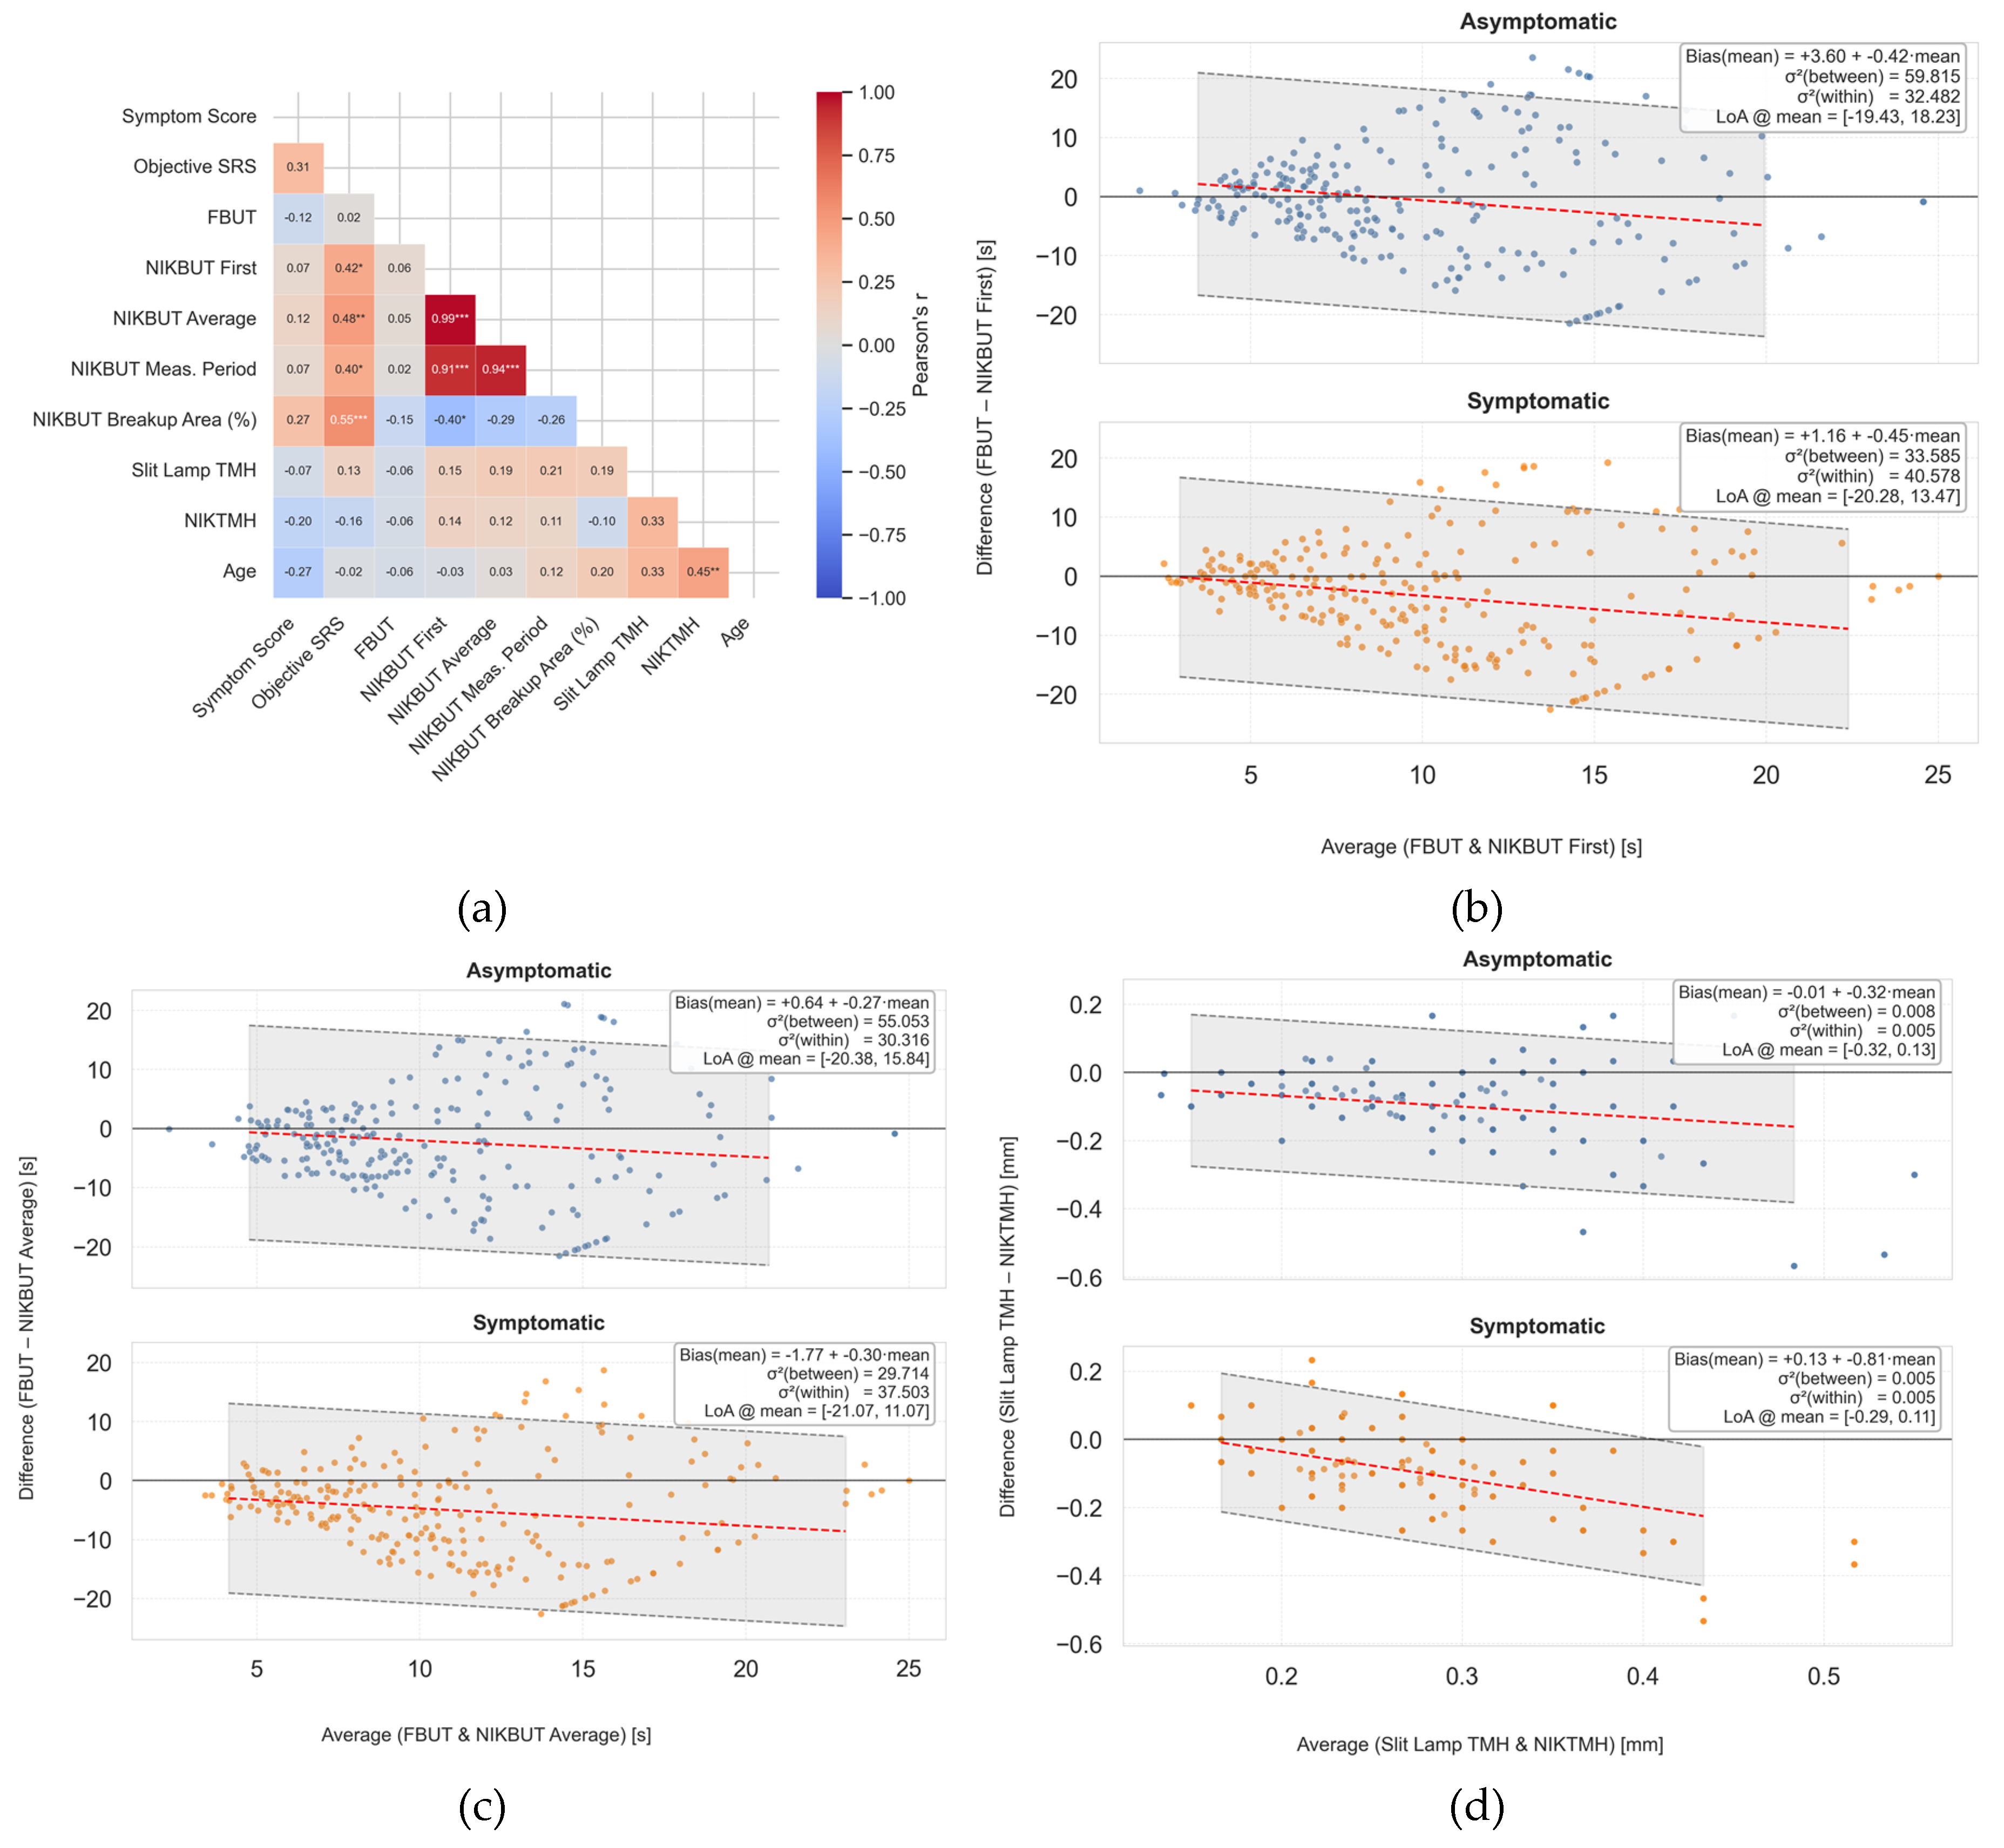
Figure 3.
Receiver Operating Characteristic (ROC) curves for differentiating between symptomatic and asymptomatic participants. The area under the curve (AUC) represents the overall discriminatory power of each test. (a) ROC curves for tear film stability tests. The multivariate Objective-Symptom Risk Score (Objective-SRS) demonstrated the best diagnostic performance (AUC = 0.768), substantially outperforming single metrics like Fluorescein Break-Up Time (FBUT) and Non-Invasive Keratograph Break-Up Time (NIKBUT). (b) ROC curves for tear film volume tests, showing the fair discriminatory ability of both manual Slit Lamp Tear Meniscus Height (TMH) and automated Non-Invasive Keratograph TMH (NIKTMH).
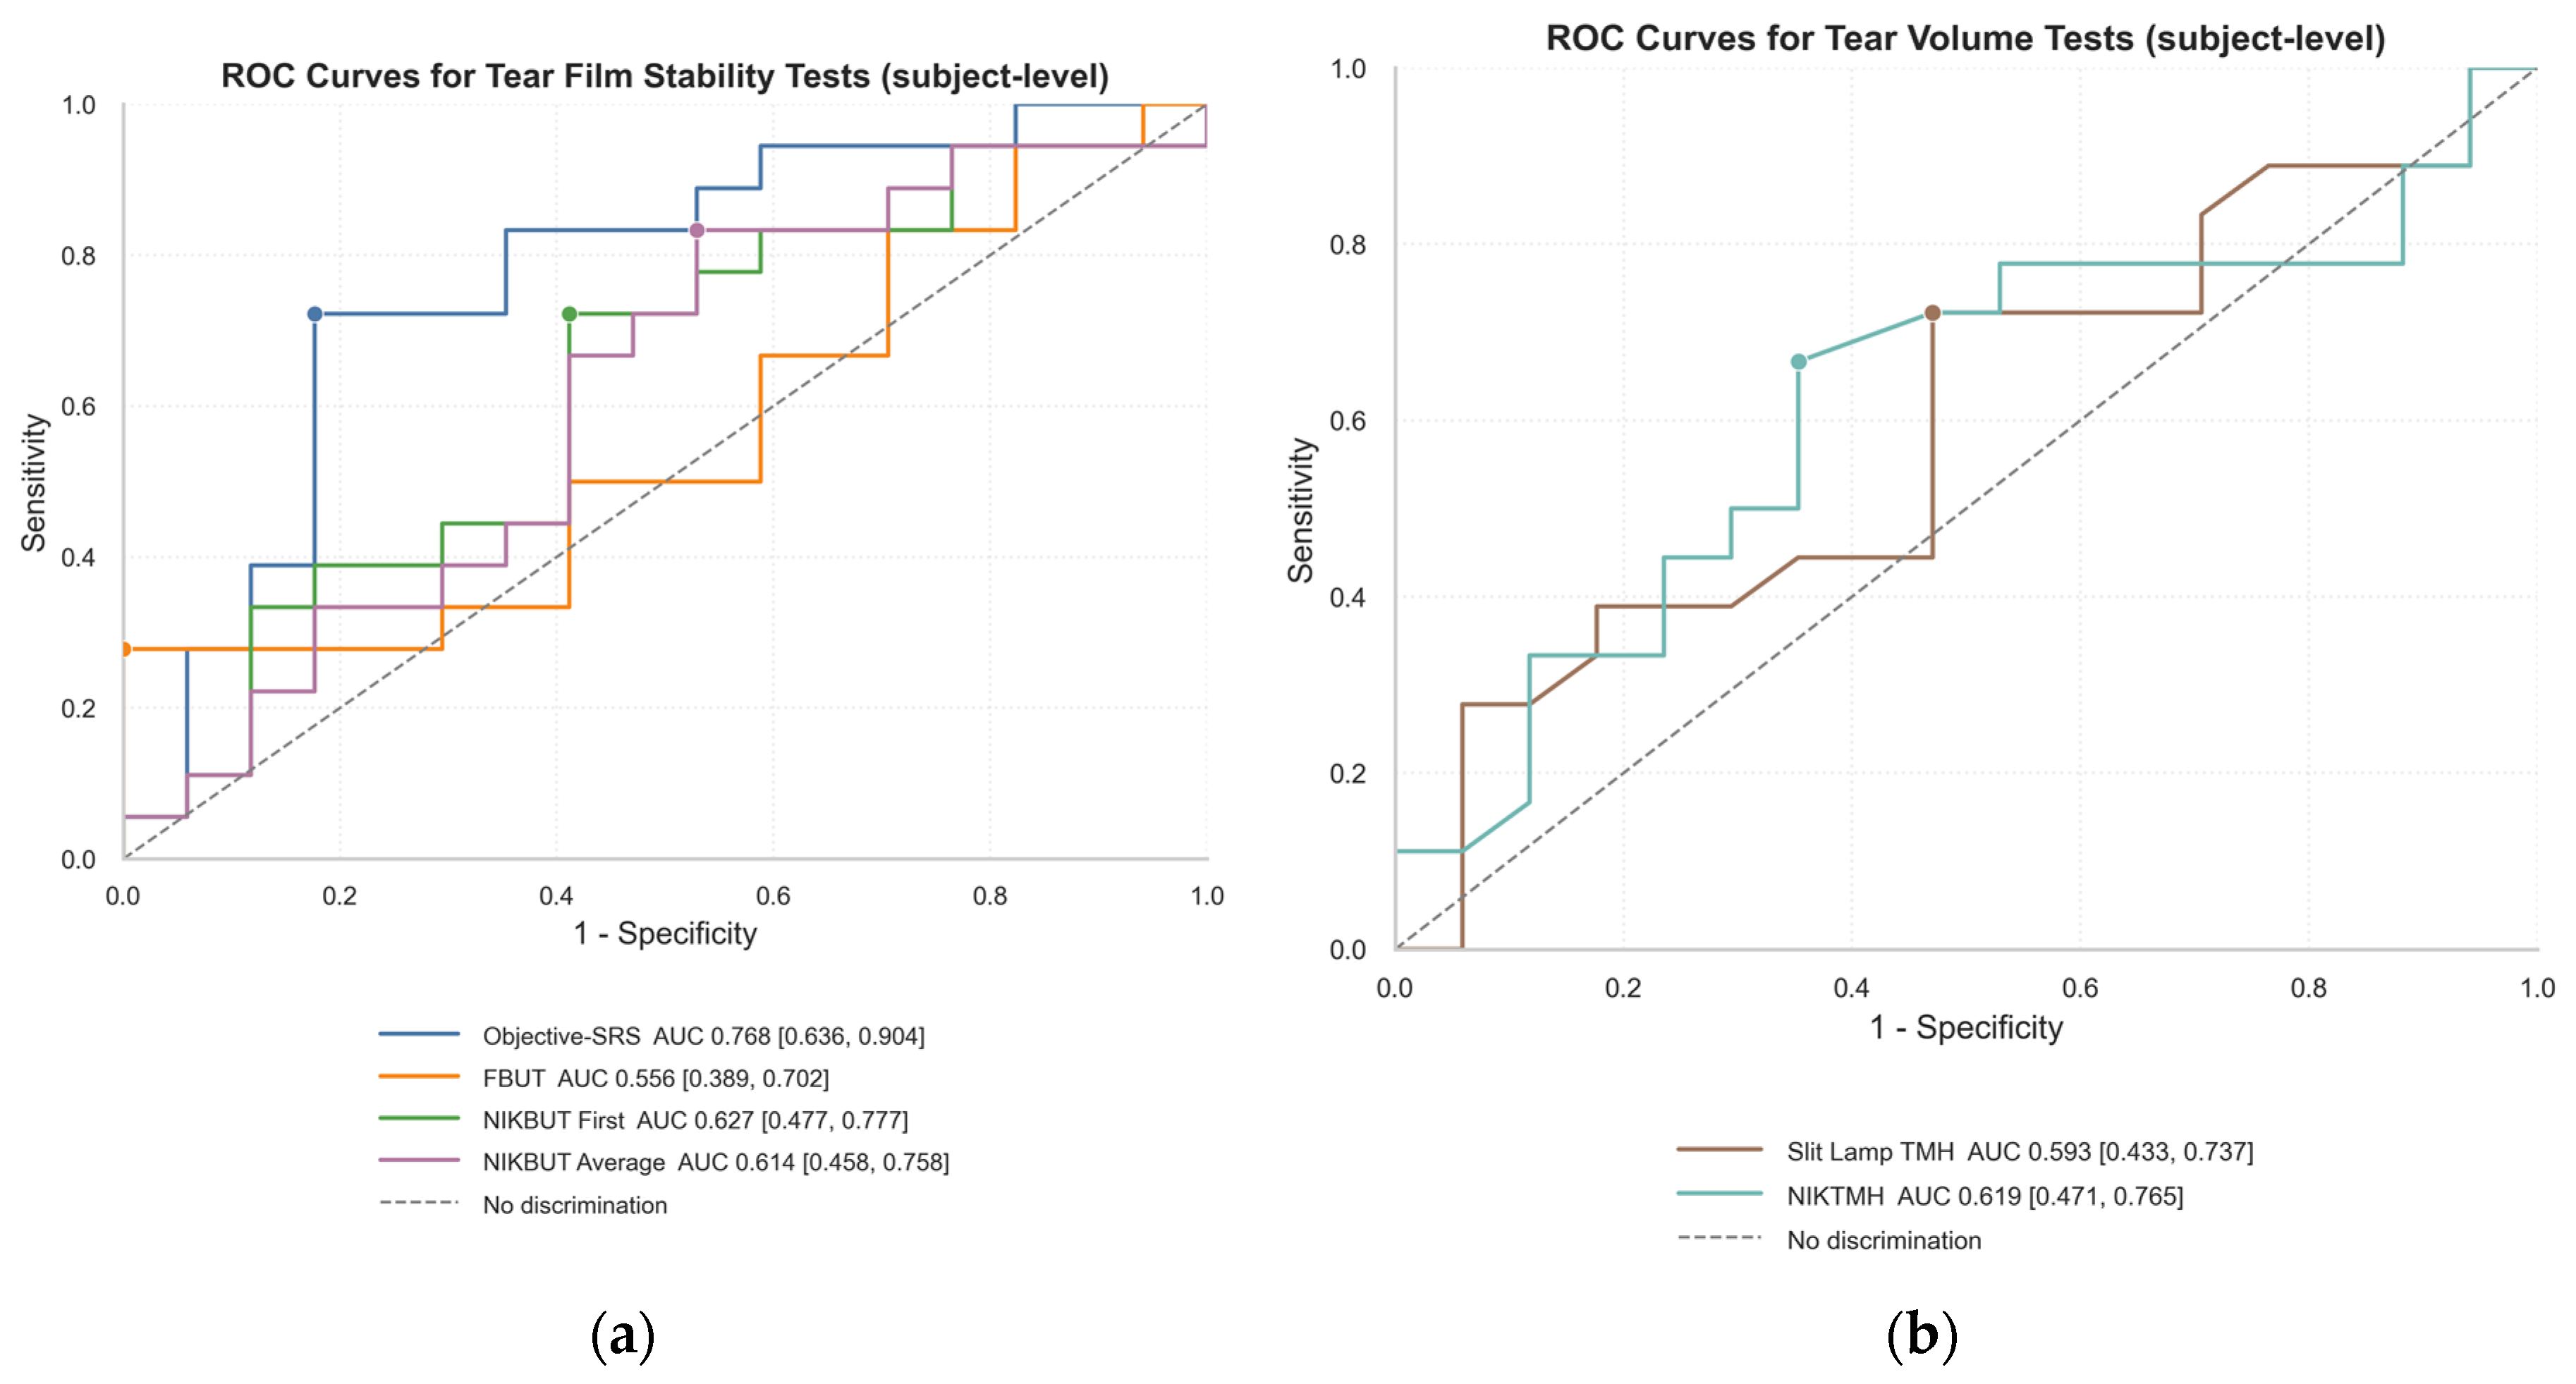
Figure 4.
Decision Curve Analysis (DCA) evaluating the clinical utility of diagnostic tests. The y-axis represents the net benefit of using a test to make clinical decisions compared to the default strategies of treating all patients (dashed line) or treating no patients (solid grey line at zero). The x-axis represents the clinician’s threshold probability for intervening. (a)DCA for tear film stability tests. The multivariate Objective-Symptom Risk Score (Objective-SRS) was the only metric to provide a clear net benefit over the ‘Treat All’ strategy across a wide range of clinically relevant thresholds. (b) DCA for tear film volume tests, showing that the manual Slit Lamp Tear Meniscus Height (TMH) provided a marginally superior net benefit compared to the automated Non-Invasive Keratograph TMH (NIKTMH).
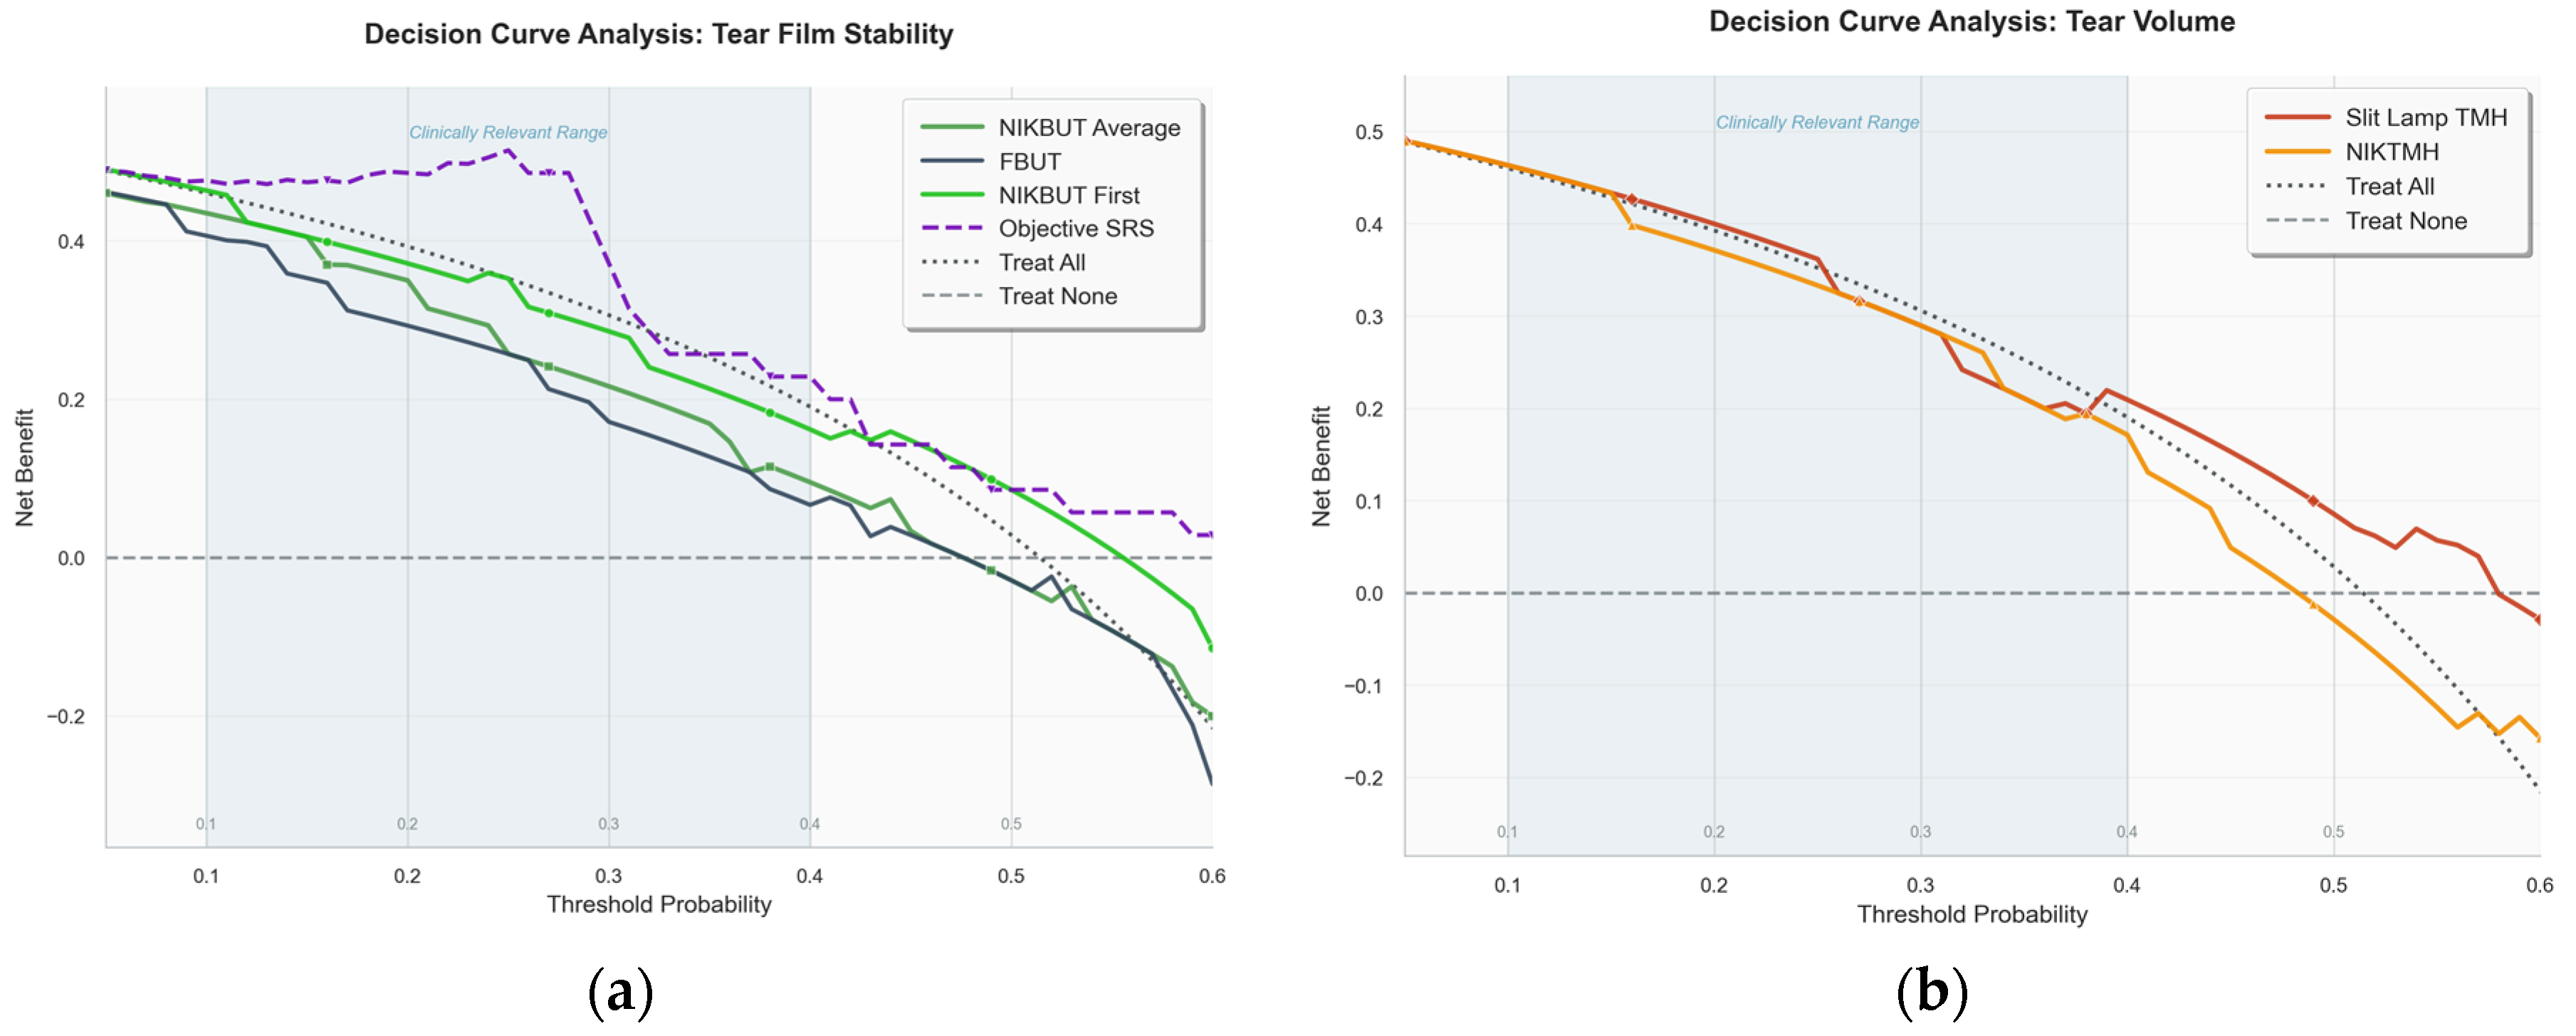
Figure 5.
Spatial distribution and duration of tear film break-up events for the automated NIKBUT method. (a) Polar plot showing the frequency and location of the first break-up event. Note the distinct pattern where events are widely distributed in the paracentral cornea. (b) Mean break-up time (seconds) by corneal zone, stratified by symptom group. Break-up times were consistently shortest in the central zone and longest in the paracentral regions (e.g., nasal and temporal).
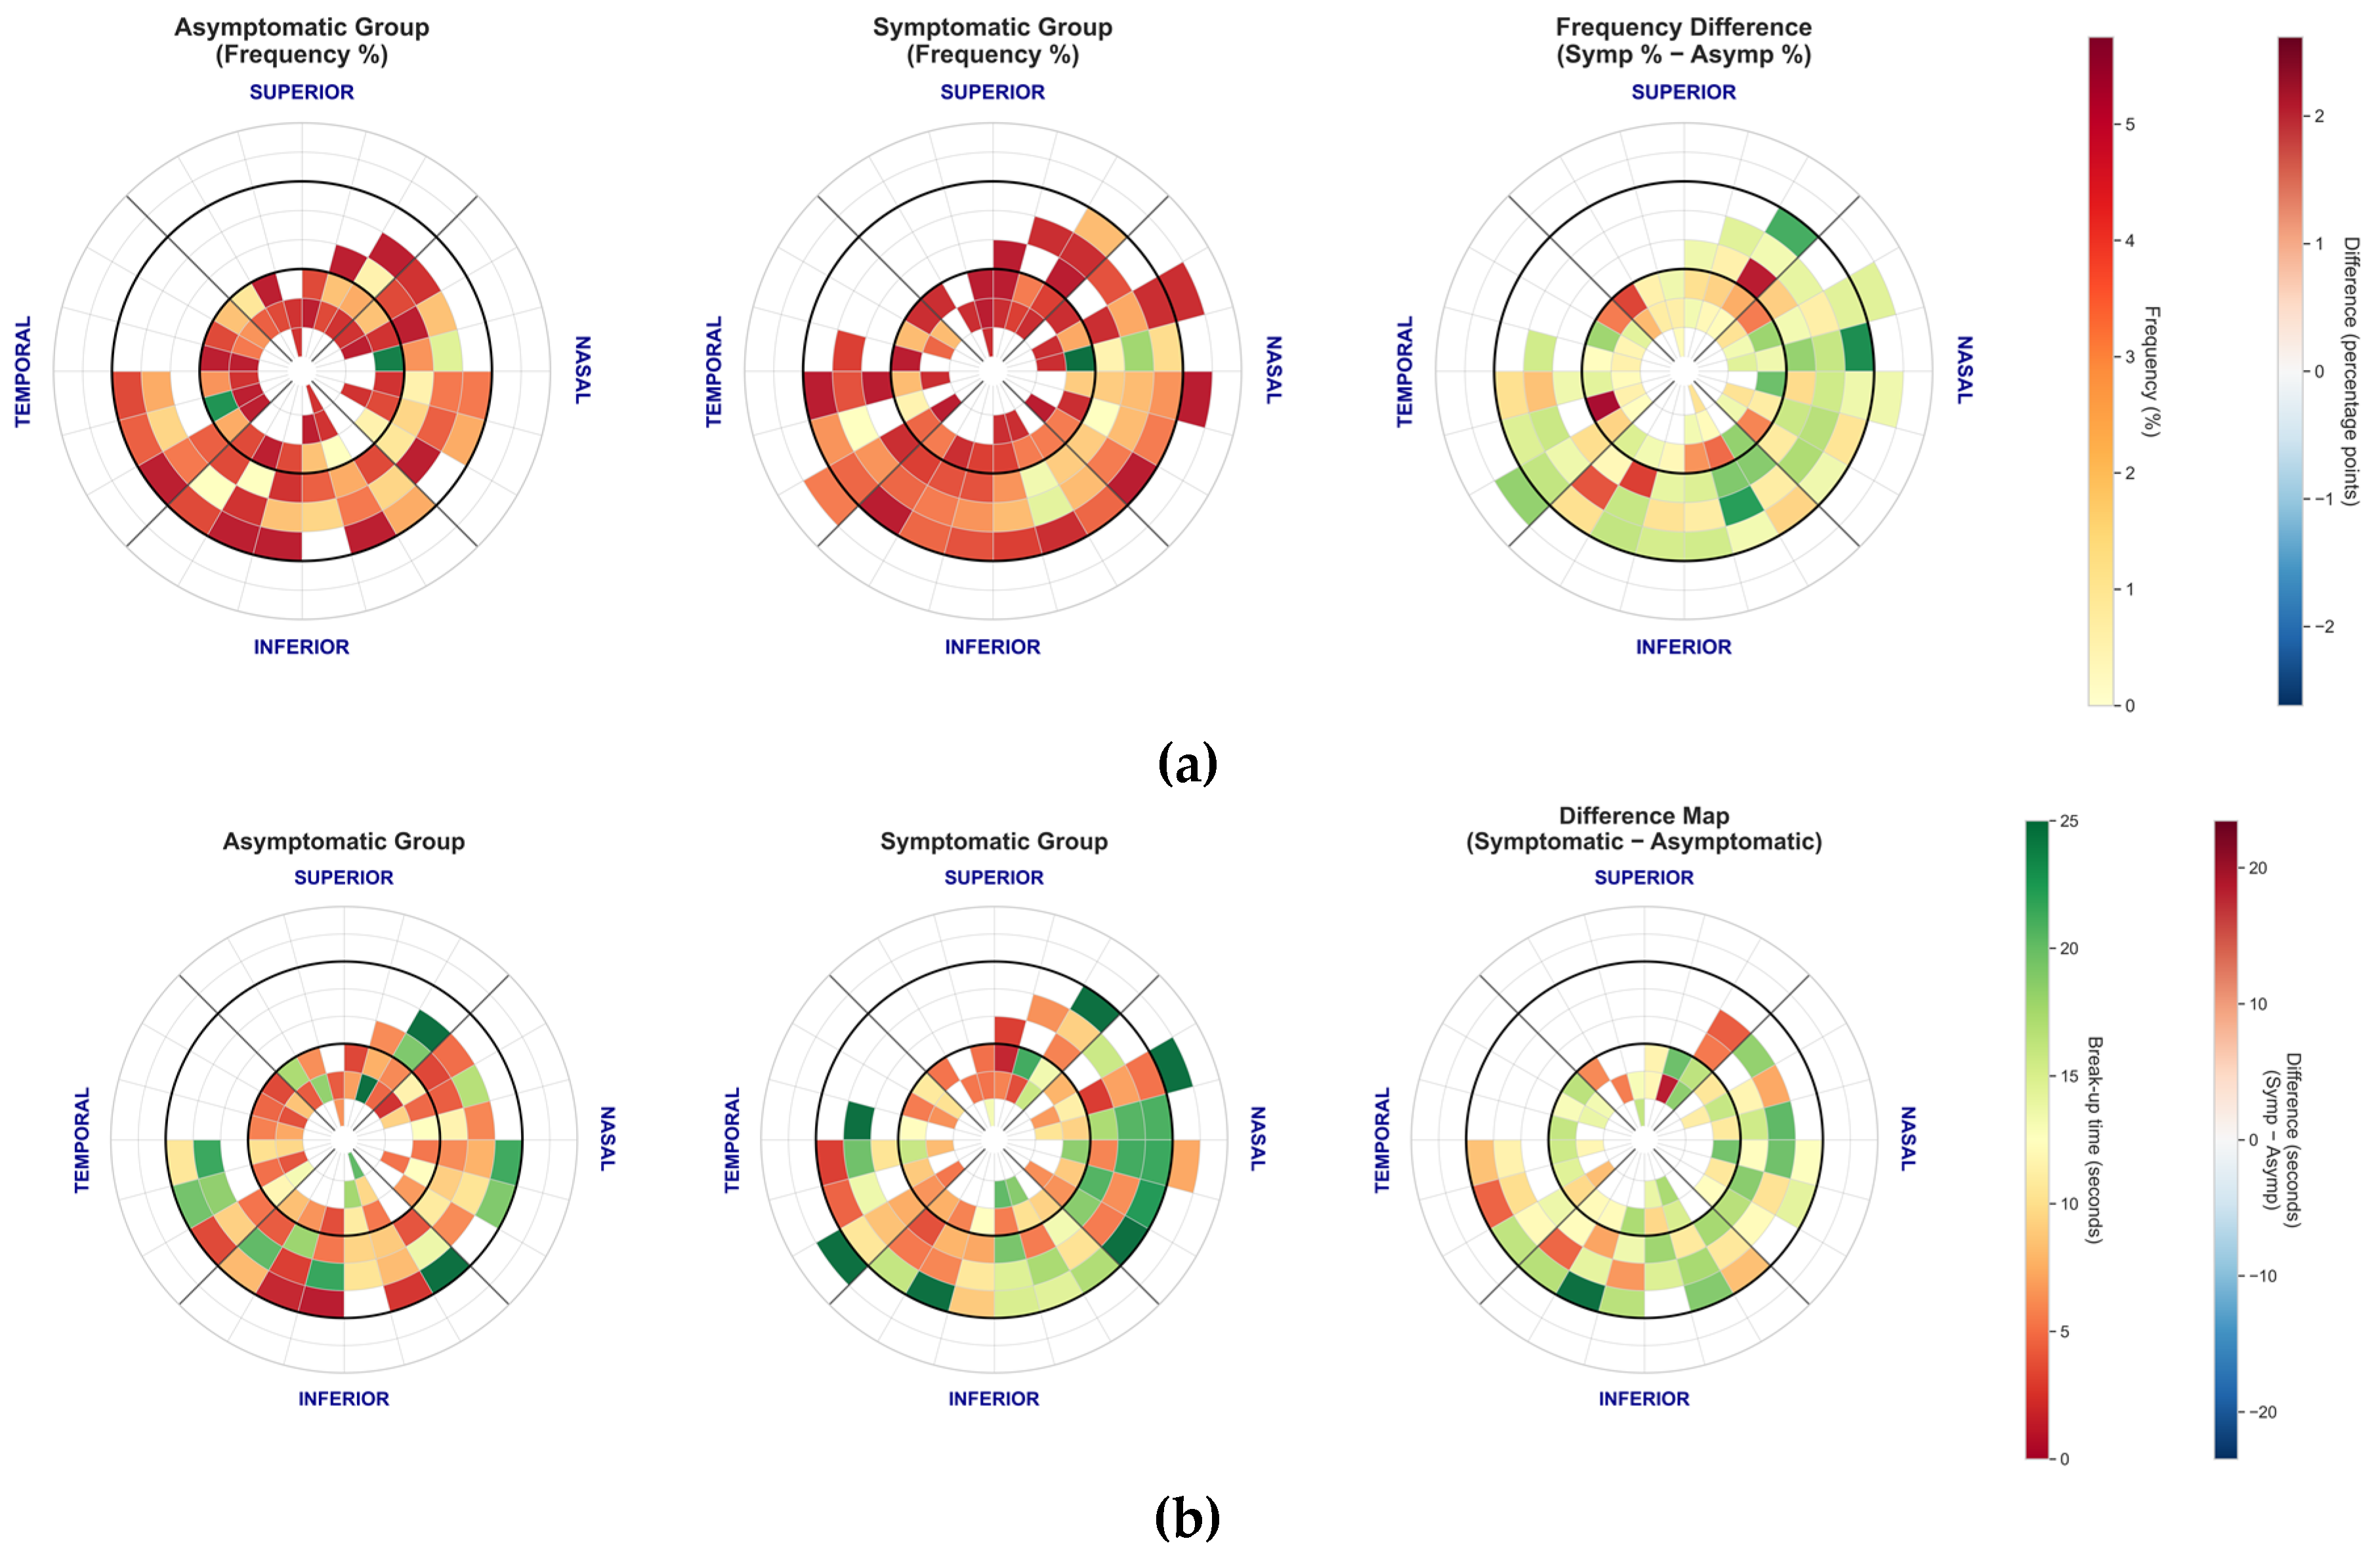
Figure 6.
Spatial distribution and duration of tear film break-up events for the manual FBUT method. (a) Polar plot showing the frequency and location of the first break-up event. In contrast to NIKBUT, FBUT events are heavily concentrated in the central zone for both groups. (b) Mean break-up time (seconds) by corneal zone, stratified by symptom group. Symptomatic patients showed significantly shorter break-up times in the superior zone compared to asymptomatic patients.
Table 1.
Multivariate logistic regression model for the Objective-SRS (Visit 1 Training Data).
| Predictor | Coefficient (β) | VIF | Direction of effect |
|---|---|---|---|
| Intercept (β0) | 0.003 | — | - |
| NIKBUT First | 0.517 | 71.0 | Higher value → Higher Risk |
| NIKBUT Average | 0.183 | 80.6 | Longer period → Higher Risk |
| Meas. Period | -0.332 | 7.1 | Longer period → Lower Risk |
| Break-up Area | 0.348 | 2.4 | Higher surface area → Higher Risk |
| NIKTMH | -0.148 | 1.1 | Higher value → Lower Risk |
Note: Predictors were standardised prior to analysis. High VIFs necessitated the use of L2-regularisation (Ridge), which stabilised the coefficients; consequently, standard errors and p-values are not applicable for this penalised model solution.
Table 3.
Repeatability, reliability, and measurement error of clinical tests.
| Measurement | Group | Intra-session Precision (CV %) | Inter-session Reliability (ICC, 95% CI) | SEM | MDC95 |
|---|---|---|---|---|---|
| Objective-SRS | Total | 15.8% | 0.429 (0.220 to 0.630) | 0.088 | 0.243 |
| Asymptomatic | 14.4% | 0.396 (0.090 to 0.690) | 0.077 | 0.214 | |
| Symptomatic | 17.1% | 0.391 (0.100 to 0.680) | 0.096 | 0.265 | |
| FBUT | Total | 31.1% | 0.674 (0.510 to 0.810) | 3.348 | 9.281 |
| Asymptomatic | 32.8% | 0.744 (0.530 to 0.890) | 3.041 | 8.428 | |
| Symptomatic | 31.6% | 0.611 (0.350 to 0.810) | 3.575 | 9.908 | |
| Slit Lamp TMH | Total | 19.1% | 0.401 (0.200 to 0.600) | 0.049 | 0.135 |
| Asymptomatic | 18.4% | 0.376 (0.070 to 0.670) | 0.056 | 0.155 | |
| Symptomatic | 21.2% | 0.431 (0.150 to 0.700) | 0.040 | 0.112 | |
| NIKBUT First | Total | 53.6% | 0.629 (0.450 to 0.770) | 3.186 | 8.830 |
| Asymptomatic | 56.1% | 0.655 (0.390 to 0.840) | 2.984 | 8.271 | |
| Symptomatic | 52.9% | 0.600 (0.330 to 0.810) | 3.340 | 9.258 | |
| NIKBUT Average | Total | 42.8% | 0.602 (0.420 to 0.760) | 3.019 | 8.367 |
| Asymptomatic | 45.5% | 0.656 (0.400 to 0.840) | 2.757 | 7.643 | |
| Symptomatic | 41.9% | 0.543 (0.260 to 0.780) | 3.226 | 8.941 | |
| NIKTMH | Total | 8.8% | 0.727 (0.580 to 0.840) | 0.062 | 0.173 |
| Asymptomatic | 7.7% | 0.746 (0.530 to 0.890) | 0.058 | 0.161 | |
| Symptomatic | 10.4% | 0.719 (0.500 to 0.870) | 0.065 | 0.181 |
Note: CV: Coefficient of Variation. ICC: Intraclass Correlation Coefficient (values <0.5 are poor, 0.5-0.75 are moderate, >0.75 are good). SEM: Standard Error of Measurement. MDC95: Minimum Detectable Change at 95% confidence. 1Values averaged across White and Infrared light.
Table 4.
Diagnostic performance of clinical tests.
| Measurement | Cut-off | Sensitivity [95% CI] | Specificity [95% CI] | PPV [95% CI] |
NPV [95% CI] |
LR+ [95% CI] |
LR- [95% CI] |
AUC [95% CI] |
|---|---|---|---|---|---|---|---|---|
| Established Clinical Cut-offs | ||||||||
| FBUT | 8 s [15] | 55.6% [33.7%, 75.4%] | 41.2% [21.6%, 64.0%] | 50.0% [29.9%, 70.1%] | 46.7% [24.8%, 69.9%] | 0.95 [0.54, 1.66] |
1.07 [0.51, 2.25] |
0.556 [0.389, 0.702] |
| NIKBUT First | 10 s [15] | 27.8% [12.5%, 50.9%] | 41.2% [21.6%, 64.0%] | 33.3% [15.2%, 58.3%] | 35.0% [18.1%, 56.7%] | 0.50 [0.22, 1.11] |
1.71 [0.92, 3.16] |
0.627 [0.477, 0.777] |
| NIKBUT Avg. | 10 s [16] | 16.7% [5.8%, 39.2%] | 52.9% [31.0%, 73.8%] | 27.3% [9.7%, 56.6%] |
37.5% [21.2%, 57.3%] | 0.39 [0.13, 1.13] |
1.55 [0.95, 2.51] | 0.614 [0.458, 0.758] |
| Slit Lamp TMH | 0.19 mm [17] | 27.8% [12.5%, 50.9%] | 88.2% [65.7%, 96.7%] | 71.4% [35.9%, 91.8%] | 53.6% [35.8%, 70.5%] | 2.08 [0.54, 8.03] |
0.83 [0.59, 1.16] |
0.593 [0.433, 0.737] |
| NIKTMH | 0.23 mm [16] | 27.8% [12.5%, 50.9%] | 88.2% [65.7%, 96.7%] | 71.4% [35.9%, 91.8%] | 53.6% [35.8%, 70.5%] | 2.08 [0.54, 8.03] | 0.83 [0.59, 1.16] |
0.619 [0.471, 0.765] |
| Data-Driven Optimal Cut-offs | ||||||||
| Objective-SRS | 0.61 | 72.2% [49.1%, 87.5%] | 82.4% [59.0%, 93.8%] | 81.2% [57.0%, 93.4%] | 73.7% [51.2%, 88.2%] | 3.65 [1.37, 9.77] |
0.36 [0.17, 0.75] |
0.768 [0.636, 0.904] |
| FBUT | 4.22 s | 27.8% [12.5%, 50.9%] | 100.0% [81.6%, 100.0%] | 100.0% [56.6%, 100.0%] | 56.7% [39.2%, 72.6%] | 10.42 [0.62, 175.25] |
0.73 [0.54, 0.98] |
0.556 [0.389, 0.702] |
| NIKBUT First | 10.18 s | 72.2% [49.1%, 87.5%] | 58.8% [36.0%, 78.4%] | 65.0% [43.3%, 81.9%] | 66.7% [41.7%, 84.8%] | 1.71 [0.92, 3.16] |
0.50 [0.22, 1.11] |
0.627 [0.477, 0.777] |
| NIKBUT Average | 10.79 s | 83.3% [60.8%, 94.2%] | 47.1% [26.2%, 69.0%] | 62.5% [42.7%, 78.8%] | 72.7% [43.4%, 90.3%] | 1.55 [0.95, 2.51] |
0.39 [0.13, 1.13] |
0.614 [0.458, 0.758] |
| Slit Lamp TMH | 0.24 mm | 72.2% [49.1%, 87.5%] | 52.9% [31.0%, 73.8%] | 61.9% [40.9%, 79.2%] | 64.3% [38.8%, 83.7%] | 1.50 [0.85, 2.65] |
0.55 [0.24, 1.26] |
0.593 [0.433, 0.737) |
| NIKTMH | 0.32 mm | 66.7% [43.7%, 83.7%] | 64.7% [41.3%, 82.7%] | 66.7% [43.7%, 83.7%] | 64.7% [41.3%, 82.7%] | 1.82 [0.91, 3.65] |
0.54 [0.26, 1.09] |
0.619 [0.471, 0.765) |
AUC, area under the receiver operating characteristic curve; CI, confidence interval; FBUT, fluorescein tear break-up time; NIKBUT, non-invasive keratograph break-up time; TMH, tear meniscus height; NIKTMH, non-invasive keratograph tear meniscus height; PPV, positive predictive value; NPV, negative predictive value; LR+, positive likelihood ratio; LR−, negative likelihood ratio.
Disclaimer/Publisher’s Note: The statements, opinions and data contained in all publications are solely those of the individual author(s) and contributor(s) and not of MDPI and/or the editor(s). MDPI and/or the editor(s) disclaim responsibility for any injury to people or property resulting from any ideas, methods, instructions or products referred to in the content. |
© 2026 by the authors. Licensee MDPI, Basel, Switzerland. This article is an open access article distributed under the terms and conditions of the Creative Commons Attribution (CC BY) license (http://creativecommons.org/licenses/by/4.0/).
Copyright: This open access article is published under a Creative Commons CC BY 4.0 license, which permit the free download, distribution, and reuse, provided that the author and preprint are cited in any reuse.


