1. Introduction
Technological advancements over the past two decades have transformed biomedical research, enabling the integration of high-throughput sequencing technologies with computational biology. With next-generation sequencing (NGS), laboratories can efficiently generate large-scale genomic data from patient-derived samples. These data are often shared as machine-readable files containing information on genetic alterations such as single nucleotide variants (SNVs). Computational tools are then used to organize, annotate, and analyze this information, allowing researchers to detect meaningful patterns across patient cohorts. A key objective of this study is to leverage these approaches in developing a quantitative scoring function to identify novel genes implicated in cancer by examining SNVs in tumor and normal tissue samples.
Improvements in cancer treatment have led to longer survival times for many patients. However, this progress has also revealed a subset of cancers with chronic behavior, characterized by periods of remission followed by recurrence and requirement of long-term management, thus posing a significant challenge to public health. OvCa and ThCa are notable examples of such conditions. OvCa is one of the most lethal gynecological cancers, in part due to its asymptomatic early stages and lack of effective early detection methods. The American Cancer Society estimates that approximately 20,890 women in the United States are diagnosed with OvCa in 2025, and about 12,730 will die from the disease [
1,
2]. While early-stage detection can yield survival rates of 85–90%, the 5-year survival rate drops below 30% for advanced-stage cases [
3]. ThCa is often detected at earlier stages, largely due to advances in imaging technologies such as CT scans and MRI. In 2025, an estimated 44,020 new cases are expected in the U.S., with a higher prevalence among women and a relatively low mortality rate of about 5% [
4,
5]. Despite its generally favorable prognosis, ThCa can require long-term monitoring, particularly after surgical removal of the thyroid or radioactive iodine (RAI) therapy.
Cancer is essentially caused by DNA mutations, which can arise through endogenous mechanisms such as errors during DNA replication, or from exogenous sources including radiation and chemical exposure in the environment. One major consequence of such exposures is the production of reactive oxygen species (ROS), unstable molecules that disrupt cellular processes and compromise genomic stability. ROS can interfere with DNA replication and repair pathways, increasing the likelihood of mutagenesis [
6,
7].
Among various types of mutations, SNVs are particularly significant in cancer research. These involve a single base substitution within the DNA sequence. Both synonymous and nonsynonymous SNVs occur within protein-coding regions. Synonymous SNVs do not alter the amino acid sequence of the encoded protein, while nonsynonymous SNVs can lead to amino acid changes that may disrupt protein functions. Such alterations can affect the activities of genes that drive tumor formation, progression, or suppression, the disruption of which may impair key biological functions, ultimately leading to cancer.
Genes are composed of DNA segments that encode either a single transcript, or multiple different transcript isoforms through alternative splicing or other mechanisms. According to transcriptomic studies, approximately 83% of human genes generate between 2 and 77 different transcripts [
8]. This transcript diversity adds a layer of complexity when assessing the impact of mutations. The same SNV may affect multiple isoforms, and the functional consequences of that variant can vary across them. Transcript-level resolution is therefore essential in evaluating the potential deleterious effects of SNVs.
To evaluate the potential impact of SNVs on protein function, several bioinformatics tools have been developed. These functional effect analyzers include SIFT, PolyPhen, CADD, and FATHMM-XF, each using distinct computational strategies. SIFT and PolyPhen rely on sequence conservation and homology-based models while PolyPhen additionally incorporates structural information [
9,
10,
11]. CADD uses integrated functional and conservation data to score variants by their likely deleteriousness [
12]. FATHMM-XF employs machine learning techniques like hidden Markov models [
13,
14,
15,
16].
In this paper, we propose a scoring function that will integrate multiple functional effect analyzers to assess the cumulative effects of nonsynonymous SNVs on the genes. In addition, system-level approaches such as the Kyoto Encyclopedia of Genes and Genomes (KEGG) pathway analysis can be used to contextualize such effects. The STRING database [
17,
18,
19,
20,
21,
22,
23,
24,
25,
26,
27,
28,
29], which supports an interface to conduct a variety of bioinformatics analysis, can be used to conduct these tasks and gain deeper insights into the biological roles of the affected genes and their interrelationships.
2. Materials and Methods
Interpreting a large collection of NGS data can be computationally intensive, and integrating the data compiled from different sources is a delicate process that requires multiple steps but is necessary for the application of the proposed integrative scoring function. This methodology described herein ultimately led to predictions for both known cancer-related and novel genes, which then can be used for downstream bioinformatics analyses to assess functionalities on a genomic level.
2.1. Collecting, Organizing, and Extracting Information from Data Files
Data collection started with accessing the Genomic Data Commons (GDC) of the National Cancer Institute [
30]. This public data sharing platform contains variant call format (VCF) files from The Cancer Genome Atlas [
31] and other projects. All VCF files contain the basic mutation information, namely chromosome, position, reference sequence, and alternative sequence. A VCF file is structured in 3 different sections: metadata, header, and data. The metadata lines contain information including unique patient identification numbers, unique sample numbers, and depending on the project, consequence (CSQ) information. The CSQ information, which is gathered from both the Variant Effect Predictor (VEP) and BioMart tools in Ensembl [
32,
33,
34], contains a complete list of all potential genomic, transcriptomic and functional effects based on the unique SNV. Due to the extremely condensed format of the provided CSQ entries per variant, this information in the original VCF files, when opened in either a text editor or Excel, was illegible. To overcome this problem, a Python code was written to decipher the CSQ contents and extract its corresponding mutational data and then convert them into columns in a dataframe (a 2-dimensional virtual table) with the row entries as unique variants and the columns with their corresponding information. The VCF files of each of the two patient cohorts with OvCa and ThCa were then compiled into a single dataframe, while simultaneously parsing the variants’ CSQ information into 72 separate columns based on the format provided within the metadata, a list of CSQ entries can be found in the supplemental file “CSQ Columns and Descriptions.xlsx”.
Due to the different sources of cancer projects that upload data into the GDC platform, the CSQ information can vary among datasets, but the key information consistently included transcript IDs, genes, the region in which the transcript occurs, the mutational change type, the length of the transcripts, as well as SIFT and PolyPhen scores. With this information, we applied a filter to the compiled OvCa and ThCa dataframes to focus on only non-synonymous variants in protein-coding genes, which are sent forward for subsequent analysis.
2.2. Functional Effect Analyzers
Working with the extracted mutational data, different scoring software can be applied to determine the functional effects, or the deleteriousness of each variant. To incorporate multiple perspectives, four different analyzers were used for this study: (i) FATHMM-XF, (ii) CADD, (iii) SIFT, and (iv) PolyPhen. While SIFT and PolyPhen scores were already provided by the CSQ columns in the original VCF files, FATHMM-XF and CADD scores had to be obtained through SNPnexus [
35,
36,
37,
38,
39] and the VEP tool in Ensembl [
32,
33], by submitting the basic information of chromosome (chrom), position (pos), reference sequence base (ref_seq), the alternative (i.e., mutated) sequence base (alt_seq) of the SNVs. Input files in the formats required by these tools were generated by a Python code, the returned outputs were merged onto the respective dataframes for the two patient cohorts. The supplementary output files are named according to the information they contain, “X_FATHMM.csv” and “X_CADD.txt”, where X is either ThCa or OvCa. Since FATHMM-XF scores were based only on the variant information regardless of which transcript it is on, merging with the rows, each representing a unique SNV, is straightforward. In contrast, CADD scores assessed the SNV effects in the context of the transcript, necessitating the dataframe to be expanded based on the lists of possible transcripts found in the CSQ columns, thereby transforming each row to show the functional effect of the SNV on each unique transcript. In this format, the CADD scores were conditionally merged based on chrom, pos, ref_seq, alt_seq, and the unique transcript ID.
Table 1 contains the individual scoring ranges of the four analyzers, as well as their cutoff values with which they deem an SNV deleterious [
9,
10,
11,
12,
13,
14,
15,
16].
In view of the scoring and benign/deleterious variant classification differences among the four effect analyzers, we first apply the following min-max normalization to the scores to ensure they are all within the range of 0 to 1.
Furthermore, we replaced the SIFT scores, where lower scores indicate higher deleteriousness, by their complementary values (i.e.,
x is replaced by
) so that higher scores uniformly indicate higher deleteriousness across all four effect analyzers.
With the newly normalized scores, a quantitative scoring function
Q(
G), as displayed in equation (2), can be applied to each effect analyzer and summarize the cumulative effects of the deleterious SNVs on a gene denoted by
G. An SNV is considered deleterious if its original score is within the corresponding effect analyzers cutoff range and a gene is considered “pathogenic” if it contains at least one deleterious SNV. A
Q(
G) score can be computed for each pathogenic gene in Equation (2), where
denotes the number of different transcripts of the gene
G.
The rationale behind is that if a variant, v, is disruptive to the function of the gene, the functional effect analyzer would give it a high deleterious score, denoted by in Equation (2). Furthermore, v would occur more frequently in tumor tissues than in normal tissues, leading to a large value for . The inner sum in Equation (2) aggregates the cumulative effects of the individual SNV on the transcript (i.e., the jth transcript of the gene G). As longer transcripts are naturally expected to have larger number of deleterious SNVs, this length effect is accounted for by the factor , where stands for the length of . After completing this calculation for all the different transcripts of G, we take average over them, which is accomplished by summing over all the transcripts and then dividing . Overall, genes associated with the cancer are expected to have high Q(G) scores.
2.3. The Integrative Scoring Function
The integrative variant scoring function,
iQ(
G), is developed to integrate the assessments of deleteriousness of SNVs by multiple functional effect analyzers. In Equation (3), an SNV is considered deleterious if it is classified so by at least one of the analyzers, where
is calculated by averaging the deleterious scores for
v provided by all the effect analyzers being incorporated. This procedure allows us to take into consideration the individuality of the of all the effect analyzers’ prediction algorithms. In this study, we have integrated the four effect analyzers presented in
Table 1.
Using any scoring function, one can rank all the pathogenic genes from 1 to
p, where
p denotes the number of pathogenic genes and the highest scoring gene is given rank 1. The code for computing the
Q(
G) and
iQ(
G) scores for the compiled OvCa and ThCa data were implemented in Python and is available at
www.github.com/bataycan/iQG_Analysis. The analysis pipeline can also be executed online at the website
https://oncominer.utep.edu/iQG.
To assess the performance of
iQ(
G), we introduce here a measure called standardized average rank
(SAR
). When given any set of human genes, we can look up the ranks for each gene among the pathogenic genes. If a gene is not among the pathogenic genes, we will give them the rank of
p+1. Equation (4) displays the formula to calculate the SAR value for any given set of
k human genes.
The SAR, whose value is always a number between 0 and 1, allows us to assess the performance of
iQ(
G), where a lower SAR value for the list of already known cancer-related genes indicates better performance. We have compared the SAR value of
iQ(
G) against that of
Q(
G) calculated individually with CADD, FATHMM-XF, PolyPhen, and SIFT. In addition, the SAR values of the lists of known OvCa- and ThCa-related genes were compared against those of random gene sets of the same size as the known gene lists. Using Python, we repeatedly generated 1000 random sets comprising genes selected from the collection of 20,255 human protein coding genes gathered from two sources: HUGO Gene Nomenclature Committee and Gene Cards, [
40,
41,
42,
43]. A
z-test was then performed to demonstrate statistically that the SAR value of the list of known cancer-related genes was significantly lower than that of randomly selected sets of genes.
2.4. Bioinformatics Analyses
The two lists of genes with top 1%
iQ(
G) scores collected from the OvCa and ThCa cohorts were separately submitted to the STRING website (
www.string-db.org) to analyze their genomic functions. Bioinformatics analysis results, including protein-protein interactions, Gene Ontology terms and KEGG pathways were automatically returned. We focus on the KEGG pathway results in this paper. For each pathway a ‘strength’ column is given, which is a built-in statistical score assigned to determine whether the given set of genes are associated to the given pathway. The higher the score, the more likely that many of the genes submitted are connected to the pathway, compared to the expected amount from a randomly selected set of genes [
44,
45,
46]. Based on the strength scores, the top 12 pathways associated with the genes from the submitted set were identified. These results and their implications will be presented in the next section.
3. Results and Discussion
Once the data was compiled from the extracted VCF files for the two different cancer cohorts, a brief survey of the unique variant counts found between the normal and tumor samples were taken. With the patient information extracted from the original VCF files, it was observed that in several cases, a single patient was linked to two or more VCF files. Those duplicated files were merged so that they will not be double counted in the results.
3.1. Variant Summary Statistics
Table 2 shows the number of: (i) VCF files extracted from GDC, (ii) unique patients, (iii) the known cancer-related genes, (iv) unique SNVs categorized as occurring in normal tissues only, tumor only, and common to both) and (v) genes containing SNVs for OvCa and ThCa.
In comparison, OvCa patients had over twice as many unique variants than the larger ThCa cohort and are distributed among a larger number of genes. In addition, the number of currently known OvCa-related genes are also almost two times that of ThCa. Note also that over 95% of the SNVs were found only in the tumor samples, whereas a very low percentage, 0.01%-0.04%, occurred only in normal samples, and ~4% were seen in both.
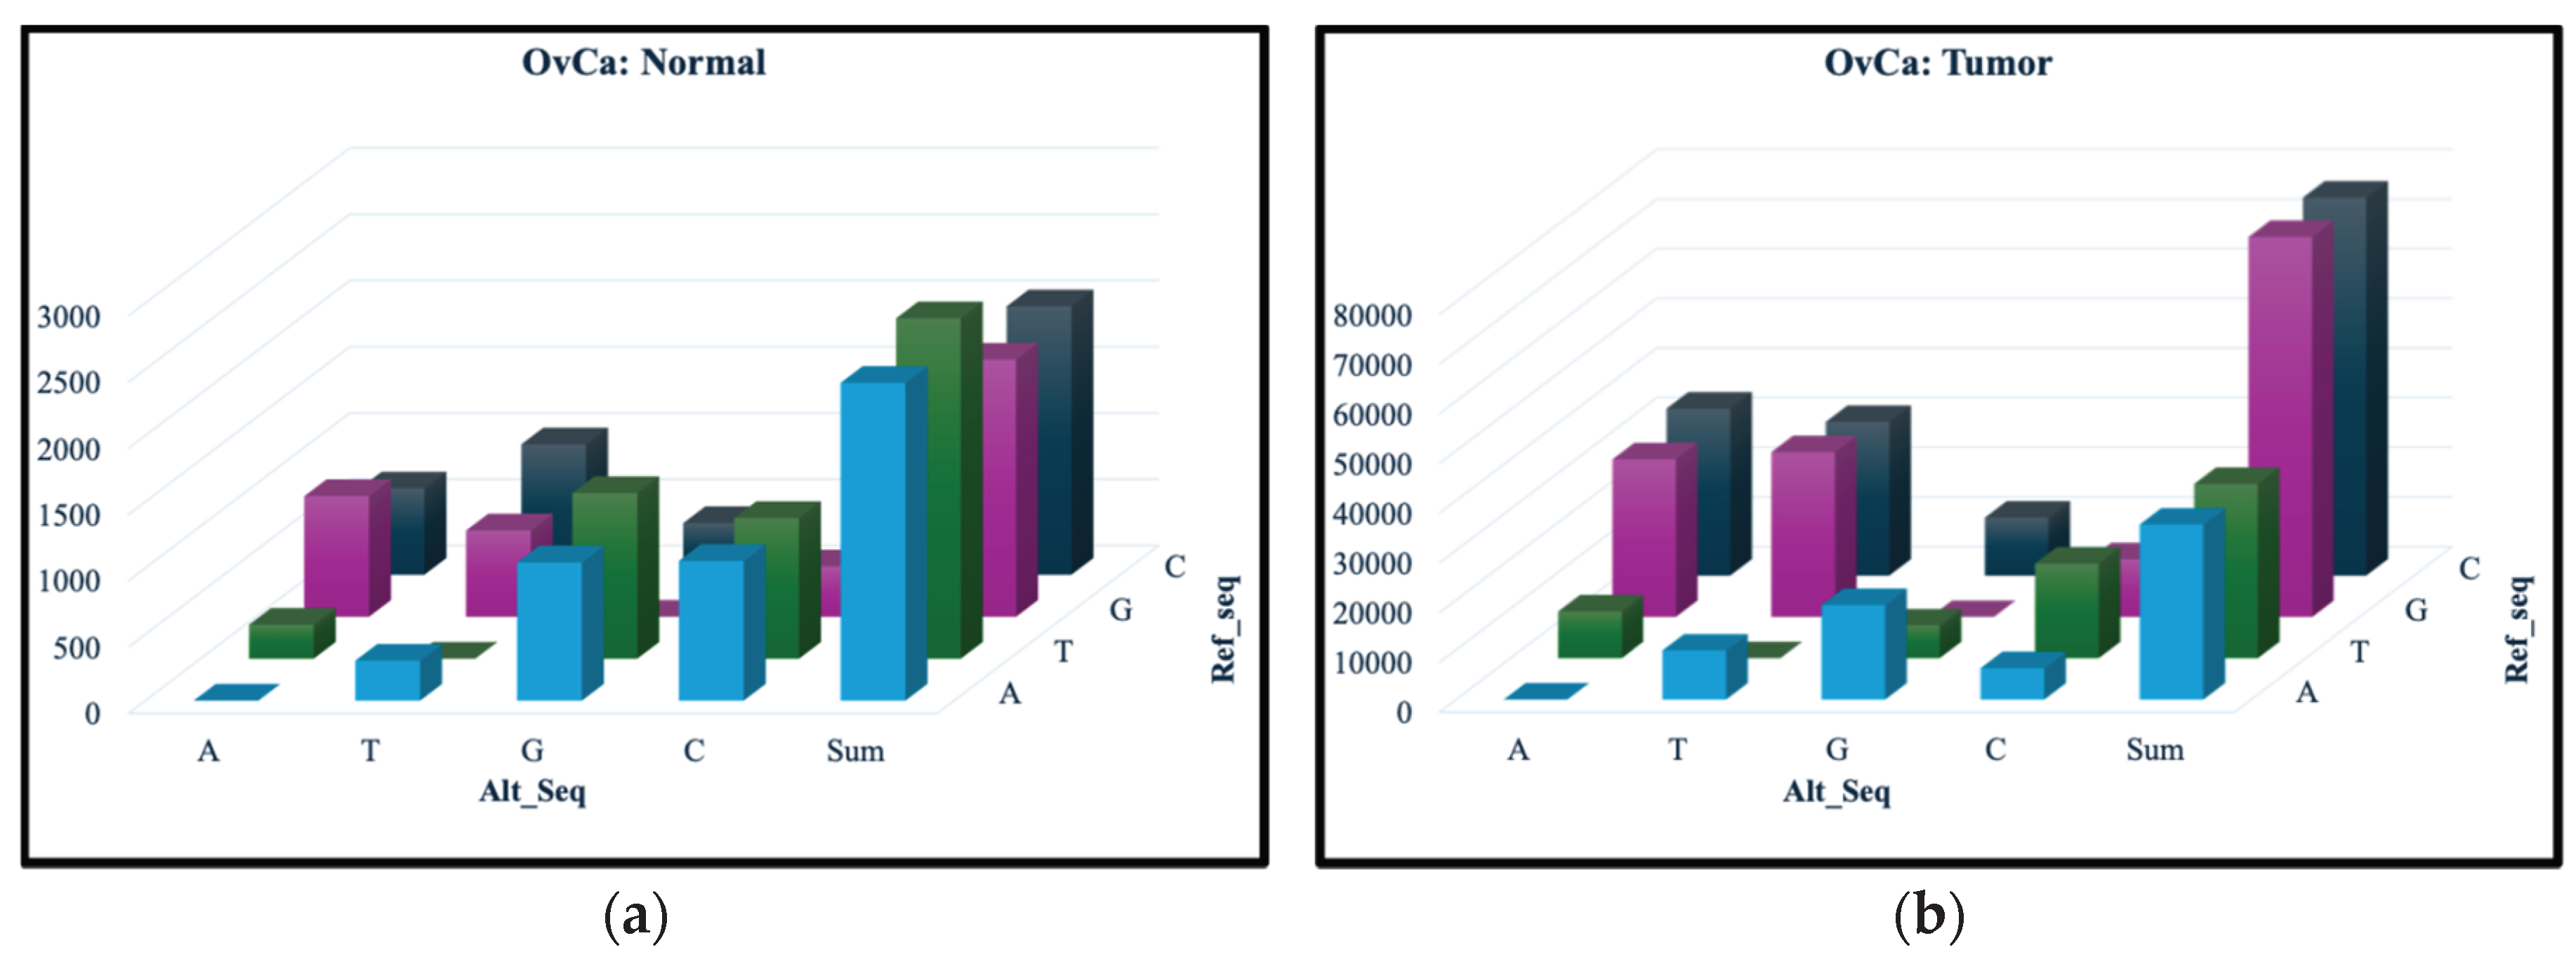
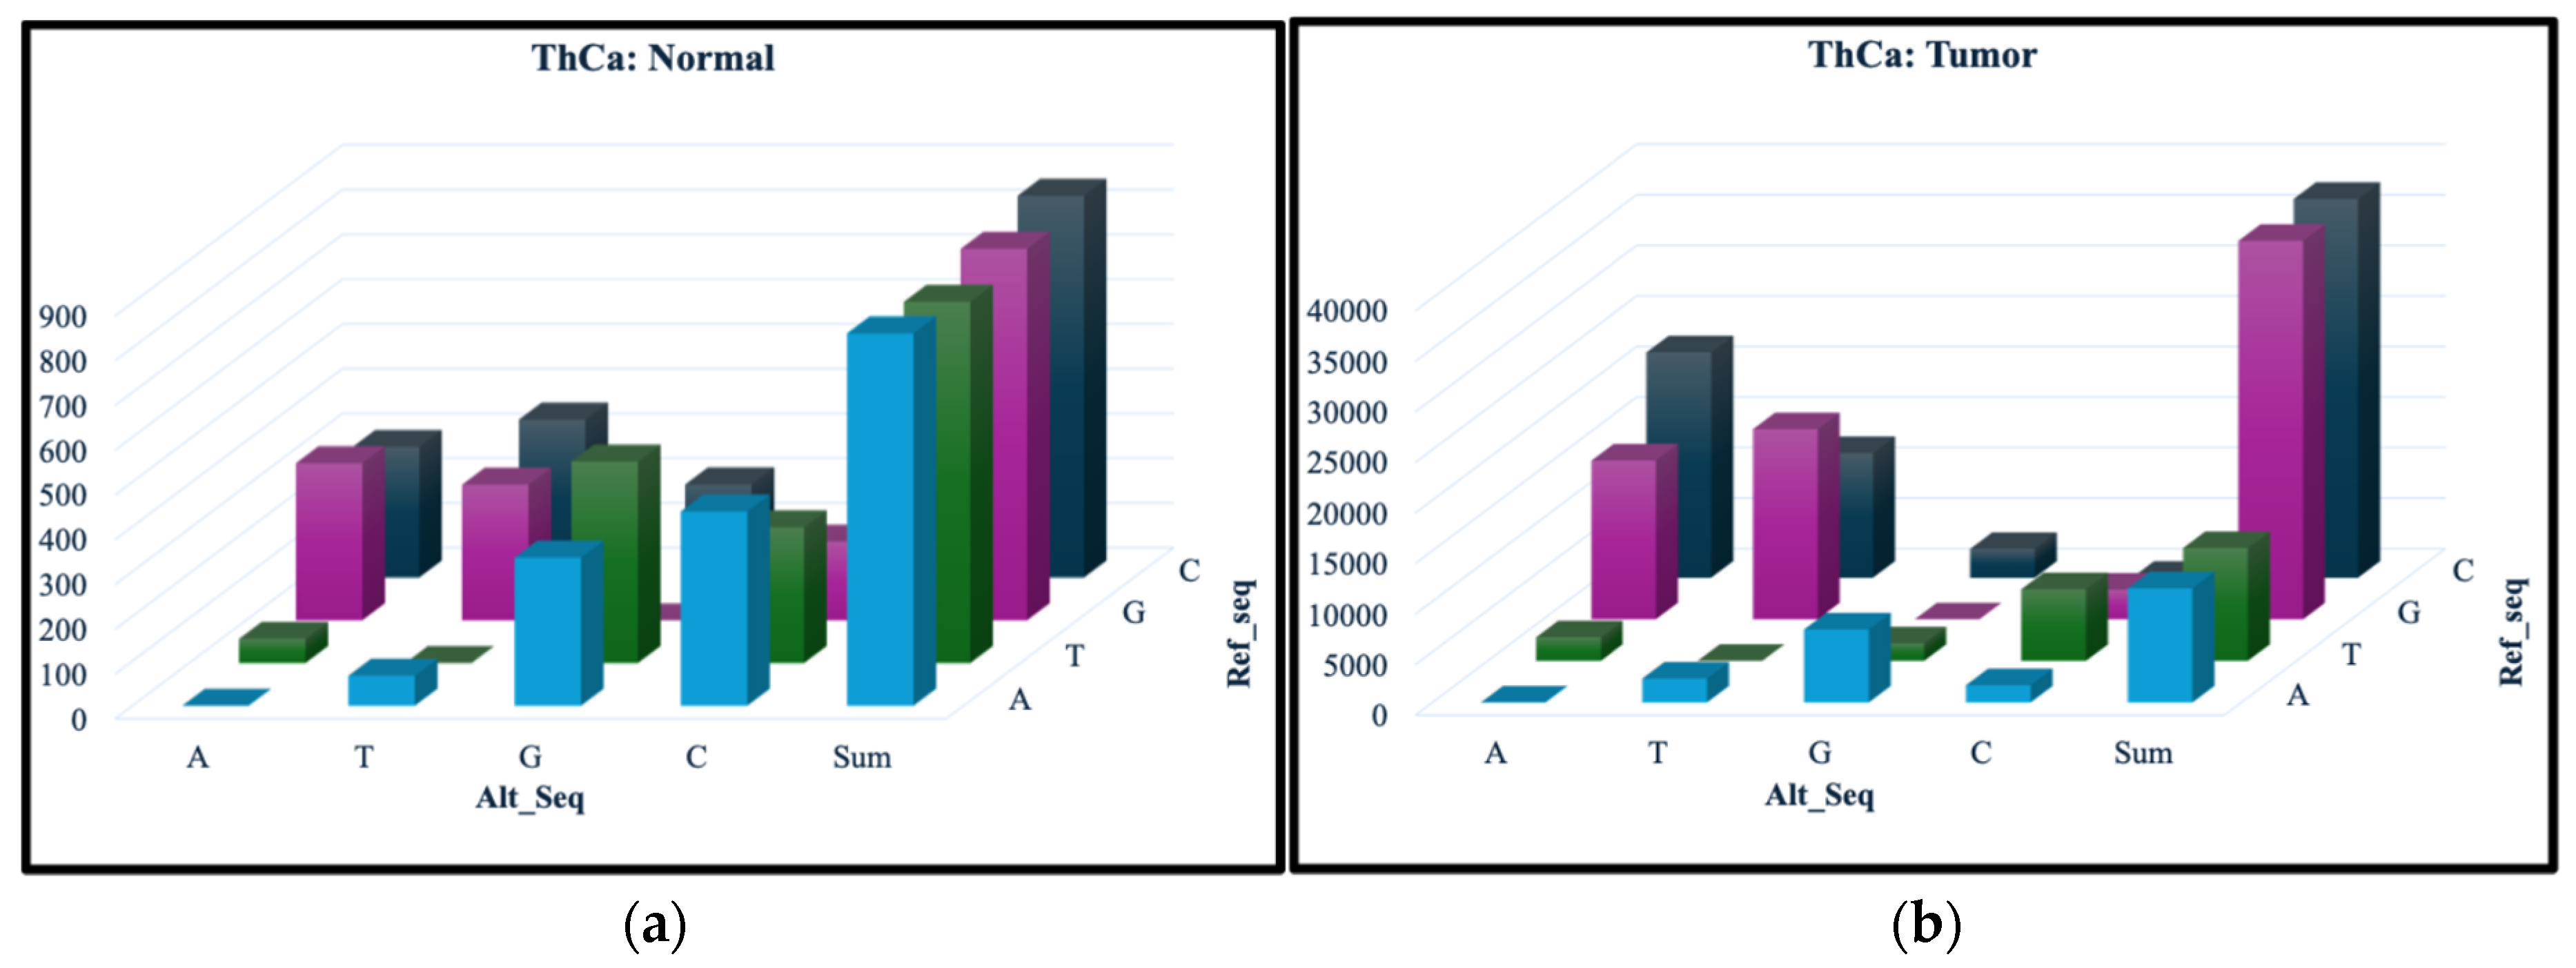
From the separate normal and tumor samples for both OvCa and ThCa, the SNVs can be classified based on their nucleotide change using the ref_seq and alt_seq columns in the dataframe.
Figure 1 and
Figure 2 show the occurrence for each of the 12 nucleotide change types, with the number of SNVs represented on the vertical axis, the ref_seq nucleotide along the diagonal and alt_seq nucleotide on the left-right axis. Comparing the vertical axes for the normal and tumor samples, we can see much fewer SNVs are present for all change types in the normal samples. Furthermore, the total number of the changes for each ref_seq nucleotide in the normal samples, as shown in the “Sum” columns in
Figure 1(a) and 2(a), are quite similar. In contrast, the tumor samples (
Figure 1(b) and 2(b)) appear to have a much larger amount of G and C mutations, changing from the ref_seq G and C nucleotides to the alt_seq nucleotides A or T. These findings are observed in both OvCa and ThCa.
3.2. Assessing the Performance of iQ(G)
Table 3(a) shows the SAR values calculated for the two lists of known OvCa- and ThCa-related genes using the
Q(
G) rankings computed with the four individual functional effect analyzers. All SAR values are higher than that calculated for the same gene lists using
iQ(
G) rankings, as shown in
Table 3(b). It is therefore advantageous to use
iQ(
G) as a scoring function as it is more capable of giving superior rankings to the known cancer-related genes than the individual effect analyzers. Furthermore, since it is not guaranteed that every SNV inputted into an individual analyzer will receive a score, we frequently encounter the problem of missing scores for a portion of the SNVs when trying to calculate
Q(
G) with an individual analyzer. The use of
iQ(
G) helps minimize this problem because the combination of four analyzers reduces the chances of getting unscored SNVs (i.e., not scored by any of the analyzers) that must be left out of the gene scoring calculations.
To confirm that
iQ(
G) can indeed effectively place the cancer-related genes at high rankings, we checked the SAR values for the lists of known OvCa- and ThCa-related genes against random gene sets sampled from all protein coding genes in human. The right column of
Table 3(b) displays for each cancer the mean and standard error (SE) of the SAR values of 1,000 randomly selected gene sets, each containing the same number of genes as the known cancer-related gene lists. For both OvCa and ThCa, the
z-test shows that the mean SAR value of the random gene sets is significantly larger than that of the known gene list with
p-value < 2.2e-16, giving strong evidence for the effectiveness of
iQ(
G) as a scoring function to identify cancer-related genes.
The setup of the iQ(G) function allows it to be adapted easily to work with other alternative functional effect analyzers instead of, or in addition to, the four we have integrated in this study. Furthermore, the iQ(G) scoring, which currently takes an average over all possible transcripts of the gene G, can also be refined in the future by using a weighted average of the transcripts to take their expression levels into account using transcriptomics data.
3.3. Genes with Top Top iQ(G) Scores in OvCa and ThCa
Table 4 lists the top 15
iQ(
G) scored genes for OvCa and ThCa, where the genes highlighted in green are novel in the sense that they have not been associated with the respective cancer in published literature.
The top three novel genes for each cancer type with their ranked position by
iQ(
G) are presented in
Table 5 along with brief annotations on their known biological functions and disease involvement [
47,
48,
49,
50,
51]. Given that these are novel genes for their related cancer, it was not surprising that only one,
AHNAK2, was linked to another cancer while all the rest were associated with other disorders and diseases.
Further investigation of the top novel gene
AHNAK2 suggested a hypothesis that could help explain the metastatic prognosis from late stage OvCa. From the 2022 article by Phung et al., although lung cancer spreading to the ovaries is a rare occurrence, it is not uncommon for ovarian cancer metastasizing to the lungs, transpiring in approximating 28.4% of patients [
52]. Considering metastasized OvCa is generally found in late staged untreated patients, mutations found within
AHNAK2 could also be a contributing factor to this outcome.
An interesting revelation in the ThCa patient group was the novel gene
CES1 and its relation to xenobiotics and drug metabolism as annotated in
Table 5. RAI, which is a common treatment for ThCa, can be considered a xenobiotic. Findings from one study [
53], determined that while a single dose of RAI could be successful in treating ThCa for some patients, while others needed several doses or complete thyroidectomy, for treatment. Although the referenced study hypothesizes different factors like gender, age, thyroid hormone and autoantibody levels affecting the efficacy of RAI, an alternative perspective that has not been included is the altered gene function of
CES1 being a potential culprit.
3.4. KEGG Pathway Analysis Results and Implications
The top 1% genes with highest
iQ(
G) scores, 149 from OvCa and 75 from ThCa, were selected for KEGG pathway analysis.
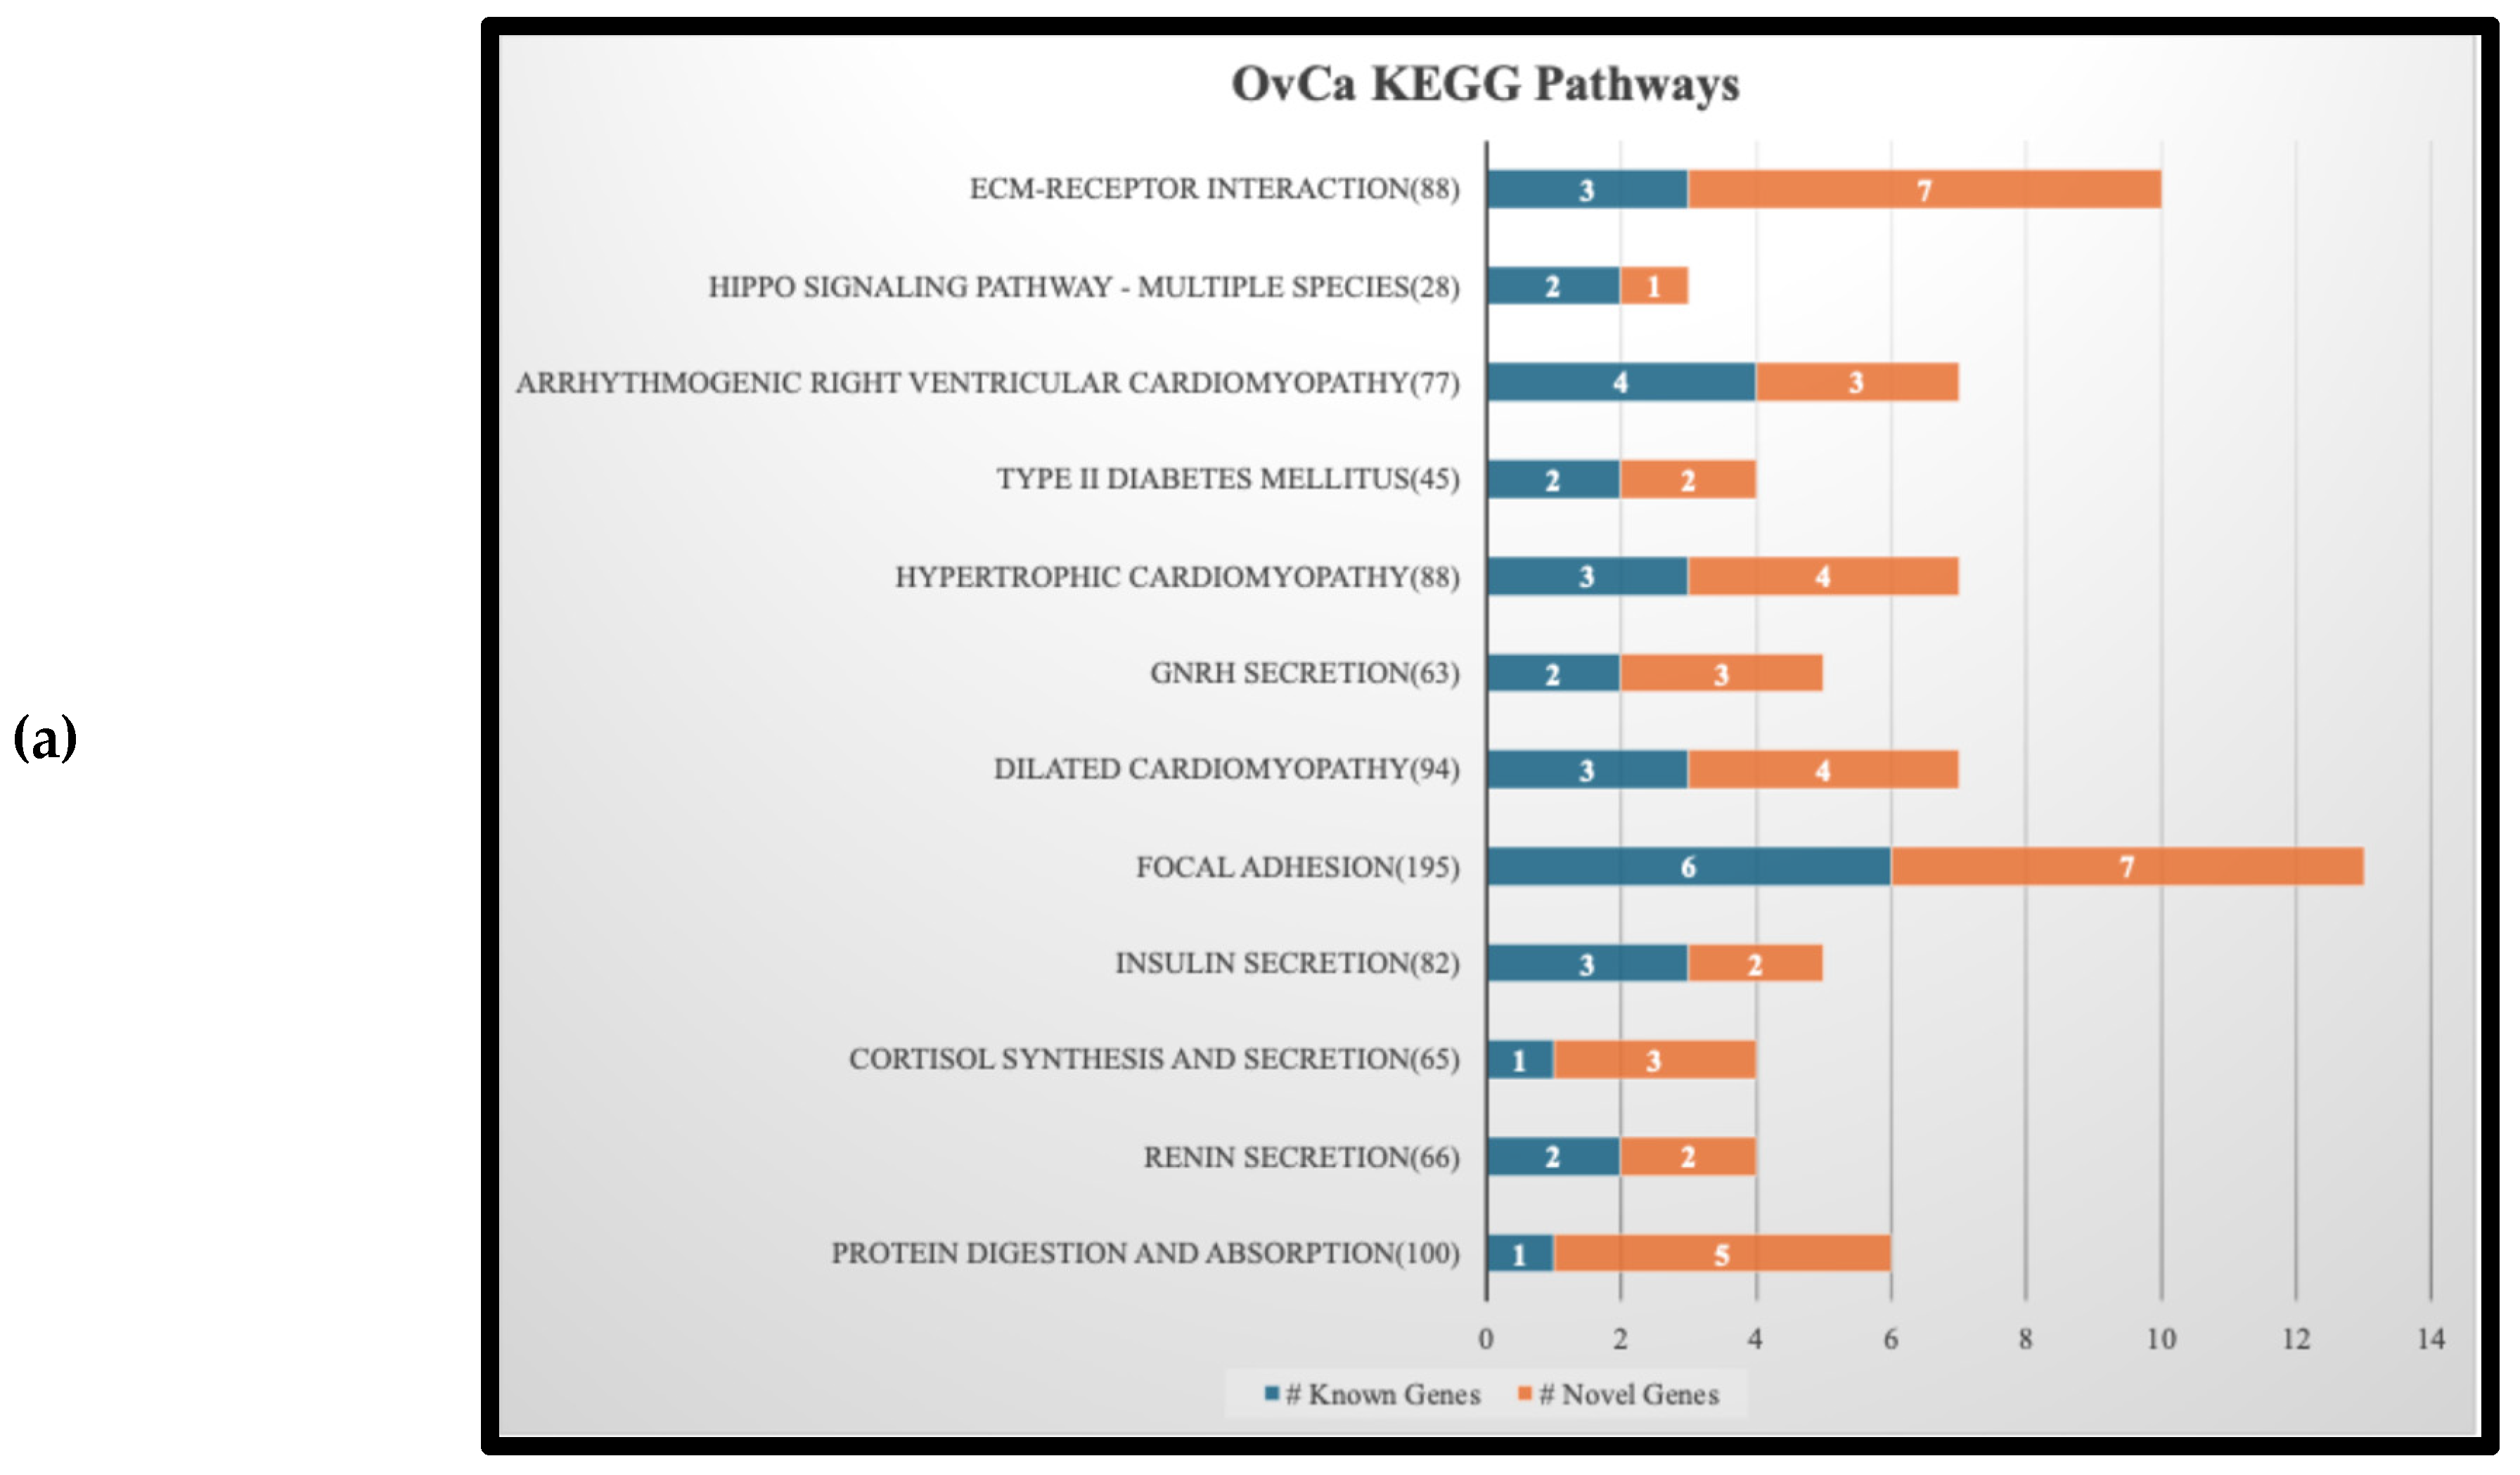
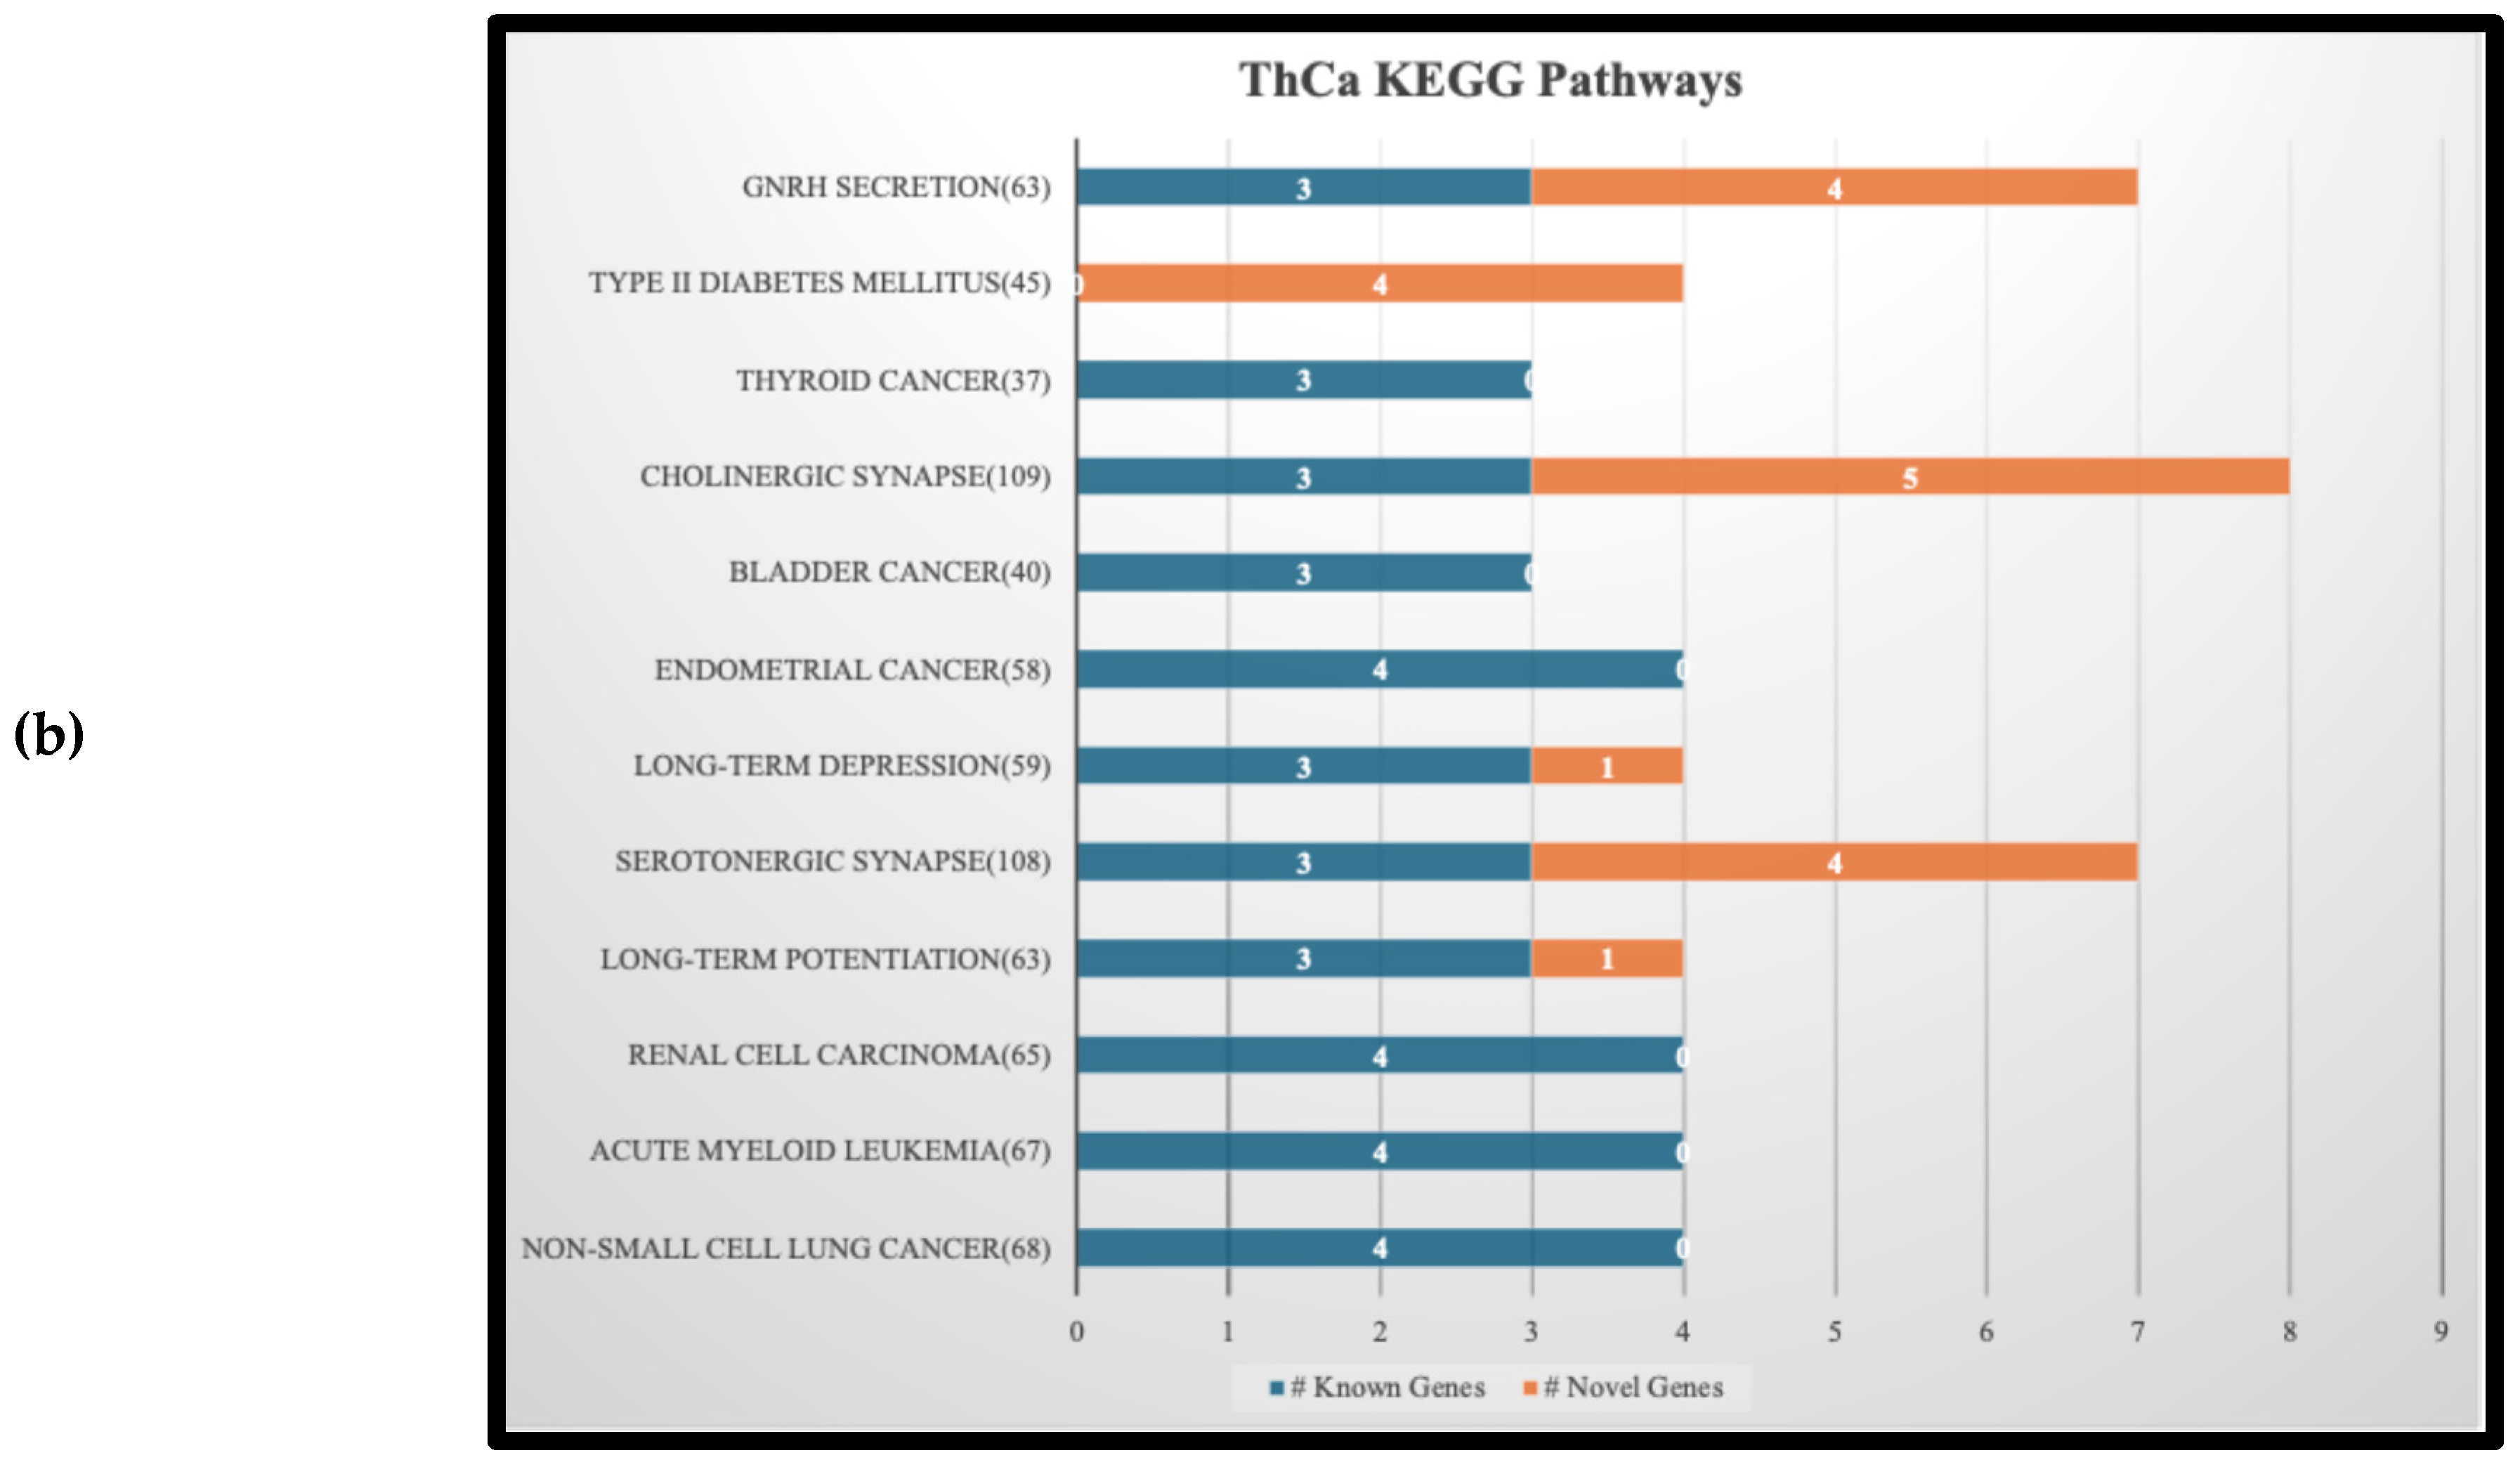
Figure 3 is a stacked bar graph of the top 12 KEGG pathways found by submitting the selected genes according to the description in section 2.4. In each pathway, the number of known genes related to the cancer is shown in blue and the number of novel ones in orange. The genes associated to these pathways, for both known and novel, are listed on the supplementary file “KEGG Bar Graphs.xlsx”.
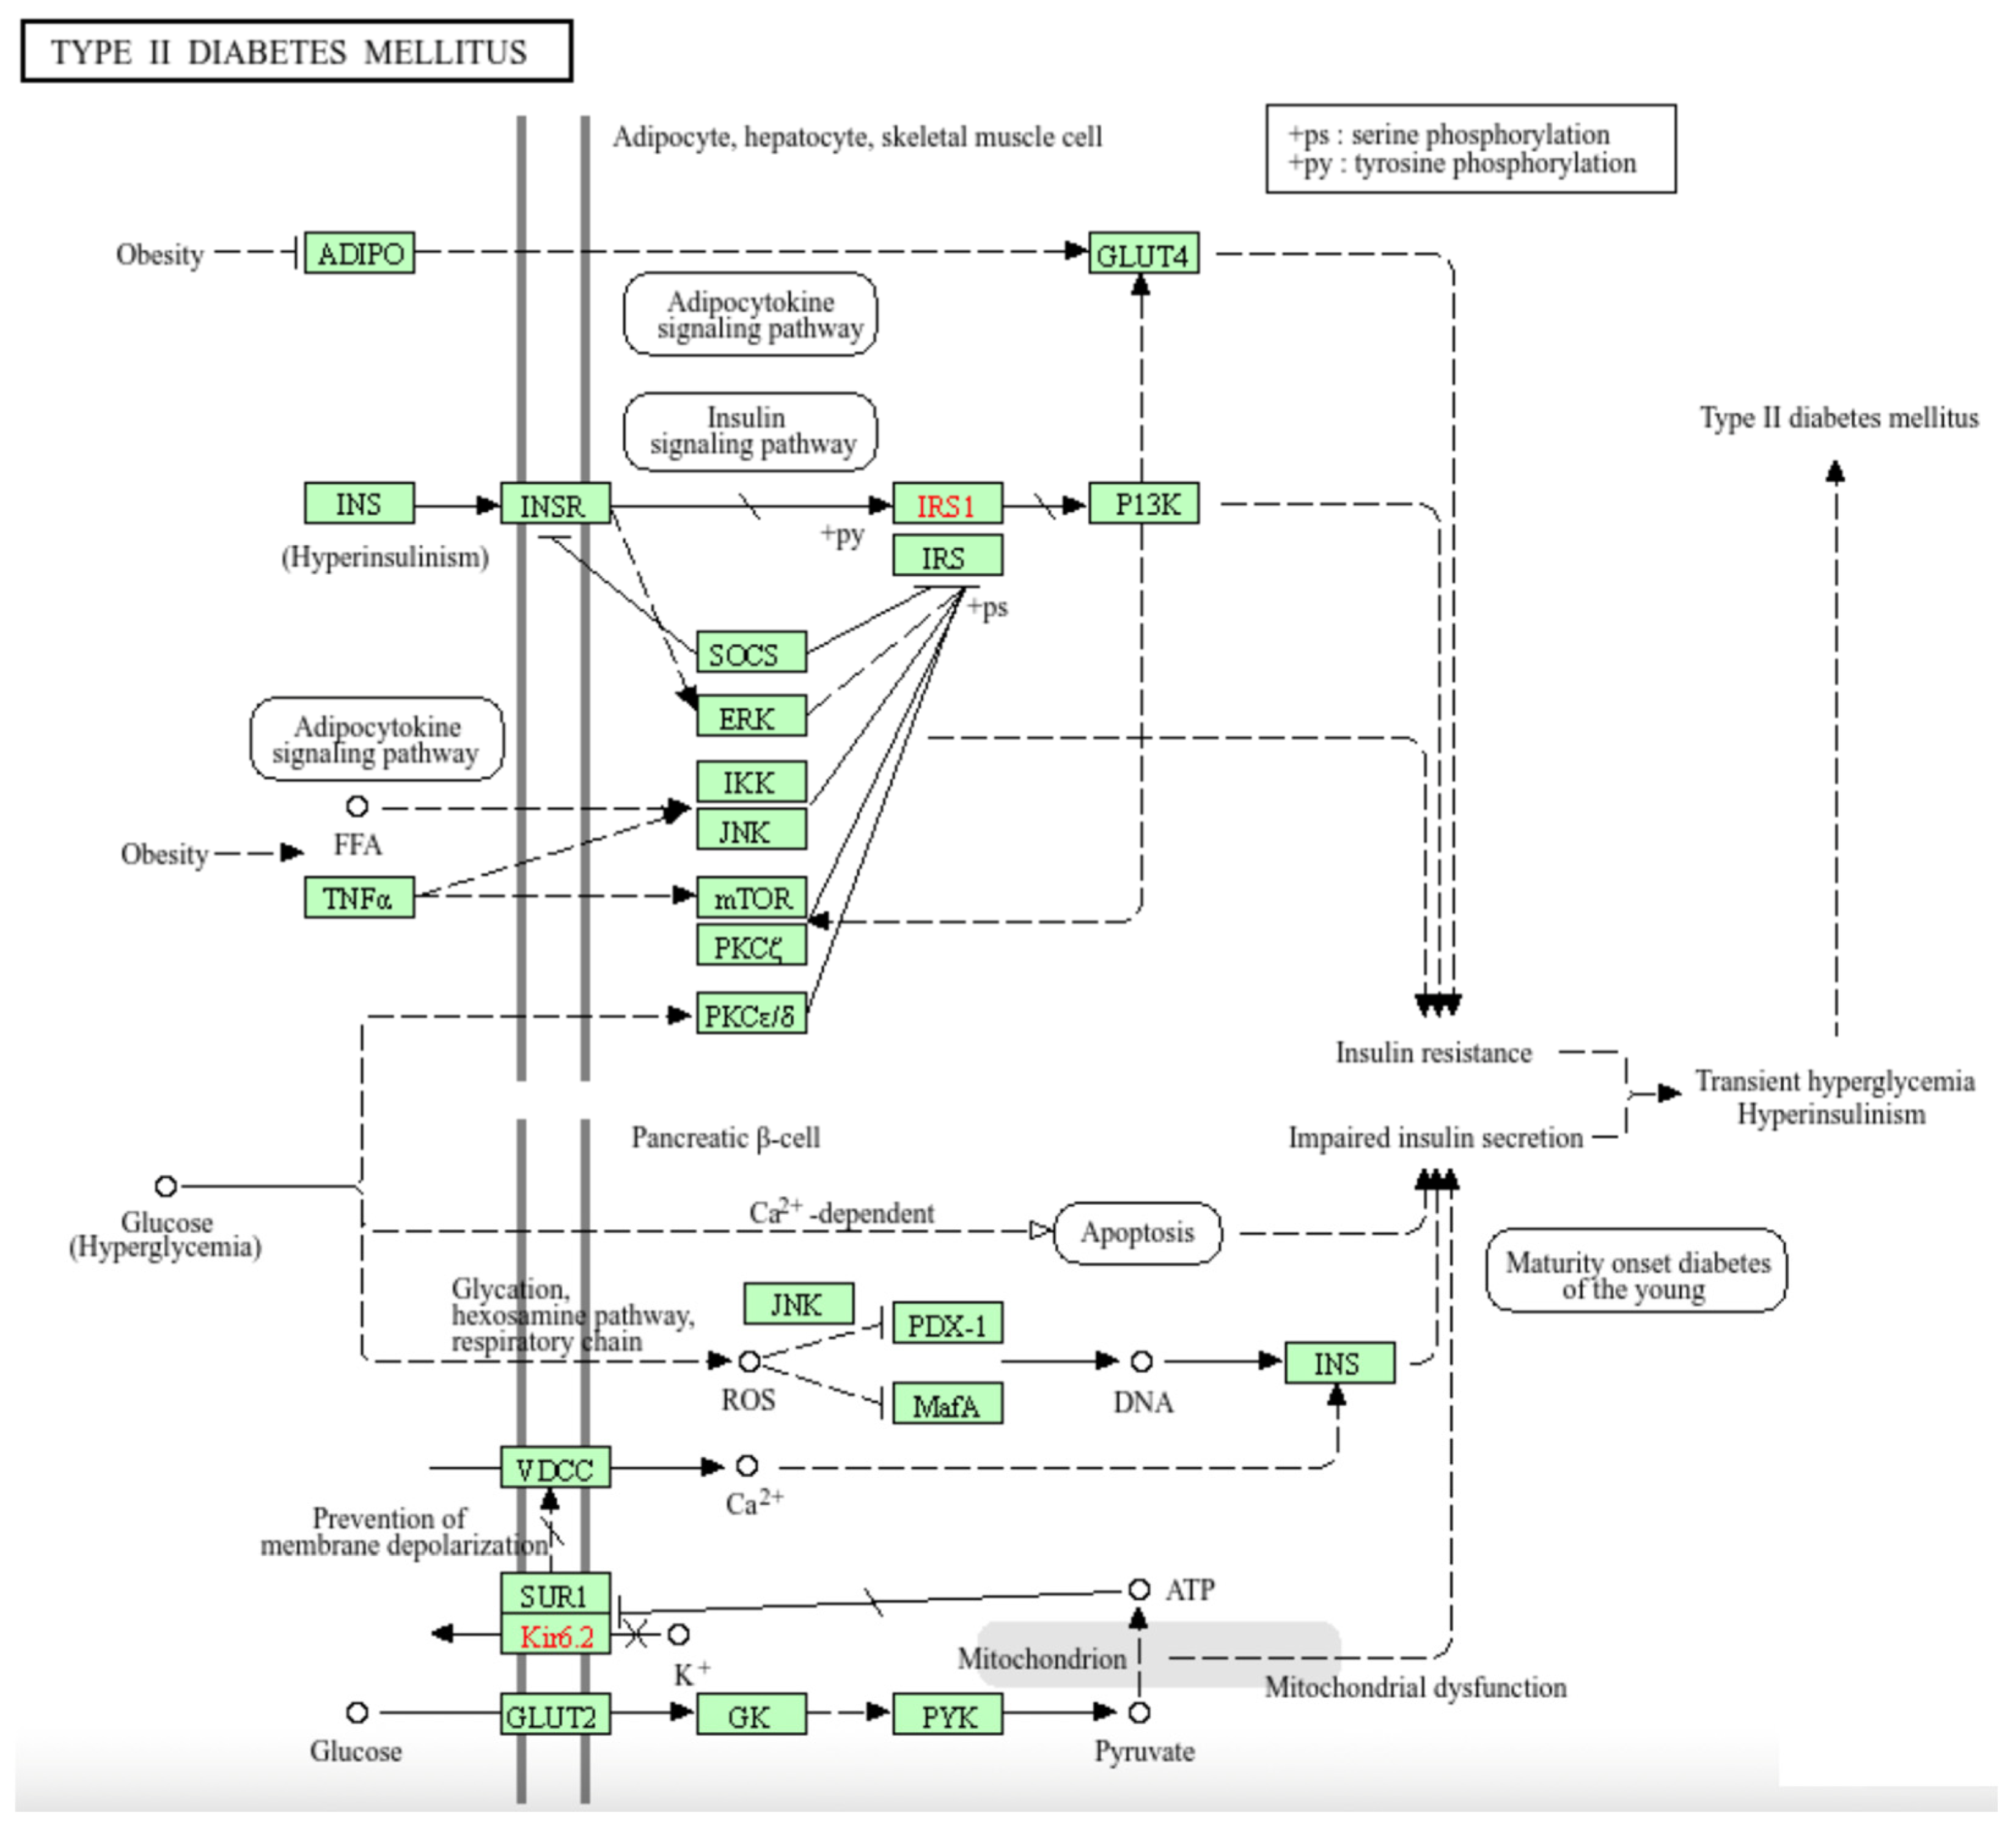
Figure 3(a) and (b) show that two pathways, namely DM2 and GNRH Secretion, are shared by OvCa and ThCa. We decided to focus on a more in-depth analysis of the gene interactions within the DM2 pathway as shown in
Figure 4 in relation to the two cancers. The four OvCa-related genes involved in the DM2 pathway are
CACNA1A, CACNA1C, CACNA1G and
ABCC8, while the four ThCa-related genes are
CACNA1A, CACNA1B, CACNA1C, and
CACNA1G. We will first discuss some possible roles of the
CACNA1 genes and then
ABCC8.
CACNA1A, CACNA1C, and
CACNA1G are among the top 1% genes scored by
iQ(
G) for both OvCa and ThCa.
CACNA1B is among the top 1% for ThCa only but is within the top 5% for OvCa. All are members of the
CACNA1 gene family encoding part of the voltage dependent calcium channel (VDCC), which is embedded within the cell membrane and control the flow of calcium ions. Following the pathway initiating from VDCC in
Figure 4 (bottom left), the release of calcium ions results in the expression of
INS, which is responsible for insulin production, leading to impaired insulin secretion, hyperinsulinism, and finally DM2. The
CACNA1 gene family is already known to be OvCa-related [
54,
55] but no direct connection of it to ThCa has been reported to date. However, the study by Roh et al. (2021) found that patients with ThCa who underwent a thyroidectomy have an increased risk for DM2 and attributed the correlation to post-surgery synthetic thyroid hormone, age, gender or social habits [
56]. Another study by Oberman et al. (2015), concluded that obesity and DM2 are significantly associated with differentiated ThCa [
57]. Our findings now suggest that the mutations in the
CACNA1 gene family, more specifically
CACNA1A,
CACNA1B, CACNA1C, and
CACNA1G, that code for parts of the VDCC protein complex could be a possible connection among OvCa, ThCa, and DM2.
The
ABCC8 gene in the DM2 pathway is a known OvCa-related gene. It has been listed by Xiang et al. (2022) as one of 12 lactate metabolism-related genes that form a prognostic signature for OvCa and established a prognostic scoring model where a lower expression level of
ABCC8 would lead to a higher risk score and poorer prognosis [
58]. Since
ABCC8 encodes the SUR1 protein that is a component of the ATP sensitive potassium channel and serves as a sensory receptor to sense cellular energy, lower expression of
ABCC8 could repress production of the SUR1/Kir6.2 complex (see bottom left of
Figure 4). This can trigger closure of potassium channels, which in turn causes over-expression of the VDCC complex to allow the flow of calcium ions, ultimately leading to DM2 via the same path as described in the previous paragraph. So, for patients with OvCa who also suffer from DM2, mutations in
ABCC8 could be a plausible reason behind the less favorable prognosis.
Also notable in
Figure 3(b) is that five of the 12 pathways identified for our top-scoring ThCa genes relate to other cancers, one of which being acute myeloid leukemia (AML). RAI treatment received by many ThCa patients has been suspected to be a risk factor for AML [
59]. However, based on
Figure 3(b), AML and ThCa share four genes,
NRAS, HRAS, BRAF, and AKT1 that are known to be directly associated with them. This suggests an alternative hypothesis that SNVs on these four genes in patients with ThCa could also contribute to their susceptibility to AML as a secondary cancer. A more in-depth study on the roles of these genes in AML and ThCa would be worthwhile.
4. Conclusion
Utilizing the considerable amount of publicly available SNV data obtained from patients with OvCa and ThCa, the iQ(G) scoring function, which integrates the occurrence frequencies and cumulative functional effects of the SNVs averaged over different transcripts of a protein-coding gene G, has been demonstrated to be a successful quantitative method for identifying and ranking cancer-related genes. KEGG pathway analysis using the top-scoring genes found by iQ(G) for OvCa and ThCa revealed an interesting finding on how several members of the CACNA1 gene family could be a possible link between these chronic cancers and DM2. The analysis also provided some insights into the prognosis and treatments for patients with OvCa and ThCa which can be further investigated in the future.
Author Contributions
Conceptualization, A.B. and M.-Y.L.; methodology, A.B., J.E.M. and MY.L.; coding, A.B., O.D.; validation, A.B., K.B., and M.-Y.L.; data curation, A.B., O.D. J.E.M.; formal analysis, A.B., O.D.; investigation, A.B., O.D., M.-Y.L.; resources, J.E.M., K.B.; writing—original draft preparation, A.B.; writing—review and editing, A.B., O.D., J.E.M., K.B., M.-Y.L.; supervision, M.-Y.L.; funding acquisition, M.-Y.L. All authors have read and agreed to the published version of the manuscript.
Funding
This work was supported in part by grant 5U54MD007592 from the National Institute on Minority Health to the Border Biomedical Research Center at UTEP.
Institutional Review Board Statement
Not applicable.
Informed Consent Statement
This study involved a secondary analysis of existing data from the community repository Genomic Data Commons (GDC). The data contains only mutational data, withholding any information that could be linked to the patient.
Data Availability Statement
Conflicts of Interest
The authors declare no conflicts of interest.
Abbreviations
The following abbreviations are used in this manuscript:
| OvCa |
Ovarian cancer |
| ThCa |
Thyroid cancer |
| SNV |
Single nucleotide variant |
| VCF |
Variant call format |
| FATHMM-XF |
Functional analysis through hidden markov models – extended features |
| CADD |
Combined annotation dependent depletion |
| SIFT |
Sort intolerant from tolerant |
| PolyPhen |
Polymorphism phenotyping |
| VEP |
Variant effect predictor |
| KEGG |
Kyoto encyclopedia of genes and genomes |
| STRING |
Search tool for the retrieval of interacting genes/proteins |
| NGS |
Next generation sequencing |
| GDC |
Genomics data commons |
| CSQ |
Consequence (data entry within VCF) |
| ROS |
Reactive oxygen species |
| RAI |
Radioactive Iodine |
| AML |
Acute myeloid leukemia |
| DM2 |
Type II diabetes mellitus |
| VDCC |
Voltage-dependent calcium channel |
References
- What is ovarian cancer: Ovarian tumors and cysts. American Cancer Society. Available online: www.cancer.org/cancer/types/ovarian-cancer/about/what-is-ovarian-cancer.html (accessed on 6 March 2025).
- Ovarian cancer statistics: How common is ovarian cancer. American Cancer Society. Available online: https://www.cancer.org/cancer/types/ovarian-cancer/about/key-statistics.html (accessed on 9 May 2025).
- Modugno, F. Ovarian Cancer and High-Risk Women Symposium Presenters. Ovarian cancer and high-risk women—Implications for prevention, screening, and early detection. Gynecol. Oncol. 2003, 91, 15–31. [Google Scholar] [CrossRef] [PubMed]
- American Cancer Society What Is Thyroid Cancer? Available online: https://www.cancer.org/cancer/types/thyroid-cancer/about/what-is-thyroid-cancer.html (accessed on 29 January 2025).
- Key Statistics for Thyroid Cancer. Available online: https://www.cancer.org/cancer/types/thyroid-cancer/about/key-statistics.html (accessed on 29 January 2025).
- The causes of mutations - understanding evolution. Understanding Evolution. Available online: https://evolution.berkeley.edu/evolution-101/mechanisms-the-processes-of-evolution/the-causes-of-mutations/ (accessed on 9 September 2022).
- Ray, P.D.; Huang, B.-W.; Tsuji, Y. Reactive oxygen species (ROS) homeostasis and redox regulation in cellular signaling. Cell. Signal. 2012. Available online: https://www.ncbi.nlm.nih.gov/pmc/articles/PMC3454471/#R1 (accessed on 9 September 2022).
- Ryu, J.Y.; Kim, H.; Lee, J.; et al. Human genes with a greater number of transcript variants tend to show biological features of housekeeping and essential genes. Mol. BioSyst. 2015, 11, 2798–2807. [Google Scholar] [CrossRef]
- PolyPhen-2 Score. Available online: https://ionreporter.thermofisher.com/ionreporter/help/GUID-57A60D00-0654-4F80-A8F9-F6B6A48D0278.html (accessed on 7 March 2024).
- Niroula, A.; Vihinen, M. How good are pathogenicity predictors in detecting benign variants? PLoS Comput. Biol. 2019, 15, e1006481. [Google Scholar] [CrossRef]
- Chen, J.; et al. Hunting for beneficial mutations: Conditioning on SIFT scores when estimating the distribution of fitness effect of new mutations. Genome Biol. Evol. 2022, 14. [Google Scholar] [CrossRef]
- Combined Annotation Dependent Depletion. CADD. Available online: https://cadd.gs.washington.edu/ (accessed on 7 March 2024).
- Rogers, M.F.; Shihab, H.A.; Mort, M.; Cooper, D.N.; Gaunt, T.R.; Campbell, C. FATHMM-XF: Enhanced accuracy in the prediction of pathogenic sequence variants via an extended feature set. Bioinformatics, 2024; submitted. [Google Scholar]
- Shihab, H.A.; Rogers, M.F.; Gough, J.; Mort, M.; Cooper, D.N.; Day, I.N.M.; Gaunt, T.R.; Campbell, C. An integrative approach to predicting the functional consequences of non-coding and coding sequence variation. Bioinformatics 2015, 31, 1536–1543. [Google Scholar] [CrossRef]
- Shihab, H.A.; Gough, J.; Cooper, D.N.; Stenson, P.D.; Barker, G.L.A.; Edwards, K.J.; Day, I.N.M.; Gaunt, T.R. Predicting the functional, molecular and phenotypic consequences of amino acid substitutions using hidden Markov models. Hum. Mutat. 2013, 34, 57–65. [Google Scholar] [CrossRef]
- Yoon, B.-J. Hidden Markov models and their applications in biological sequence analysis. Curr. Genomics 2009, 10, 402–415. Available online: www.ncbi.nlm.nih.gov/pmc/articles/PMC2766791/ (accessed on 6 March 2024). [CrossRef] [PubMed]
- Szklarczyk, D.; Kirsch, R.; Koutrouli, M.; Nastou, K.; Mehryary, F.; Hachilif, R.; Annika, G.L.; Fang, T.; Doncheva, N.T.; Pyysalo, S.; et al. The STRING database in 2023: Protein–protein association networks and functional enrichment analyses for any sequenced genome of interest. Nucleic Acids Res. 2023, 51, D638–D646. [Google Scholar] [CrossRef] [PubMed]
- Szklarczyk, D.; Gable, A.L.; Nastou, K.C.; Lyon, D.; Kirsch, R.; Pyysalo, S.; Doncheva, N.T.; Legeay, M.; Fang, T.; Bork, P.; et al. The STRING database in 2021: Customizable protein–protein networks, and functional characterization of user-uploaded gene/measurement sets. Nucleic Acids Res. 2021, 49, D605–D612. [Google Scholar] [CrossRef]
- Szklarczyk, D.; Gable, A.L.; Lyon, D.; Junge, A.; Wyder, S.; Huerta-Cepas, J.; Simonovic, M.; Doncheva, N.T.; Morris, J.H.; Bork, P.; et al. STRING v11: Protein–protein association networks with increased coverage, supporting functional discovery in genome-wide experimental datasets. Nucleic Acids Res. 2019, 47, D607–D613. [Google Scholar] [CrossRef]
- Szklarczyk, D.; Morris, J.H.; Cook, H.; Kuhn, M.; Wyder, S.; Simonovic, M.; Santos, A.; Doncheva, N.T.; Roth, A.; Bork, P.; et al. The STRING database in 2017: Quality-controlled protein–protein association networks, made broadly accessible. Nucleic Acids Res. 2017, 45, D362–D368. [Google Scholar] [CrossRef]
- Szklarczyk, D.; Franceschini, A.; Wyder, S.; Forslund, K.; Heller, D.; Huerta-Cepas, J.; Simonovic, M.; Roth, A.; Santos, A.; Tsafou, K.P.; et al. STRING v10: Protein–protein interaction networks, integrated over the tree of life. Nucleic Acids Res. 2015, 43, D447–D452. [Google Scholar] [CrossRef]
- Franceschini, A.; Lin, J.; von Mering, C.; Jensen, L.J. SVD-phy: Improved prediction of protein functional associations through singular value decomposition of phylogenetic profiles. Bioinformatics 2015, 31, btv696. [Google Scholar] [CrossRef] [PubMed]
- Franceschini, A.; Szklarczyk, D.; Frankild, S.; Kuhn, M.; Simonovic, M.; Roth, A.; Lin, J.; Minguez, P.; Bork, P.; von Mering, C.; et al. STRING v9.1: Protein–protein interaction networks, with increased coverage and integration. Nucleic Acids Res. 2013, 41, D808–D815. [Google Scholar] [CrossRef] [PubMed]
- Szklarczyk, D.; Franceschini, A.; Kuhn, M.; Simonovic, M.; Roth, A.; Minguez, P.; Doerks, T.; Stark, M.; Muller, J.; Bork, P.; et al. The STRING database in 2011: Functional interaction networks of proteins, globally integrated and scored. Nucleic Acids Res. 2011, 39, D561–D568. [Google Scholar] [CrossRef]
- Jensen, L.J.; Kuhn, M.; Stark, M.; Chaffron, S.; Creevey, C.; Muller, J.; Doerks, T.; Julien, P.; Roth, A.; Simonovic, M.; et al. STRING 8—A global view on proteins and their functional interactions in 630 organisms. Nucleic Acids Res. 2009, 37, D412–D416. [Google Scholar] [CrossRef] [PubMed]
- von Mering, C.; Jensen, L.J.; Kuhn, M.; Chaffron, S.; Doerks, T.; Krueger, B.; Snel, B.; Bork, P. STRING 7—Recent developments in the integration and prediction of protein interactions. Nucleic Acids Res. 2007, 35, D358–D362. [Google Scholar] [CrossRef]
- von Mering, C.; Jensen, L.J.; Snel, B.; Hooper, S.D.; Krupp, M.; Foglierini, M.; Jouffre, N.; Huynen, M.A.; Bork, P. STRING: Known and predicted protein–protein associations, integrated and transferred across organisms. Nucleic Acids Res. 2005, 33, D433–D437. [Google Scholar] [CrossRef]
- von Mering, C.; Huynen, M.; Jaeggi, D.; Schmidt, S.; Bork, P.; Snel, B. STRING: A database of predicted functional associations between proteins. Nucleic Acids Res. 2003, 31, 258–261. [Google Scholar] [CrossRef]
- Snel, B.; Lehmann, G.; Bork, P.; Huynen, M.A. STRING: A web-server to retrieve and display the repeatedly occurring neighbourhood of a gene. Nucleic Acids Res. 2000, 28, 3442–3444. [Google Scholar] [CrossRef]
- GDC. Available online: https://portal.gdc.cancer.gov/ (accessed on 30 October 2022).
- The Cancer Genome Atlas Program (TCGA). Available online: https://www.cancer.gov/ccg/research/genome-sequencing/tcga (accessed on 30 October 2022).
- McLaren, W.; Gil, L.; Hunt, S.E.; Riat, H.S.; Ritchie, G.R.; Thormann, A.; Flicek, P.; Cunningham, F. The Ensembl Variant Effect Predictor. Genome Biol. 2016, 17, 122. [Google Scholar] [CrossRef]
- Variation, Ensembl. Pathogenicity Predictions. Available online: https://useast.ensembl.org/info/genome/variation/prediction/protein_function.html (accessed on 6 March 2024).
- Kinsella, R.J.; Kähäri, A.; Haider, S.; Zamora, J.; Proctor, G.; Spudich, G.; Almeida-King, J.; Staines, D.; Derwent, P.; Kerhornou, A.; Kersey, P.; Flicek, P. Ensembl BioMarts: A hub for data retrieval across taxonomic space. Database (Oxford) 2011, bar030. [Google Scholar] [CrossRef]
- Oscanoa, J.; Sivapalan, L.; Gadaleta, E.; Dayem Ullah, A.Z.; Lemoine, N.R.; Chelala, C. SNPnexus: A web server for functional annotation of human genome sequence variation (2020 update). Nucleic Acids Res. 2020, 48, W185–W192. [Google Scholar] [CrossRef]
- Dayem Ullah, A.Z.; Oscanoa, J.; Wang, J.; Nagano, A.; Lemoine, N.; Chelala, C. SNPnexus: Assessing the functional relevance of genetic variation to facilitate the promise of precision medicine. Nucleic Acids Res. 2018, 46, W109–W113. [Google Scholar] [CrossRef] [PubMed]
- Dayem Ullah, A.Z.; Lemoine, N.R.; Chelala, C. A practical guide for the functional annotation of genetic variations using SNPnexus. Brief. Bioinform. 2013, 14, 437–447. [Google Scholar] [CrossRef]
- Dayem Ullah, A.Z.; Lemoine, N.R.; Chelala, C. SNPnexus: A web server for functional annotation of novel and publicly known genetic variants (2012 update). Nucleic Acids Res. 2012, 40, W65–W70. [Google Scholar] [CrossRef] [PubMed]
- Chelala, C.; Khan, A.; Lemoine, N.R. SNPnexus: A web database for functional annotation of newly discovered and public domain Single Nucleotide Polymorphisms. Bioinformatics 2009, 25, 655–661. [Google Scholar] [CrossRef]
- Seal, R.L.; Braschi, B.; Gray, K.; Jones, T.E.M.; Tweedie, S.; Haim-Vilmovsky, L.; Bruford, E.A. Genenames.org: The HGNC resources in 2023. Nucleic Acids Res. 2023. [Google Scholar] [CrossRef]
- HGNC Database. Available online: https://www.genenames.org (accessed on 7 March 2024).
- Stelzer, G.; Rosen, R.; Plaschkes, I.; Zimmerman, S.; Twik, M.; Fishilevich, S.; Iny Stein, T.; Nudel, R.; Lieder, I.; Mazor, Y.; et al. The GeneCards Suite: From gene data mining to disease genome sequence analyses. Curr. Protoc. Bioinform. 2016, 54, 1.30.1–1.30.33. [Google Scholar] [CrossRef] [PubMed]
- Safran, M.; Rosen, N.; Twik, M.; BarShir, R.; Iny Stein, T.; Dahary, D.; Fishilevich, S.; Lancet, D. The GeneCards Suite. In Practical Guide to Life Science Databases, 1st ed.; Springer: Cham, Switzerland, 2022; pp. 27–56. [Google Scholar]
- Kanehisa, M.; Furumichi, M.; Sato, Y.; Matsuura, Y.; Ishiguro-Watanabe, M. KEGG: Biological systems database as a model of the real world. Nucleic Acids Res. 2025, 53, D672–D677. [Google Scholar] [CrossRef]
- Kanehisa, M. Toward understanding the origin and evolution of cellular organisms. Protein Sci. 2019, 28, 1947–1951. [Google Scholar] [CrossRef]
- Kanehisa, M.; Goto, S. KEGG: Kyoto Encyclopedia of Genes and Genomes. Nucleic Acids Res. 2000, 28, 27–30. [Google Scholar] [CrossRef]
- Rappaport, N.; et al. Rational confederation of genes and diseases: NGS interpretation via GeneCards, MalaCards and VarElect. Biomed. Eng. Online 2017, 16 Suppl. 1, 72. [Google Scholar] [CrossRef]
- Rappaport, N.; et al. MalaCards: An integrated compendium for diseases and their annotation. Database (Oxford) 2013, bat018. [Google Scholar] [CrossRef] [PubMed]
- Rappaport, N.; et al. MalaCards: A comprehensive automatically-mined database of human diseases. Curr. Protoc. Bioinformatics 2014, 47, 1.24.1–1.24.19. [Google Scholar] [CrossRef]
- Rappaport, N.; et al. MalaCards: An amalgamated human disease compendium with diverse clinical and genetic annotation and structured search. Nucleic Acids Res. 2017, 45, D877–D887. [Google Scholar] [CrossRef]
- Safran, M.; et al. MalaCards - the integrated human malady compendium. In Proceedings of the ISMB 2012, Long Beach, CA, USA, 15–17 July 2012. [Google Scholar]
- Phung, H.T.; Nguyen, A.Q.; Van Nguyen, T.; Van Nguyen, T.; Nguyen, L.T.; Nguyen, K.T.; Thi Pham, H.D. Ovary metastasis from lung cancer mimicking primary ovarian cancer: A rare case report. Ann. Med. Surg. 2022, 80, 104207. [Google Scholar] [CrossRef]
- Madu, N.M.; Skinner, C.; Oyibo, S.O. Cure rates after a single dose of radioactive iodine to treat hyperthyroidism: The fixed-dose regimen. Cureus 2022, 14, e28316. [Google Scholar] [CrossRef] [PubMed]
- Chang, X.; Dong, Y. CACNA1C Is a Prognostic Predictor for Patients with Ovarian Cancer. Journal of Ovarian Research 2021, 14. [Google Scholar] [CrossRef] [PubMed]
- Jiang, A.; Jiang, Y.; Meng, Y.; Ma, M.; Qin, Z.; Chen, Y.; Fan, Y.; Li, P. M6A Modification Mediates CACNA1A Stability to Drive the Progression of Ovarian Cancer by Inhibiting Ferroptosis. Journal of Ovarian Research 2025. [Google Scholar] [CrossRef]
- Roh, E.; Noh, E.; Hwang, S.Y.; Kim, J.A.; Song, E.; Park, M.; Choi, K.M.; Baik, S.H.; Cho, G.J.; Yoo, H.J. Increased Risk of Type 2 Diabetes in Patients with Thyroid Cancer after Thyroidectomy: A Nationwide Cohort Study. J. Clin. Endocrinol. Metab. Available online. 2021, 107, e1047–e1056. [Google Scholar] [CrossRef] [PubMed]
- Oberman, B.; Khaku, A.; Camacho, F.; Goldenberg, D. Relationship between Obesity, Diabetes and the Risk of Thyroid Cancer. Am. J. Otolaryngol. Available online. 2015, 36, 535–541. [Google Scholar] [CrossRef] [PubMed]
- Xiang, J.; Su, R.; Wu, S.; Zhou, L. Construction of a Prognostic Signature for Serous Ovarian Cancer Based on Lactate Metabolism-Related Genes. Frontiers in Oncology 2022, 12. [Google Scholar] [CrossRef]
- Molenaar, R.J.; Sidana, Surbhi; Radivoyevitch, T.; Advani, A.S.; Gerds, A.T.; Carraway, H.E.; Angelini, D.E.; Kalaycio; Nazha, M.; Aziz; Adelstein, D.J.; et al. Risk of Hematologic Malignancies after Radioiodine Treatment of Well-Differentiated Thyroid Cancer. Journal of Clinical Oncology 2018, 36, 1831–1839. [Google Scholar] [CrossRef] [PubMed]
|
Disclaimer/Publisher’s Note: The statements, opinions and data contained in all publications are solely those of the individual author(s) and contributor(s) and not of MDPI and/or the editor(s). MDPI and/or the editor(s) disclaim responsibility for any injury to people or property resulting from any ideas, methods, instructions or products referred to in the content. |
© 2026 by the authors. Licensee MDPI, Basel, Switzerland. This article is an open access article distributed under the terms and conditions of the Creative Commons Attribution (CC BY) license (http://creativecommons.org/licenses/by/4.0/).