
Submitted:
06 January 2026
Posted:
07 January 2026
You are already at the latest version
Abstract
As the threat landscape advances and pressure to reduce the energy footprint grows, it is crucial to understand how security mechanisms affect the power consumption of cloud-native platforms. Although several studies in this domain have investigated the performance impact of security practices or the energy characteristics of containerized applications, their combined effect remains largely underexplored. This study examines how common Kubernetes (K8s) safeguards influence cluster energy use across varying security configurations and workload conditions. By employing runtime and network monitoring, encryption, and vulnerability-scanning tools under diverse workloads (idle, stressed, realistic application), we compare the baseline system behavior against the energy consumption introduced by each security configuration. Our findings reveal that always-on security mechanisms impose a persistent baseline energy cost—occasionally making an idle protected cluster comparable to a heavily loaded unprotected one, while security under load results in substantial incremental overhead. In particular, service meshes and full-tunnel encryption show the largest sustained overhead, while eBPF telemetry, network security monitoring, and vulnerability scans add modest or short-lived costs. These findings provide useful security-energy insights and trade-offs for configuring K8s in resource-constrained settings, including IoT/smart city deployments.
Keywords:
Kubernetes
; Cloud/Edge/IoT
; security
; energy consumption
; trade-offs
1. Introduction
Kubernetes (K8s) is considered the industry standard for orchestrating containerized applications, offering a powerful abstraction for automating deployment, scaling and lifecycle management across distributed environments. The extent of K8s utilization in enterprise and Edge–Cloud infrastructures triggers the demand for robust security measures against an evolving threat landscape that strikes at the core of container orchestration vulnerabilities, including misconfigurations, privilege escalation and network-based attacks. However, the implementation of these security measures typically results in CPU and memory overhead, which can increase the energy consumption of the underlying infrastructure. Data centers have already been under pressure to reduce their energy footprint [1], a demand even more pressing at the edge, where devices are resource- and power-constrained, often battery-powered, especially if they provide AI capabilities [2]. These pressures motivate intelligent mechanisms and techniques that consider security, performance, cost and energy efficiency across the Edge–Cloud continuum.
Despite the critical importance of both security and energy consumption—especially in the Cloud-Edge-IoT and smart city context—they are frequently addressed independently, with little consideration of their interaction. For instance, a cluster hardened according to strict security standards may be more resilient to an attack, but also potentially less energy and resource-efficient than one operating with relaxed configurations, particularly when scaled across multiple locations and nodes. Therefore, understanding and managing this security–energy trade-off is essential, particularly in edge deployments that serve as primary data producers within sensor and IoT ecosystems.
Several research papers investigate energy consumption in smart cities, from macro-level surveys [3,4] to system designs [5,6]. While this work focuses primarily on K8s-based cloud-native environments, its insights also extend to the design and optimization of distributed edge and smart city ecosystems. In such domains, there is a continuous need to study and balance security assurance with strict energy constraints [7]. Understanding how security mechanisms influence power consumption at scale can therefore guide the development of more efficient protection strategies in energy-limited contexts. Techniques such as lightweight encryption, selective telemetry, and adaptive security provisioning—-explored in cloud-native systems—-can be adapted to enhance the resilience and sustainability of such deployments. Thus, although the paper appears peripheral in scope, it contributes critically to understanding the energy–security trade-offs that are central to resource-constrained and smart city workloads.
In this work, we aim to fill the security-energy trade-off gap by quantifying the energy overhead of various K8s security mechanisms and assessing how hardening techniques affect cluster-level energy consumption under diverse workload scenarios. Our study offers several contributions to the broader field of cloud-native security and sustainability.
- We identify and analyze the interplay between security and energy efficiency in K8s environments.
- We implement and evaluate a range of common K8s security mechanisms, providing insights into their impact on energy consumption.
- We investigate diverse cluster operating conditions, including a realistic, containerized e-commerce workload with reproducible load generation and observability to measure the security-energy interactions.
The remainder of this paper is organized as follows. Section 2 presents the necessary background to clarify the context of our work, while Section 3 discusses the existing literature in K8s security, energy and performance evaluation. Section 4 explains the experimentation methodology and Section 5 details our experiment results. Lastly, Section 6 concludes the paper and outlines potential directions for future work.
2. Background
K8s deployments integrate multiple layers of security and networking components such as service meshes, kernel-level observability, runtime enforcement and encrypted network overlays, each of which influences the overall power profile of a cluster. Understanding the energy-security trade-off requires evaluating how these mechanisms interact with typical workloads and how their operation translates into measurable energy overhead. In sensor- or IoT-oriented deployments, these trade-offs become particularly critical. Gateways and edge nodes often manage streams of sensor data under tight power and latency constraints, while the orchestration of secure communication, processing, and data aggregation for thousands of distributed IoT devices must balance protection levels with minimal energy impact to sustain continuous sensing operations.
In the following subsections, we examine the key categories that define this relationship: traffic encryption, which secures communication between cluster entities; runtime security, which monitors event streams and checks for anomalies; network security monitoring, which provides visibility into network flows and threats; vulnerability scanning, which identifies weaknesses and misconfigurations; and energy observability, which links power metrics to K8s resources to enable quantifiable comparisons.
2.1. Traffic Encryption
In IoT environments, encrypted communication channels are critical for securing telemetry from sensors and edge devices—such as environmental sensors, surveillance cameras, or industrial controllers. However, encryption adds computational load on constrained gateways. Measuring this additional cost helps quantify how securing sensor data streams influences node-level energy consumption and overall system sustainability. In a K8s cluster, traffic between nodes or pods may not be encrypted by default, unless the underlying network plugin supports it. Traffic encryption can be applied at multiple layers to mitigate eavesdropping, tampering, and Man-in-the-Middle attacks, thereby ensuring secure data transfer, confidentiality and integrity of inter-node communications. At the network layer, protocols such as IPsec and kernel-integrated VPNs provide node-to-node tunnels, with several CNIs (e.g., Calico, Cilium) supporting optional IPsec or WireGuard for cluster-wide encryption. WireGuard provides a modern, high-performance encrypted overlay network that is frequently leveraged in cloud-native environments to secure inter-node traffic. It operates as an efficient VPN protocol integrated directly into the Linux kernel, establishing secure tunnels by utilizing state-of-the-art cryptographic primitives (e.g., ChaCha20Poly1305 and Curve25519) [8]. For multi-cluster connectivity, tools such as Submariner1 establish encrypted interconnects across clusters. At the transport and application layers, service meshes (e.g., Istio2 and Linkerd3) provide cluster-wide mutual TLS (mTLS), per-flow confidentiality, integrity and peer authentication, while automating certificate issuance and rotation, authorization policies and observability. While these capabilities greatly strengthen security with minimal application changes, they also introduce proxy and control-plane overhead, which can impact performance (e.g., latency, throughput) and energy consumption.
2.2. Runtime Security
Runtime security helps detect signs of sensor compromise by monitoring suspicious behavior. However, enabling continuous monitoring across hundreds of lightweight sensor data streams can significantly increase CPU utilization and energy draw—an important consideration for edge nodes powered by limited energy sources, such as solar or battery systems. In containerized environments, runtime security focuses on detecting and responding to suspicious behavior as software executes, providing continuous, host-level visibility into system activity. Typical mechanisms capture kernel events (syscalls, file and network activity) and evaluate them against predefined rules or policies to identify anomalies and policy violations in real time. Depending on configuration, responses may include alerting, process termination, syscall blocking, or file access denial, thereby enforcing runtime integrity. Representative open-source tools include eBPF-based solutions for low-overhead visibility and control. Tools such as Falco4, Cilium Tetragon5 and Aqua Tracee6 monitor kernel activity (e.g., via eBPF/probes), enrich captured events with workload metadata and evaluate them against rulesets. While these solutions enhance observability and security posture, they also introduce measurable resource and energy overhead, as each node expends CPU cycles on continuous event capture, parsing, and rule evaluation. The magnitude of this overhead scales with event frequency, rule complexity, and logging volume. In this context, eBPF-based probes act as fine-grained software sensors embedded in the kernel, generating detailed event data that can be correlated with physical power measurements.
2.3. Network Security Monitoring
Network security monitoring provides visibility into traffic patterns, protocol behavior and potential misuse by transforming packet streams into analyzable logs. In populated sensor/IoT deployments, network security monitoring helps identify compromised devices or abnormal communication patterns, such as unexpected data surges from a sensor or rogue devices injecting false readings. Unlike signature-only intrusion detection, modern monitoring emphasizes protocol-aware context, enabling operators to detect policy violations, data exfiltration and suspicious network behavior. In K8s, where traffic is highly ephemeral and often short-lived, monitoring is particularly valuable for reconstructing service interactions and detecting anomalies that may not appear in application-level logs. Data sources can range from packet capture for deep forensics, protocol/transaction logs and flow telemetry. In K8s, sensors run as DaemonSets on nodes or tap traffic via CNI port mirroring. Representative tools include Zeek7, which parses end-to-end protocols and generates structured logs integrated with SIEM/data systems (connections, DNS, HTTP, certificates), supporting real-time alerting and offline forensics. In addition, Cilium Hubble8 records L3-L7 flow telemetry with network-policy awareness, while Calico flow logs offer policy-aware visibility within Calico-managed clusters. Lastly, Kubeshark9 is a K8s-native network observability tool that captures traffic and reconstructs application protocols. It supports network security monitoring through lightweight agents that enable anomaly detection and policy enforcement; however, since it is not a full signature-based intrusion detection system (IDS), it is typically deployed alongside such tools to achieve defense in depth.
2.4. Vulnerability Scanning
In cloud-native environments, vulnerability scanning complements runtime defenses by identifying known weaknesses before and after deployment. Scanners analyze container images, OS packages, language dependencies and configuration artifacts to match versions against vulnerability databases, often alongside checks for misconfigurations and exposed secrets. Their primary goal is to surface actionable risks early and keep running workloads continuously assessed as new CVEs are published. Two of the most popular tools are Trivy10 and Grype/Syft11 which provide scanning of container images, filesystems, and K8s manifests or Helm charts. The Trivy Operator extends these capabilities into the K8s control loop by automatically discovering workloads, scanning their images, and storing results as custom resources. Similarly, Kubescape12 integrates with K8s clusters to assess configuration compliance and perform in-cluster image scanning using Grype. Both operators support scheduled and on-demand scans, offering configurable throttling to balance resource utilization and result freshness.
Beyond scanning for vulnerabilities and misconfigurations, K8s hardening guidance such as CIS K8s Benchmark [9] and NSA/CISA K8s Hardening Guide [10] emphasize reducing attack surface, enforcing strong authentication, least-privilege Role-Based Access Control (RBAC), encryption of data in transit and at rest, traffic isolation, network policies and many more techniques and configurations. Many of these controls offer minimal runtime cost, whereas security measures such as mesh-wide encryption, runtime telemetry and frequent in-cluster scans incur noticeable overhead—therefore their scope should be tuned to balance security and energy constraints, especially in edge/IoT contexts.
2.5. Energy Observability
Accurate energy measurement is a prerequisite for analyzing the trade-offs between security and efficiency. Energy observability can be achieved by correlating power consumption with the workloads that generate it, e.g., across nodes, pods, and services, thus enabling quantification of the energy cost introduced by specific security and networking mechanisms. Energy attribution methods are typically either sensor-driven, using hardware interfaces such as RAPL or NVML to obtain real-time power readings, or model-based, where power models map performance counters (e.g., CPU cycles, instructions, cache misses) to estimated energy on the target hardware [11]. Tools like Kepler (Kubernetes-based Efficient Power Level Exporter) [12] combine both approaches, leveraging hardware sensors when available and relying on validated power models otherwise to estimate per-container and per-node energy use. In contrast, Scaphandre13 focuses exclusively on hardware energy counters via the Linux powercap/RAPL interface, estimating total system power by combining these readings with per-process CPU accounting and resource utilization metrics [13].
3. Related Work
Recent works tackle energy in K8s environments along two primary fronts: (i) attribution/measurement and (ii) energy-aware control. Table 1 summarizes representative studies across these categories, highlighting their domains, techniques, platforms, and key findings. For attribution, tools such as Kepler estimate per-pod/container/cluster power by combining hardware telemetry with eBPF counters and energy models, reporting low error [12]. In this context, Pijnacker et al. [14] evaluate Kepler’s container attribution against iDRAC/Redfish ground truth and report misattribution patterns, concluding that container-level accuracy is not yet satisfactory; then introduce KubeWatt, which splits static/dynamic power from Redfish and redistributes dynamic power by CPU usage, validating low node-level error on their testbed while cautioning against fine-grained container accuracy. Werner et al. [15] present an automated experimentation framework for K8s that quantifies energy efficiency trade-offs of architectural choices (Microservice as baseline, Monolith, Serverless, Service Reduction, Runtime Improvement) across the cloud-native stack and evaluate its functionality with the deployment of a realistic workload. Findings show that in terms of energy, Runtime Improvement delivered the most consistent energy win with lower energy per request across workloads, while the Serverless variant increased energy usage due to added platform overhead.
On the energy-aware control side, Kaur et al. [16] introduce KEIDS, a K8s scheduler for Edge-Cloud that optimizes energy with interference/carbon objectives and shows improvement over baseline placements. Rao & Li [17] present EA-K8S that uses an improved Sparrow Search Algorithm (ISSA) to place high consumption/communicative microservices on nodes with low power usage effectiveness to reduce energy consumption, achieving energy reduction of . Beena et al. [18] integrate Ant Colony Optimization (ACO), Particle Swarm Optimization (PSO) and hardware-level Dynamic Voltage and Frequency Scaling (DVFS) algorithms with K8s autoscaling and lifecycle control (ARAA/ARKLM). Reported results show DVFS achieving the lowest average CPU () while ACO yields the fastest completion at higher CPU consumption, highlighting a speed-resource trade-off. A recent serverless edge design, FaasHouse, augments k3s/OpenFaaS with an energy-aware function scheduler that monitors each node’s state-of-charge (SoC) and capacity, then offloads functions from low-powered to well-powered nodes. Placement is scored via pluggable policies and solved with a House-Allocation-style assignment to respect capacity and prioritize local tenants. It is implemented on a 10-node Raspberry Pi edge cluster and evaluated in a 24-hour experiment. Regarding energy, results show a reduction of 76% wasted energy compared to K8s [6]. Ali & Sofia [19] propose including energy-awareness in K8s orchestration along the Edge-Cloud continuum using the CODECO framework. The PDLC-CA component collects node and network energy metrics based on proposed aggregated cost functions in order to score nodes on different performance profiles and feed recommendations to the scheduler. The experiments took place on a k3s testbed (laptop master + Raspberry Pi 4 workers) with Kepler-based estimates and JMeter loads. Results show that energy-aware scheduling generally reduced total energy compared to vanilla K8s, especially under high load intensity.
Smart city platforms push computation from cloud to fog/edge to meet strict latency and cost constraints, making energy-efficient orchestration a major concern. Recent fog architectures adopt K8s to place microservices across edge/fog/cloud. For example, the Adaptive Fog Computing Architecture (AFCA) deploys microservices on K8s, adds a Context-Aware Decision Engine and a Resource Orchestration Layer for load steering and prediction based on Long Short-Term Memory (LSTM). Evaluated on smart-parking, pollution and traffic datasets in a hybrid testbed including Raspberry Pi edge nodes, Intel NUC fog servers and AWS-hosted cloud instances, AFCA reports 31% energy efficiency [5].
Focusing on security and resource overhead trade-offs in containerized environments, Koukis et al. [20] conduct a comparative study of five CNI plugins across vanilla K8s and MicroK8s, explicitly toggling tunneling (VXLAN/IPIP/Geneve/HostGW), security/encryption and service mesh options (WireGuard, IPsec, eBPF, Istio) in TCP and UDP scenarios, then reporting CPU, RAM and throughput. They find that plugin choice dominates performance, WireGuard tends to drive the highest CPU consumption and Istio/eBPF can deliver higher throughput at comparable or lower resource usage. Kapetanidou et al. [21] evaluate K8s vulnerability/misconfiguration scanners comparing scan time, detections and CPU/RAM/bandwidth usage. They report low overall overhead, with CPU usage comparable between Trivy and Kubescape Operators. Trivy peaks higher in memory—attributed to storing reports as CRDs—while Kubescape consumes network bandwidth for intra-operator communication and result storage, whereas Trivy shows no network usage during scans. Overall, both operators remain resource-efficient, suitable even for constrained clusters, but they exhibit different cost profiles. Viktorsson et al. [22] evaluate container runtimes by comparing runC, gVisor and Kata in the same K8s cluster and show that the added isolation layers come with substantial costs: runC outperforms the hardened runtimes by up to 5x on deployment time and application execution across TeaStore, Redis and Spark; gVisor deploys x faster than Kata but runs applications slower. They also report negligible idle CPU overhead but a higher memory footprint ( MB for gVisor, MB for Kata) relative to runC.
Despite the growing attention to energy consumption in Edge-Cloud deployments, to the best of our knowledge, we find no studies that measure the energy costs of network encryption, runtime monitoring and vulnerability scanning in K8s. Most studies focus primarily on performance rather than energy costs, with limited evidence and analysis of interaction effects when these mechanisms are combined. This gap motivates an energy-centric evaluation that measures individual and combined security controls under both synthetic and realistic workloads to provide comparable and reproducible results.
4. Experimentation Setup and Methodology
This section details the experimental environment, workload design, and measurement methodology used to assess the energy impact of the selected security mechanisms. We describe the testbed configuration, the security scenarios under evaluation, the synthetic and microservice-based workloads used for evaluation, and the methodology for collecting and attributing energy telemetry.
4.1. Experimental Setup
The testbed environment is hosted on a lab server equipped with an Intel(R) Xeon(R) CPU E5-2630 v2 at 2.60GHz, 6-core CPU, 128GB RAM and TB HDD, running the XCP-ng virtualization platform14. The setup includes all cluster VMs, i.e., 1 control plane and 2 worker nodes which are automatically deployed utilizing the CODECO Experimentation Framework (CODEF) [23] to ensure consistency and reproducibility, as clusters are fully torn down and redeployed from scratch. CODEF provides an integrated framework that automates the entire experimentation workflow across Cloud–Edge infrastructures. It orchestrates resource provisioning, cluster setup, experiment execution, and monitoring through modular abstraction layers that build upon well-established technologies such as Docker, Ansible, Jq, and kubeadm. Each scenario is executed multiple times to ensure statistical reliability, while the full system specifications, i.e., nodes, K8s flavors and networking, are provided in Table 2.
4.2. Experimental Workflow and Scenarios
To evaluate the energy and security trade-offs in K8s environments, a series of controlled experiments was designed and executed on the deployed testbed. The selected tools represent widely adopted open-source solutions that cover complementary aspects of cluster protection, as summarized below:
- Encryption: WireGuard, Istio (mTLS).
- Runtime: Falco, Cilium Tetragon.
- Network Monitoring: Zeek.
- Vulnerability Scanning: Trivy.
The study is conducted with security and networking scenarios evaluated both individually and in combination, as illustrated in Figure 1. For link encryption, iperf3 over plain networking is compared against encrypted WireGuard, under identical configuration. For in-mesh encryption, Istio is deployed in sidecar mode with a STRICT mTLS policy and evaluated against the plain networking configuration. Runtime security is toggled by enabling/disabling Falco (default ruleset) and Cilium Tetragon under the Falco Event Generator (EG). For network security monitoring, Zeek is deployed as a K8s DaemonSet on all worker nodes with the default configuration, while the UDP Spray is active. To capture interactions under realistic load, Online Boutique is deployed while selectively enabling WireGuard, Falco and Tetragon. Finally, the energy cost of vulnerability assessment (Trivy) is measured in the cluster.
4.3. Synthetic Workload and Triggering Mechanisms
The experimental workflow combines synthetic network load, runtime event generation, vulnerability scanning, and a realistic microservice-based application, as illustrated in Figure 1. The experiments were designed to isolate and quantify the energy impact of individual and combined security mechanisms in K8s. For the synthetic network load, we utilized iperf315 in TCP mode (transmitting "default" 128 KB chunks of data) between pods on separate worker nodes. To stress network security monitoring, we run a custom "UDP spray" client with iperf3 to generate high packets-per-second traffic towards the server. For runtime detection triggering, we utilized Falco EG to produce a repeatable stream of events. In terms of microservices, the Online Boutique16 (OB) and its built-in traffic generator are deployed to reflect realistic communication patterns of an e-commerce application. Finally, the evaluation of preventive security is achieved by scanning the cluster with Trivy.
4.4. Energy Attribution
Energy telemetry is obtained via Kepler, exported as time-series data to Prometheus (with 5s scrape), and inspected in Grafana to identify the appropriate aggregation functions and time windows used in the analysis. Since the clusters run on VMs without hardware power sensors, Kepler operates in model-based mode, estimating energy from eBPF/performance counters (e.g., cycles, cache events). Kepler reports cumulative energy (in Joules), with instantaneous power derived with PromQL:
The expression calculates the rate of change in the total energy consumed by the node(s) over a sliding window (e.g., 35s), providing the system’s instantaneous power in Watts (Joules/second) with a monotonically increasing per-node energy counter, smoothed over the defined interval. This time window is selected as it provides sufficient smoothing to filter short-lived counter fluctuations while remaining responsive enough to capture transient power changes introduced by security operations.
5. Results
In this section, we present the outcomes of the experimental evaluation. We begin by establishing an idle baseline with Kepler running and no workload present, which serves as a reference for all subsequent scenarios. We then report representative time-series results for each experiment, illustrating the system’s energy behavior throughout the execution period. Each security configuration is compared against its corresponding baseline, enabling clear visualization of relative performance differences and energy overheads.
5.1. Encryption Consumption
Figure 2 and Figure 3 summarize the energy consumption experiments for link and mesh encryption. In both panels, the blue trace is the aforementioned idle baseline and the green trace shows iperf over plain networking. Figure 2 compares idle, plain networking and WireGuard. Power rises when traffic begins, plateaus during steady state and drops. The periodic dips between plateaus occur because the iperf client is defined as a K8s job with three completions. After each completion finishes, the pod is terminated and the job is briefly deleted, so power drops; when the next completion is scheduled and the new pod spawns, traffic resumes and power rises again. A clear, persistent increase in power is observed with WireGuard relative to plain traffic, raising about 25-30 Watts in peak power consumption.
Regarding Istio, enabling sidecar-based strict mTLS results in a consistent increase in power relative to the no-mesh condition, mirroring the experimental procedure followed in the previous experiment. Figure 3 shows that the increase in energy consumption is lower than that observed with WireGuard (around 15-20 W in peak, relative to plain iperf), yet remains clearly noticeable.
5.2. Runtime Detection Consumption
Figure 4 and Figure 5 show aggregated power over time for Falco and Cilium Tetragon. The blue traces demonstrate the idle baseline as before. Enabling the event generator alone raises significantly the power consumption ( W on average), while activating the runtime monitors increases it further, reflecting the additional work of syscall/event capture and rule evaluation. The oscillations in the orange/green traces follow the driven event rate as the event generator spawns and despawns pods that trigger Falco rules and generate logs ingested by Tetragon. Falco exhibits a noticeably higher power footprint (about W on average) than the alternative configuration ( W). Overall, the figures indicate that always-on runtime monitoring imposes a persistent energy tax whose magnitude depends on the volume of emitted telemetry.
5.3. Network Security Monitoring Consumption
Figure 6 shows the difference in energy consumption between a high-rate UDP spray and the same traffic with Zeek enabled. The spray rises power to a steady plateau (orange), while enabling Zeek produces a further, persistent but modest increase (-5 W increase relative to the UDP spray without Zeek). The increment reflects the cost of packet capture and log generation. The sharp rise and fall at the edges correspond to job start/stop. Clearly, packet capture and log emission with Zeek add only a small incremental load relative to the UDP spray itself.
5.4. Energy Consumption over Realistic Workload
Figure 7 presents four time series of aggregated power for the same cluster under different conditions. Baseline is the reference trace with Online Boutique deployed. Load represents the previous configuration with load generator (Locust) enabled and scaled at 3 replicas with 400 users and 40 spawn rate. Baseline+Security illustrates idle state with Falco, Tetragon and WireGuard enabled, while Security+Load combines the aforementioned security measures with the load generator.
A key observation is that an idle cluster with security enabled (Baseline+Security) draws power close to—or even overlapping with—a cluster with load without security measures. In particular, the average power consumption of OB+Load is W peaking at W relative to OB+Baseline and OB+Security is 0.89 W and 1.47 W, respectively. This highlights the steady energy cost of always-on controls, which consume CPU and memory even when the deployed application is in idle state. With Security+Load, consumption rises further above that level ( W on average, peaking at W) indicating that the triggering of encryption and runtime monitoring presents significant energy overhead in realistic workloads.
5.5. Vulnerability Scanning Consumption
The chart in Figure 8 compares Trivy (blue) against Online Boutique deployment with security measures (orange). The blue line shows a sharp, short-lived jump in power, then drops back near baseline. The spike corresponds to the vulnerability scan window: Trivy updates its database, reads image layers and matches against CVEs. Those steps are CPU-intensive, create bursty disk I/O and network traffic.
Although each scan produces only a short-lived but significant increase in power draw (W), these spikes will recur periodically with Trivy Operator as part of routine cluster hardening. In practice, the energy impact becomes a sequence of brief bursts rather than a continuous overhead. The behavior can be shaped—but not eliminated—by tuning scan frequency and scoping (e.g., limiting scans to selected namespaces and workloads).
5.6. Overall Consumption
The bar chart illustrated in Figure 9 summarizes mean aggregated power across multiple configurations. Error bars show variability between the minimum and maximum values of measured power. Baseline sits lowest ( W). Adding a service mesh or full-tunnel encryption raises power the most: Istio and WireGuard have the highest means ( W and W) and widest variability. Host-level eBPF sensors are comparatively light: Falco and Tetragon show small, steady upticks over baseline, with average power ranging at W and W, respectively. Network monitoring is also light as the UDP spray increases significantly the power consumption but with Zeek enabled the mean power does not raise substantially ( W without Zeek and W with Zeek). Trivy has a higher mean ( W) with large error bars, consistent with short, compute-intensive scan windows that spike power. For the realistic workload, Online Boutique baseline with security ( W) seems to approach OB+Load without security that reaches an average of W, illustrating that safeguards carry a steady energy tax.
Table 3 summarizes the six power metrics used in our experimental evaluation. In particular, the "Baseline" corresponds to the cluster’s mean idle draw, while the Experimental Baseline denotes the mean power of the same workload running without the security mechanism under test (e.g., iperf without WireGuard or Istio; Event Generator without Falco or Tetragon). The next two columns report the differences between the mean and peak values observed in Figure 9 and the cluster’s baseline, capturing the absolute uplift over an idle system. The final two columns provide the mechanism’s mean and peak power minus the experimental baseline, isolating the overhead introduced solely by the security component.
Results show that link encryption (WireGuard) introduces the largest overhead, adding approximately W mean and W peak over idle baseline (or W mean compared to plain iperf), while Istio with mTLS is second most demanding mechanism, contributing W mean over idle and W marginal overhead relative to the unencrypted workload. Runtime monitors impose comparatively small costs under repeated security events as Falco + EG add W, while Tetragon + EG add W. For network monitoring, Zeek introduces a modest W marginal overhead, even though the high-rate UDP spray itself increases power consumption by W on average. Vulnerability scanning with Trivy was executed atop the Online Boutique deployment with all security mechanisms enabled; thus, the experimental baseline corresponds to the full OB + Security configuration. Under these conditions, Trivy adds W mean and peaks at W. Finally, in the realistic application scenario, enabling security mechanisms during idle traffic results in a small steady marginal overhead of W, peaking at W, while under heavy workload the overhead increases to W mean and W peak.
6. Conclusion and Future Work
In this study, we analyzed the trade-offs between security and energy consumption in K8s-based environments, providing quantitative insights into how common cloud-native safeguards affect power consumption—insights that are pertinent to IoT and smart city deployments. Our results show that always-on mechanisms introduce a steady power draw that can bring an idle, secured cluster close to the consumption of a loaded, unsecured one. Under realistic microservice traffic, the incremental overhead of security under load remained additive and stable, whereas vulnerability scanning produced short but significant spikes in power. Service mesh and full-tunnel encryption contributed the largest sustained overheads; host-level eBPF was comparatively modest; network security monitoring also introduced modest costs. Overall, the results indicate that careful selection and tuning of safeguards can maintain strong protection while keeping energy impact manageable. Future work will broaden the evaluation to a wider spectrum of security tools, more diverse workloads and larger cluster scales. In addition, experiments conducted on bare-metal infrastructures will allow access to hardware power counters, enabling more accurate attribution of energy consumption. Finally, we will design and evaluate AI-enabled energy-aware adaptive security mechanisms that dynamically tune safeguards in response to workload and power signals, preserving security while respecting energy budgets—especially on edge/IoT nodes.
Author Contributions
Conceptualization, I.D. and V.T.; methodology, I.D. and G.K; software, I.D.; validation, I.D., G.K. and V.T.; formal analysis, I.D.; investigation, I.D.; resources, I.D. and G.K.; data curation, G.K.; writing—original draft preparation, I.D.; writing—review and editing, I.D., G.K. and V.T.; visualization, I.D.; supervision, V.T. All authors have read and agreed to the published version of the manuscript.
Institutional Review Board Statement
Not applicable.
Informed Consent Statement
Not applicable.
Data Availability Statement
Not applicable.
Conflicts of Interest
The authors declare no conflicts of interest.
| 1 | |
| 2 | |
| 3 | |
| 4 | |
| 5 | |
| 6 | |
| 7 | |
| 8 | |
| 9 | |
| 10 | |
| 11 | |
| 12 | |
| 13 | |
| 14 | |
| 15 | |
| 16 |
References
- European Commission. Commission Recommendation (EU) 2024/2143 of 29 July 2024 setting out guidelines for the interpretation of Article 3 of Directive (EU) 2023/1791 of the European Parliament and of the Council as regards the energy efficiency first principle. https://eur-lex.europa.eu/eli/reco/2024/2143/oj/eng, 2024. Notified under document C(2024) 5284. Official Journal of the European Union, L series, 9 August 2024.
- Mao, Y.; Yu, X.; Huang, K.; Zhang, Y.J.A.; Zhang, J. Green edge AI: A contemporary survey. Proceedings of the IEEE 2024.
- Almihat, M.G.M.; Kahn, M.T.E.; Aboalez, K.; Almaktoof, A.M. Energy and Sustainable Development in Smart Cities: An Overview. Smart Cities 2022, 5, 1389–1408. [CrossRef]
- Szpilko, D.; Fernando, X.; Nica, E.; Budna, K.; Rzepka, A.; Lăzăroiu, G. Energy in Smart Cities: Technological Trends and Prospects. Energies 2024, 17. [CrossRef]
- Snousi, H.M. Adaptive fog computing architecture for scalable smart city infrastructure. In Proceedings of the ECCSUBMIT Conferences, 2025, Vol. 3, pp. 52–60.
- Aslanpour, M.S.; Toosi, A.N.; Cheema, M.A.; Chhetri, M.B. FaasHouse: sustainable serverless edge computing through energy-aware resource scheduling. IEEE Transactions on Services Computing 2024, 17, 1533–1547.
- Rana, M.; Mamun, Q.; Islam, R. Balancing Security and Efficiency: A Power Consumption Analysis of a Lightweight Block Cipher. Electronics 2024, 13. [CrossRef]
- Donenfeld, J.A. WireGuard: Next Generation Kernel Network Tunnel. In Proceedings of the NDSS, 2017, pp. 1–12.
- Center for Internet Security. CIS Kubernetes Benchmark v1.11.1. Center for Internet Security, 2025. Available at https://www.cisecurity.org/benchmark/kubernetes.
- National Security Agency (NSA) and Cybersecurity and Infrastructure Security Agency (CISA), 2022.
- Fahad, M.; Shahid, A.; Manumachu, R.R.; Lastovetsky, A. A Comparative Study of Methods for Measurement of Energy of Computing. Energies 2019, 12. [CrossRef]
- Amaral, M.; Chen, H.; Chiba, T.; Nakazawa, R.; Choochotkaew, S.; Lee, E.K.; Eilam, T. Kepler: A Framework to Calculate the Energy Consumption of Containerized Applications. In Proceedings of the 2023 IEEE 16th International Conference on Cloud Computing (CLOUD). IEEE, 2023. [CrossRef]
- Centofanti, C.; Santos, J.; Gudepu, V.; Kondepu, K. Impact of power consumption in containerized clouds: A comprehensive analysis of open-source power measurement tools. Computer Networks 2024, 245, 110371. [CrossRef]
- Pijnacker, B.; Setz, B.; Andrikopoulos, V. Container-level Energy Observability in Kubernetes Clusters. arXiv preprint arXiv:2504.10702 2025.
- Werner, S.; Borges, M.C.; Wolf, K.; Tai, S. A Comprehensive Experimentation Framework for Energy-Efficient Design of Cloud-Native Applications. In Proceedings of the 2025 IEEE 22nd International Conference on Software Architecture (ICSA). IEEE, 2025, pp. 176–186.
- Kaur, K.; Garg, S.; Kaddoum, G.; Ahmed, S.H.; Atiquzzaman, M. KEIDS: Kubernetes-based energy and interference driven scheduler for industrial IoT in edge-cloud ecosystem. IEEE Internet of Things Journal 2019, 7, 4228–4237.
- Rao, W.; Li, H. Energy-aware Scheduling Algorithm for Microservices in Kubernetes Clouds. Journal of Grid Computing 2025, 23, 2.
- Beena, B.; Ranga, P.C.; Holimath, V.; Sridhar, S.; Kamble, S.S.; Shendre, S.P.; Priya, M.Y. Adaptive Energy Optimization in Cloud Computing Through Containerization. IEEE Access 2025.
- Ali, D.; Sofia, R.C. Experimenting with Energy-Awareness in Edge-Cloud Containerized Application Orchestration, 2025, [arXiv:cs.NI/2511.09116].
- Koukis, G.; Skaperas, S.; Kapetanidou, I.A.; Mamatas, L.; Tsaoussidis, V. Evaluating CNI Plugins Features & Tradeoffs for Edge Cloud Applications. In Proceedings of the 2024 IEEE Symposium on Computers and Communications (ISCC), 2024, pp. 1–6. [CrossRef]
- Kapetanidou, I.A.; Nizamis, A.; Votis, K. An evaluation of commonly used Kubernetes security scanning tools. In Proceedings of the 2025 2nd International Workshop on MetaOS for the Cloud-Edge-IoT Continuum, 2025, pp. 20–25.
- Viktorsson, W.; Klein, C.; Tordsson, J. Security-performance trade-offs of kubernetes container runtimes. In Proceedings of the 2020 28th International symposium on modeling, analysis, and simulation of computer and telecommunication systems (MASCOTS). IEEE, 2020, pp. 1–4.
- Koukis, G.; Skaperas, S.; Kapetanidou, I.A.; Tsaoussidis, V.; Mamatas, L. An Open-Source Experimentation Framework for the Edge Cloud Continuum. In Proceedings of the IEEE INFOCOM 2024 - IEEE Conference on Computer Communications Workshops (INFOCOM WKSHPS), 2024, pp. 01–07. [CrossRef]
Figure 1.
Experimentation Methodology
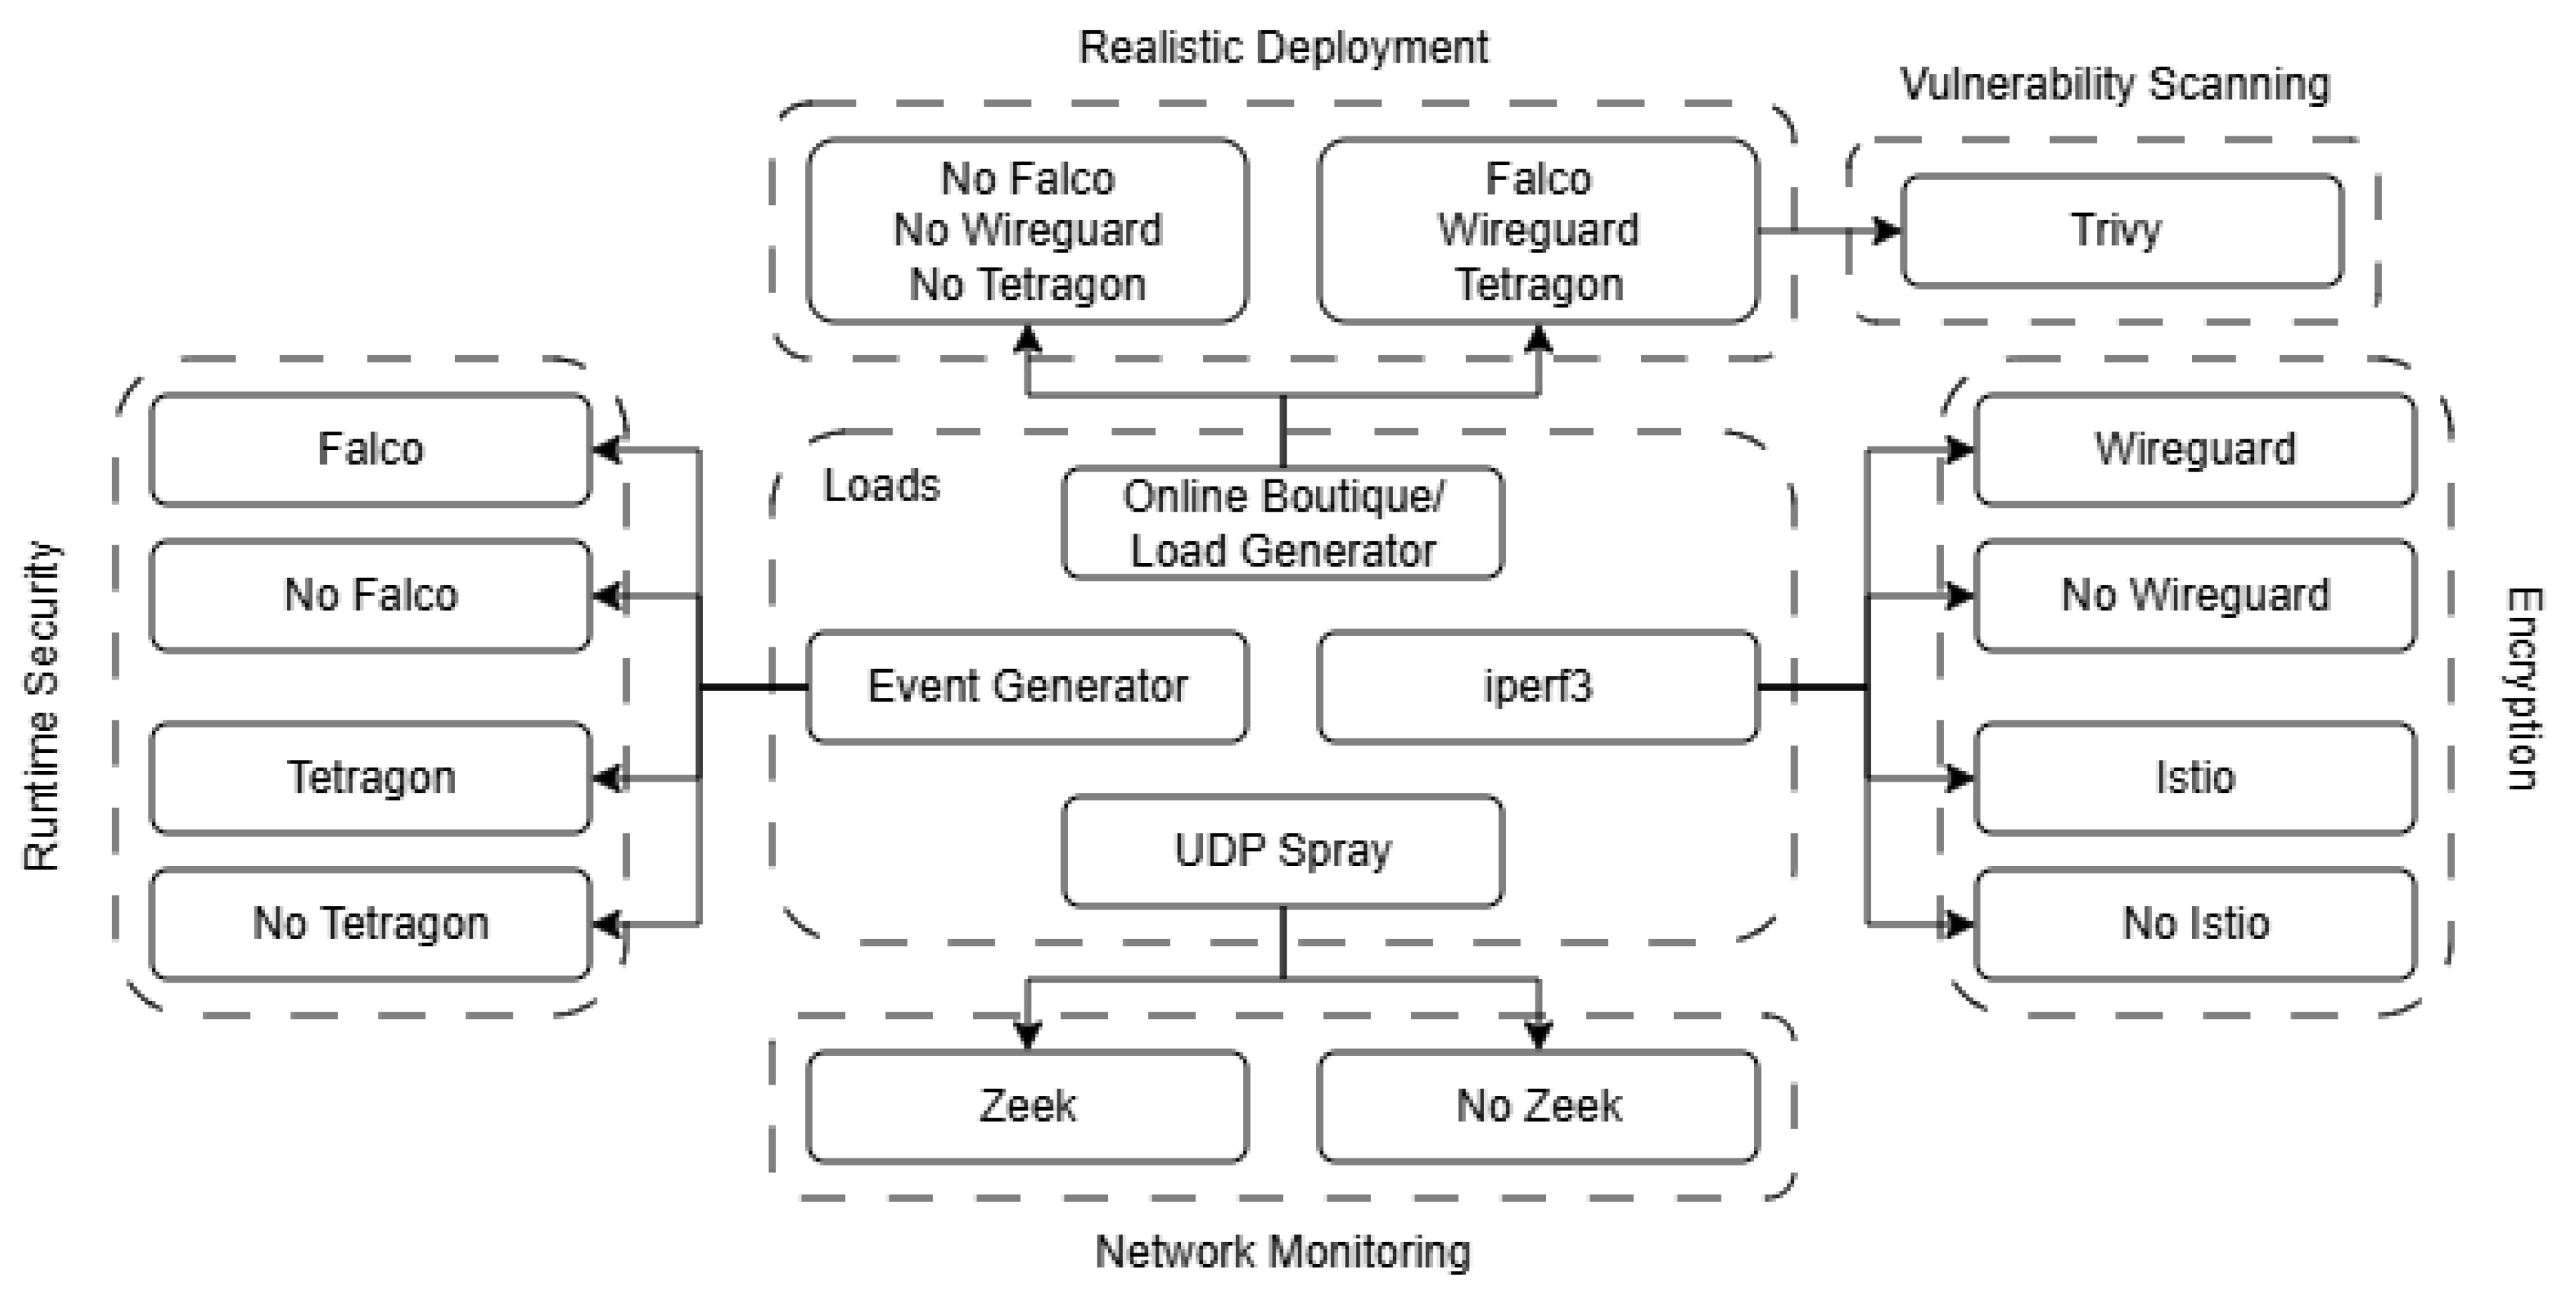
Figure 2.
WireGuard Power Consumption
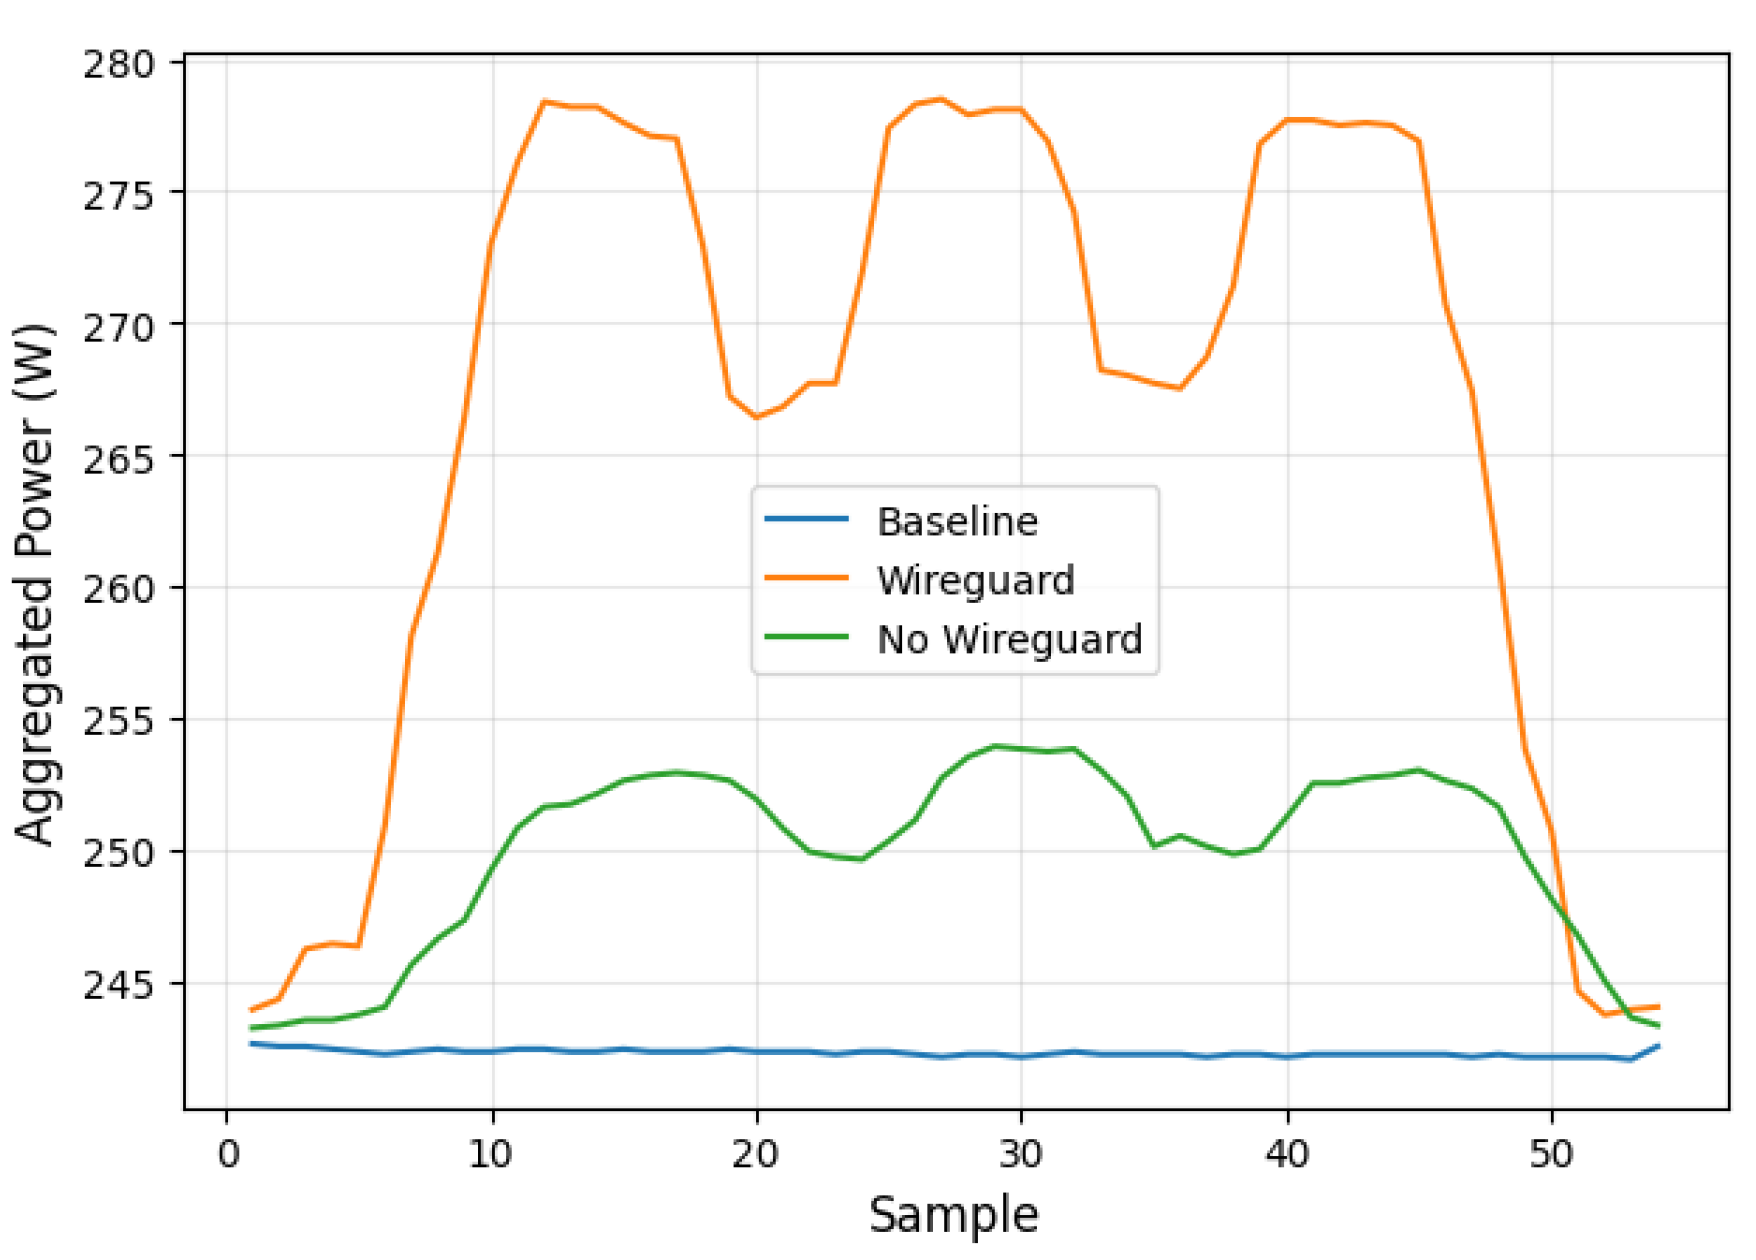
Figure 3.
Istio Power Consumption
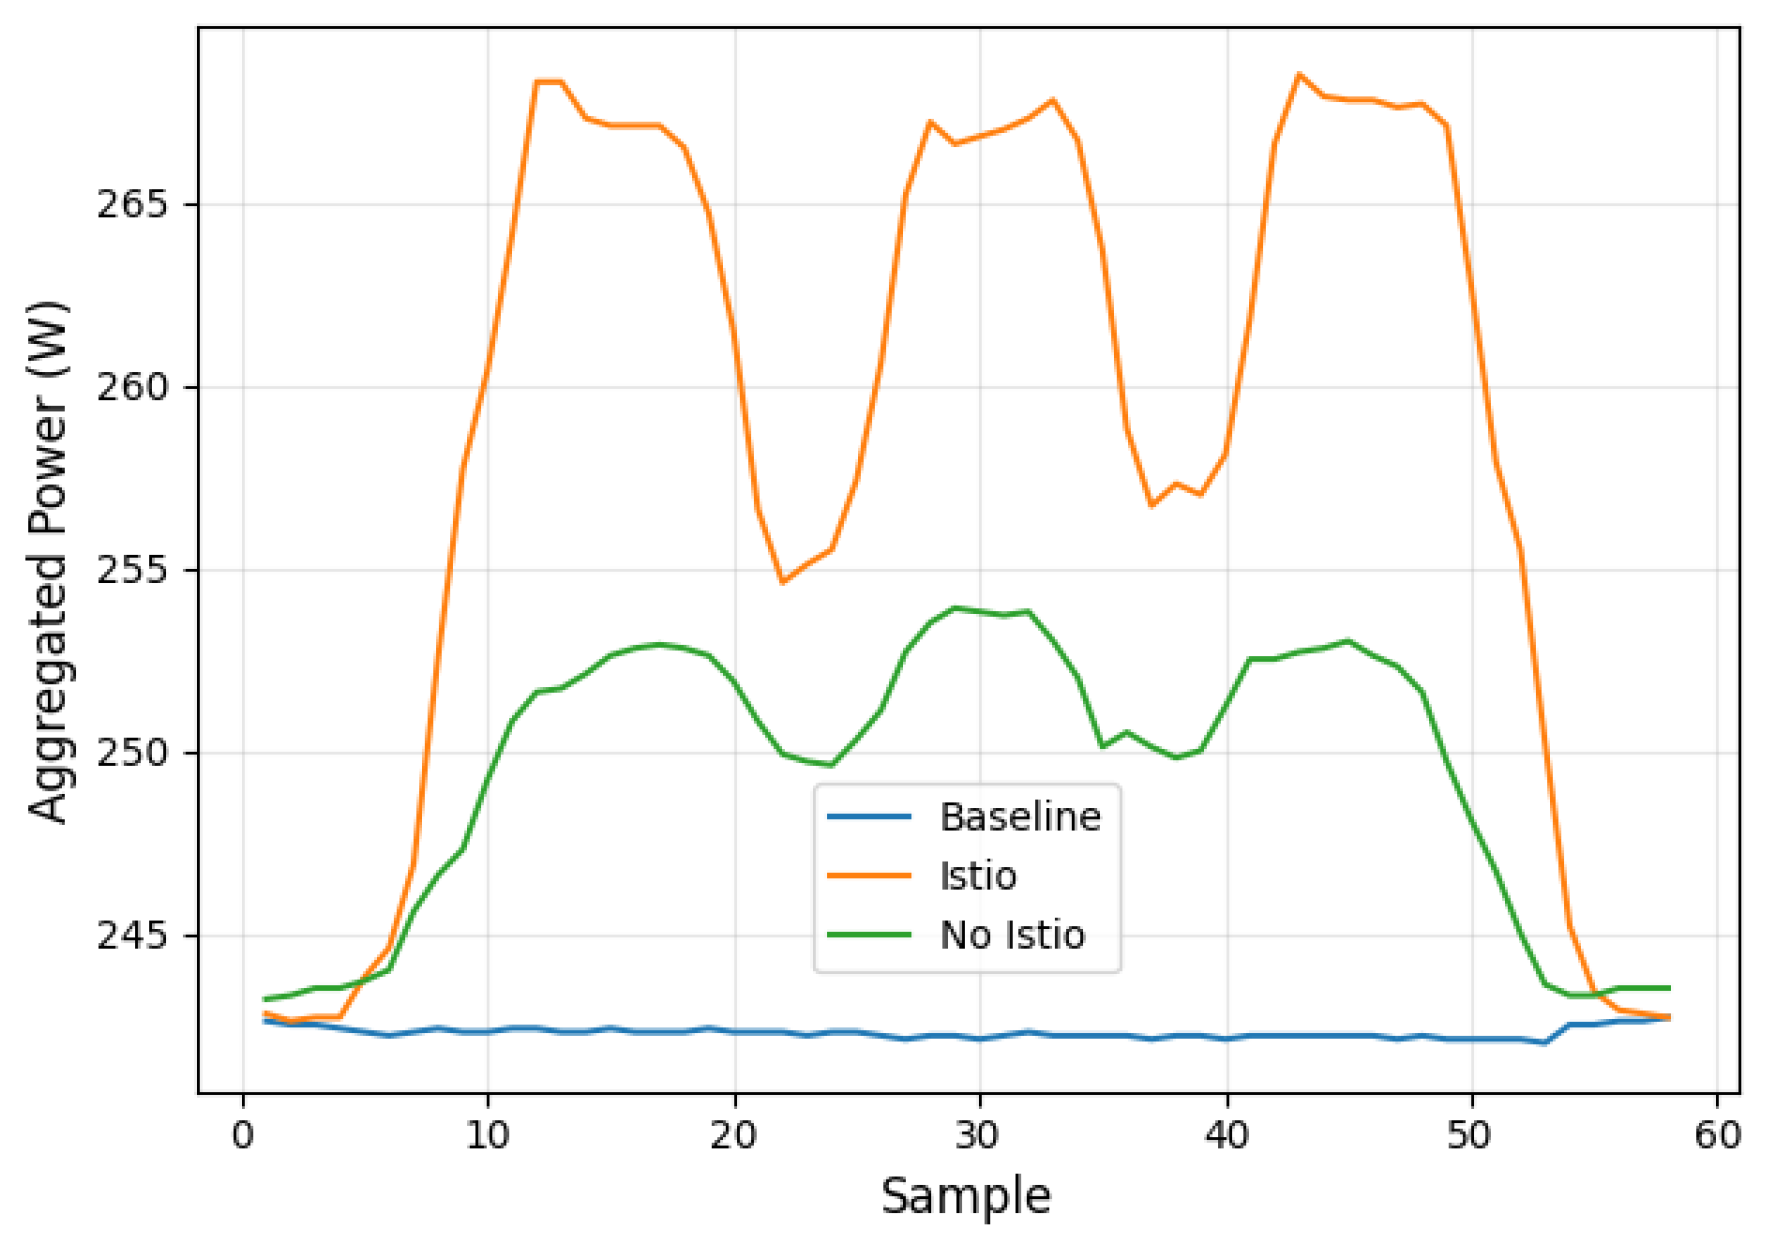
Figure 4.
Falco Power Consumption
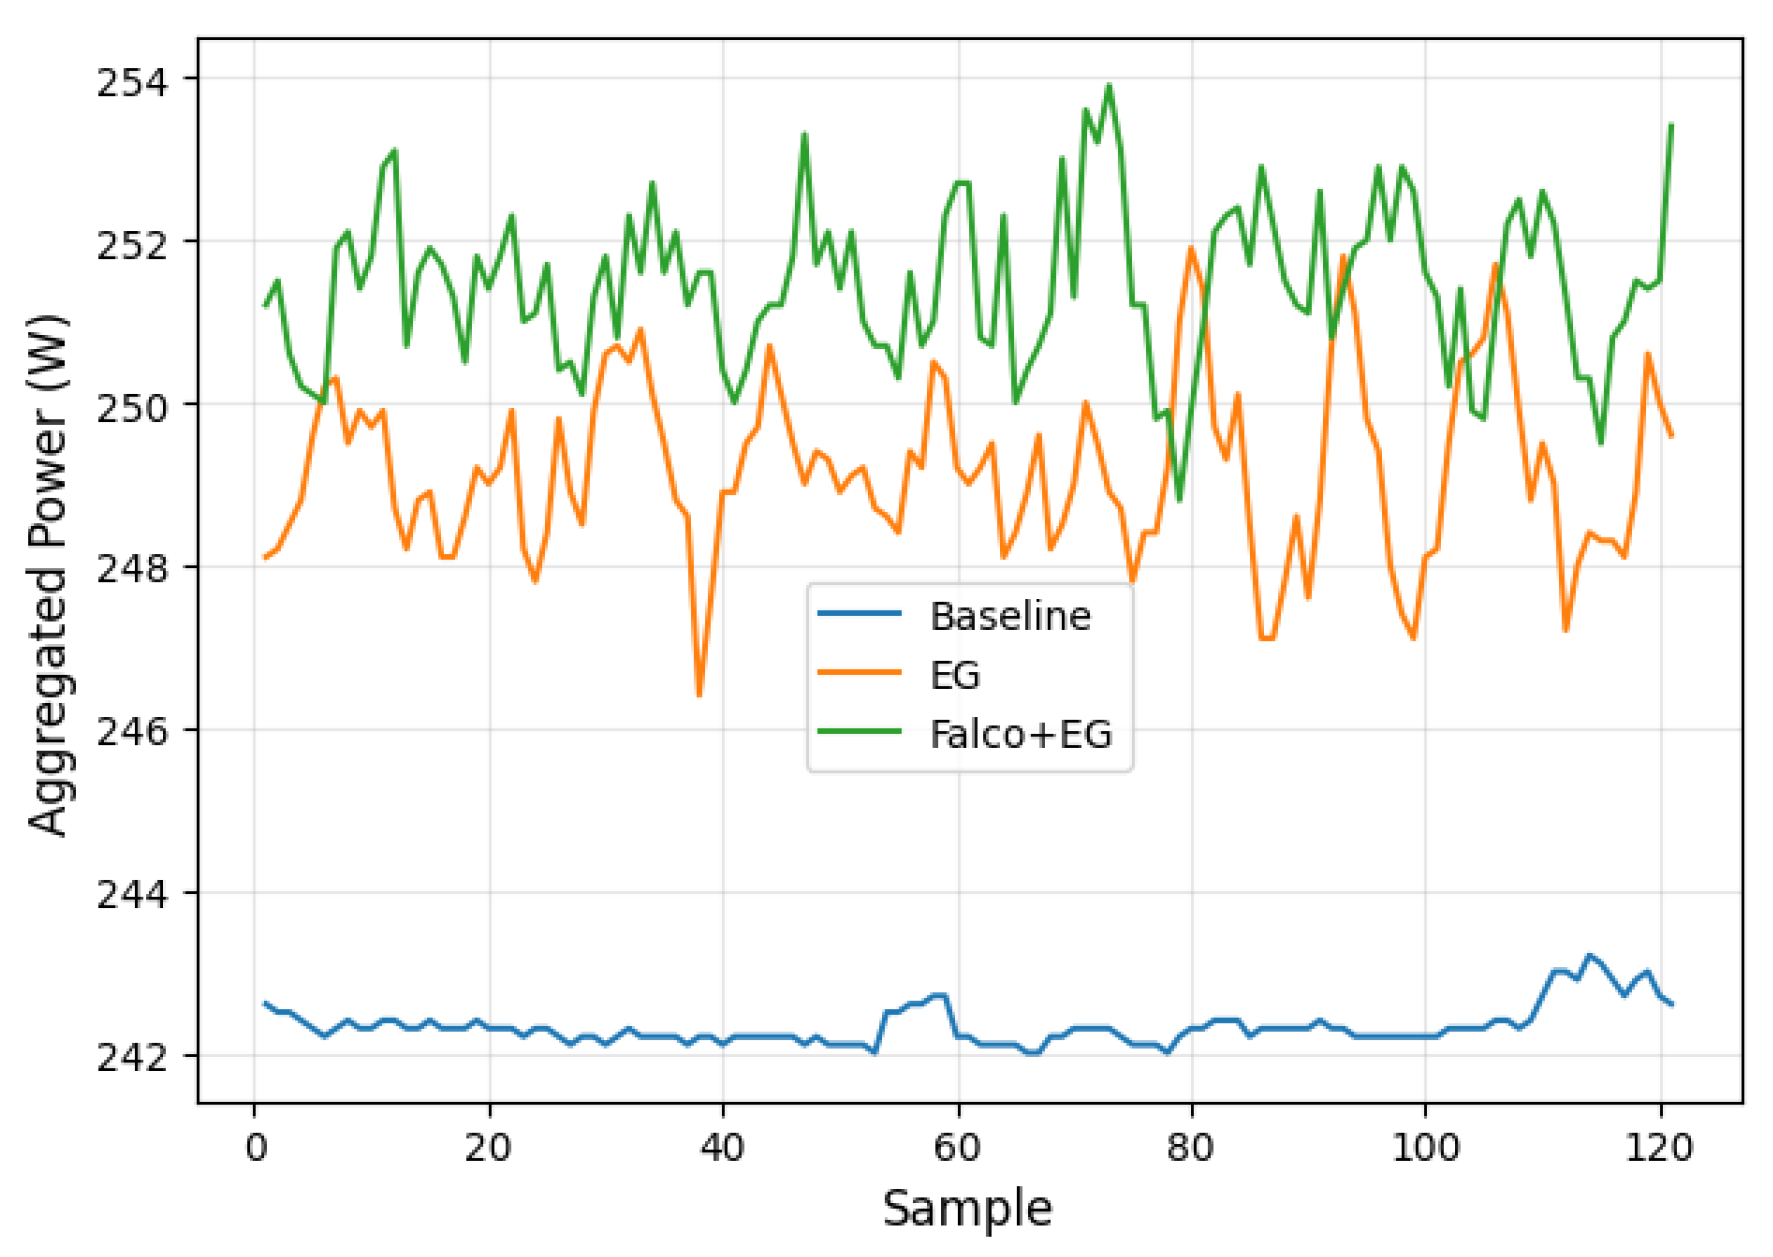
Figure 5.
Tetragon Power Consumption
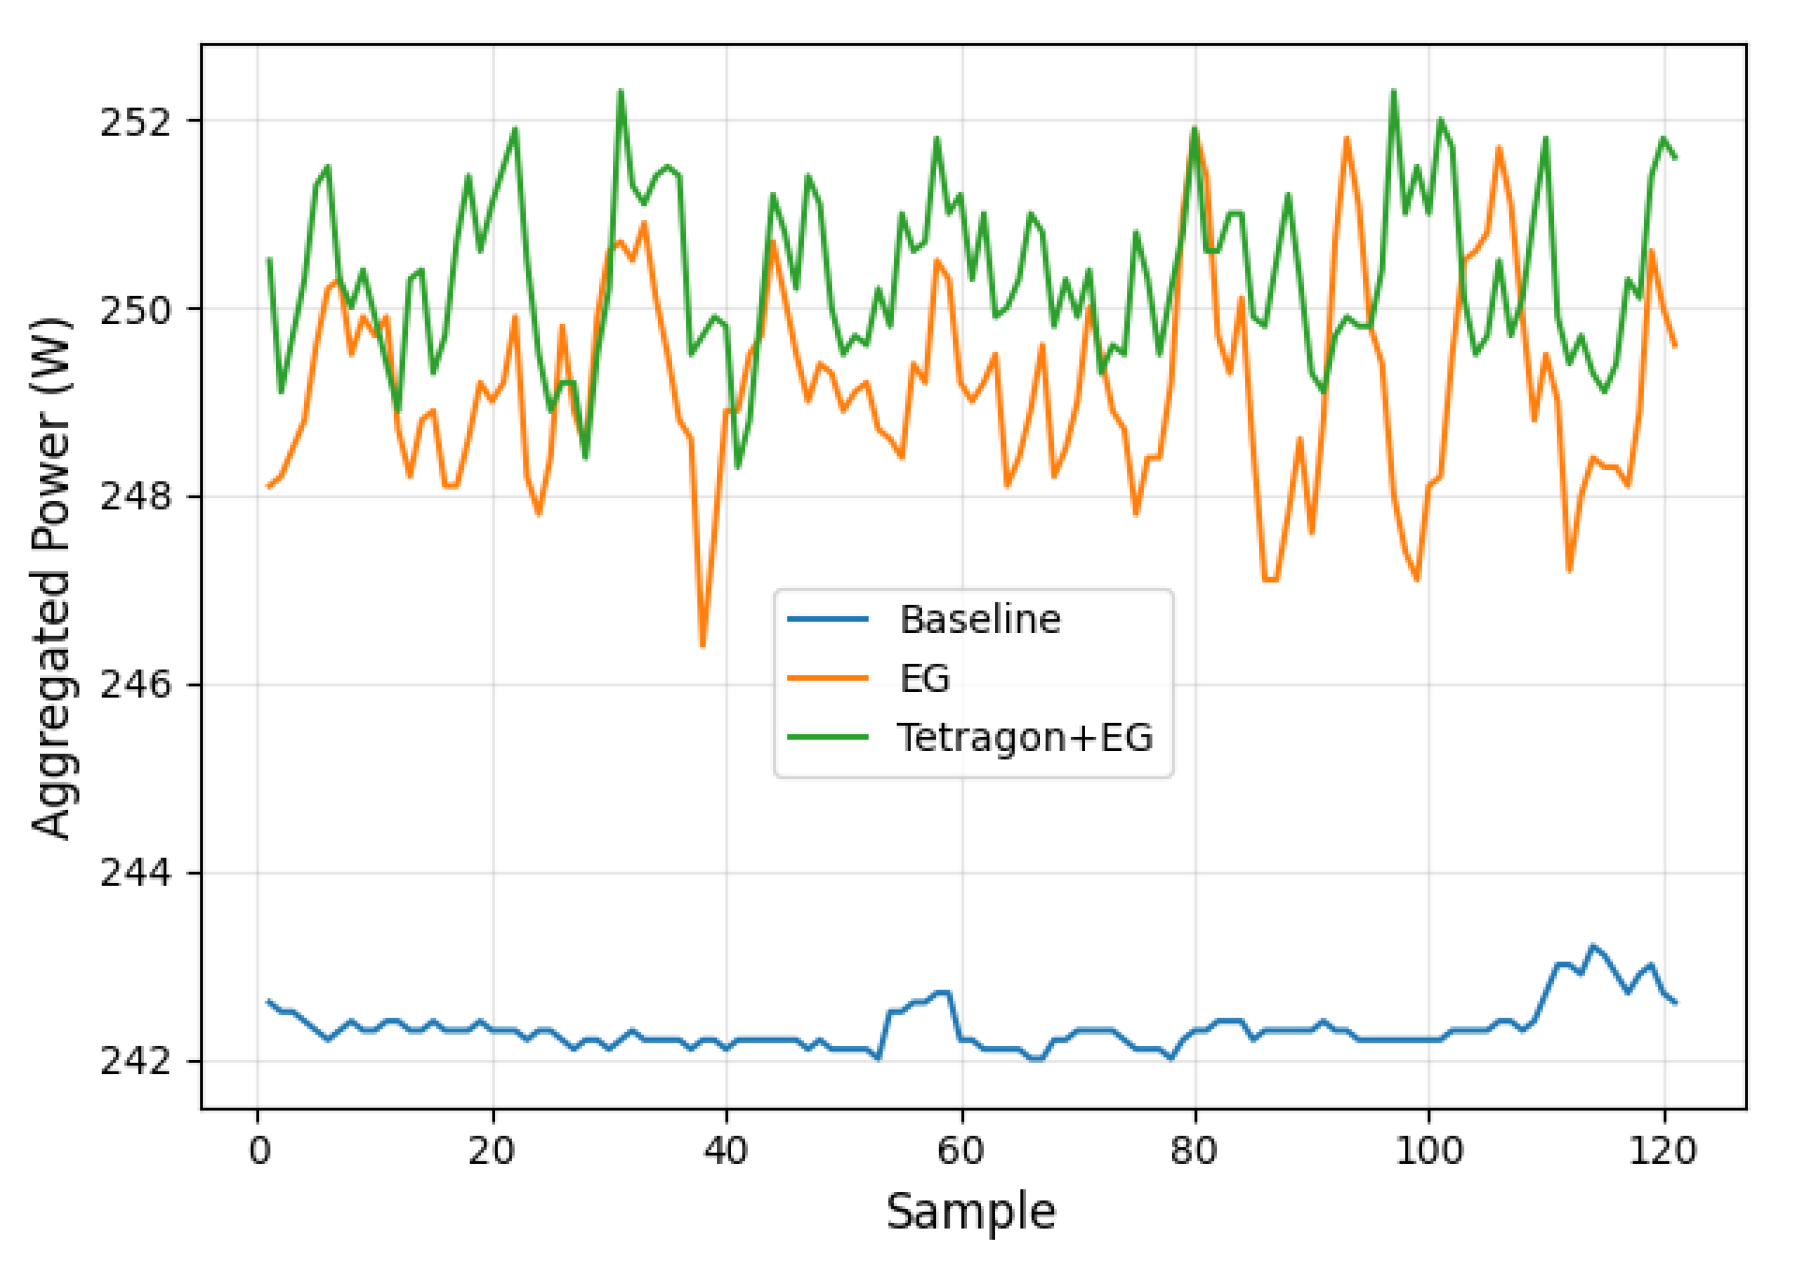
Figure 6.
Zeek Power Consumption
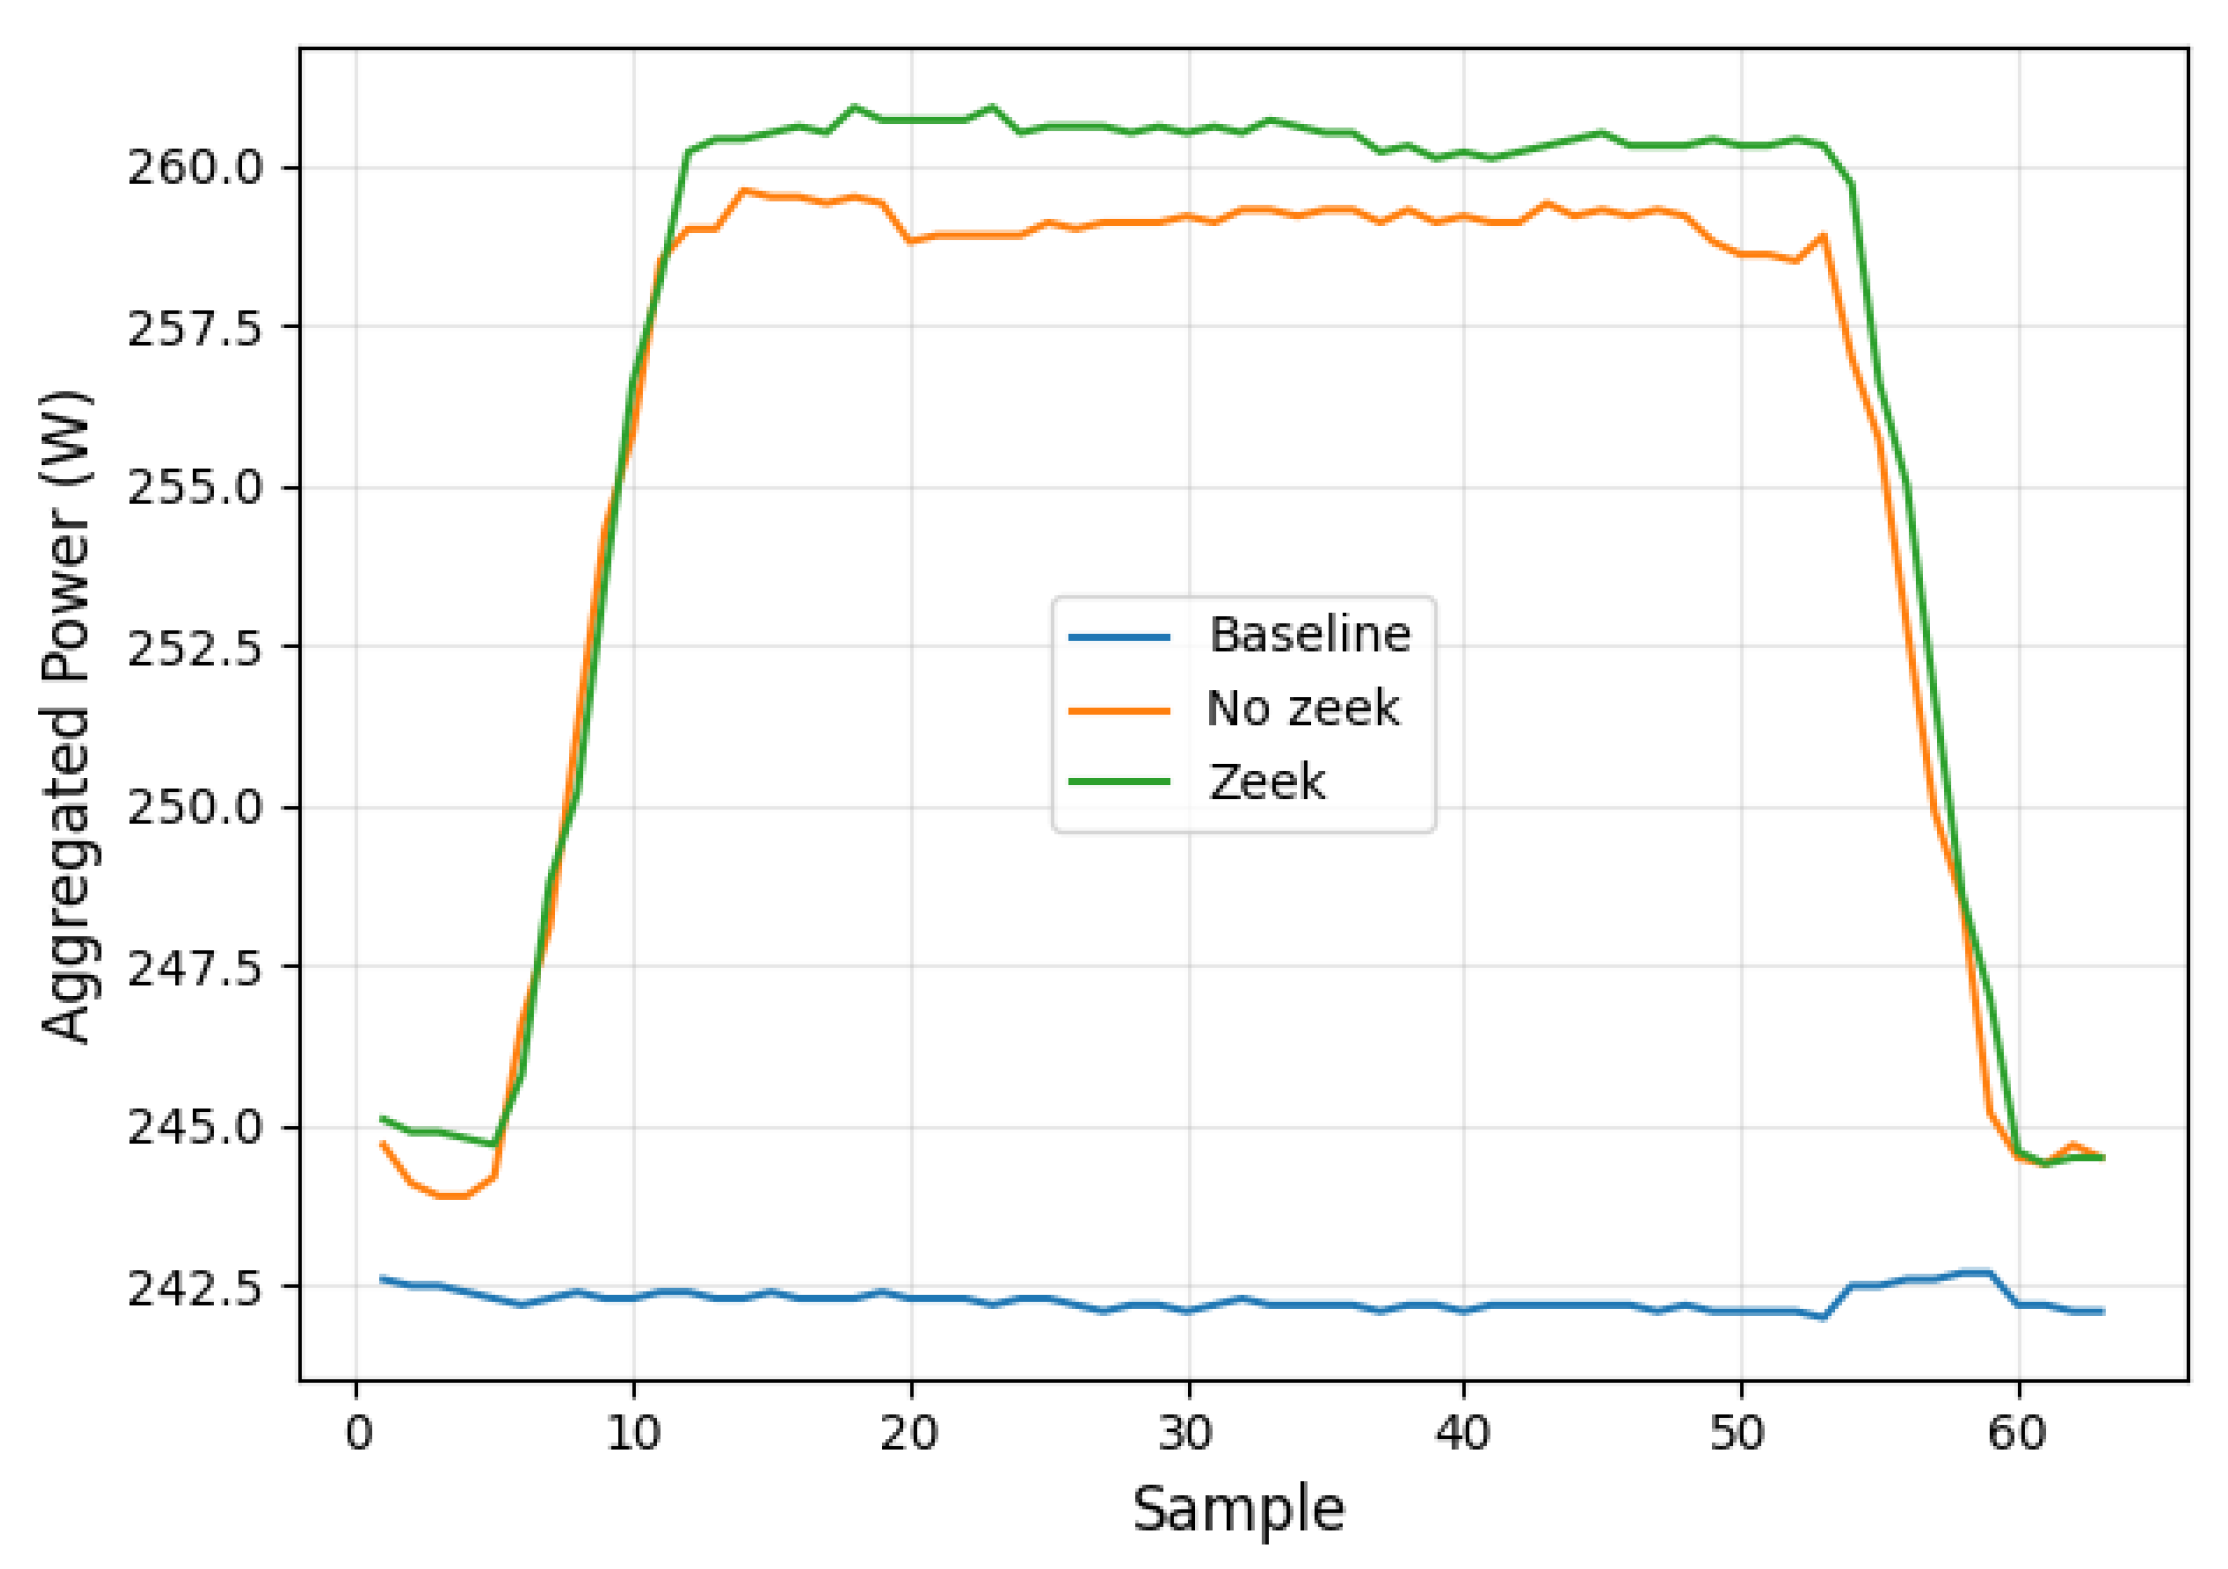
Figure 7.
Power Consumption over Realistic Workload and Security Measures
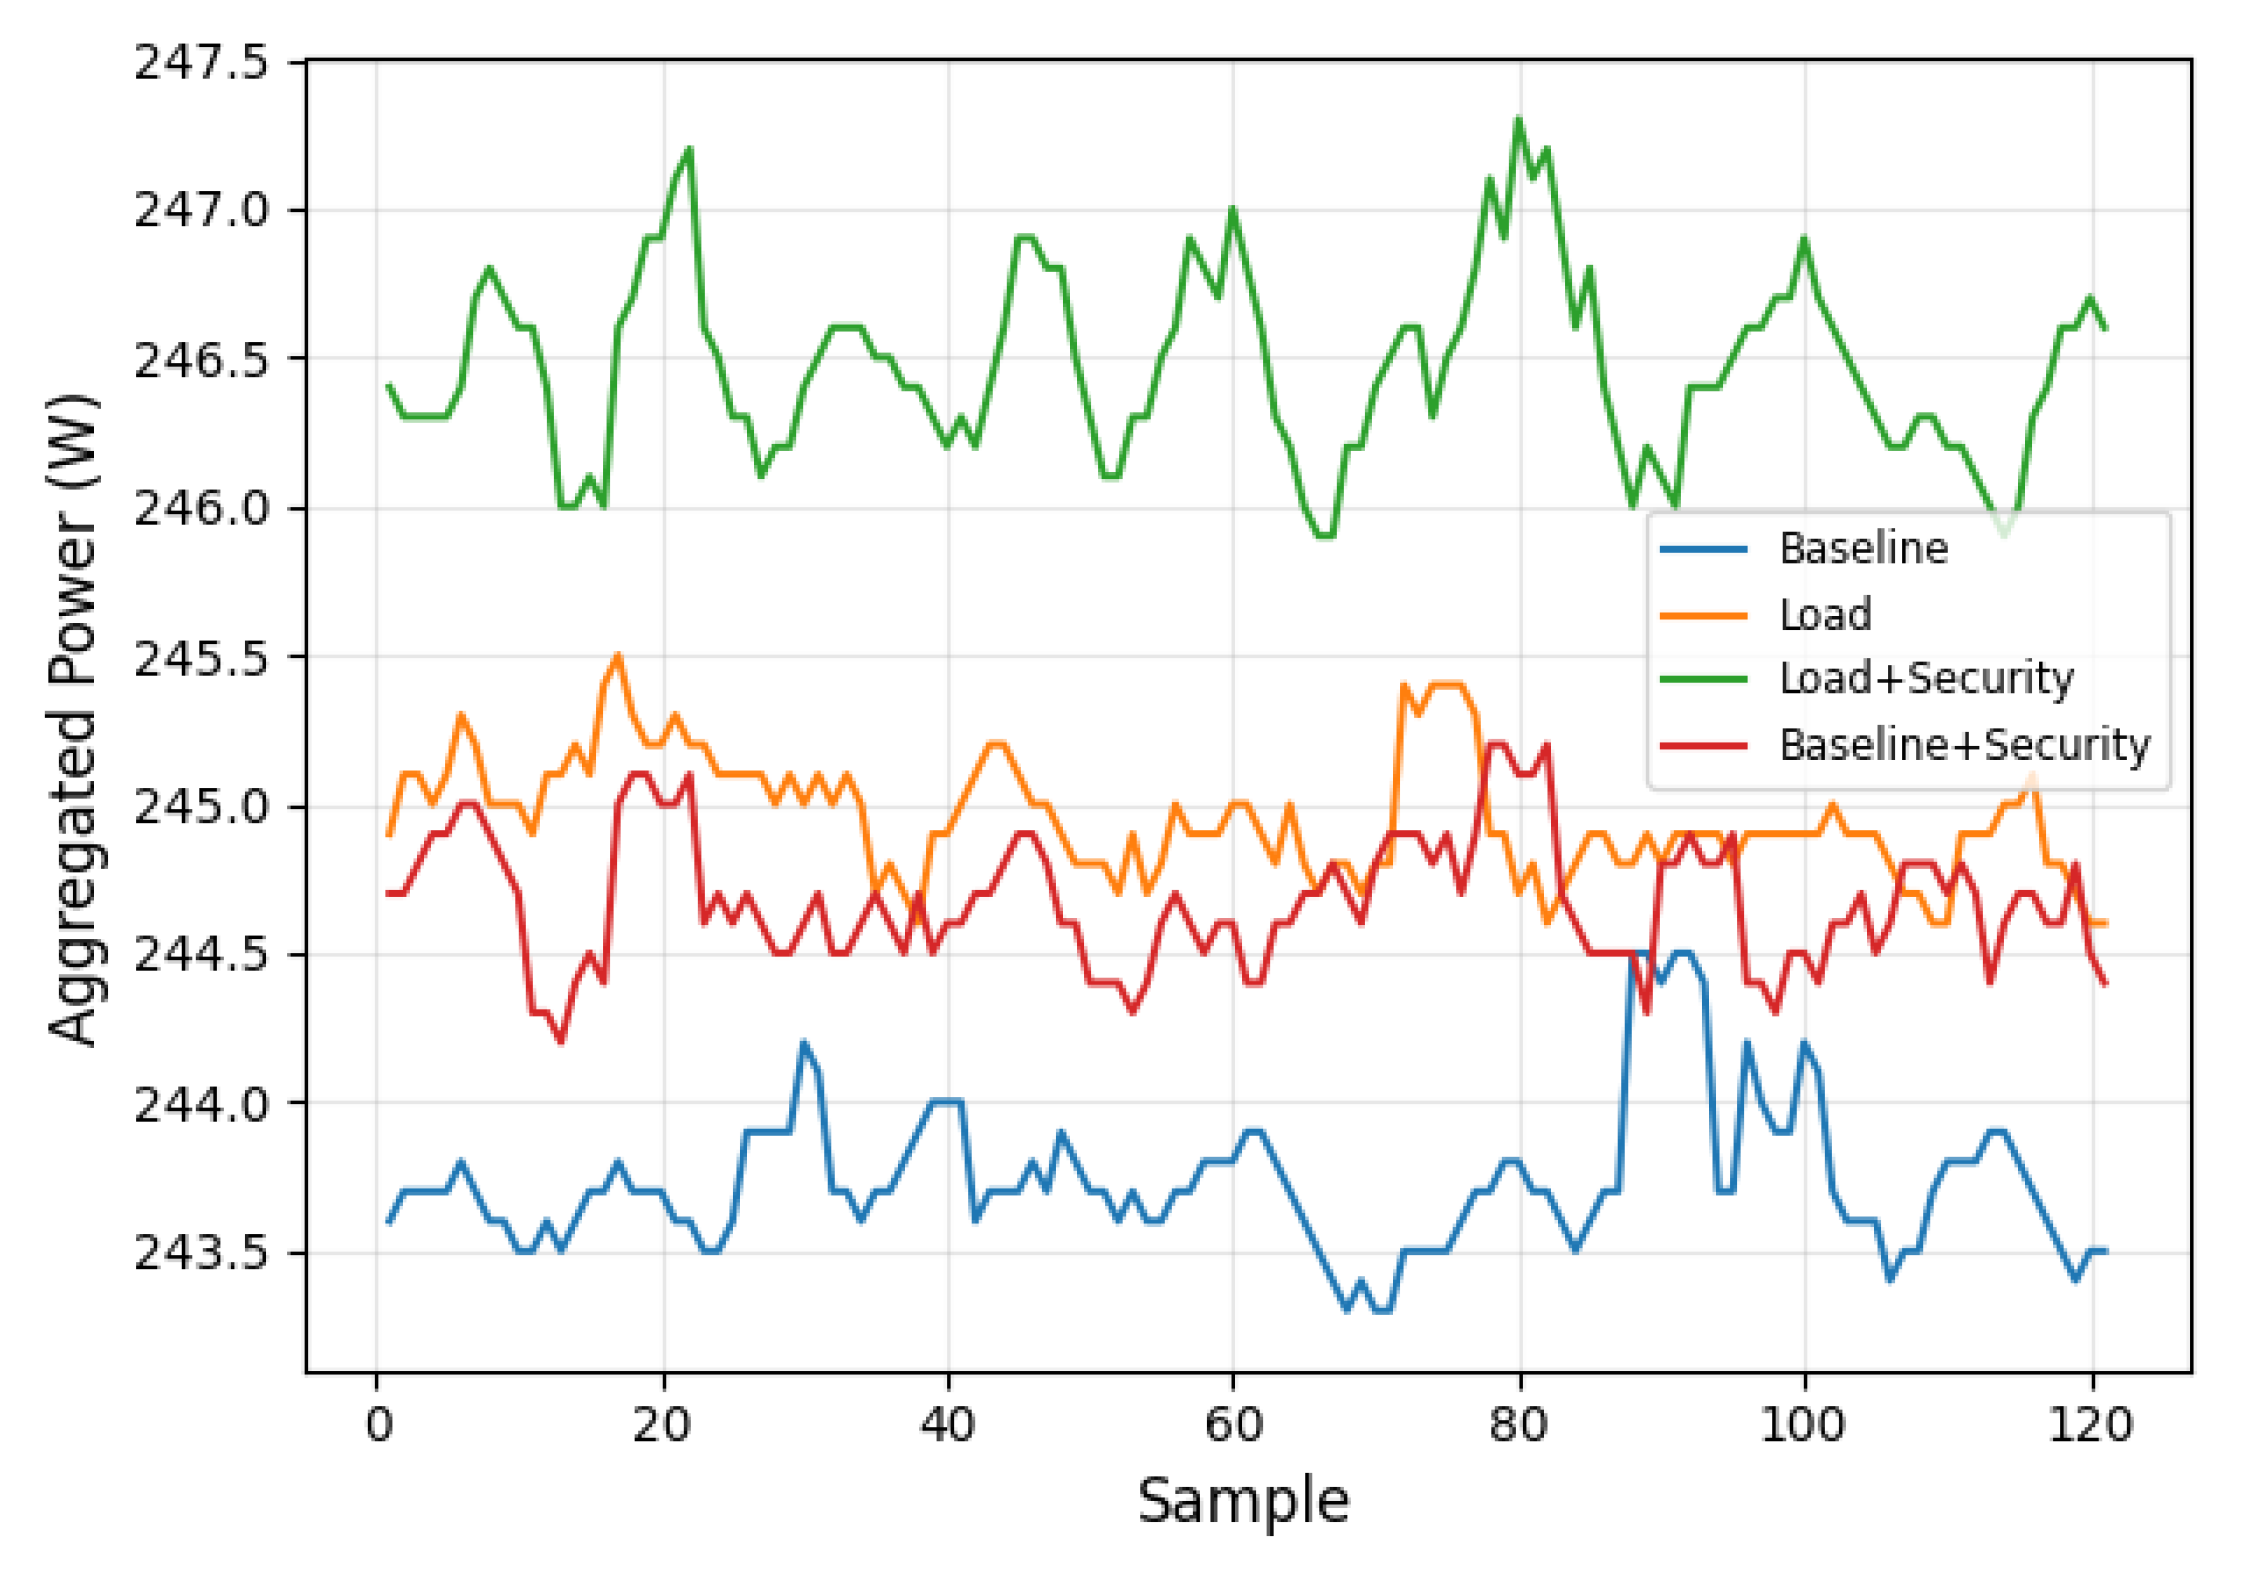
Figure 8.
Trivy Power Consumption
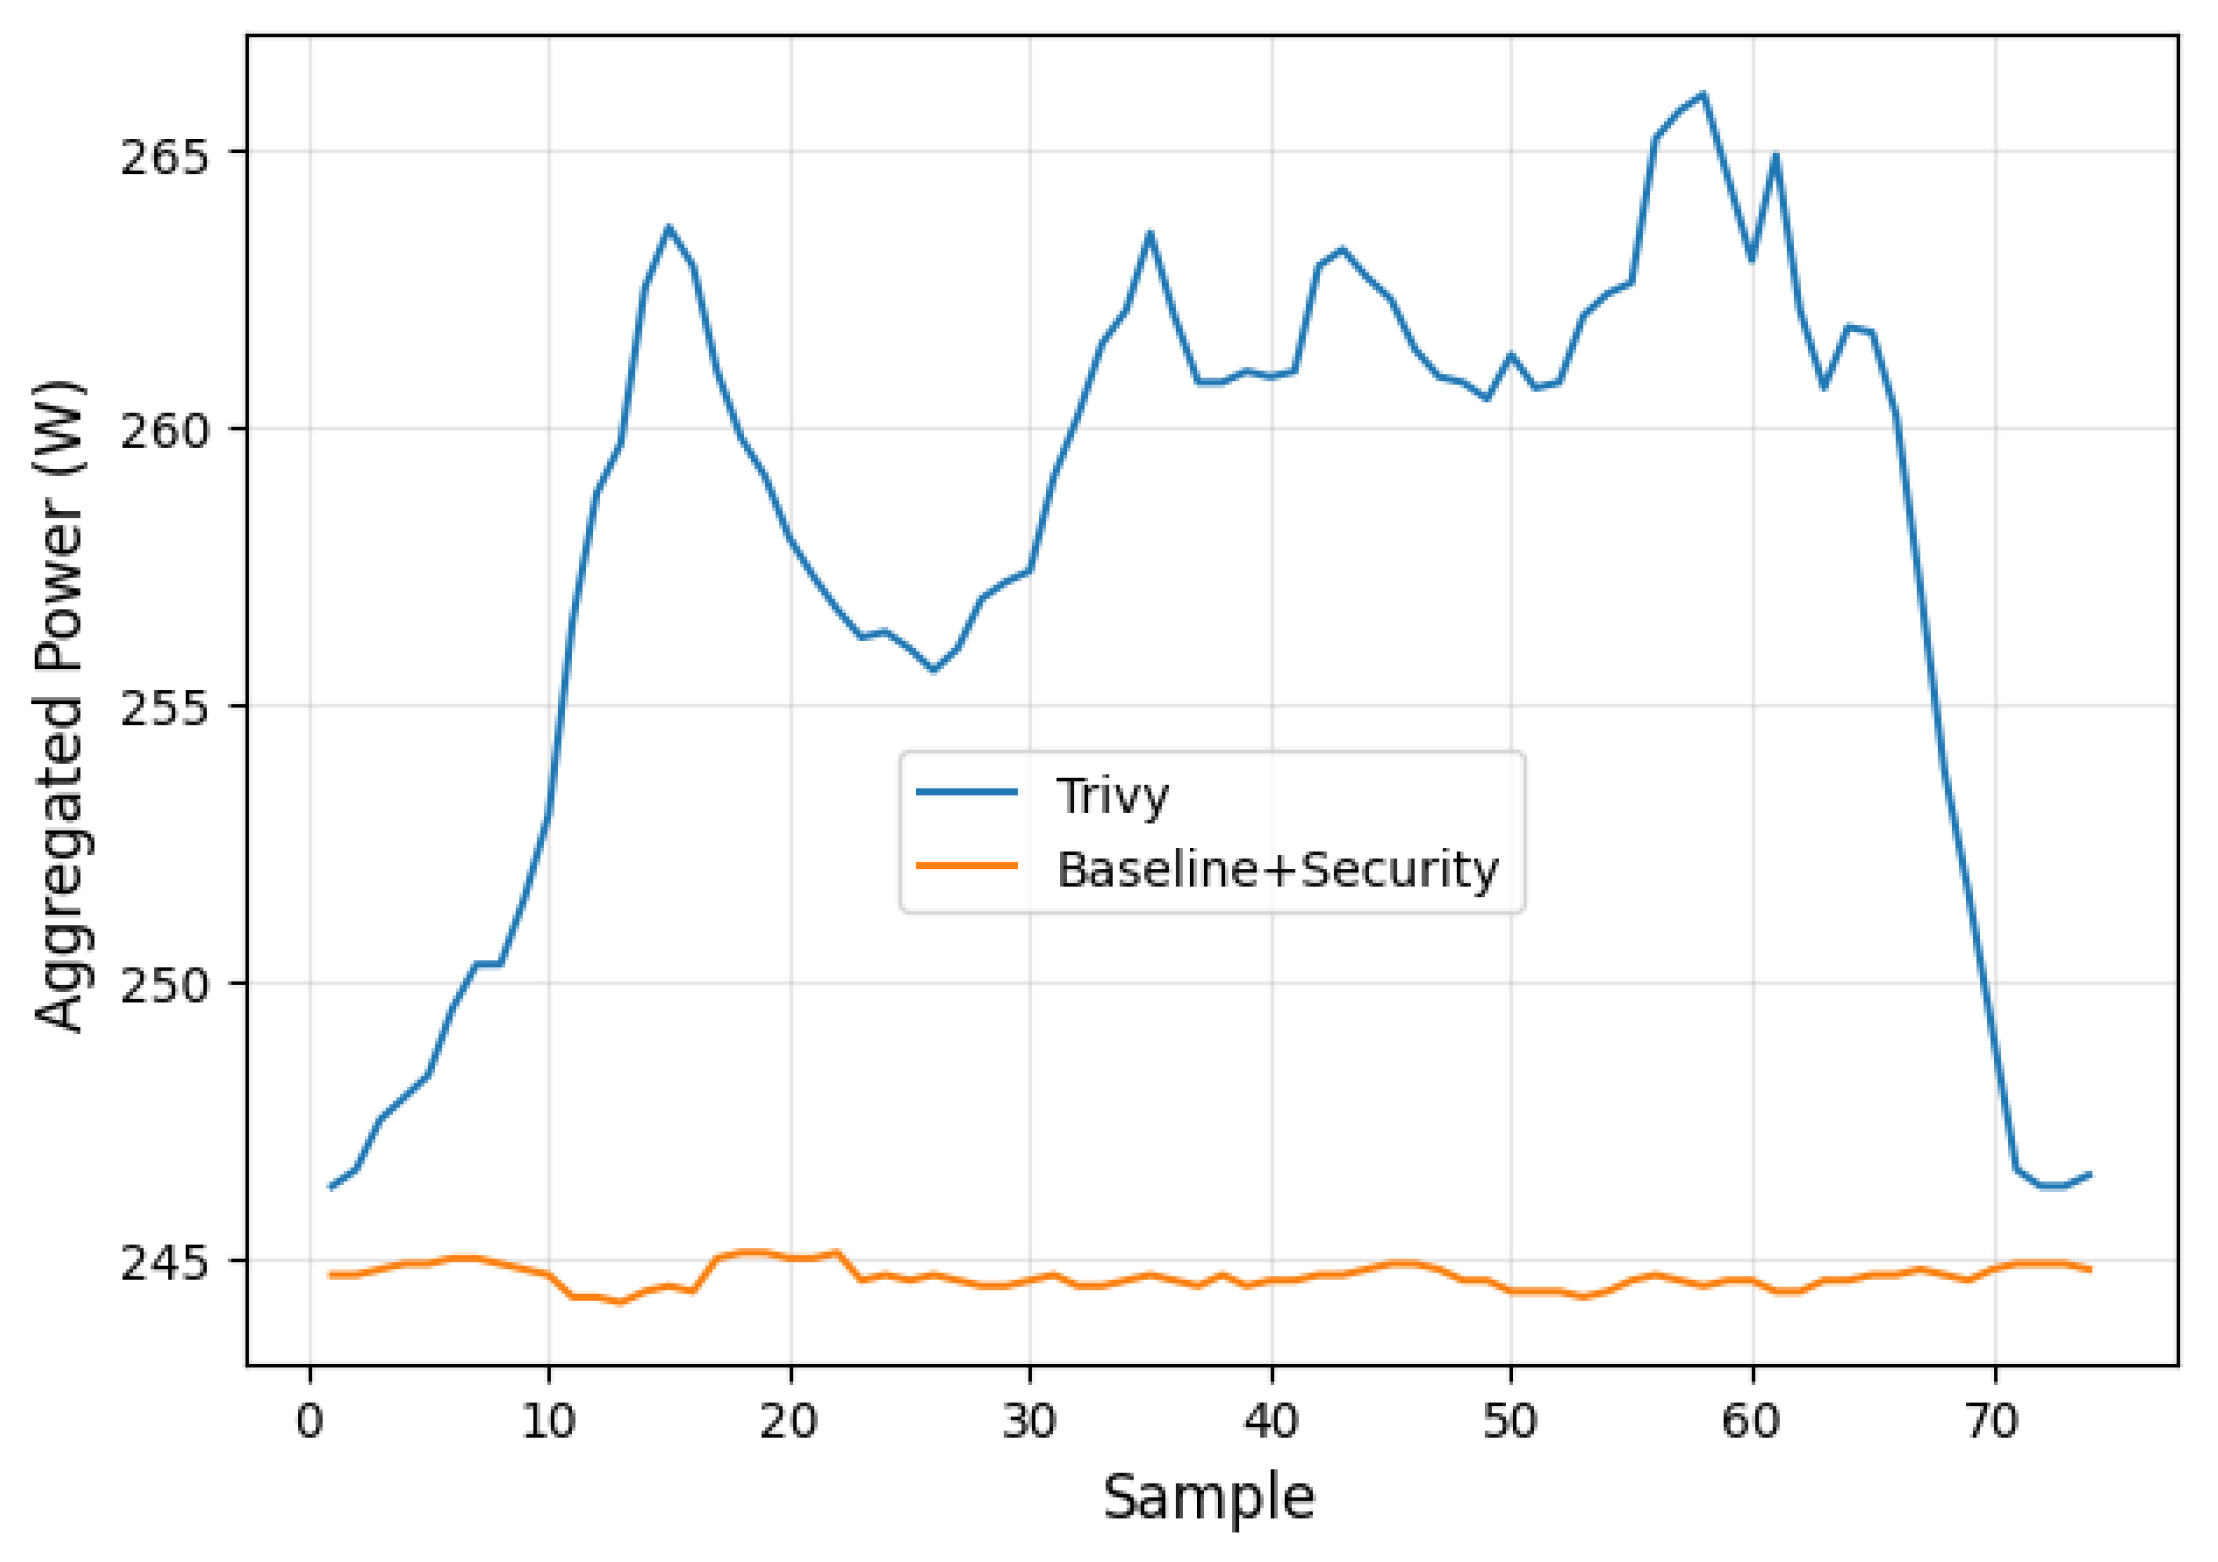
Figure 9.
Mean Aggregated Power for each experimentation scenario with minimum and maximum values.
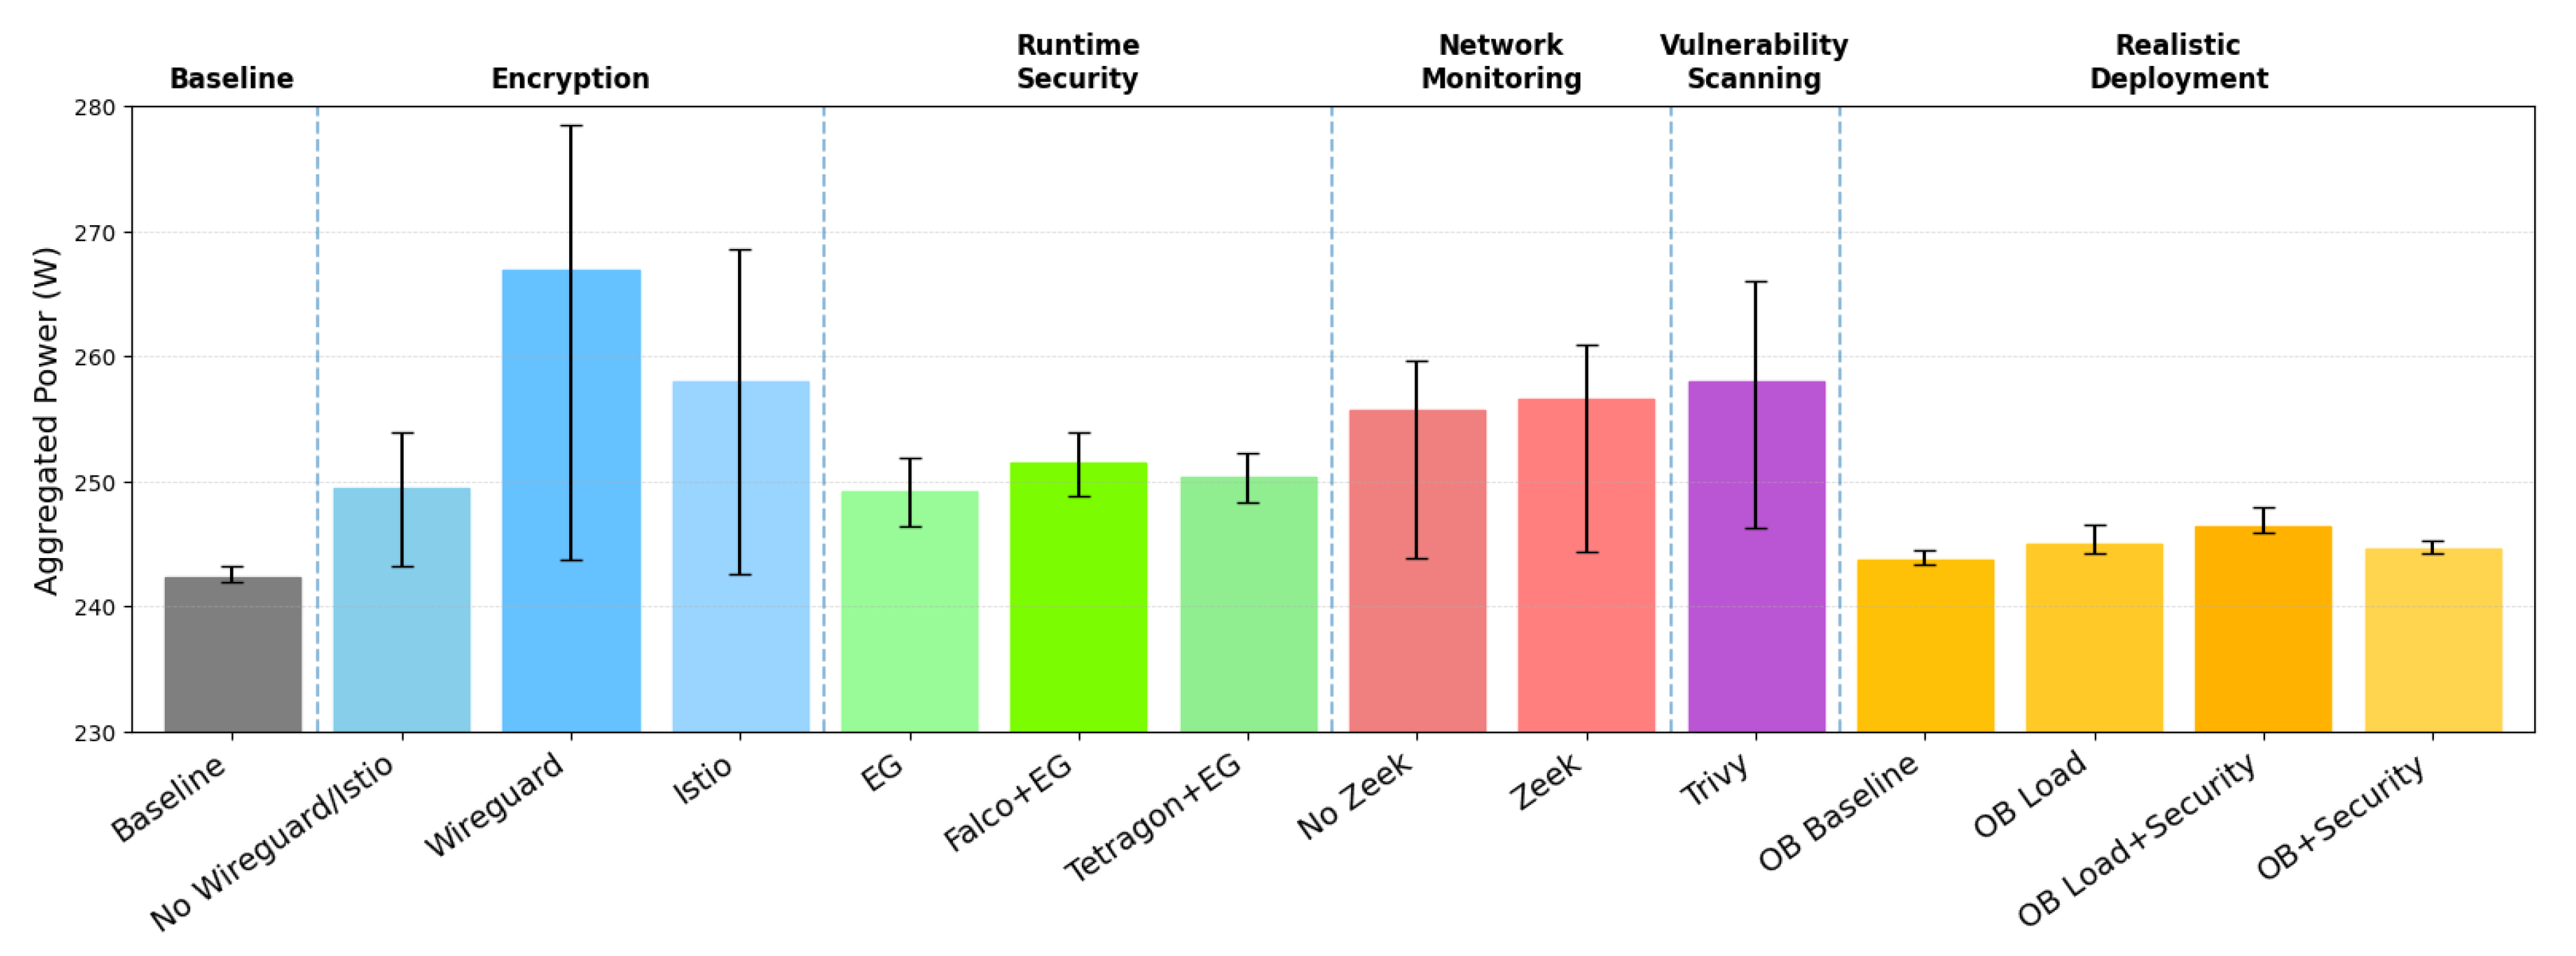

Table 1.
Related Work Outline
| Work | Category | Domain | Technique | Platform | Key findings |
|---|---|---|---|---|---|
| Amaral et al. [12] | Energy attribution/ measurement | Cloud-native observability | eBPF + HW counters; model with RAPL/NVML when available | K8s; pod/node metrics (Prometheus) | Low error reported overall |
| Pijnacker et al. [14] | Energy attribution/ measurement | Cloud-native observability | Split node power (Redfish static/dynamic) and redistribute dynamic by CPU usage | K8s; iDRAC/Redfish | Accurate node totals; misattribution in container level |
| Werner et al. [15] | Architecture energy efficiency | Cloud microservices | Architecture comparison—Monolith, Serverless (Knative), Runtime Improvement (GraalVM), Service Reduction | K8s; TeaStore | Runtime Improvement lowers energy per request; Serverless increases energy |
| Kaur et al. [16] | Energy-aware control | IIoT, Edge-Cloud orchestration | Scheduler minimizing energy/carbon and interference | K8s Edge-Cloud | Improvement in interference and energy utilization over baselines |
| Rao & Li [17] | Energy-aware control | Cloud data-center microservices | ISSA-based placement | K8s; microservices web apps | At least 5% energy reduction |
| Beena et al. [18] | Energy-aware control | Containerized cloud | ACO/PSO + DVFS with ARAA/ARKLM | K8s | DVFS lowest average CPU; ACO fastest completion |
| Aslanpour et al. [6] | Energy-aware control | Smart-city / IoT edge | Energy-aware scheduler using node SoC/capacity; House-Allocation-style placement | k3s + OpenFaaS; 10x RPi edge cluster; | 76% reduction in wasted energy vs. K8s |
| Ali & Sofia [19] | Energy-aware control | Edge-Cloud IoT | CODECO PDLC-CA: energy-aware node ranking from energy metrics; scheduler recommendations | k3s on Raspberry Pi 4 + laptop master; Kepler/Prometheus; JMeter | Lower energy that default K8s (especially at high load) |
| Snousi et al. [5] | Energy-aware control | Smart-city IoT | Context-aware Decision Engine + LSTM-based Resource Orchestration for predictive placement | K8s across edge-fog-cloud | 31% lower energy |
| Koukis et al. [20] | Security measures resource utilization | Edge-Cloud networking and security | CNI + security features: tunneling, WireGuard/IPsec, eBPF, Istio | Vanilla K8s and MicroK8s | WireGuard drives highest CPU and Istio highest throughput |
| Kapetanidou et al. [21] | Security measures resource utilization | Cloud-native security | Vulnerability and misconfiguration scanners | K8s | Low overall overhead; Trivy peaks higher in memory |
| Viktorsson et al. [22] | Security measures resource utilization | Cloud-native runtime isolation | Container runtimes runC vs gVisor vs Kata | K8s; Redis, Spark, TeaStore | Hardened environments are slower and add memory overhead |
Table 2.
System Specifications.
| Parameter | System Specifications |
|---|---|
| Cluster Nodes | 3 (1 Control Plane, 2 Worker nodes) |
| Hardware Specs per node | 4 vCPUs, 4 GB RAM, 40 GB storage |
| Kernel Version | 5.15.0 |
| Containerd Version | 1.7.26 |
| Kubernetes Distribution | Vanilla K8s |
| Kubernetes Version | 1.31 |
| CNI Plugin & Version | Calico (v3.29.1) |
Table 3.
Results Outline
| Experiment | Baseline | Exp. Baseline | Avg. diff. from baseline | Max diff. from baseline | Avg. diff. from exp. baseline | Max diff. from exp. baseline |
|---|---|---|---|---|---|---|
| WireGuard | 242.32 W | 249.50 W | 24.57 W | 36.18 W | 17.39 W | 29 W |
| Istio | 242.32 W | 249.50 W | 15.70 W | 26.18 W | 8.52 W | 19 W |
| Falco + EG | 242.32 W | 249.17 W | 9.12 W | 11.58 W | 2.27 W | 4.73 W |
| Tetragon + EG | 242.32 W | 249.17 W | 8.01 W | 9.98 W | 1.16 W | 3.13 W |
| Zeek | 242.32 W | 255.64 W | 14.20 W | 18.58 W | 0.88 W | 5.26 W |
| Trivy | 242.32 W | 244.62 W | 15.64 W | 23.68 W | 13.34 W | 21.38 W |
| OB + Load | 242.32 W | 243.73 W | 2.63 W | 4.18 W | 1.22 W | 2.77 W |
| OB + Load + Security | 242.32 W | 244.95 W | 4.02 W | 5.58 W | 1.39 W | 2.95 W |
| OB + Security | 242.32 W | 243.73 W | 2.30 W | 2.88 W | 0.89 W | 1.47 W |
Disclaimer/Publisher’s Note: The statements, opinions and data contained in all publications are solely those of the individual author(s) and contributor(s) and not of MDPI and/or the editor(s). MDPI and/or the editor(s) disclaim responsibility for any injury to people or property resulting from any ideas, methods, instructions or products referred to in the content. |
© 2026 by the authors. Licensee MDPI, Basel, Switzerland. This article is an open access article distributed under the terms and conditions of the Creative Commons Attribution (CC BY) license (http://creativecommons.org/licenses/by/4.0/).
Copyright: This open access article is published under a Creative Commons CC BY 4.0 license, which permit the free download, distribution, and reuse, provided that the author and preprint are cited in any reuse.


