Submitted:
03 January 2026
Posted:
06 January 2026
You are already at the latest version
Abstract
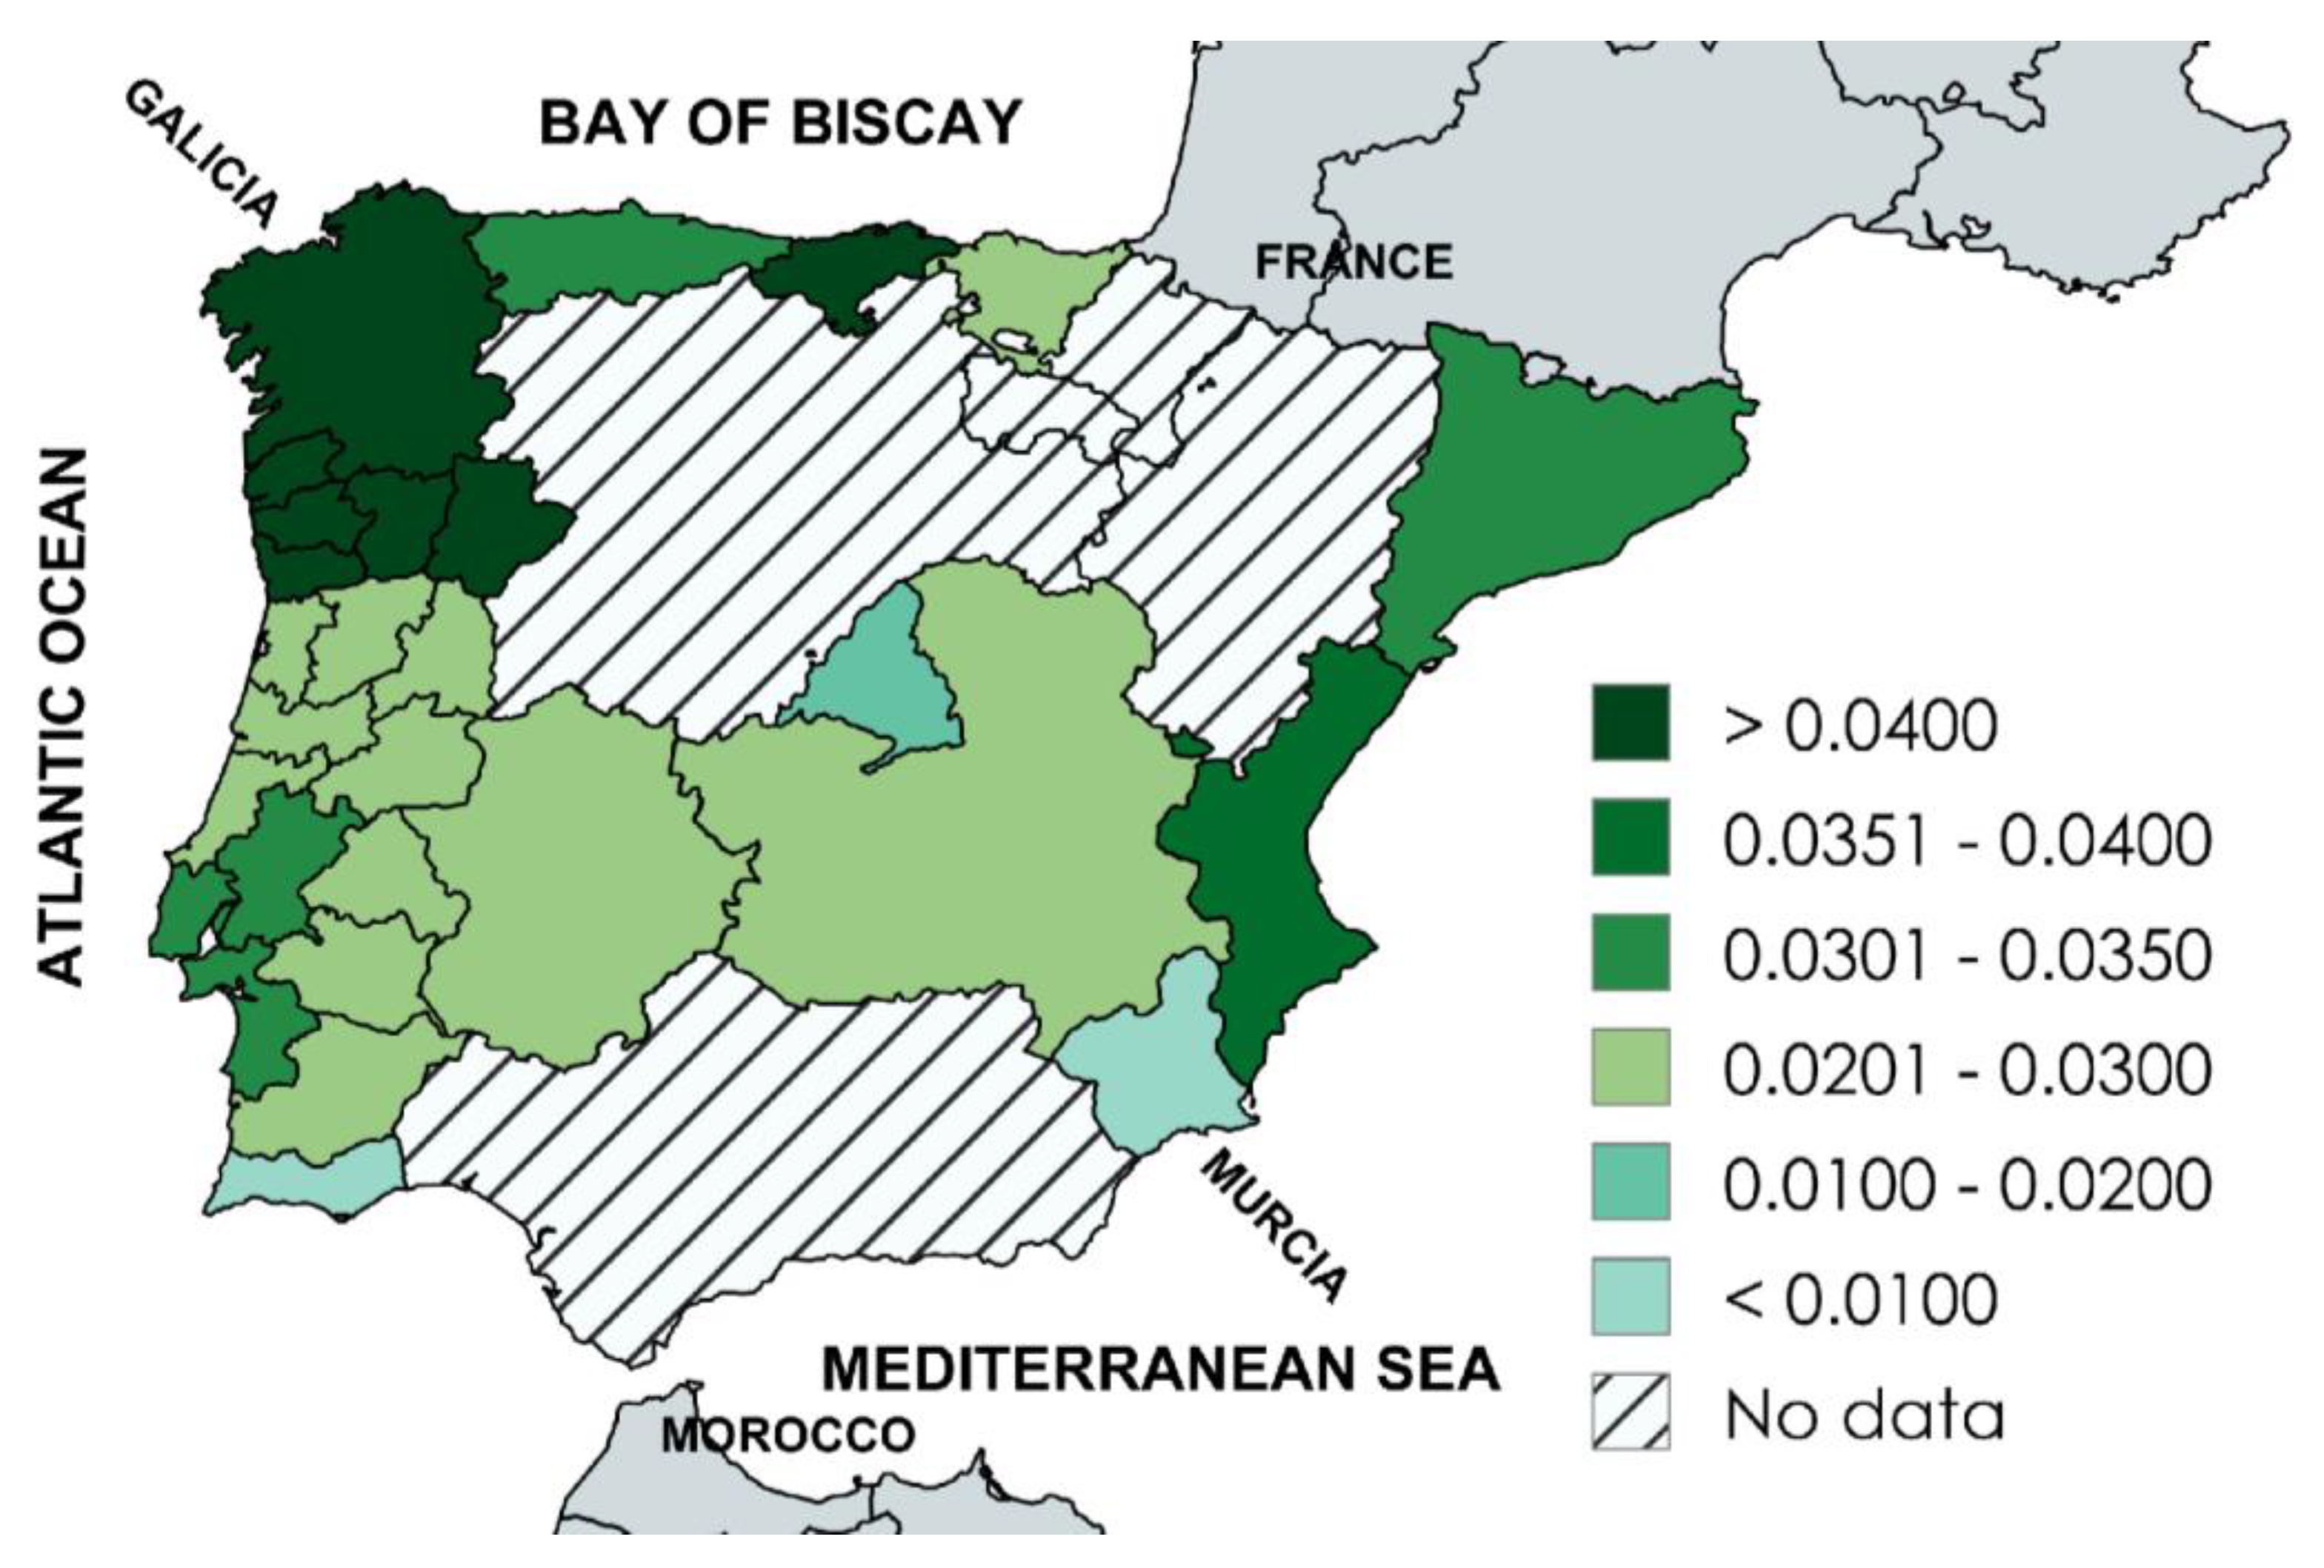
Background: We sought to analyze the geographic distribution of HFE p.C282Y (homeostatic iron regulator c.845G>A; rs1800562) allele frequencies in Iberia. Methods: We analyzed published population/control cohorts of 50 or more subjects in mainland Spain and mainland Portugal and determined whether or not the p.C282Y genotypes in each cohort deviated from Hardy-Weinberg equilibrium (HWE) proportions. We defined combined p.C282Y allele frequencies from Spain and Portugal as representative of Iberia. We computed linear regressions (Pearson’s correlations) of allele frequencies vs. latitudes and longitudes of cohort recruitment sites, defined significant regressions as allele frequency gradients, and mapped regional allele frequencies. Results: There were 33 Iberian cohorts: 24 Spanish (12,082 subjects; 10 autonomous communities) and 9 Portuguese (1024 subjects; five administrative regions). p.C282Y genotypes in one of 33 cohorts (3.0%) deviated significantly from HWE proportions. Aggregate allele frequency in Iberia was 0.0291 (762/26,212) [95% confidence interval: 0.0271, 0.0312]. The correlation of allele frequencies vs. latitudes in Iberia was significant (r33 = 0.4129; p = 0.0152). The correlation of allele frequencies vs. longitudes was not significant (r33 = -0.0118; p = 0.9552). The range of 15 regional allele frequencies in Iberia was 0.0068 (Murcia) to 0.5000 (Galicia). Frequencies were highest in regions adjacent to the north and northwest coasts (Cantabria, Galicia, Norte) and lowest in the south (Algarve, Murcia). Conclusions: There is a significant decreasing linear north-to-south gradient of HFE p.C282Y allele frequencies in Iberia. p.C282Y allele frequencies are highest in regions adjacent to the north and northwest coasts.
Keywords:
1. Introduction
2. Methods
2.1. Definition of Population/Control Cohort
2.2. Definition of Evaluable Population/Control Cohorts
2.3. Evaluable Population/Control Cohorts Included
2.4. Evaluable Population/Control Cohorts Not Discovered
2.5. Population/Control Cohorts Excluded
2.6. Statistics
3. Results
3.1. Characteristics of 33 Population/Control Cohorts
3.2. Hardy-Weinberg Equilibrium Proportions
3.3. Aggregate HFE p.C282Y Allele Frequencies
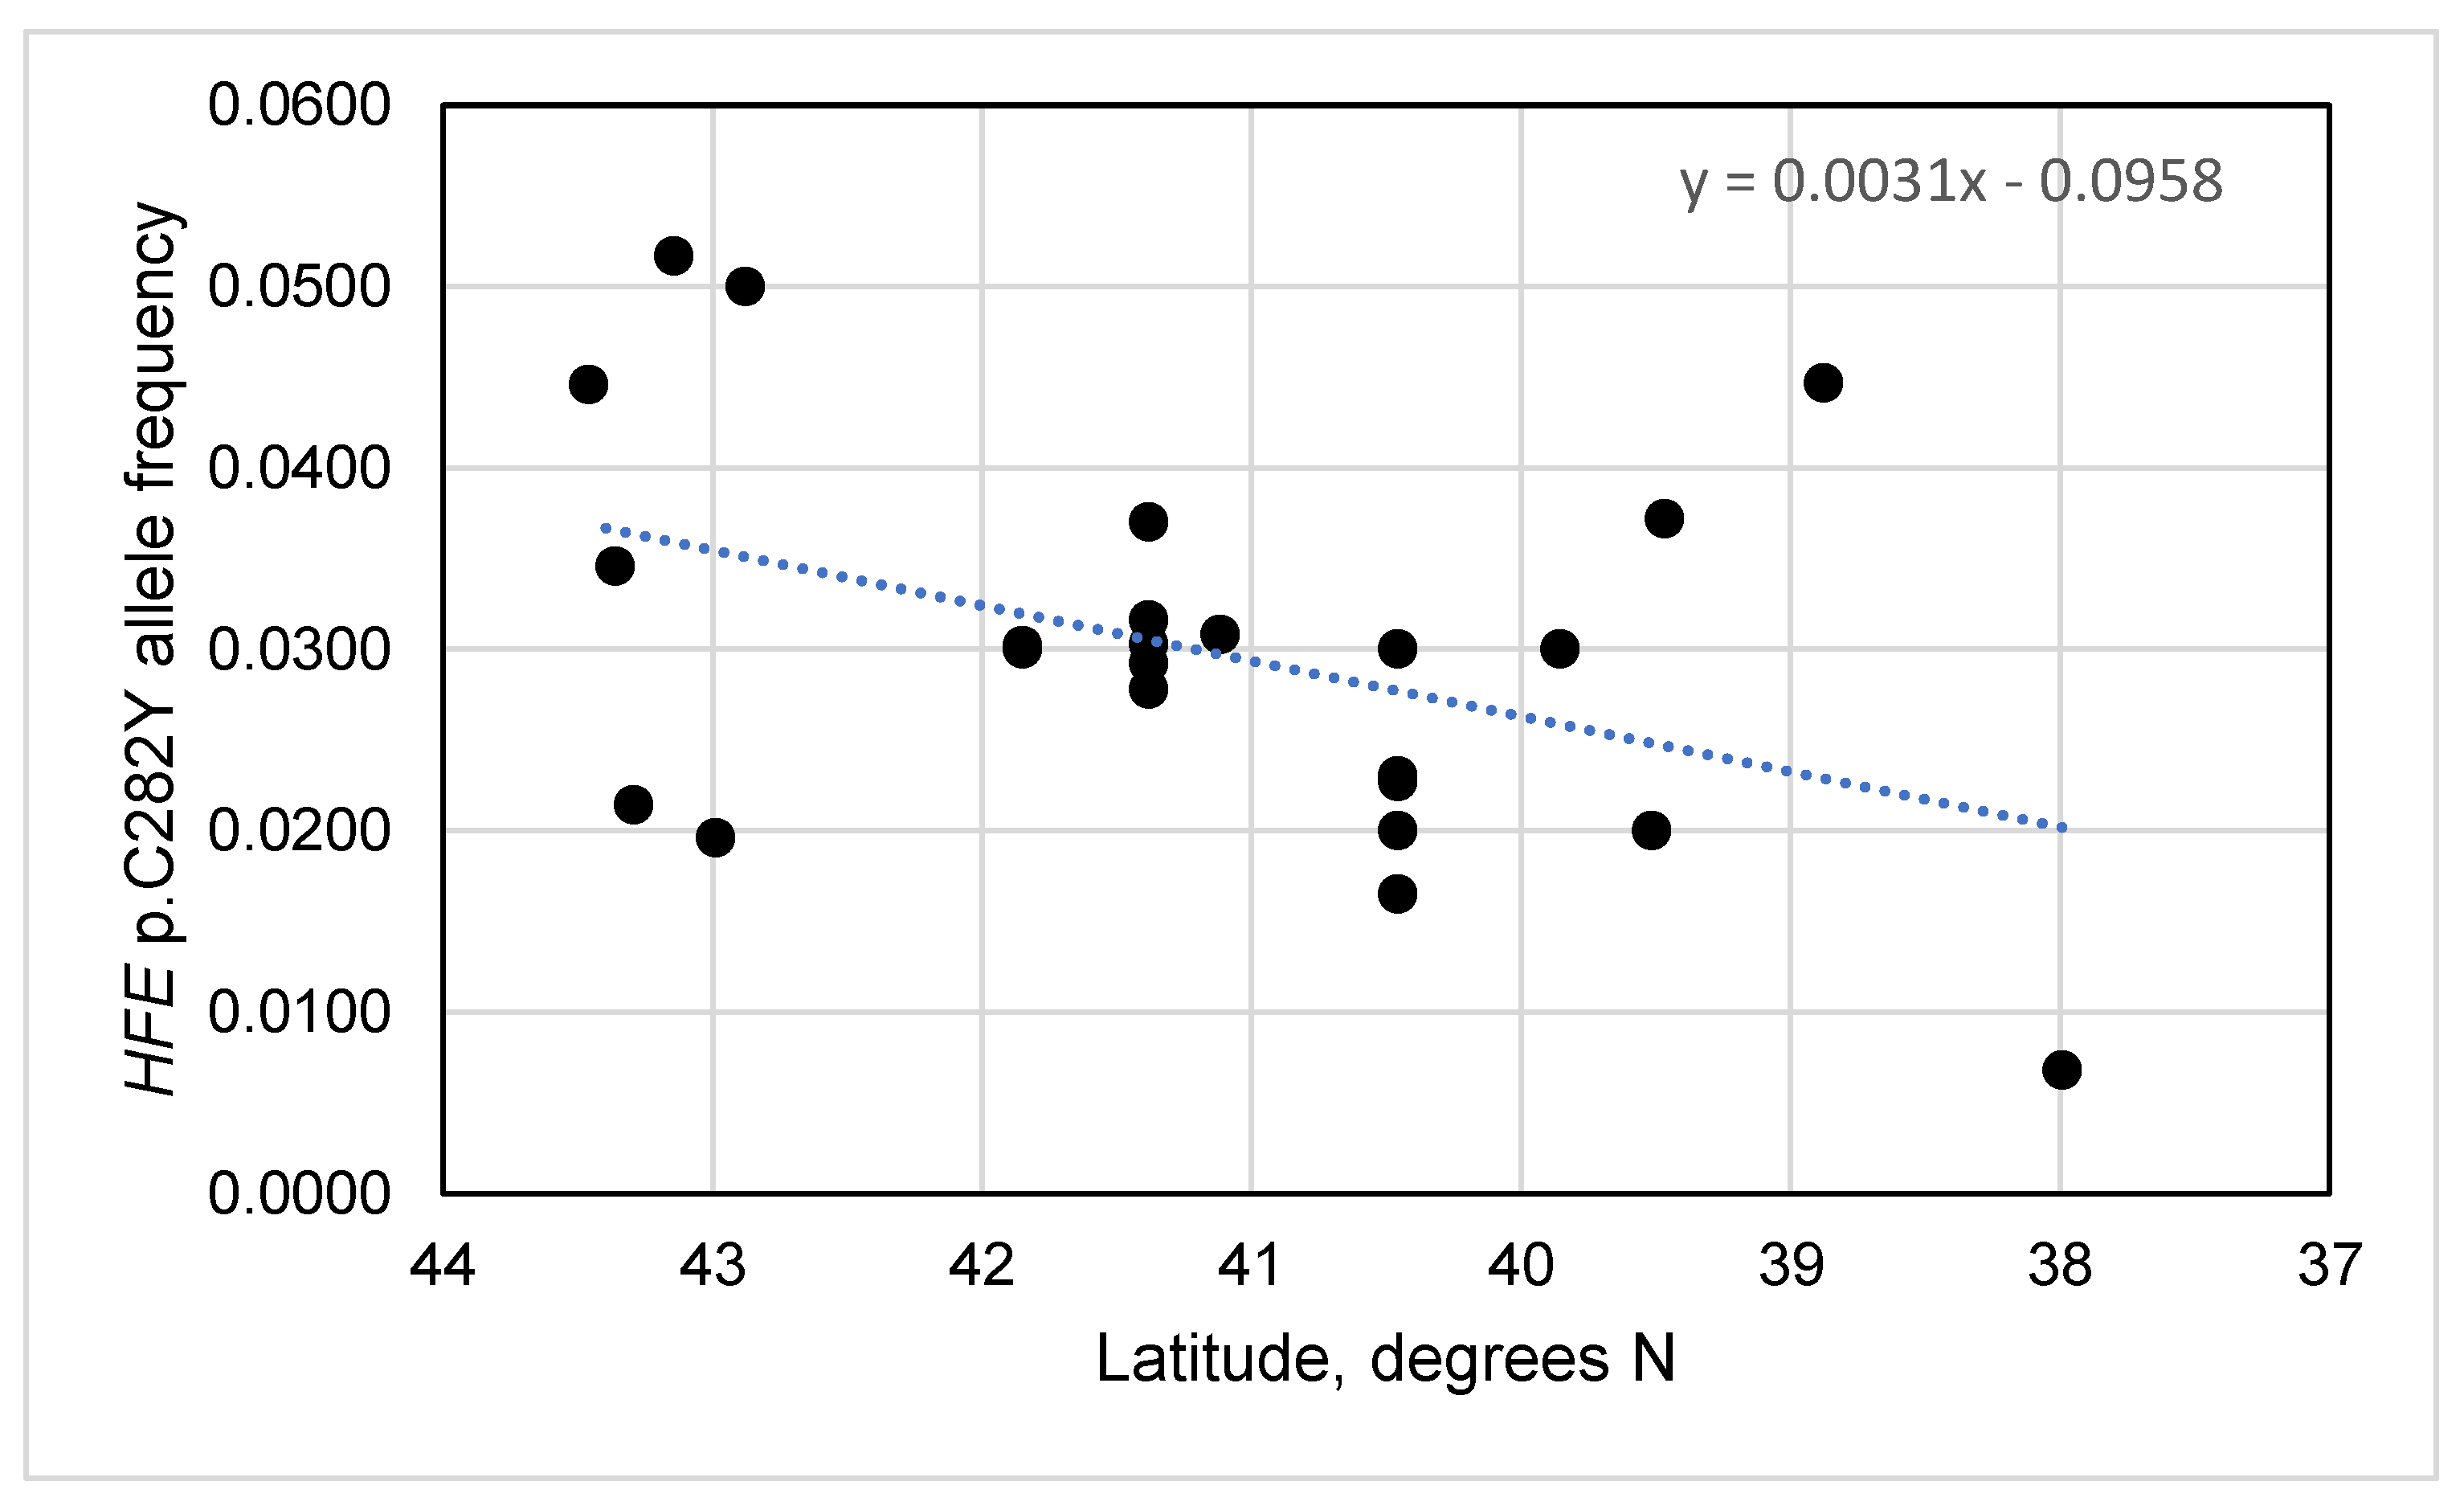
3.4. HFE p.C282Y Allele Frequencies vs. Latitudes and Longitudes in Spain
3.5. HFE p.C282Y Allele Frequencies vs. Latitudes and Longitudes in Portugal
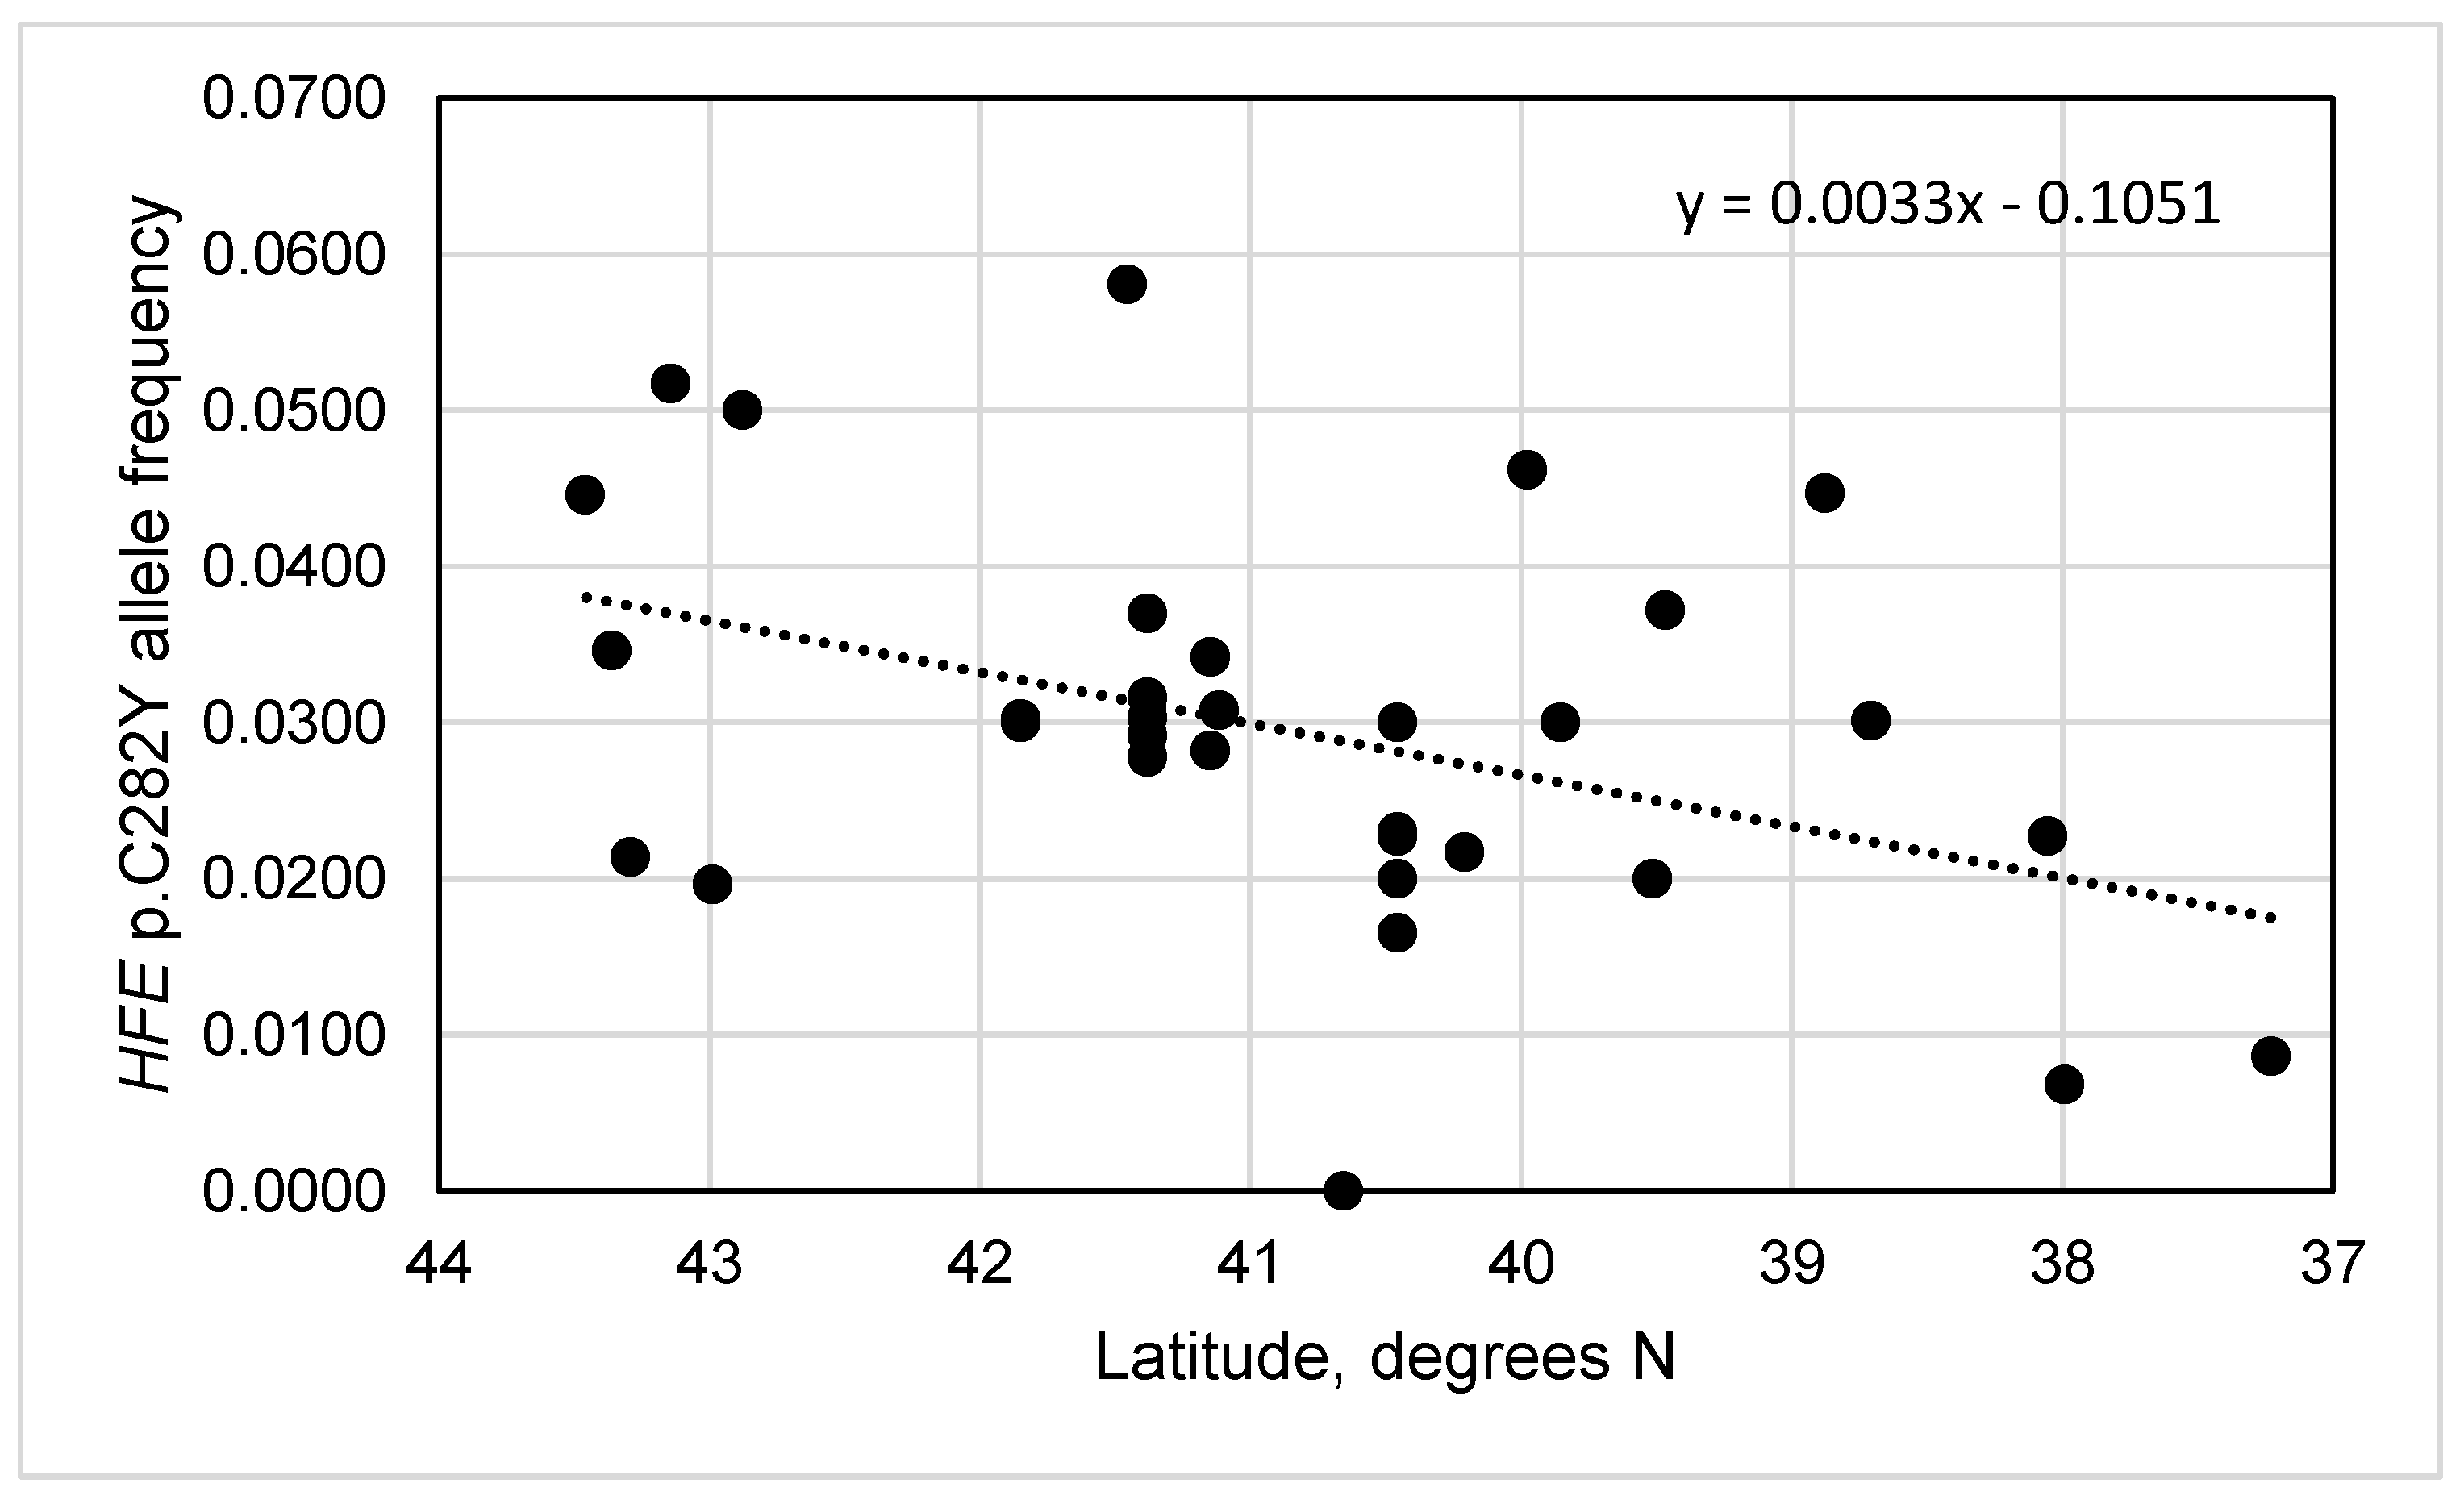
3.6. HFE p.C282Y Allele Frequencies vs. Latitudes and Longitudes in Iberia
3.7. Regional HFE p.C282Y Allele Frequencies Map of Iberia
4. Discussion
5. Conclusions
Author Contributions
Funding
Institutional Review Board Statement
Informed Consent Statement
Data Availability Statement
Conflicts of Interest
Abbreviations
| CI | confidence interval |
| HWE | Hardy-Weinberg equilibrium |
Appendix A
References
- Barton, J.C.; Edwards, C.Q.; Acton, R.T. HFE gene: Structure, function, mutations, and associated iron abnormalities. Gene 2015, 574, 179–192. [Google Scholar] [CrossRef]
- Girelli, D.; Busti, F.; Brissot, P.; Cabantchik, I.; Muckenthaler, M.U.; Porto, G. Hemochromatosis classification: update and recommendations by the BIOIRON Society. Blood 2022, 139, 3018–3029. [Google Scholar] [CrossRef]
- Ganz, T. Hepcidin and iron regulation, 10 years later. Blood 2011, 117, 4425–4433. [Google Scholar] [CrossRef]
- Simon, M.; Pawlotsky, Y.; Bourel, M.; Fauchet, R.; Genetet, B. [Letter: Idiopathic hemochromatosis associated with HL-A 3 tissular antigen]. Nouv. Presse Med. 1975, 4, 1432. [Google Scholar]
- Simon, M.; Fauchet, R.; Hespel, J.P.; Beaumont, C.; Brissot, P.; Hery, B.; Hita De, N.Y.; Genetet, B.; Bourel, M. Idiopathic hemochromatosis: a study of biochemical expression in 247 heterozygous members of 63 families: evidence for a single major HLA-linked gene. Gastroenterology 1980, 78, 703–708. [Google Scholar] [CrossRef] [PubMed]
- Jazwinska, E.C.; Pyper, W.R.; Burt, M.J.; Francis, J.L.; Goldwurm, S.; Webb, S.I.; Lee, S.C.; Halliday, J.W.; Powell, L.W. Haplotype analysis in Australian hemochromatosis patients: evidence for a predominant ancestral haplotype exclusively associated with hemochromatosis. Am. J. Hum. Genet. 1995, 56, 428–433. [Google Scholar] [PubMed]
- Raha-Chowdhury, R.; Gruen, J. Localization, allelic heterogeneity, and origins of the hemochromatosis gene. In Hemochromatosis: genetics, pathophysiology, diagnosis and treatment; Barton, J., Edwards, C., Eds.; Cambridge University Press: Cambridge, England, 2000; pp. 75–90. [Google Scholar]
- Distante, S.; Robson, K.J.; Graham-Campbell, J.; Arnaiz-Villena, A.; Brissot, P.; Worwood, M. The origin and spread of the HFE-C282Y haemochromatosis mutation. Hum. Genet. 2004, 115, 269–279. [Google Scholar] [CrossRef] [PubMed]
- Cassidy, L.M.; Martiniano, R.; Murphy, E.M.; Teasdale, M.D.; Mallory, J.; Hartwell, B.; Bradley, D.G. Neolithic and Bronze Age migration to Ireland and establishment of the insular Atlantic genome. Proc. Natl. Acad. Sci. USA 2016, 113, 368–373. [Google Scholar] [CrossRef]
- Feder, J.N.; Gnirke, A.; Thomas, W.; Tsuchihashi, Z.; Ruddy, D.A.; Basava, A.; Dormishian, F.; Domingo, R., Jr.; Ellis, M.C.; Fullan, A.; et al. A novel MHC class I-like gene is mutated in patients with hereditary haemochromatosis. Nat Genet. 1996, 13, 399–408. [Google Scholar] [CrossRef]
- Iberian Peninsula. Available online: https://en.wikipedia.org/wiki/Iberian_Peninsula (accessed on 1 December 2025).
- Merryweather-Clarke, A.T.; Pointon, J.J.; Shearman, J.D.; Robson, K.J. Global prevalence of putative haemochromatosis mutations. J. Med. Genet. 1997, 34, 275–278. [Google Scholar] [CrossRef]
- Guix, P.; Picornell, A.; Parera, M.; Tomas, C.; Muncunill, J.; Castro, J.A.; Rossell, J.; Vaquer, P.; Ramon, M.M.; Obrador, A. Prevalence of the C282Y mutation for haemochromatosis on the Island of Majorca. Clin. Genet. 2000, 58, 123–128. [Google Scholar] [CrossRef] [PubMed]
- Milman, N.; Pedersen, P. Evidence that the Cys282Tyr mutation of the HFE gene originated from a population in Southern Scandinavia and spread with the Vikings. Clin. Genet. 2003, 64, 36–47. [Google Scholar] [CrossRef]
- Monzó, C.; Ortiz, B.; Tomás, C.; Collado, C.; González-Muñoz, C.; Guzmán, C.; Valverde, V.; Miguel-Cabo, M.; Monzó, V.; de Lamo, M.; et al. Different distribution of the common HFE variants between western and eastern Spanish populations evidences an independent haplotype gene flow. Rev. Lab. Clin. 2017, 10, 72–78. [Google Scholar] [CrossRef]
- Cardoso, C.S.; Oliveira, P.; Porto, G.; Oberkanins, C.; Mascarenhas, M.; Rodrigues, P.; Kury, F.; de, S.M. Comparative study of the two more frequent HFE mutations (C282Y and H63D): significant different allelic frequencies between the North and South of Portugal. Eur. J. Hum. Genet. 2001, 9, 843–848. [Google Scholar] [CrossRef] [PubMed]
- HFE, p. C282Y (rs1800562) allele frequencies in 33 population/control cohorts in Iberia. Available online: https://www.medrxiv.org/content/10.64898/2025.12.19.25342681v1 (accessed on 21 December 2025).
- Hale, M.L.; Burg, T.M.; Steeves, T.E. Sampling for microsatellite-based population genetic studies: 25 to 30 individuals per population is enough to accurately estimate allele frequencies. PLoS One 2012, 7, e45170. [Google Scholar] [CrossRef] [PubMed]
- mapcoordinates.net. Available online: https://www.mapcoordinates.net/ (accessed on 13 June 2025).
- Engels, W.R. Exact tests for Hardy-Weinberg proportions. Genetics 2009, 183, 1431–1441. [Google Scholar] [CrossRef]
- Hardy-Weinberg equilibrium exact test. Available online: https://www.cog-genomics.org/software/stats (accessed on 24 December 2025).
- Rubin-Delanchy, P.; Heard, N.A.; Lawson, D.J. Meta-analysis of mid-p values: some new results based on the convex order. J. Am. Stat. Assoc. 2019, 114, 1105–1112. [Google Scholar] [CrossRef]
- Chan, Y.H. Biostatistics 104: correlational analysis. Singapore Med. J. 2003, 44, 614–619. [Google Scholar]
- Latitude Longitude Distance Calculator. Available online: https://www.omnicalculator.com/other/latitude-longitude-distance (accessed on 13 June 2025).
- MapChart. Available online: https://www.mapchart.net/ (accessed on 1 December 2025).
- Lauret, E.; Rodrguez, M.; González, S.; López-Vázquez, A.; Martinez-Borra, J.; Rodrigo, L.; Lopez-Larrea, C. HFE gene mutations in alcoholic and virus-related cirrhotic patients with hepatocellular carcinoma. Am. J. Gastroenterol. 2002, 97, 1016–1021. [Google Scholar] [CrossRef]
- Baiget, M.; Barceló, M.J.; Gimferrer, E. Frequency of the HFE C282Y and H63D mutations in distinct ethnic groups living in Spain. J. Med. Genet. 1998, 35, 701. [Google Scholar] [CrossRef]
- de Juan, D.; Reta, A.; Castiella, A.; Pozueta, J.; Prada, A.; Cuadrado, E. HFE gene mutations analysis in Basque hereditary haemochromatosis patients and controls. Eur. J. Hum. Genet. 2001, 9, 961–964. [Google Scholar] [CrossRef]
- de Buruaga, J.A.S.; Perez-Herrero, N.; Perez-Herrero, N.; Vazquez-Puente, C.; del Consuelo Modesto-Caballero, M.; Perez-Ruiz, F. Association of mutations in hemochromatosis genes with clinical severity of calcium pyrophosphate arthritis. Explor. Musculoskeletal Dis. 2023, 1, 186–193. [Google Scholar] [CrossRef]
- Fábrega, E.; Castro, B.; Sánchez-Castro, L.; Benito, A.; Fernández-Luna, J.L.; Pons-Romero, F. The prevalence of the Cys282Tyr mutation in the hemochromatosis gene in Cantabria in patients diagnosed with hereditary hemochromatosis. Med. Clin. (Barc) 1999, 112, 451–453. [Google Scholar]
- de Diego, C.; Murga, M.J.; Martínez-Castro, P. Frequency of HFE H63D, S65C, and C282Y mutations in patients with iron overload and controls from Toledo, Spain. Genet. Test. 2004, 8, 263–267. [Google Scholar] [CrossRef]
- Berez, V.; Camps, J.; Arija, V.; Aranda, N.; Fernández-Ballart, J.; Vilella, E.; Figuera, L.; Ferré, N.; Joven, J. Soluble transferrin receptor and mutations in hemochromatosis and transferrin genes in a general Catalan population. Clin. Chim. Acta 2005, 353, 205–208. [Google Scholar] [CrossRef] [PubMed]
- Sánchez, M.; Bruguera, M.; Bosch, J.; Rodés, J.; Ballesta, F.; Oliva, R. Prevalence of the Cys282Tyr and His63Asp HFE gene mutations in Spanish patients with hereditary hemochromatosis and in controls. J. Hepatol. 1998, 29, 725–728. [Google Scholar] [CrossRef]
- Sánchez, M.; Villa, M.; Ingelmo, M.; Sanz, C.; Bruguera, M.; Ascaso, C.; Oliva, R. Population screening for hemochromatosis: a study in 5370 Spanish blood donors. J. Hepatol. 2003, 38, 745–750. [Google Scholar] [CrossRef] [PubMed]
- Altes, A.; Ruiz, A.; Barceló, M.J.; Remacha, A.F.; Puig, T.; Maya, A.J.; Castell, C.; Amate, J.M.; Saz, Z.; Baiget, M. Prevalence of the C282Y, H63D, and S65C mutations of the HFE gene in 1,146 newborns from a region of Northern Spain. Genet. Test. 2004, 8, 407–410. [Google Scholar] [CrossRef]
- Toll, A.; Celis, R.; Ozalla, M.D.; Bruguera, M.; Herrero, C.; Ercilla, M.G. The prevalence of HFE C282Y gene mutation is increased in Spanish patients with porphyria cutanea tarda without hepatitis C virus infection. J. Eur. Acad. Dermatol. Venereol. 2006, 20, 1201–1206. [Google Scholar] [CrossRef]
- Aranda, N.; Viteri, F.E.; Fernandez-Ballart, J.; Murphy, M.; Arija, V. Frequency of the hemochromatosis gene (HFE) 282C-->Y, 63H-->D, and 65S-->C mutations in a general Mediterranean population from Tarragona, Spain. Ann. Hematol. 2007, 86, 17–21. [Google Scholar] [CrossRef] [PubMed]
- Rodríguez-López, R.; Donoso, M.; Fernández-Cavada, M.; González, L.M.; Margallo, A.; Corral, C.; Gallego, M.; Garcia de Cáceres, M.T.; Herrera, T.; González, C.; et al. Diagnostic utility of HFE variants in Spanish patients: association with HLA alleles and role in susceptibility to acute lymphoblastic leukemia. Gene 2013, 514, 31–35. [Google Scholar] [CrossRef]
- Alvarez, S.; Mesa, M.S.; Bandrés, F.; Arroyo, E. C282Y and H63D mutation frequencies in a population from central Spain. Dis. Markers 2001, 17, 111–114. [Google Scholar] [CrossRef]
- Soto, L.; Vega, A.; Goyanes, V.; Valverde, D. Hemochromatosis in Galicia (nw Spain): a Celtic influence? Clin. Genet. 2000, 57, 454–455. [Google Scholar] [CrossRef]
- de Salamanca, R.E.; Morales, P.; Castro, M.J.; Rojo, R.; Gonzalez, M.; Arnaiz-Villena, A. The most frequent HFE allele linked to porphyria cutanea tarda in Mediterraneans is His63Asp. Hepatology 1999, 30, 819–820. [Google Scholar] [CrossRef] [PubMed]
- Moreno, L.; Vallcorba, P.; Boixeda, D.; Cabello, P.; Bermejo, F.; San Román, C. [The usefulness of the detection of Cys282Tyr and His63Asp mutations in the diagnosis of hereditary hemochromatosis]. Rev. Clin. Esp. 1999, 199, 632–636. [Google Scholar] [PubMed]
- Gonzalez-Hevilla, M.; de Salamanca, R.E.; Morales, P.; Martinez-Laso, J.; Fontanellas, A.; Castro, M.J.; Rojo, R.; Moscoso, J.; Zamora, J.; Serrano-Vela, J.I.; et al. Human leukocyte antigen haplotypes and HFE mutations in Spanish hereditary hemochromatosis and sporadic porphyria cutanea tarda. J. Gastroenterol. Hepatol. 2005, 20, 456–462. [Google Scholar] [CrossRef]
- Ropero-Gradilla, P.; Gonzalez-Fernández, F.A.; Briceño-Polacre, O.; Villegas-Martinez, A. [Geographical distribution of HFE C282Y and H63D mutation in Spain]. Med. Clin. (Barc) 2005, 125, 794–795. [Google Scholar] [CrossRef]
- Ropero, P.; Briceño, O.; Mateo, M.; Polo, M.; Mora, A.; González, F.A.; Villegas, A. Frequency of the C282Y and H63D mutations of the hemochromatosis gene (HFE) in a cohort of 1,000 neonates in Madrid (Spain). Ann. Hematol. 2006, 85, 323–326. [Google Scholar] [CrossRef]
- Muro, M.; Moya-Quiles, M.R.; Botella, C.; Álvarez-López, M.R. Prevalence of C282Y, H63D and S65C mutations of the hemochromatosis (HFE) gene in a population from southeastern Spain (Murcia Region). Clin. Genet. 2007, 71, 97–98. [Google Scholar] [CrossRef]
- Guerreiro, R.J.; Bras, J.M.; Santana, I.; Januario, C.; Santiago, B.; Morgadinho, A.S.; Ribeiro, M.H.; Hardy, J.; Singleton, A.; Oliveira, C. Association of HFE common mutations with Parkinson’s disease, Alzheimer’s disease and mild cognitive impairment in a Portuguese cohort. BMC Neurol. 2006, 6, 24. [Google Scholar] [CrossRef]
- Costa-Matos, L.; Batista, P.; Monteiro, N.; Henriques, P.; Girão, F.; Carvalho, A. Hfe mutations and iron overload in patients with alcoholic liver disease. Arq. Gastroenterol. 2013, 50, 35–41. [Google Scholar] [CrossRef]
- Porto, G.; Alves, H.; Rodrigues, P.; Cabeda, J.M.; Portal, C.; Ruivo, A.; Justiça, B.; Wolff, R.; de, S.M. Major histocompatibility complex class I associations in iron overload: evidence for a new link between the HFE H63D mutation, HLA-A29, and non-classical forms of hemochromatosis. Immunogenetics 1998, 47, 404–410. [Google Scholar] [CrossRef]
- Cardoso, C.S.; Araújo, H.C.; Cruz, E.; Afonso, A.; Mascarenhas, C.; Almeida, S.; Moutinho, J.; Lopes, C.; Medeiros, R. Haemochromatosis gene (HFE) mutations in viral-associated neoplasia: Linkage to cervical cancer. Biochem. Biophys. Res. Commun. 2006, 341, 232–238. [Google Scholar] [CrossRef]
- Lucotte, G. Celtic origin of the C282Y mutation of hemochromatosis. Blood Cells Mol. Dis. 1998, 24, 433–438. [Google Scholar] [CrossRef]
- The Hardy-Weinberg Principle. Available online: https://www.nature.com/scitable/knowledge/library/the-hardy-weinberg-principle-13235724/#:~:text=It%20is%20important%20to%20recognize,a%20more%20powerful%20exact%20test (accessed on 20 December 2025).
- Namipashaki, A.; Razaghi-Moghadam, Z.; Ansari-Pour, N. The essentiality of reporting Hardy-Weinberg equilibrium calculations in population-based genetic association studies. Cell J. 2015, 17, 187–192. [Google Scholar] [PubMed]
- Hosking, L.; Lumsden, S.; Lewis, K.; Yeo, A.; McCarthy, L.; Bansal, A.; Riley, J.; Purvis, I.; Xu, C.F. Detection of genotyping errors by Hardy-Weinberg equilibrium testing. Eur. J. Hum. Genet. 2004, 12, 395–399. [Google Scholar] [CrossRef] [PubMed]
- Morin, P.A.; Leduc, R.G.; Archer, F.I.; Martien, K.K.; Huebinger, R.; Bickham, J.W.; Taylor, B.L. Significant deviations from Hardy-Weinberg equilibrium caused by low levels of microsatellite genotyping errors. Mol. Ecol. Resour. 2009, 9, 498–504. [Google Scholar] [CrossRef]
- Suarez, B.K.; Hampe, C.L. Linkage and association. Am. J. Hum. Genet. 1994, 54, 554–559. [Google Scholar]
- Hinrichs, A.L.; Larkin, E.K.; Suarez, B.K. Population stratification and patterns of linkage disequilibrium. Genet. Epidemiol. 2009, 33, S88–S92. [Google Scholar] [CrossRef] [PubMed]
- Taioli, E.; Pedotti, P.; Garte, S. Importance of allele frequency estimates in epidemiological studies. Mutat. Res. 2004, 567, 63–70. [Google Scholar] [CrossRef]
- Park, H.C.; Ahn, E.R.; Shin, S.C. Comparative analysis of allele variation using allele frequencies according to sample size in Korean population. Genes Genomics 2021, 43, 1301–1305. [Google Scholar] [CrossRef]
- Fogarty, L.; Otto, S.P. Signatures of selection with cultural interference. Proc. Natl. Acad. Sci. USA 2024, 121, e2322885121. [Google Scholar] [CrossRef]
- Motulsky, A.G. Genetics of hemochromatosis. N. Engl. J. Med. 1979, 301, 1291. [Google Scholar]
- Hunt, J.R.; Zeng, H. Iron absorption by heterozygous carriers of the HFE C282Y mutation associated with hemochromatosis. Am. J. Clin. Nutr. 2004, 80, 924–931. [Google Scholar] [CrossRef] [PubMed]
- Roe, M.A.; Heath, A.L.; Oyston, S.L.; Macrow, C.; Hoogewerff, J.A.; Foxall, R.; Dainty, J.R.; Majsak-Newman, G.; Willis, G.; Fairweather-Tait, S.J. Iron absorption in male C282Y heterozygotes. Am. J. Clin. Nutr. 2005, 81, 814–821. [Google Scholar] [CrossRef]
- Beutler, E.; Felitti, V.; Gelbart, T.; Waalen, J. Haematological effects of the C282Y HFE mutation in homozygous and heterozygous states among subjects of northern and southern European ancestry. Br. J. Haematol. 2003, 120, 887–893. [Google Scholar] [CrossRef]
- Barton, J.C.; Wiener, H.H.; Acton, R.T.; Adams, P.C.; Eckfeldt, J.H.; Gordeuk, V.R.; Harris, E.L.; McLaren, C.E.; Harrison, H.; McLaren, G.D.; et al. Prevalence of iron deficiency in 62,685 women of seven race/ethnicity groups: The HEIRS Study. PLoS One 2020, 15, e0232125. [Google Scholar] [CrossRef] [PubMed]
- Naugler, C. Hemochromatosis: a Neolithic adaptation to cereal grain diets. Med. Hypotheses 2008, 70, 691–692. [Google Scholar] [CrossRef]
- McCullough, J.M.; Heath, K.M.; Smith, A.M. Hemochromatosis: niche construction and the genetic domino effect in the European Neolithic. Hum Biol. 2015, 87, 39–58. [Google Scholar] [CrossRef] [PubMed]
- Whittington, C. The C282Y mutation may have been positively selected as it mitigates the infertility of celiac disease. Med. Hypotheses 2006, 66, 769–772. [Google Scholar] [CrossRef]
- Heath, K.M.; Axton, J.H.; McCullough, J.M.; Harris, N. The evolutionary adaptation of the C282Y mutation to culture and climate during the European Neolithic. Am. J. Phys. Anthropol. 2016, 160, 86–101. [Google Scholar] [CrossRef]
- Hollerer, I.; Bachmann, A.; Muckenthaler, M.U. Pathophysiological consequences and benefits of HFE mutations: 20 years of research. Haematologica 2017, 102, 809–817. [Google Scholar] [CrossRef]
- Uzoigwe, O.F. The distribution of the parasitic fauna dictates the distribution of the haemochromatosis genes. Med. Hypotheses 2010, 75, 415–417. [Google Scholar] [CrossRef]
- Hermine, O.; Dine, G.; Genty, V.; Marquet, L.A.; Fumagalli, G.; Tafflet, M.; Guillem, F.; Van, L.F.; Rousseaux-Blanchi, M.P.; Palierne, C.; et al. Eighty percent of French sport winners in Olympic, World and Europeans competitions have mutations in the hemochromatosis HFE gene. Biochimie 2015, 119, 1–5. [Google Scholar] [CrossRef]
- Olsen, B.; Jones, T.; Dollerschell, K.; Gallo, P. The heights of iron absorption: erythrocytosis in patients with heterozygous HFE mutations at altitude. Blood 2025, 146, 6464. [Google Scholar] [CrossRef]
- Yeap, B.B.; Beilin, J.; Shi, Z.; Knuiman, M.W.; Olynyk, J.K.; Chubb, S.A.; Bruce, D.G.; Milward, E.A. The C282Y polymorphism of the hereditary hemochromatosis gene is associated with increased sex hormone-binding globulin and normal testosterone levels in men. J. Endocrinol. Invest. 2010, 33, 544–548. [Google Scholar] [CrossRef] [PubMed]
- Balistreri, C.R.; Candore, G.; Almasio, P.; Di, M.V.; Colonna-Romano, G.; Craxi, A.; Motta, M.; Piazza, G.; Malaguarnera, M.; Lio, D.; et al. Analysis of hemochromatosis gene mutations in the Sicilian population: implications for survival and longevity. Arch. Gerontol. Geriatr. Suppl. 2002, 8, 35–42. [Google Scholar] [CrossRef]
- Beutler, E. Iron absorption in carriers of the C282Y hemochromatosis mutation. Am. J. Clin. Nutr. 2004, 80, 799–800. [Google Scholar] [CrossRef] [PubMed]
- Simon, M.; Alexandre, J.L.; Fauchet, R.; Genetet, B.; Bourel, M. The genetics of hemochromatosis. Prog. Med. Genet. 1980, 4, 135–168. [Google Scholar]
- Smith, B.N.; Kantrowitz, W.; Grace, N.D.; Greenberg, M.S.; Patton, T.J.; Ookubo, R.; Sorger, K.; Semeraro, J.G.; Doyle, J.R.; Cooper, A.G.; et al. Prevalence of hereditary hemochromatosis in a Massachusetts corporation: is Celtic origin a risk factor? Hepatology 1997, 25, 1439–1446. [Google Scholar] [CrossRef]
- Alberro, M. The celticisation of the Iberian Peninsula, a process that could have had parallels in other European regions. Études celtique 2003, 35, 7–24. [Google Scholar] [CrossRef]
- Lucotte, G.; Dieterlen, F. A European allele map of the C282Y mutation of hemochromatosis: Celtic versus Viking origin of the mutation? Blood Cells Mol. Dis. 2003, 31, 262–267. [Google Scholar] [CrossRef]
- Murphy, S.; Curran, M.D.; McDougall, N.; Callender, M.E.; O’Brien, C.J.; Middleton, D. High incidence of the Cys 282 Tyr mutation in the HFE gene in the Irish population--implications for haemochromatosis. Tissue Antigens 1998, 52, 484–488. [Google Scholar] [CrossRef]
- Ryan, E.; O’keane, C.; Crowe, J. Hemochromatosis in Ireland and HFE. Blood Cells Mol. Dis. 1998, 24, 428–432. [Google Scholar] [CrossRef]
- Some thoughts on Asturian mythology. Available online: https://davidwacks.uoregon.edu/2014/12/12/asturian/ (accessed on 29 December 2025).
- Alberro, M. Celtic heritage in the North-west of the Iberian Peninsula. Emania 2002, 19, 75–84. [Google Scholar]
- Milman, N.; Sorensen, S.A. Idiopathic haemochromatosis. Was the ancestor a Danish Viking? Ugeskr. Laeger 1983, 145, 832–833. [Google Scholar]
- Olsson, S.; Ritter, B. Idiopathic haemochromatosis. Was the ancestor a Danish Viking? Ugeskr. Laeger 1983, 145, 831–832. [Google Scholar]
- Batey, C.; Clarke, H.; Page, R.; Rice, N. Cultural Atlas of the Viking World; Andromeda Oxford Limited: Abingdon, England, 1994; p. 1284. [Google Scholar]
- Jones, G. A History of the Vikings, 2nd ed.; Oxford University Press: Oxford, England, 2001. [Google Scholar]
- Winroth, A. The Age of the Vikings; Princeton University Press: Princeton, USA, 2016. [Google Scholar]
- Christys, A. Vikings in the South. Voyages to Iberia and the Mediterranean; Bloomsbury Publishing: London, England, 2015; pp. 5–12, 29, 97. [Google Scholar]
- Scheen, R. Viking raids on the Spanish Peninsula. Militaria: Revista de cultura militar 1998, 8, 67–87. [Google Scholar]
- Olalde, I.; Mallick, S.; Patterson, N.; Rohland, N.; Villalba-Mouco, V.; Silva, M.; Dulias, K.; Edwards, C.J.; Gandini, F.; Pala, M.; et al. The genomic history of the Iberian Peninsula over the past 8000 years. Science 2019, 363, 1230–1234. [Google Scholar] [CrossRef] [PubMed]
- World Medical Association. Declaration of Helsinki: ethical principles for medical research involving human subjects. JAMA 2013, 310, 2191–2194. [Google Scholar] [CrossRef]
- Code of Federal Regulations. §46.104 Exempt Research. Available online: https://www.ecfr.gov/current/title-45/section-46.104 (accessed on 21 June 2025).

| Subjects, n | Autonomous community/ province or city |
p.C282Y homozygotes, n |
p.C282Y heterozygotes, n |
No p.C282Y, n | HWE value of pa | p.C282Y allele frequency [95% CI] |
Author (Year) [reference] |
|---|---|---|---|---|---|---|---|
| 159 | Asturias/Oviedo | 0 | 7 | 152 | 0.5326 | 0.0346 [0.0194, 0.0609] | Lauret (2002) [26] |
| 51 | Basque Country | 0 | 2 | 49 | 0.5050 | 0.0196 [0.0054, 0.0687] | Baiget (1998) [27] |
| 116 | Basque Country/ Guipuzcoa | 0 | 12 | 104 | 0.6299 | 0.0517 [0.0298, 0.0882] | de Juan (2001) [28] |
| 281 | Basque Country/Barakaldo | 0 | 12 | 269 | 0.5565 | 0.0214 [0.0123, 0.0370] | de Buruaga (2023) [29] |
| 213 | Cantabria/Santander | 0 | 19 | 194 | 0.6714 | 0.0446 [0.0287, 0.0686] | Fábrega (2004) [30] |
| 150 | Castile-La Mancha/Toledo | 0 | 9 | 141 | 0.5581 | 0.0300 [0.0159, 0.0560] | de Diego (2004) [31] |
| 50 | Catalonia | 0 | 3 | 47 | 0.5181 | 0.0300 [0.0103, 0.0845] | Merryweather-Clarke (1997) [12] |
| 348 | Catalonia | 0 | 21 | 327 | 0.6336 | 0.0302 [0.0198, 0.0457] | Berez (2005) [32] |
| 108 | Catalonia/Barcelona | 0 | 8 | 100 | 0.5628 | 0.0370 [0.0189, 0.0713] | Baiget (1998) [27] |
| 512 | Catalonia/Barcelona | 1 | 27 | 484 | 0.1955 | 0.0303 [0.0214, 0.0427] | Sánchez (1998) [33] |
| 5370 | Catalonia/Barcelona | 8 | 323 | 5039 | 0.2168 | 0.0316 [0.0285, 0.0351] | Sánchez (2003) [34] |
| 1043 | Catalonia/Barcelona | 1 | 60 | 982 | 0.4180 | 0.0292 [0.0228, 0.0373] | Altes (2004) [35] |
| 126 | Catalonia/Barcelona | 0 | 8 | 118 | 0.5541 | 0.0278 [0.0135, 0.0562] | Toll (2006) [36] |
| 812 | Catalonia/Tarragona | 0 | 51 | 761 | 0.1864 | 0.0308 [0.0234, 0.0404] | Aranda (2007) [37] |
| 179 | Extremadura/Badajoz | 0 | 16 | 163 | 0.6478 | 0.0447 [0.0277, 0.0714] | Rodríguez-López (2012) [38] |
| 125 | Extremadura/Cáceres | 0 | 5 | 120 | 0.5200 | 0.0200 [0.0086, 0.0460] | Alvarez (2001) [39] |
| 50 | Galicia/Santiago de Compostela |
1 | 3 | 46 | 0.0505 | 0.0500 [0.0215, 0.1118] | Soto (2000) [40] |
| 50 | Madrid/Madrid | 0 | 2 | 48 | 0.5050 | 0.0200 [0.0055, 0.0700] | de Salamanca (1999) [41] |
| 174 | Madrid/Madrid | 0 | 8 | 166 | 0.5395 | 0.0230 [0.0117, 0.0447] | Moreno (1999) [42] |
| 88 | Madrid/Madrid | 0 | 3 | 85 | 0.5086 | 0.0300 [0.0159, 0.0560] | Gonzalez-Hevilla (2005) [43] |
| 551 | Madrid/Madrid |
0 | 321 | 230 | < 0.0001 | 0.0227 [0.0154, 0.0333] | Ropero-Gradilla (2005) [44] |
| 1000 | Madrid/Madrid | 0 | 33 | 967 | 0.2964 | 0.0165 [0.0118, 0.0231] | Ropero (2006) [45] |
| 370 | Murcia/Murcia | 0 | 5 | 365 | 0.5186 | 0.0068 [0.0029, 0.0158] | Muro (2007) [46] |
| 94 | Valencia/Valencia | 1 | 5 | 88 | 0.0561 | 0.0372 [0.0181, 0.0748] | Monzó (2017) [15] |
| Subjects, n | Administrative Regionb/city |
p.C282Y homozygotes, n |
p.C282Y heterozygotes, n |
No p.C282Y, n | HWE value of pa | p.C282Y allele frequency [95% CI] |
Author (Year) [reference] |
|---|---|---|---|---|---|---|---|
| 132 | Alentejo | 0 | 6 | 126 | 0.5282 | 0.0227 [0.0104, 0.0487] | Cardoso (2001) [16] |
| 116 | Algarve |
0 | 2 | 114 | 0.5022 | 0.0086 [0.0024, 0.0308] | Cardoso (2001) [16] |
| 130 | Centro | 1 | 10 | 119 | 0.1270 | 0.0462 [0.0266, 0.0790] | Cardoso (2001) [16] |
| 115 | Centro/Coimbra | 0 | 5 | 110 | 0.5217 | 0.0217 [0.0093, 0.0498] | Guerreiro (2006) [47] |
| 52 | Centro/Viseu | 0 | 0 | 52 | 0.5000 | 0.0000 [0, 0.0356] | Costo-Matos (2013) [48] |
| 133 | Lisbon-Tagus Valley | 0 | 8 | 125 | 0.5513 | 0.0301 [0.0153, 0.0582] | Cardoso (2001) [16] |
| 129 | Norte | 1 | 13 | 115 | 0.2022 | 0.0581 [0.0355, 0.0936] | Cardoso (2001) [16] |
| 68 | Norte/Porto | 0 | 4 | 62 | 0.5212 | 0.0282 [0.0010, 0.0702] | Porto (1998) [49] |
| 146 | Norte/Porto | 1 | 8 | 137 | 0.0773 | 0.0342 [0.0187, 0.0618] | Cardoso (2006) [50] |
| Region/country | Allele frequency |
|---|---|
| Galicia/Spain | 0.0500 |
| Cantabria/Spain | 0.0446 |
| Norte/Portugal | 0.0419 |
| Valencia/Spain | 0.0372 |
| Asturias/Spain | 0.0346 |
| Catalonia/Spain | 0.0312 |
| Lisbon-Tagus Valley/Portugal | 0.0301 |
| Castile-La Mancha/Spain | 0.0300 |
| Extremadura/Spain | 0.0296 |
| Basque Country/Spain | 0.0290 |
| Centro/Portugal | 0.0286 |
| Alentejo/Portugal | 0.0227 |
| Madrid/Spain | 0.0200 |
| Algarve/Portugal | 0.0086 |
| Murcia/Spain | 0.0068 |
Disclaimer/Publisher’s Note: The statements, opinions and data contained in all publications are solely those of the individual author(s) and contributor(s) and not of MDPI and/or the editor(s). MDPI and/or the editor(s) disclaim responsibility for any injury to people or property resulting from any ideas, methods, instructions or products referred to in the content. |
© 2026 by the authors. Licensee MDPI, Basel, Switzerland. This article is an open access article distributed under the terms and conditions of the Creative Commons Attribution (CC BY) license.


