
Submitted:
05 January 2026
Posted:
06 January 2026
Read the latest preprint version here
Abstract
The aim of this study was the validation of the published method for the estimation of the personal maximum manual handling weight limit (PMHWLmax) [1] which is based on the personal body weight, as a reference to general population percentiles anthropometrics. For this purpose, an experiment was designed, were a repetitive process of transferring progressively increasing loads, was performed, with the aim of identifying through EMG recording of the erector spinae muscle, the load that brings about the first distinct quantity change in muscle activation and fatigue, compared to the preceding trials and afterwards the matching of the specific load value with the body weight of the participant.
Keywords:
ergonomics
; occupational health and safety
; WMSDs
; electromyography
; anthropometrics
1. Materials and Methods
Subjects
Fifteen (15) healthy young adult male individuals aged 20-25 years were selected randomly, (Table 1).

Table 1.
Sample descriptive characteristics.
| N | Min | Max | Mean | SD | |
|---|---|---|---|---|---|
| BW | 15 | 64 | 114 | 84,47 | 14,618 |
| BMI | 15 | 20 | 37 | 28,34 | 5,343 |
| HEIGH | 15 | 1,67 | 1,91 | 1,7547 | ,05705 |
| Valid N (listwise) | 15 |
The experiment and the measurements carried out at the Laboratory of Biomechanics and Ergonomics, @ErgoMechLab – DPESS/Department of Physical Education and Sport Science, of University of Thessaly. The subjects were given an oral explanation of the testing procedures. Additionally, they were informed about the correct way to lift and position an object from/to the ground, as well as to hold it during the transfer and did familiarization trials before the start of the experiment. They were free from musculoskeletal problems and had no pathological condition. All the participants were occasionally physically active. Regular or high-level athletes were excluded.
Each examinee would have to lift a cubic box (crate 40 × 40X40cm) with a starting weight of 21kg from the ground and carry it 15m, turn and return to the starting point (total transfer distance 30m) and deposit it on the ground. Every 5 minutes of rest in a sitting position, he repeated the trials, adding +1kg each time, until he carried 30kg (a total of 10 trials).
The detection of muscle activation was done through EMG recording of the erector spinae muscle, bilaterally, during each trial.
2. Method
A wireless EMG system (Ultium EMG, 8-ch, Noraxon™ U.S.A. Inc.) were used to examine changes in muscle activation in the erector spinae muscle, bilaterally. Two sEMG bipolar electrodes were placed bilaterally at 2 finger width lateral from the proc. spinae of L1, in accordance with SENIAM guidelines [2]. The EMG signal was then processed and smoothened by band-pass filtering at 10-400 Hz (4th order Butterworth filter). A Fast-Fourier Transform (FFT) window analysis was applied to determine the cutoff frequencies. Further, the FFT was also used to obtain the mean power frequency (MPF). The signal amplitude of sEMG was rectified and calculated as root mean square (RMS) values. Subsequently, the MPF and RMS amplitude was used for statistical analysis.
Muscle fatigue of the selected muscles was estimated and calculated as the percentage difference in mean RMS referring to the half transfer route distance (15m) upon initiation of the ambulation (after lifting) and the mean RMS of the return transfer route of the ambulation (15m), (before placed down). Thus, the RMS amplitude growth rate (RMS%) and the frequency drop rate (MPF%) of the selected muscles, were calculated during each trial. The MPF% is used to confirm the presence of peripheral muscle fatigue in erector spinae, as changes in EMG frequency domain variables are strongly associated with muscle fiber conduction velocity (MFCV) [3], which in turn has been found to be related to changes in intracellular pH, and consequently peripheral fatigue [4].
Based on the analysis of each trial for each examinee, the RMS% and MPF% values were calculated and the trial in which there was a distinctly significant change in those values, compared to the previous trials, was identified. The load(Kg) corresponding to this trial was marked as dangerous (named, redFlag), so from then on, the specific person is overloaded. Thus, it is defined as the max safe load, the immediately preceding load(Kg) (named, greenFlag), (Table 2).
After collecting the greenFlag load for each examinee, the load matched with his body weight. This match correlated with the estimated load values which provides the PMHWLmax method and it is based on population anthropometrics (corresponding distributions, percentiles for Body weight), to validate the method.
3. Statistical Analysis
To examine the validity of the PMHWLmax method, a Pearson correlation coefficient was performed to mark the correlation level between the maximum safe load identified for everyone through the experiment, with the maximum safe load given by the PMHWLmax method based on their body weight. The primary data was analyzed in MATLAB® (R2015b, Mathworks Inc., Natick, MA, USA) and remaining data was analyzed using SPSS ver. 27.0 statistical program for Windows (SPSS Software, IBM Inc., Chicago, IL, USA). The level of significance was set at p < 0.05, with a confidence level (C.I.) set at 95%.
4. Results
Myoelectric Activity and Peripheral Fatigue
All participants showed a progressive increase in fatigue proportional to the increase in load between trials.
Table 2 shows the identification of the max safely transferred load (corresponding to greenFlag point) before the appearance of a distinct RMS% increase and MPF% decrease rate (redFlag), per person (Graf 1)
Table 2.
Estimation of the max safely transferred load (corresponding to greenFlag point) before the appearance of a distinct RMS% increase and MPF% decrease rate (redFlag), per person.
Table 2.
Estimation of the max safely transferred load (corresponding to greenFlag point) before the appearance of a distinct RMS% increase and MPF% decrease rate (redFlag), per person.
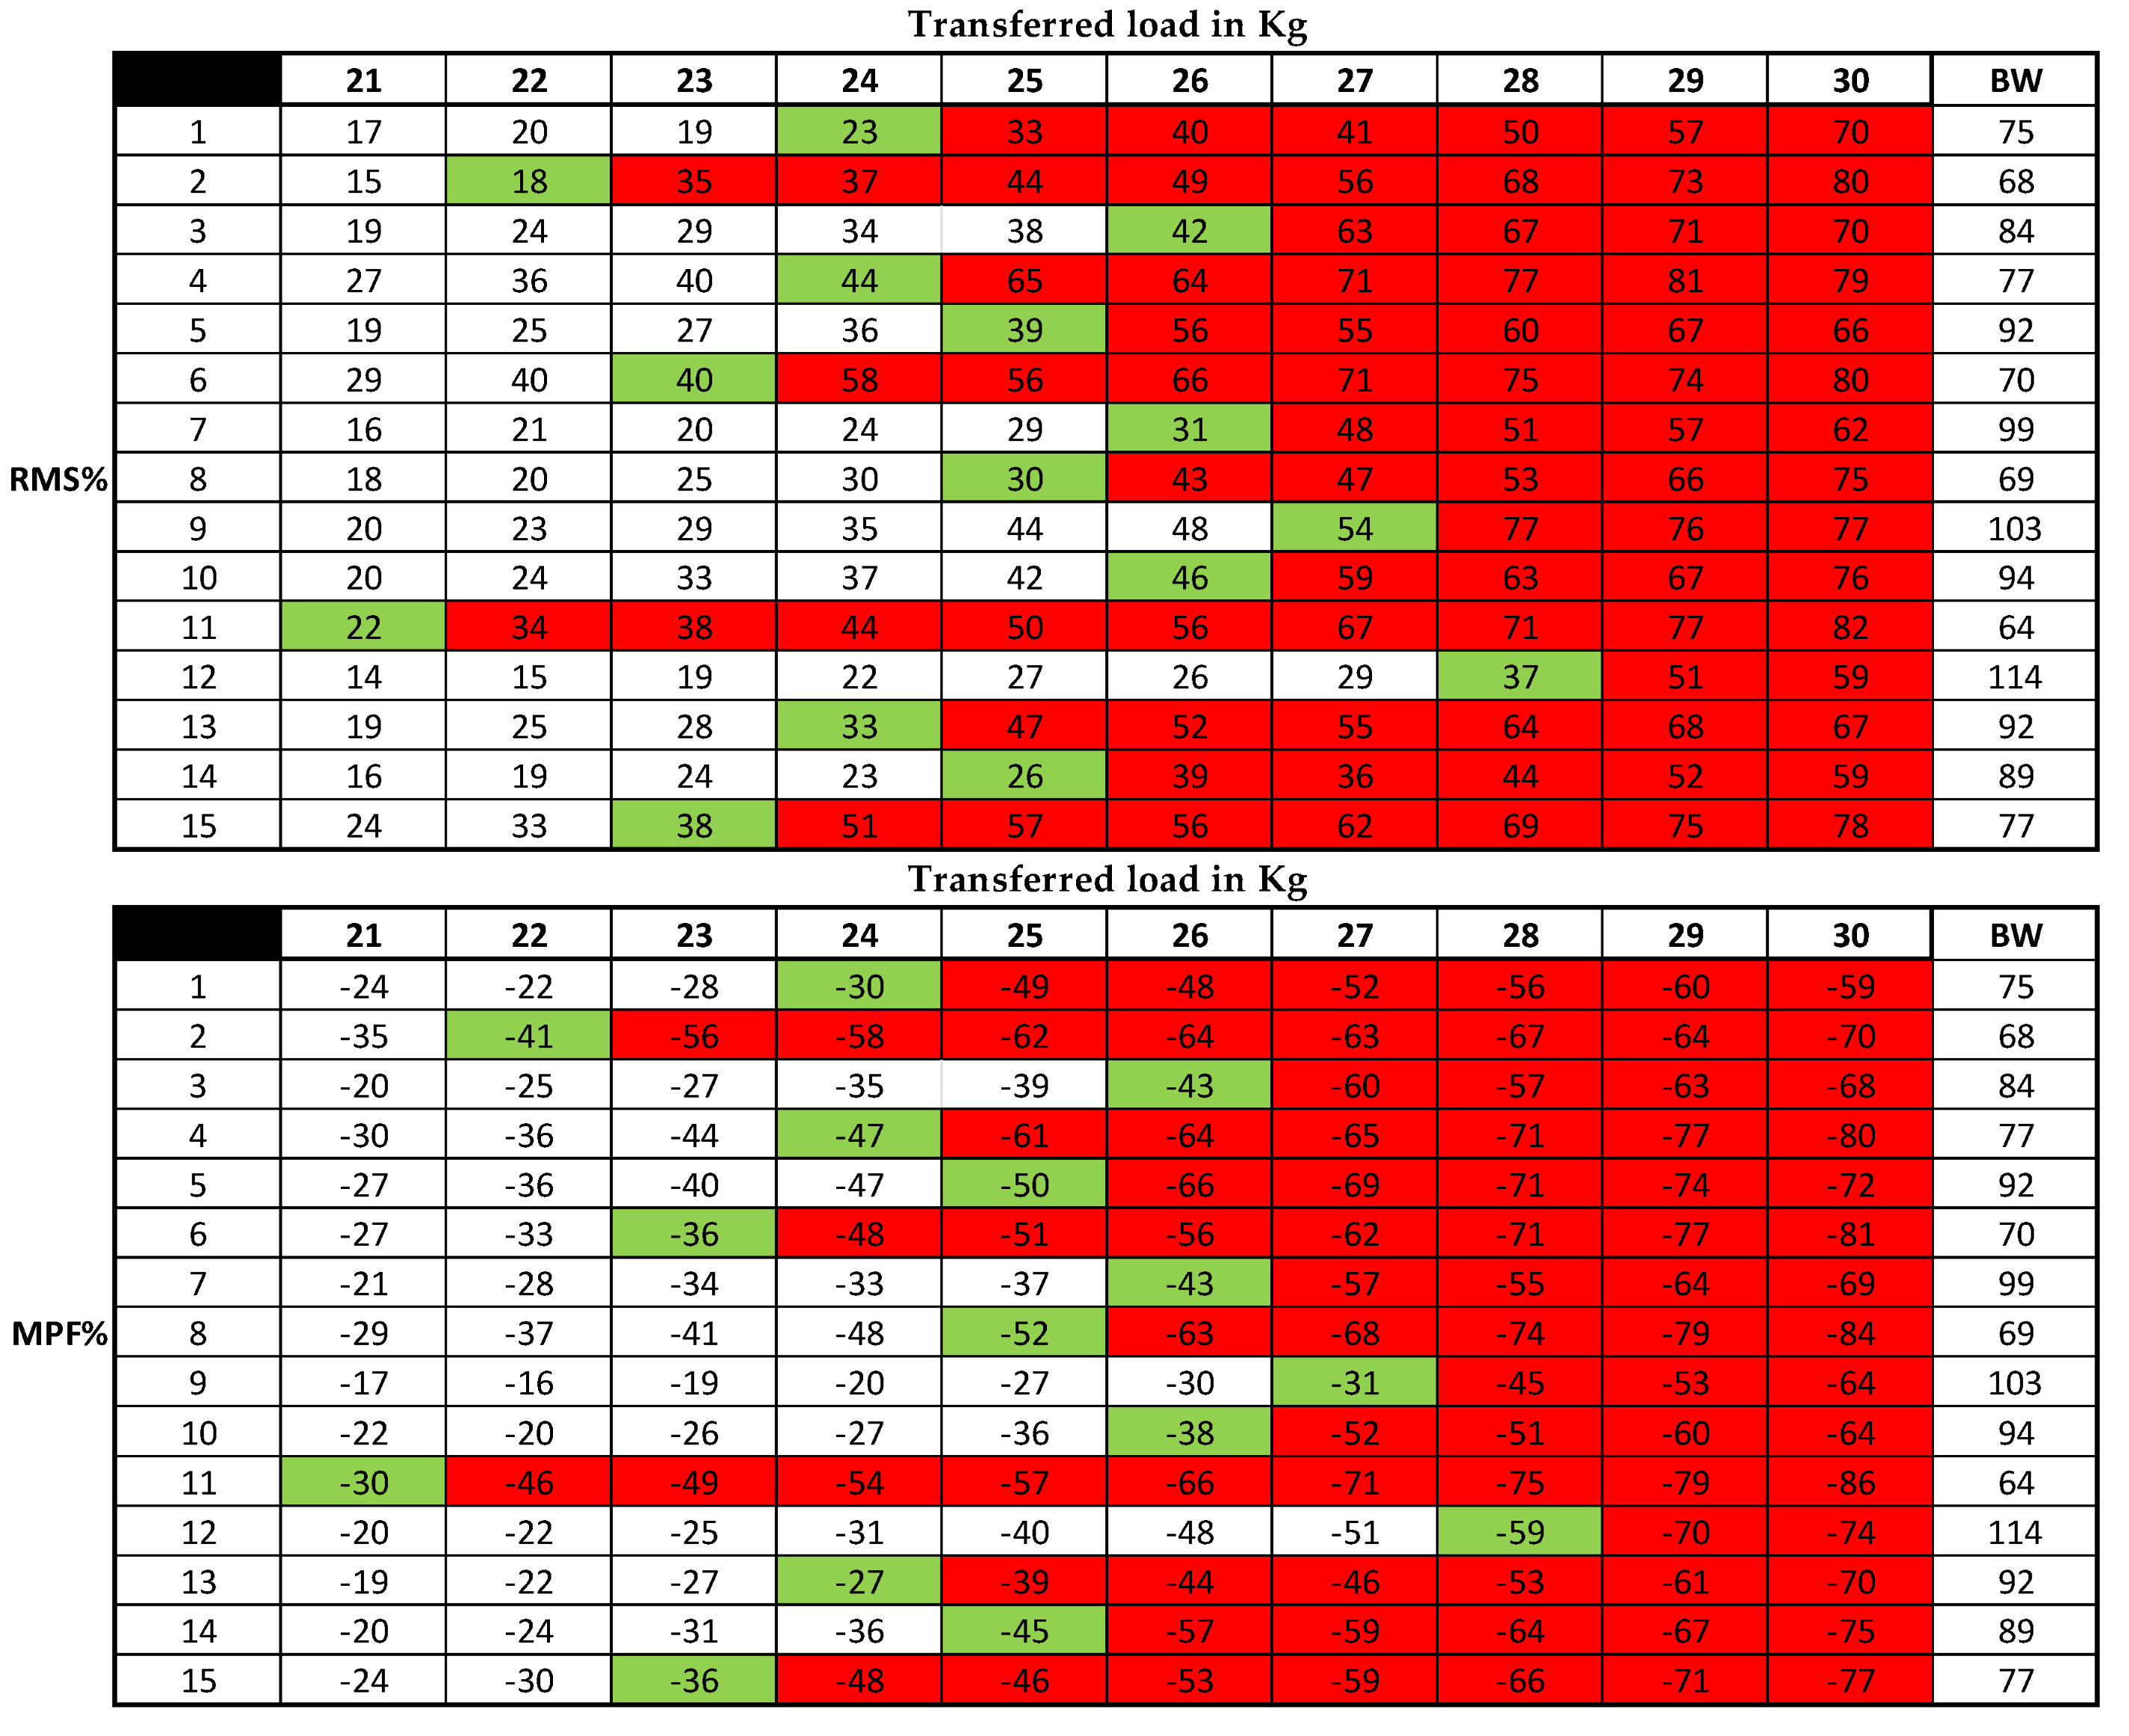
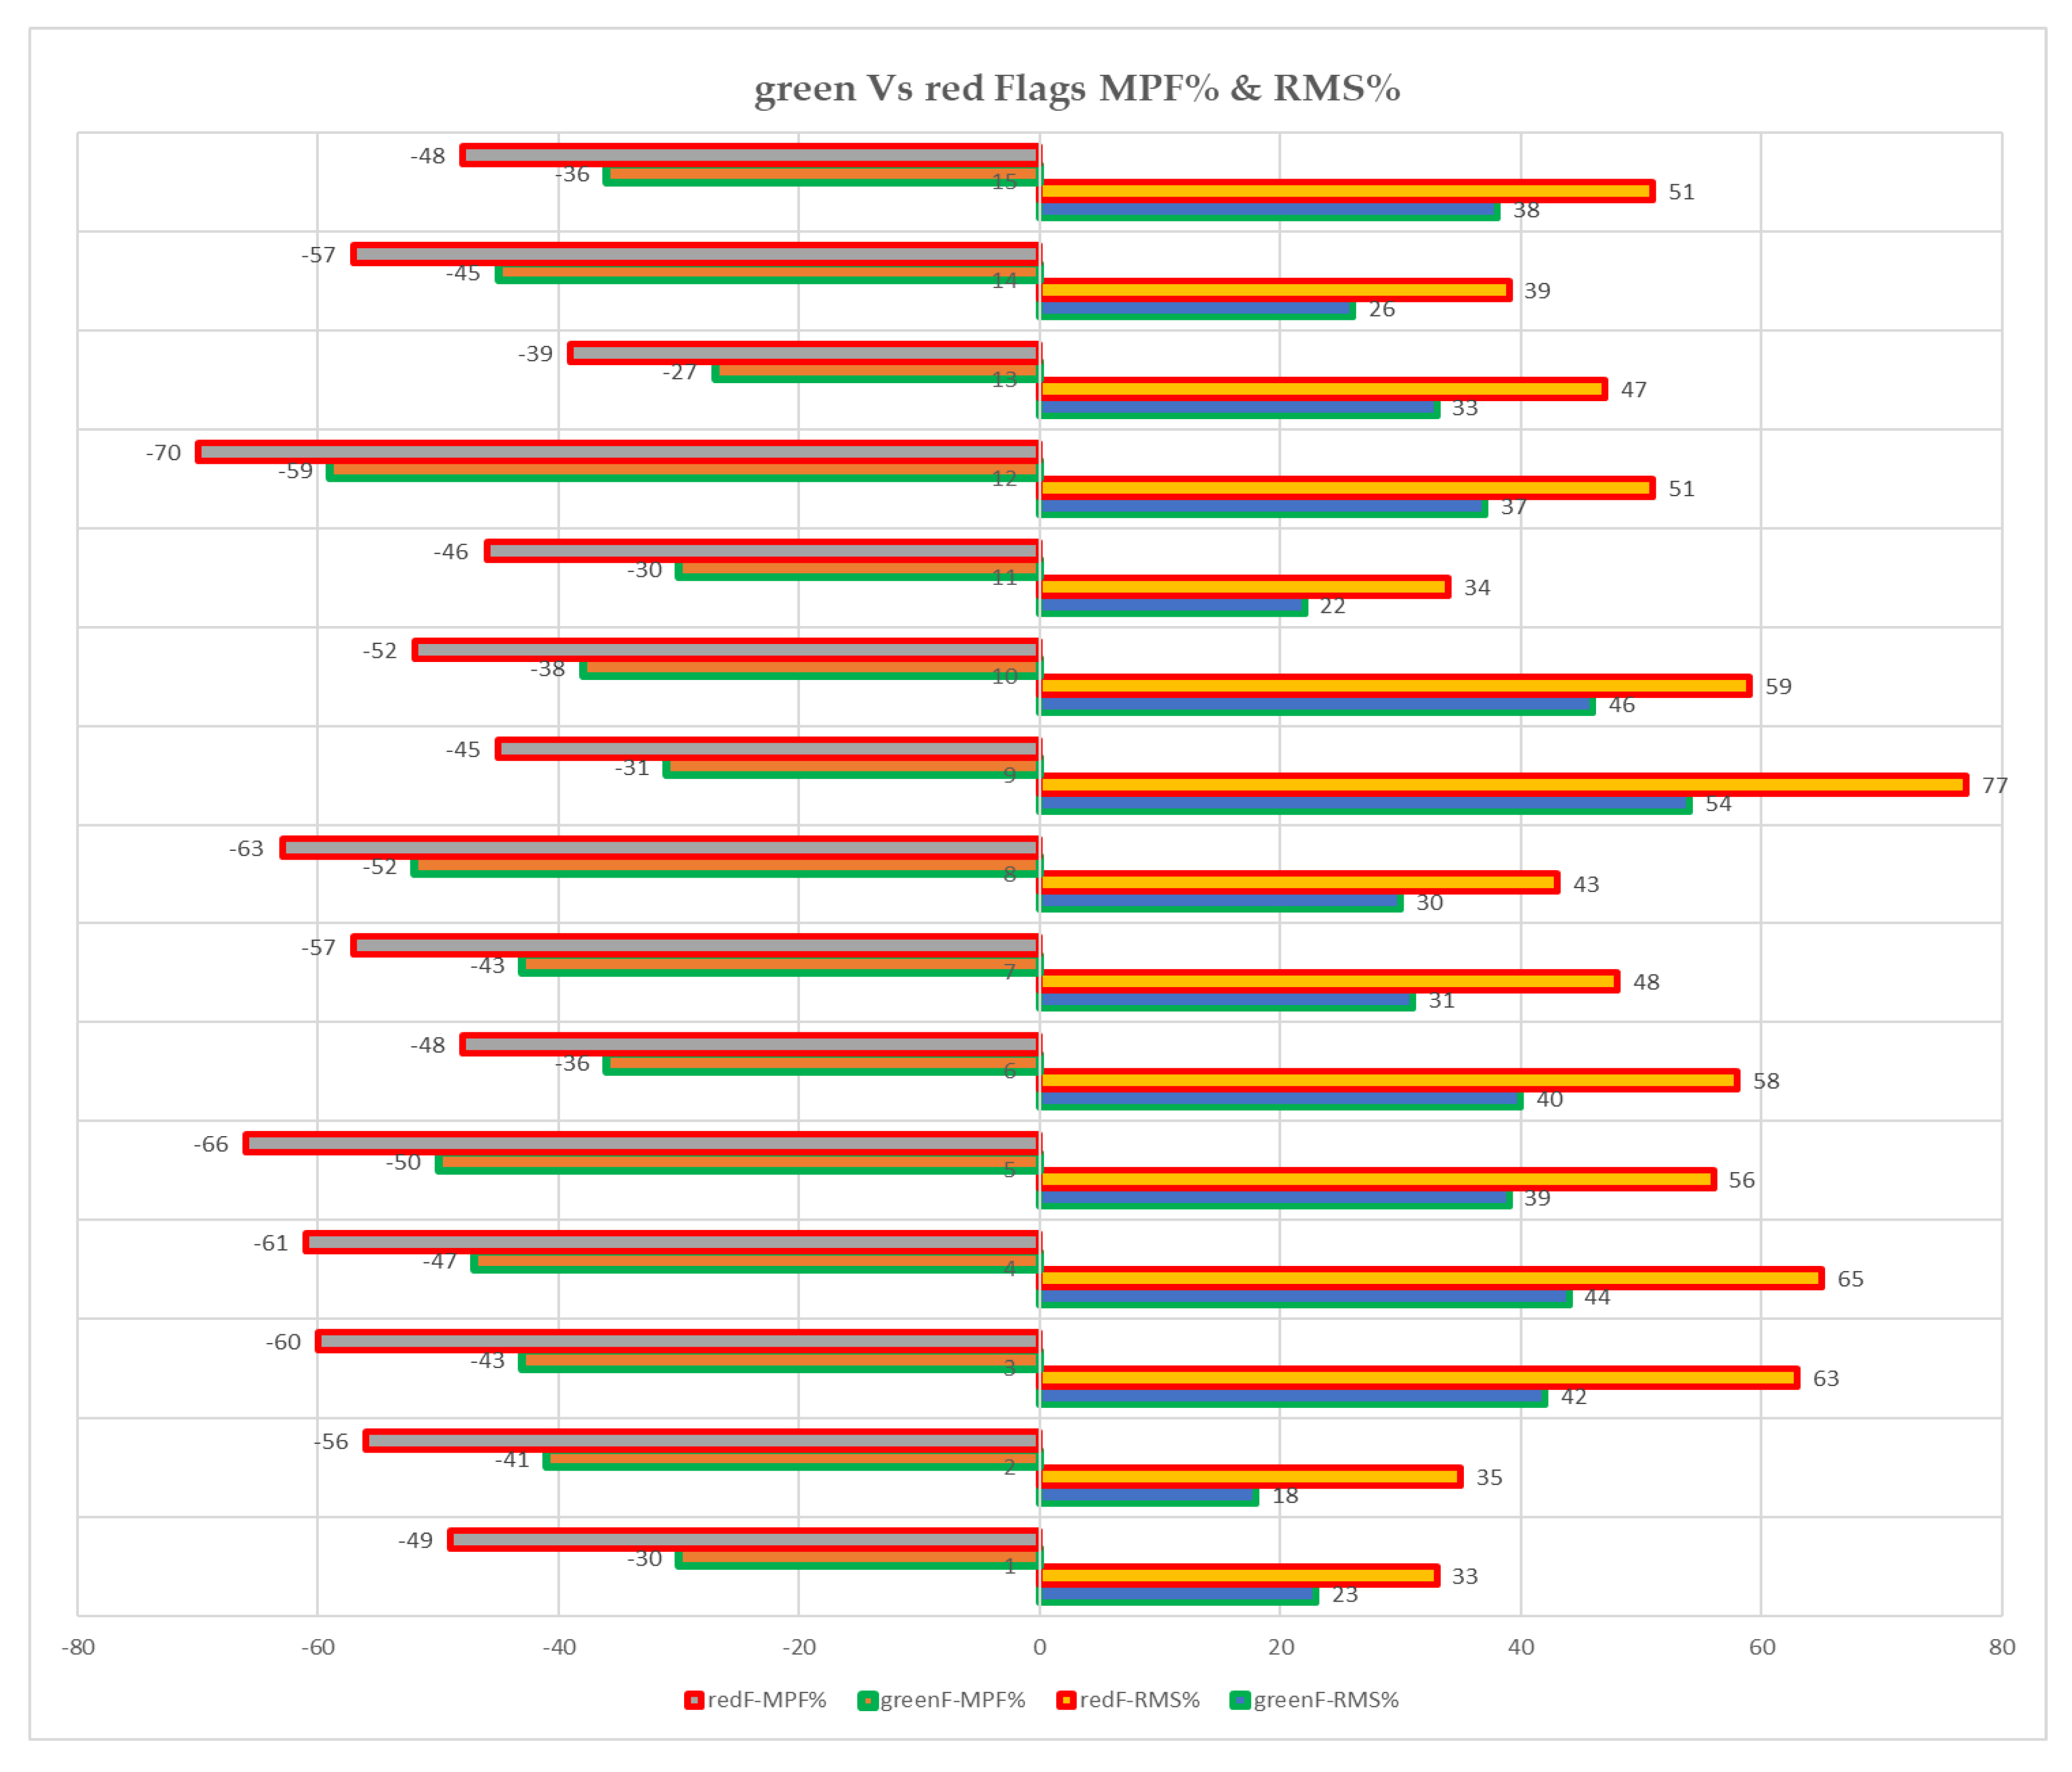
Figure 1.
the MPF% drop rate and RMS% increase rate, at the green vs. red Flag point, per person.
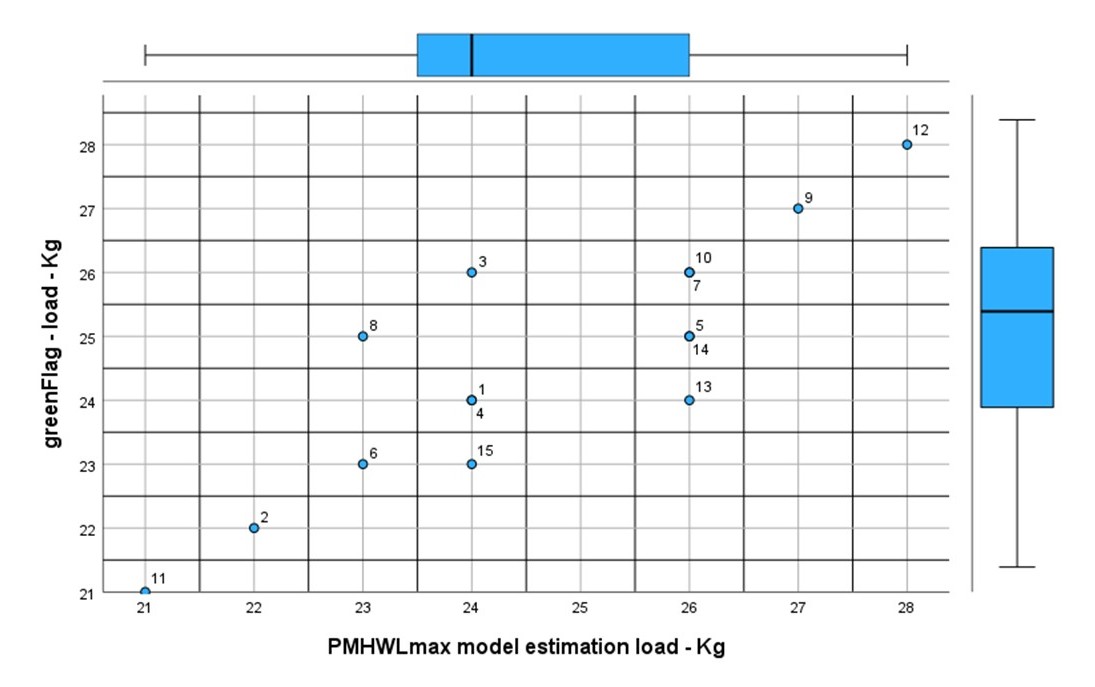
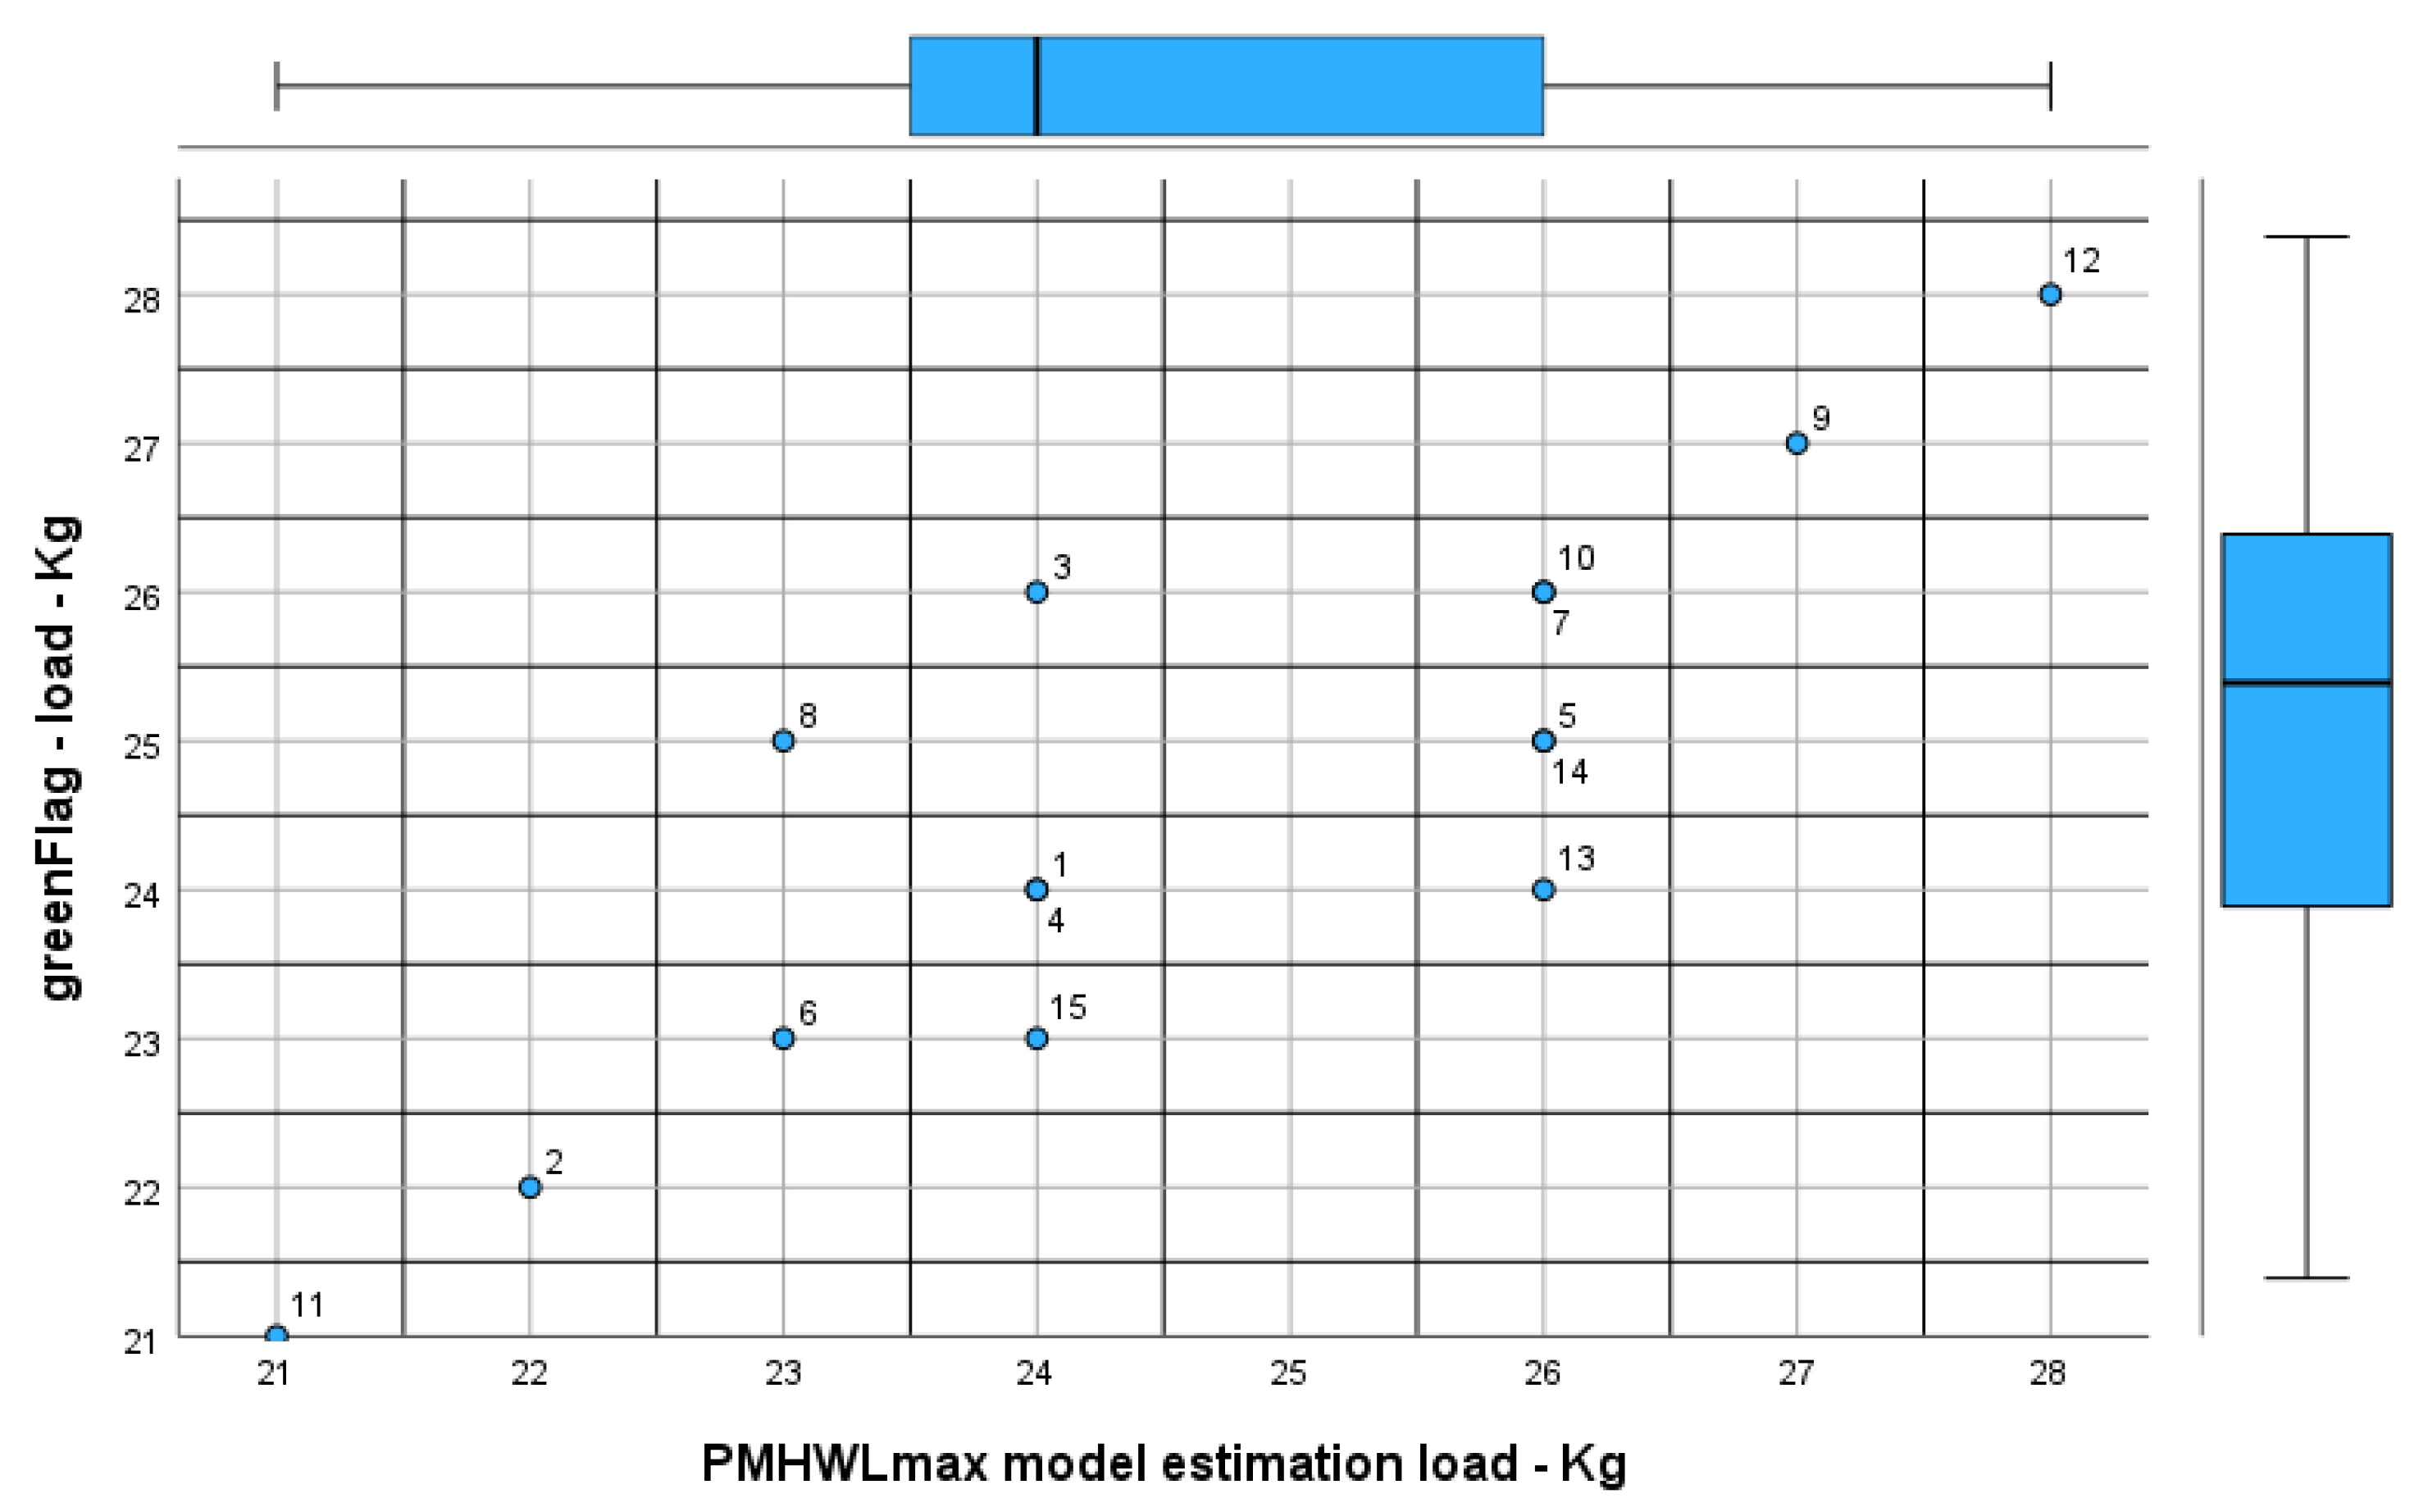
The correspondence between the greenFlag estimated
loadKg and the PMHWLmax model estimated loadKg, per
person, (Figure 2), provided a high correlation value of ,855 significant
at the 0.01 level (2-tailed) (Table 3).
Table 3.
Correlation between the greenFlag estimated loadKg and the PMHWLmax model estimated loadKg, per person.
Table 3.
Correlation between the greenFlag estimated loadKg and the PMHWLmax model estimated loadKg, per person.
| Correlations | greenFlag Loads | PMHWLmax Model Loads | |
|---|---|---|---|
| greenFlag loads | Pearson Correlation | 1 | ,855** |
| Sig. (2-tailed) | <,001 | ||
| N | 15 | 15 | |
| PMHWLmax model loads |
Pearson Correlation | ,855** | 1 |
| Sig. (2-tailed) | <,001 | ||
| N | 15 | 15 | |
| **. Correlation is significant at the 0.01 level (2-tailed). | |||
Figure 2.
correspondence between the greenFlag estimated loadKg and the PMHWLmax model estimated loadKg, per person (N=15).
Figure 2.
correspondence between the greenFlag estimated loadKg and the PMHWLmax model estimated loadKg, per person (N=15).
5. Conclusions
Based on the results of the experiment performed for the validity of the model PMHWLmax for the estimation for manual handling weight limits, which uses anthropometrics and specific load and task requirements, a high correlation (.855 p< ,oo1) between the calculated safe load values was shown, confirming through the quantitative approach of muscle loading and strain, the model PMHWLmax which is based on anthropometry.
Institutional Review Board Statement
N/A.
Informed Consent Statement
Informed consent was obtained from all subjects involved in the study.
Data Availability Statement
Data is unavailable due to privacy.
References
- Tsaklis, P. Manual handling weight limits, based on anthropometrics and specific load and task requirements. IETI TES 2025, 9, 9–13. [Google Scholar]
- Cram’s Introduction to Surface Electromyography, 2nd ed.; Criswell, E., Cram, J.R., Eds.; Jones and Bartlett: Sudbury, MA, 2011. [Google Scholar]
- Boccia, G.; Dardanello, D.; Tarperi, C. Decrease of muscle fiber conduction velocity correlates with strength loss after an endurance run. Physiol Meas 2017, 38, 233–240. [Google Scholar] [CrossRef] [PubMed]
- Beretta-Piccoli, M.; D’Antona, G.; Barbero, M. Evaluation of Central and Peripheral Fatigue in the Quadriceps Using Fractal Dimension and Conduction Velocity in Young Females. PLoS ONE 2015, 10, e0123921. [Google Scholar] [CrossRef] [PubMed]
Disclaimer/Publisher’s Note: The statements, opinions and data contained in all publications are solely those of the individual author(s) and contributor(s) and not of MDPI and/or the editor(s). MDPI and/or the editor(s) disclaim responsibility for any injury to people or property resulting from any ideas, methods, instructions or products referred to in the content. |
© 2026 by the author. Licensee MDPI, Basel, Switzerland. This article is an open access article distributed under the terms and conditions of the Creative Commons Attribution (CC BY) license.
Copyright: This open access article is published under a Creative Commons CC BY 4.0 license, which permit the free download, distribution, and reuse, provided that the author and preprint are cited in any reuse.


