
Submitted:
05 January 2026
Posted:
06 January 2026
You are already at the latest version
Abstract
Background/Objectives: Approximately 53.4 million U.S. adults aged 50 or older have low bone mass, yet male bone loss remains under-researched. This study evaluated the effects of one year of prune supplementation on bone health in osteopenic men. Methods: Fifty-nine men (55–80 years) were randomly assigned to one of three groups: 0 g prune (control), 50 g prune, or 100 g prune daily, along with 450 mg elemental calcium and 800 IU vitamin D₃. Dual-energy X-ray absorptiometry (DXA) scans and blood samples were collected at baseline, 3, 6, and 12 months. Results: No significant changes were observed in total bone mineral density (BMD) over one year. C-reactive protein (CRP) was significantly higher in the control group compared to the 50 g group at all time points. Osteo-protegerin (OPG) decreased significantly in all groups, however, the decrease was significantly greater in the control compared to both prune groups. Sclerostin (SOST) significantly increased over time in all groups, albeit to a greater degree in the control group. Tartrate-resistant acid phosphatase-5b (TRAP5b) increased in the 50 g and control group but remained stable in the 100 g group. Conclusions: Overall, prune supplementation did not improve BMD beyond that of the calcium and vitamin D₃ supplementation however, there was a modest effect on biomarkers of inflammation and bone metabolism.
Keywords:
prune
; osteopenia
; DXA
; supplementation
; men’s bone health
1. Introduction
Osteoporosis is a debilitating degenerative disease characterized by decreases in bone mineral density (BMD) and quality increasing the risk of fractures, decreasing activities of daily living and consequently, raising the risk of morbidity and mortality [1,2,3,4]. Approximate 53.4 million individuals, aged 50 or older, suffer from low bone mass in the United States. Furthermore, 10 million of these individuals have diagnosed osteoporosis and of these, 2 million are men (1,3,5). Moreover, men with osteoporosis have a higher mortality rate following a fracture and osteoporosis is usually diagnosed later in men compared to women [6,7]. Despite this knowledge, there is little research dedicated to male bone loss and osteoporosis.
As bone loss and osteoporosis progress, bone matrix weakens and becomes brittle due to the process of bone remodeling and, more specifically, a higher rate of bone resorption to bone turnover [8]. It is well documented that chronic inflammation and oxidative stress play a vital role in the development of this disease [3]. Inflammatory cytokines including tumor necrosis factor (TNF) alpha, interleukin 1, and interleukin 6 can activate osteoclastic activity that promotes bone resorption [9]. While there are targeted pharmacological treatment options (non-steroidal anti-inflammatory (NSAIDS), bone anabolics, anti-resorptives, etc. to help combat the deleterious effects of this disease, they often come with unwanted side effects and/or poor adherence. These can include, but are not limited to, upper gastrointestinal distress, musculoskeletal pain, and skin and urinary infections [2,4]. Therefore, there is a need for alternative therapies to target the effects of chronic inflammation and subsequent bone loss to combat this disease.
There is ample evidence that certain fruits and vegetables contain various cardiovascular and bone-protective polyphenols that combat damaging free radicals thus aiding in reductions of chronic inflammation [10,11,12]. Specifically, prunes have been shown to have one of the highest oxygen radical absorbance capacities (ORAC), or antioxidant activity, in comparison to various fruits and vegetables [3, 9,10, 12. 13]. Previous research has demonstrated that prunes positively impact various physiological systems including cardiovascular, neurological, and bone metabolism systems [14,15,16]. Regarding osteoporosis and bone loss, there is evidence to support prune’s bone-protective effects in animal models as demonstrated by Muhlbauer et al., and others [3,7,9,12,13]. With respect to human studies, Hooshmand et al., and our current laboratory, have produced positive findings with prune supplementation and improved bone density in post-menopausal women [16]. Specifically, Hooshmand et al. demonstrated a significant improvement in BMD of the ulna and spine with 100 g prune compared with 75 g dried apple during a one-year intervention [10,11]. However, these same therapy interventions, particularly functional food supplementation with prune, have not been fully assessed in a male population but are warranted due to the millions affected by bone loss [3].
The current study aims to evaluate the effects of one year of prune supplementation on bone health in osteopenic men. Changes in total body bone mineral density (BMD) was the primary outcome variable. Secondary outcome variables were biomarkers of inflammation and bone turnover.
2. Materials and Methods
2.1. Study Overview
This study is part of a series of investigations; therefore, the materials and methods have been similarly described by George et al. [3]. All individuals were recruited and screened from the greater Tallahassee area. For the present study, initial phone screenings were conducted to assess qualification and rule out any existing conditions/exclusion criteria. Following the phone screening, potential participants were scheduled for an on-site (Sandels Building Laboratory, College of Health and Human Sciences at Florida State University) screening that included both written and verbal explanation of the informed consent, medical history, dietary and exercise questionnaires, and anthropometrics (height, weight, and waist and hip circumferences). Additionally, a DXA scan of the lumbar spine (L1-L4) was assessed and analyzed by a licensed X-ray operator, under the supervision of a physician. A negative T-score BMD of -0.1 to -2.5 standard deviations (SD) below the mean was needed for qualification.
Upon enrollment, participants were assigned to one of three treatment groups: 1) zero g prune (control) 2) 50 g prune (low dose) or 3) 100 g prune. Each group was also supplemented with 450 mg elemental Ca+ and 800 IU vitamin D3 to provide some bone protection during the one-year enrollment.
Participants reported to the FSU Sandels Laboratory, between 6 am and 10 am for a baseline, 3-month, 6-month, and 12-month visit upon which the following data was collected: fasting venous blood draw, anthropometrics, 3-day dietary recall, and physical activity questionnaires. Additionally, DXA scans were performed for total body at baseline, 6-month, and 12-month visits. Upon completion of each visit, participants were provided with a three-month supply of supplementation (dried prunes and calcium/vitamin D3), per group assignment, and calendars to self-monitor compliance throughout the study. All study procedures were approved by the Institutional Review Board (STUDY00000885) at the Florida State University (Tallahassee, FL, USA). This clinical trial was registered at ClinicalTrials.gov: https://clinicaltrials.gov/study/NCT03408119.
2.2. Inclusion Criteria
Healthy men 55-80 years of age, with a lumbar (L1–L4) spine BMD t-score between -0.1 and -2.5 SD below the mean were included. Men who were not taking pharmacological agents known to affect bone and who had not initiated an exercise program known to influence bone, particularly strength training, within the last six months were enrolled in the study. Men who met the inclusion criteria were considered for enrollment regardless of ethnicity or race.
2.3. Exclusion Criteria
Men were excluded from the study who were receiving endocrine (e.g. prednisone, other glucocorticoids) or neuroactive (e.g. dilantin, phenobarbital) drugs or any drugs known to influence bone and calcium metabolism. Those who had initiated regular exercise regimens known to influence bone within the past 12 months prior to the study (e.g. resistance exercise training) were also excluded. Men whose BMD t-score at any site fell below 2.5 SD of the mean were excluded. Additionally, those treated with calcitonin, bisphosphonates, denosumab, raloxifene, anabolic agents (e.g. PTH and growth hormone) or steroids within a year prior to the start of the study were excluded. Men with metabolic bone disease, renal disease, cancer, cardiovascular disease, diabetes mellitus, respiratory disease, gastrointestinal disease, liver disease, or other chronic diseases were excluded. Potential participants with a body mass index (BMI) < 18 and > 40 kg/m2 were excluded to avoid extremes in leanness/adiposity. Men who smoked 20 cigarettes per day or more and/or regularly consumed prune or prune juice were also excluded.
2.4. Intervention
Qualified participants were randomly placed into one of three treatment groups determined by an Excel pre-generated randomization list.: A) 100 g prune B) 50 g prune or C) zero g prune (control). Previous research by Hooshmand et al. has shown doses of 50 g and 100 g to be well tolerated in the postmenopausal female population [10,11,16]. However, due to the laxative potential of prunes, participants were asked to gradually increase daily dosing at the start of the study. Each group was also supplemented with 450 mg elemental Ca+ (calcium diphosphate) and 800 IU vitamin D3 to provide some protection from bone loss throughout the duration of the study. Sample sizes per group were as follows: N = 23 in group A, N = 23 in group B, and N = 13 in group C.
The supplemental dosing of 450 mg elemental Ca+ (calcium diphosphate) and 800 IU vitamin D3 was determined based on current Recommended Dietary Allowances (RDA), (men aged 51-70 1000 mg/day Ca+, , 600 IU vitamin D3 ; men aged 71 and older 1200 mg/day Ca+ , 800 IU D3 ) as well as average daily intake from food for men of this age range [17]. Previous research supports the current dosing of 50 g and 100 g of prunes, demonstrating a positive influence on bone density, particularly in the ulna and lumbar spine, as well as bone metabolism biomarkers suggesting a suppression in rate of bone turnover [11].
The prunes were donated and packaged in snack pack size by the California Prune Board. The Vitamin D3 and Ca+ were donated by Shaklee Corporation. All supplementation was provided free of cost to enrolled participants for the duration of the study.
2.5. Compliance
Compliance was monitored via a daily dosing calendar completed by the participants and returned at each time point. This allowed participants to mark missed doses and the reason for missing them. Participants were also contacted randomly throughout the study to encourage compliance and were asked to return any remaining prunes and unused calcium and vitamin D3 supplements at the 12-month final timepoint. Participants were required to meet > 80% of their daily overall dosing to be considered compliant and included in the data set.
2.6. Questionnaires
2.6.1. Health and Medical History
A detailed health and medical history was obtained during the screening and reviewed at the baseline visit to rule out any chronic conditions, medications, or bone health history that would be cause for exclusion from the study. If any new condition was presented during the duration of the enrollment that qualified as an exclusion criterion, participants would have been removed from the study.
2.6.2. Dietary Assessment
A three-day food record was used to assess dietary intake. Clear instructions, along with a sample 3-day log and serving size guidelines, were given to each participant at the screening visit. Participants then completed the record prior to all testing days (baseline, 3, 6, 12 months). Each record was reviewed and collected at subsequent visits. The record included two weekdays and one weekend day, to capture an estimate of average daily intake, consistency, and to monitor compliance of the supplement. For analysis, the Food Processor Version 11.11.32, database structure 11.11.10 was used (Salem, OR).
2.6.3. Physical Activity
The Five -City Project Physical Activity Questionnaire was used to assess physical activity patterns, as well as sleep patterns and duration, throughout the study timeline. At each time point, participants were asked to report total hours spent during the weekdays and weekend days on leisure, home activities (e.g. housework), and occupational tasks as well as the intensity level of each activity ranging from light to very intense [3,18]. Questions regarding sleep hours during the weekdays and weekends were also recorded. The data was analyzed to determine consistency of activity and sleep throughout enrollment. Initiation of an exercise training program, strength in particular, during enrollment would have been grounds for exclusion and removal from the study or any enrolled participant.
2.7. Vitals
Resting blood pressure and resting heart rate were recorded via an automated blood pressure/heart rate monitor (OMRON Hem 907XL IntelliSense Professional, Kyoto, Japan) following ten minutes of seated rest. Participants were instructed to sit upright with feet flat on the ground and left arm extended out at heart level with support. Three measurements were assessed, and the calculated mean recorded for statistics.
2.8. Anthropometrics
Body weight was measured via a digital scale (Seca Corporation, Chino, CA, USA) at all time points to monitor any significant fluctuations in size. Additionally, waist (measured via the horizonal plane midway between the lowest rib and the superior border of the right iliac crest) and hip circumferences (measured via the horizontal plane at the widest portion of the buttocks with the measuring tape parallel to the ground) were measured at each time point using a Gulick fiberglass measuring tape (Creative Health Products, Inc., Ann Arbor, MI, USA). For standardization purposes, measurements were taken with participants standing feet together and arms by their side. Measurements were taken twice to account for accuracy within 1 cm of each other and mean was recorded.
2.9. Blood Collection and Processing
Fasting venous blood samples for plasma and serum analyses were collected via vacutainers at all time points. Samples were centrifuged at 3000× g for 15 min at 4 °C, aliquoted, and stored in a −80 °C freezer until analyses.
2.10. Bone Mineral Density (BMD)
BMD analyses were conducted by a certified X-ray technologist with physician oversite. Measurements for each subject included total BMD using the Lunar iDXA (GE Healthcare, Madison, WI, USA). Scans were performed at baseline, 6 month, and 12-month time points. All quality control, scan positions, and analyses were followed according to the Lunar iDXA Operator’s Manual with measurements performed using the “compare analysis” option.
2.11. Biomarkers of Inflammation
To assess the anti-inflammatory role of prunes, serum levels of C-reactive protein (CRP) were assessed at all time points using commercially available ELISA kits (R&D Systems, Minneapolis, MN, USA).
2.12. Bone Biomarkers
Osteocalcin, sclerostin (SOST) and TRAP-5b, were assessed in duplicate at all time points (baseline, 3, 6, 12 month) using commercially available ELISA kits (Quidel Biosystems, Mountain View, CA, USA, Bio-Techne, Minneapolis, MN (SOST)). SOST is a biomarker of osteocyte activity that acts to inhibit osteoblast activity.
TRAP5b is a biomarker of osteoclast activity and increased levels have been correlated with increased bone resorption [19]. Osteoprotegerin (OPG), a biomarker of bone formation that acts as a RANK-L inhibitor [20], was assessed in duplicate at all time points using commercially available ELISA kits (Quidel Biosystems, Mountain View, CA, USA).
2.13. Statistical Analyses
The efficacy of the treatment was tested through Multilevel Growth Curve Modeling using the R package nlme [21]. This approach can handle missing data and allows for heteroscedasticity. Time was coded 0, 1, 2, and 4 for baseline, 3-month, 6-month, and 12-month follow-up, respectively. The control group was used as the reference group. For each outcome, we estimated a time effect, a group effect comparing the 100 g condition with the control condition, a group effect comparing the 50 g condition with control condition, and two interaction effects testing the effect of time by each group. The restricted maximum likelihood (REML) estimation method was used to estimate the models. We estimated a series of models. First, we estimated a null model for each outcome to determine the intraclass correlation coefficient (ICC). We then estimated for each outcome a model including all four time points. We used R for descriptive statistics and the package ggplot2 [22] to visualize the results. Statistical significance was set at p<0.o5.
3. Results
3.1. Descriptives and Anthropometrics
For the present study, 330 initial phone screenings were conducted to assess qualification and rule out any existing conditions/exclusion criteria. 172 potential participants qualified for an on-site (Sandels Building Laboratory, FSU College of Education, Health, and Human Sciences at Florida State University) screening. Of the 172 on-site screenings, 62 healthy men aged 55-80 y qualified and were enrolled (Figure 1). Unfortunately, three participants were unable to complete the final 12-month visit due to COVID-19 complications and on-campus research protocol restrictions. Ultimately, 59 men completed the full 12-month protocol (defined as completing the 12-month DXA scans).
3.2. Anthropometrics
There were no significant differences in any anthropometric variable between groups at baseline or over time. Body mass index (BMI); waist circumference (WC); hip circumference (HC); waist to hip ratio (W:H ratio); RHR (resting heart rate in beats per minute); systolic blood pressure (SBP); diastolic blood pressure (DBP).

Table 1.
Means and standard errors for anthropometric (N=59).
| Variable | Baseline | 3-Month | 6-Month | 12-Month |
| Age (years) | 67.1 ± 0.8 | - | - | - |
| Height (cm) | 175.9 ± 0.9 | - | - | - |
| Weight (kg) | 81.5 ± 1.9 | 81.5 ± 1.9 | 81.4 ± 2.0 | 80.7 ± 2.0 |
| BMI (kg/m2) | 26.2 ± 0.5 | 27.2 ± 0.6 | 27.2 ± 0.7 | 25.6 ± 0.7 |
| WC (cm) | 96.3 ± 1.5 | 96.4 ± 1.6 | 96.0 ± 1.6 | 95.3 ± 1.6 |
| HC (cm) | 100.8 ± 1.8 | 102.5 ± 1.1 | 101.9 ± 1.1 | 101.6 ± 1.2 |
| W:H Ratio | 1.1 ± 0.1 | 0.9 ± 0.0 | 0.9 ± 0.0 | 0.9 ± 0.0 |
| RHR (bpm) | 66.0 ± 1.4 | 63.0 ± 1.2 | 63.0 ± 1.3 | 63.0 ± 1.6 |
| SBP (mm/Hg) | 135.0 ± 2.2 | 131.0 ± 1.9 | 133.0 ± 2.2 | 130.0 ± 2.2 |
| DBP (mm/Hg) | 77.0 ± 1.4 | 76.0 ± 1.2 | 76.0 ± 1.4 | 74.0 ± 1.4 |
3.3. Dietary Intake
The MLM growth curve analyses with time as within-subject factor revealed that there were no significant time effects for any dietary variables.
Table 2.
Means and standard errors for dietary intake (N=59).
| Variable | Baseline | 3-Month | 6-Month | 12-Month |
| Calories (kcal) | 2319.3 ± 126.9 | 2154.7 ± 122.8 | 2316.7 ± 180.2 | 2457.3 ± 108.2 |
| Carbohydrate (g) | 260.8 ± 19.0 | 264.5 ± 21.0 | 268.0 ± 32.6 | 279.7 ± 15.5 |
| Fat (g) | 114.7 ± 18.3 | 82.8.1 ± 6.1 | 99.4 ± 7.8 | 98.0 ± 4.6 |
| Protein (g) | 98.7 ± 5.9 | 96.1 ± 10.3 | 91.4 ± 6.3 | 101.0 ± 5.7 |
| Cholesterol (mg) | 322.8 ± 24.7 | 288.3 ± 37.8 | 341.3 ± 35.7 | 330.2 ± 25.4 |
| Sodium (mg) | 3885.2 ± 264.3 | 3220.4 ± 199.0 | 3686.7 ± 331.7 | 3841.4 ± 303.3 |
| Sugar (g) | 113.1 ± 16.0 | 106.6 ± 8.2 | 113.5 ± 18.7 | 123.1 ± 10.3 |
| Fiber (g) | 24.4 ± 1.6 | 24.7 ± 2.1 | 24.1 ± 3.0 | 25.9 ± 2.5 |
| Saturated Fat (g) | 27.5 ± 1.8 | 24.4 ± 2.3 | 29.9 ± 2.3 | 35.4 ± 5.7 |
| Polyunsaturated Fat (g) | 12.8 ± 0.97 | 14.2 ± 1.6 | 17.7 ± 2.0 | 15.0 ± 1.9 |
| Monounsaturated Fat (g) |
22.0 ± 2.1 | 22.2 ± 2.6 | 24.2 ± 1.8 | 24.2 ± 2.0 |
| Trans Fat (g) | 0.6 ± 0.2 | 0.7 ± 0.3 | 0.4 ± 0.1 | 0.4 ± 0.1 |
| Potassium (mg) | 3281.0 ± 382.1 | 2960.1 ± 243.8 | 3025.4 ± 386.1 | 2890.8 ± 252.9 |
3.4. Physical Activity
The average hours of physical activities per week are shown in Figure 2. Bars represent mean physical activity (hrs/wk) (± SE) at baseline, 3 months, 6 months, and 12 months for each group (100 g prunes, 50 g prunes, and control). The MLM analysis revealed no significant time effect for physical activity, that is, the groups did not differ on average, and they did not change significantly.
3.5. Sleep (Average Hours per Night)
Figure 3 illustrates the changes in average sleep per night. Bars represent mean hours of sleep per night (± SE) at baseline, 3 months, 6 months, and 12 months for each group (100 g prunes, 50 g prunes, and control). The MLM analysis revealed no significant effect for sleep, that is, the groups did not differ on average, and they did not change significantly.
3.6. Bone Mineral Density
Bars represent mean BMD (± SE) at baseline, 3 months, 6 months, and 12 months for each group (100 g prunes, 50 g prunes, and control). The ICC for bone mineral density was 0.924. This means that there was a large-sized correlation across the four-time points, indicating high stability. The changes in bone mineral density are illustrated in Figure 4. The MLM analysis revealed no significant effect for BMD, indicating that the groups did not differ on average and did not change across time, b = -0.0003, SE = 0.003, t(168) = -0.103, p = 0.918 for time, b = -0.022, SE = 0.035, t(67) = -0.630, p = 0.530 for group 100 g, b = -0.013, SE = 0.035, t(67) = -0.366, p = 0.716 for group 50 g, b = 0.004, SE = 0.004, t(168), = 1.061, p = 0.290 for the time by 100 g group interaction, and b = 0.005, SE = 0.004, t(168), = 1.140, p = 0.256 for the time by 50 g group interaction.
3.7. DXA T-Score
Bars represent mean DXA T-scores (± SE) at baseline, 3 months, 6 months, and 12 months for each group (100 g prunes, 50 g prunes, and control). For the DXA T-Scores, the ICC was 0.929, indicating that the correlation across the four time points was large in size. Figure 5 presents the changes in the DXA T-Scores. The MLM analysis showed no significant effect on DXA T-Scores. That is, the groups did not differ on average, and there was no significant change.
3.8. Serum Blood Biomarkers
3.8.1. High Sensitivity C-Reactive Protein
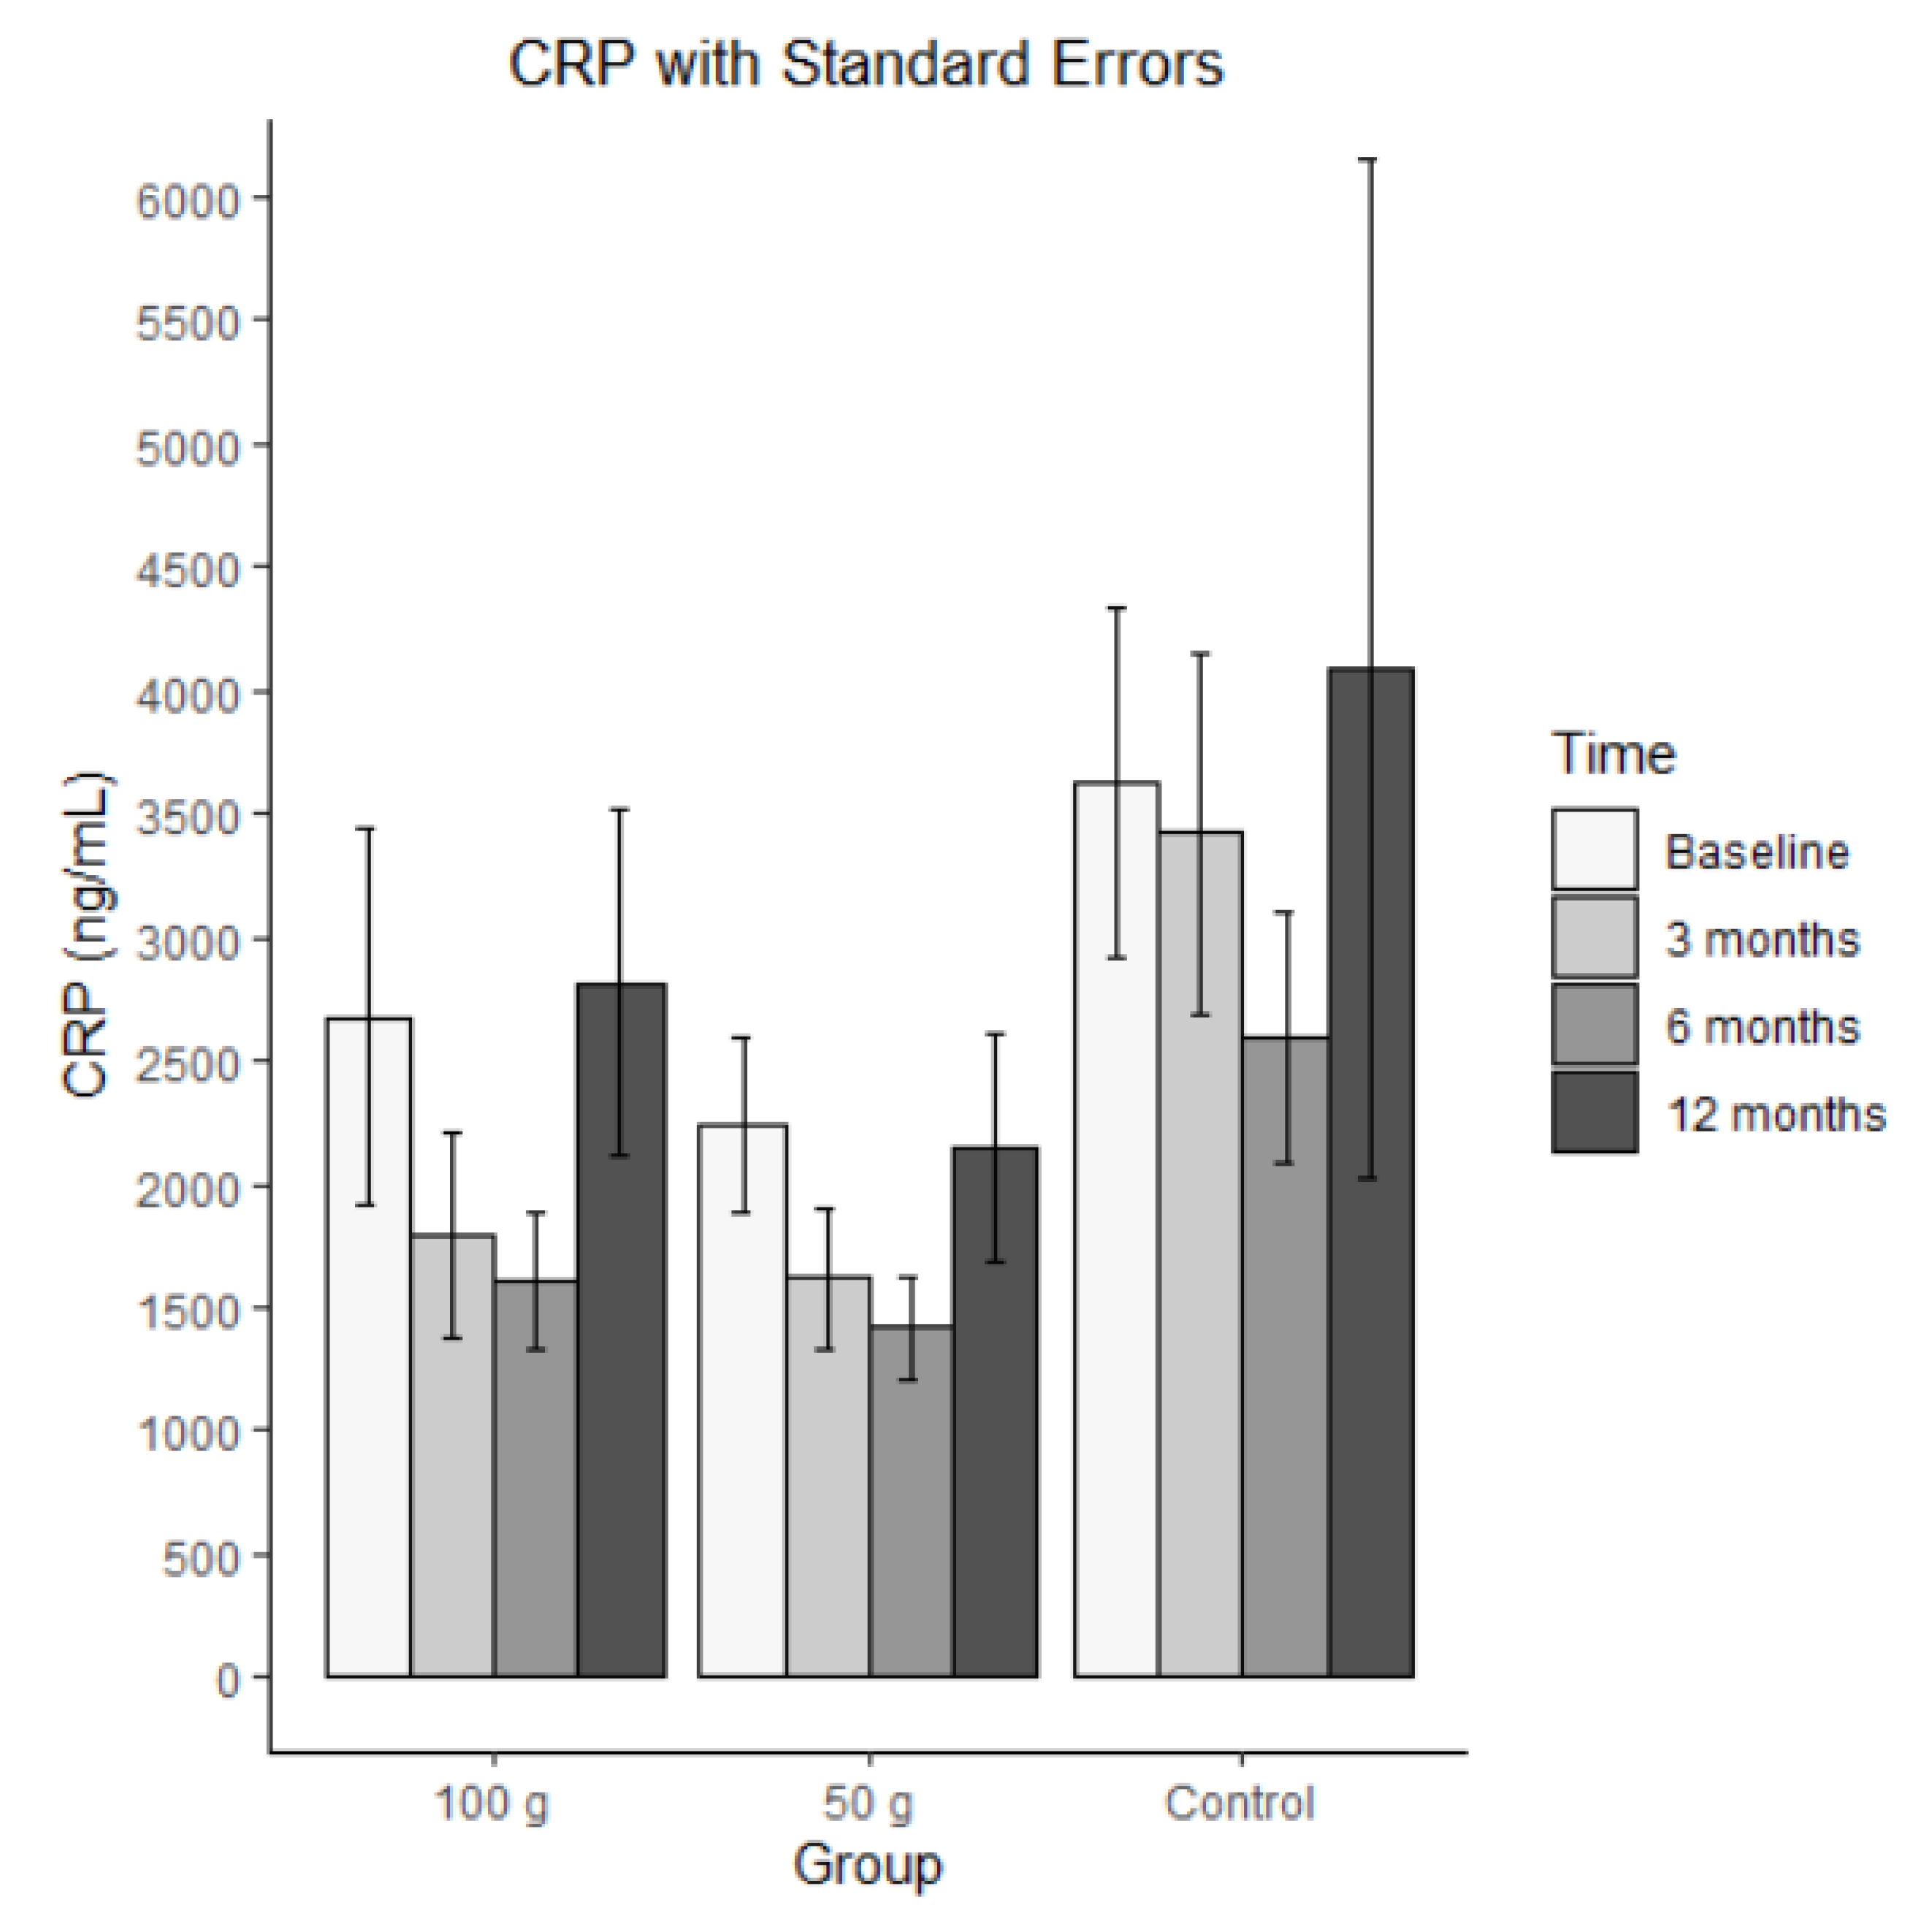
Bars represent mean CRP in ng/mL (± SE) at baseline, 3 months, 6 months, and 12 months for each group (100 g prunes, 50 g prunes, and control). The ICC for the C-reactive protein was 0.412, indicating that the repeated measures were highly correlated. There was a significant effect for group 50 g, meaning that individuals in the control group had, on average, significantly higher levels of CRP than individuals in the group 50 g. The other effects were not significant, suggesting that there was no significant change over time and no difference between the two treatment groups.
Figure 6.
Average C-reactive protein with standard errors.
3.8.2. OPG
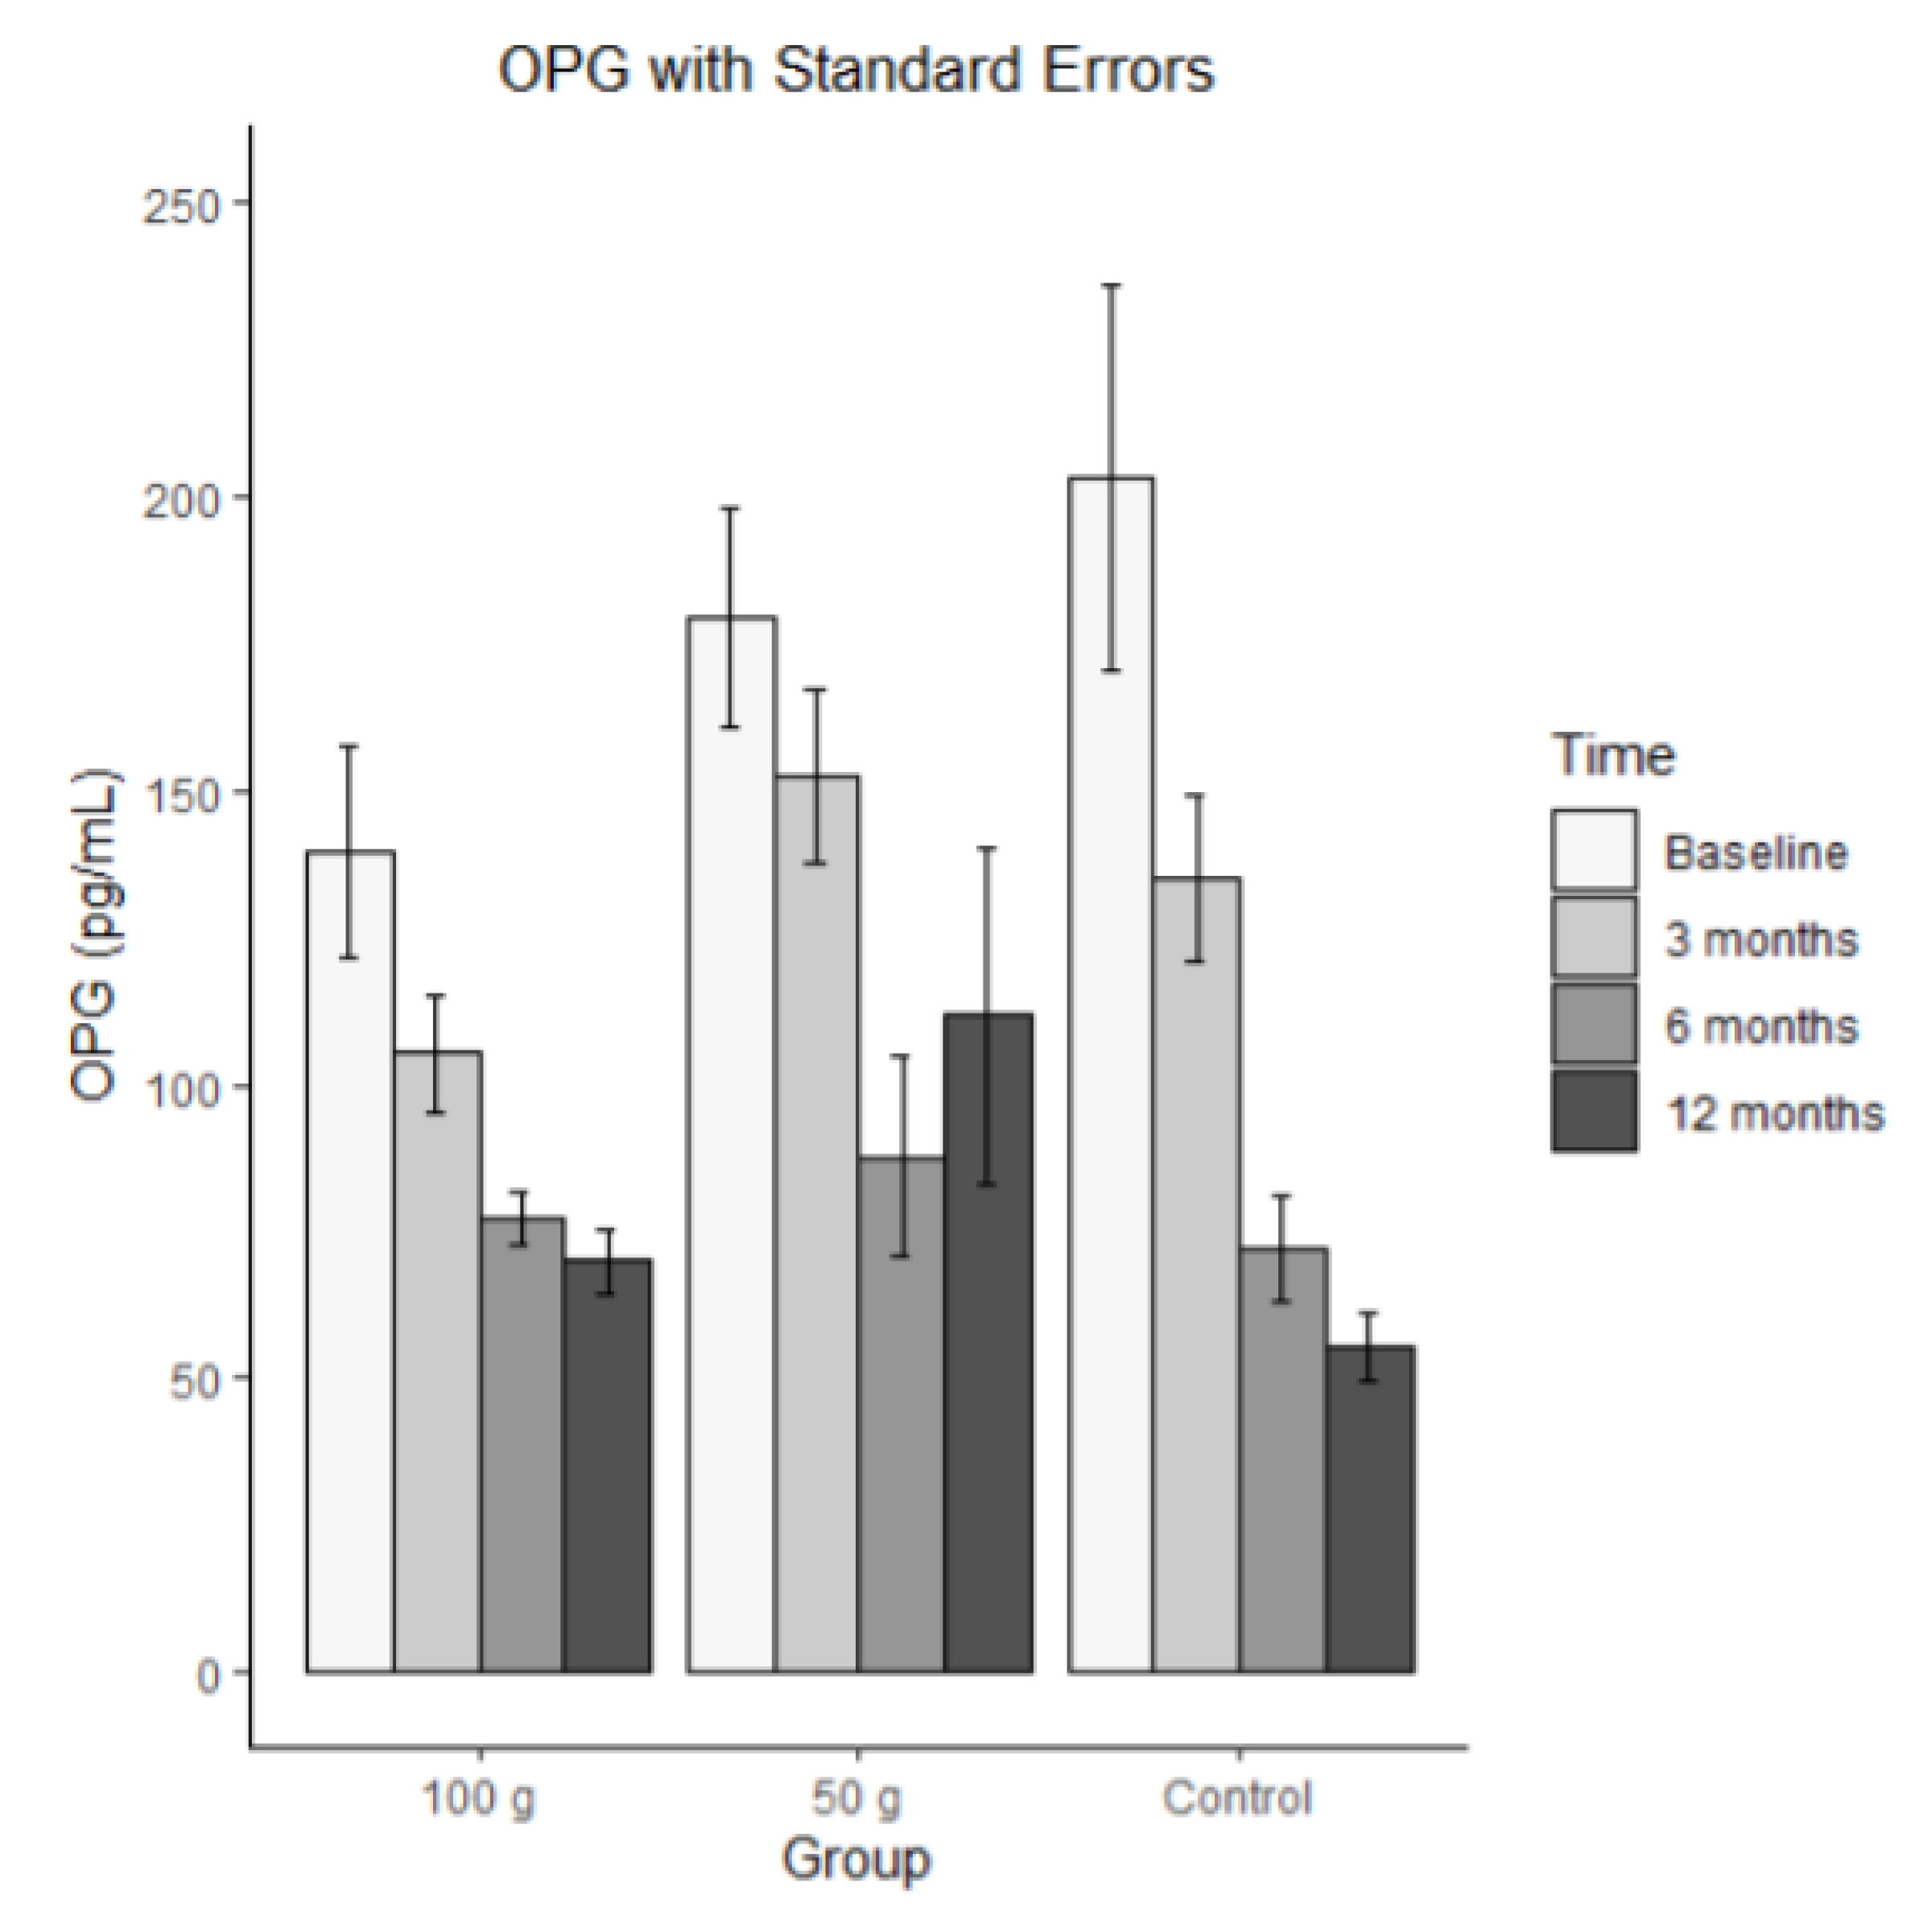
Bars represent mean OPG in pg/mL (± SE) at baseline, 3 months, 6 months, and 12 months for each group (100 g prunes, 50 g prunes, and control). For OPG, the ICC was 0.235, indicating that the repeated measures were substantially correlated. There was a significant time effect for OPG, and both time by group interaction effects were significant. These results indicate that OPG significantly decreased and that this decrease was significantly stronger in the control group than in the 100 g and 50 g groups. There was also a significant effect on the 100 g group, meaning that individuals in the 100g group had, on average, significantly higher scores than individuals in the control group. No such difference occurred between the 50 g group and the control group.
Figure 7.
Average OPG with standard errors.
3.8.3. Osteocalcin
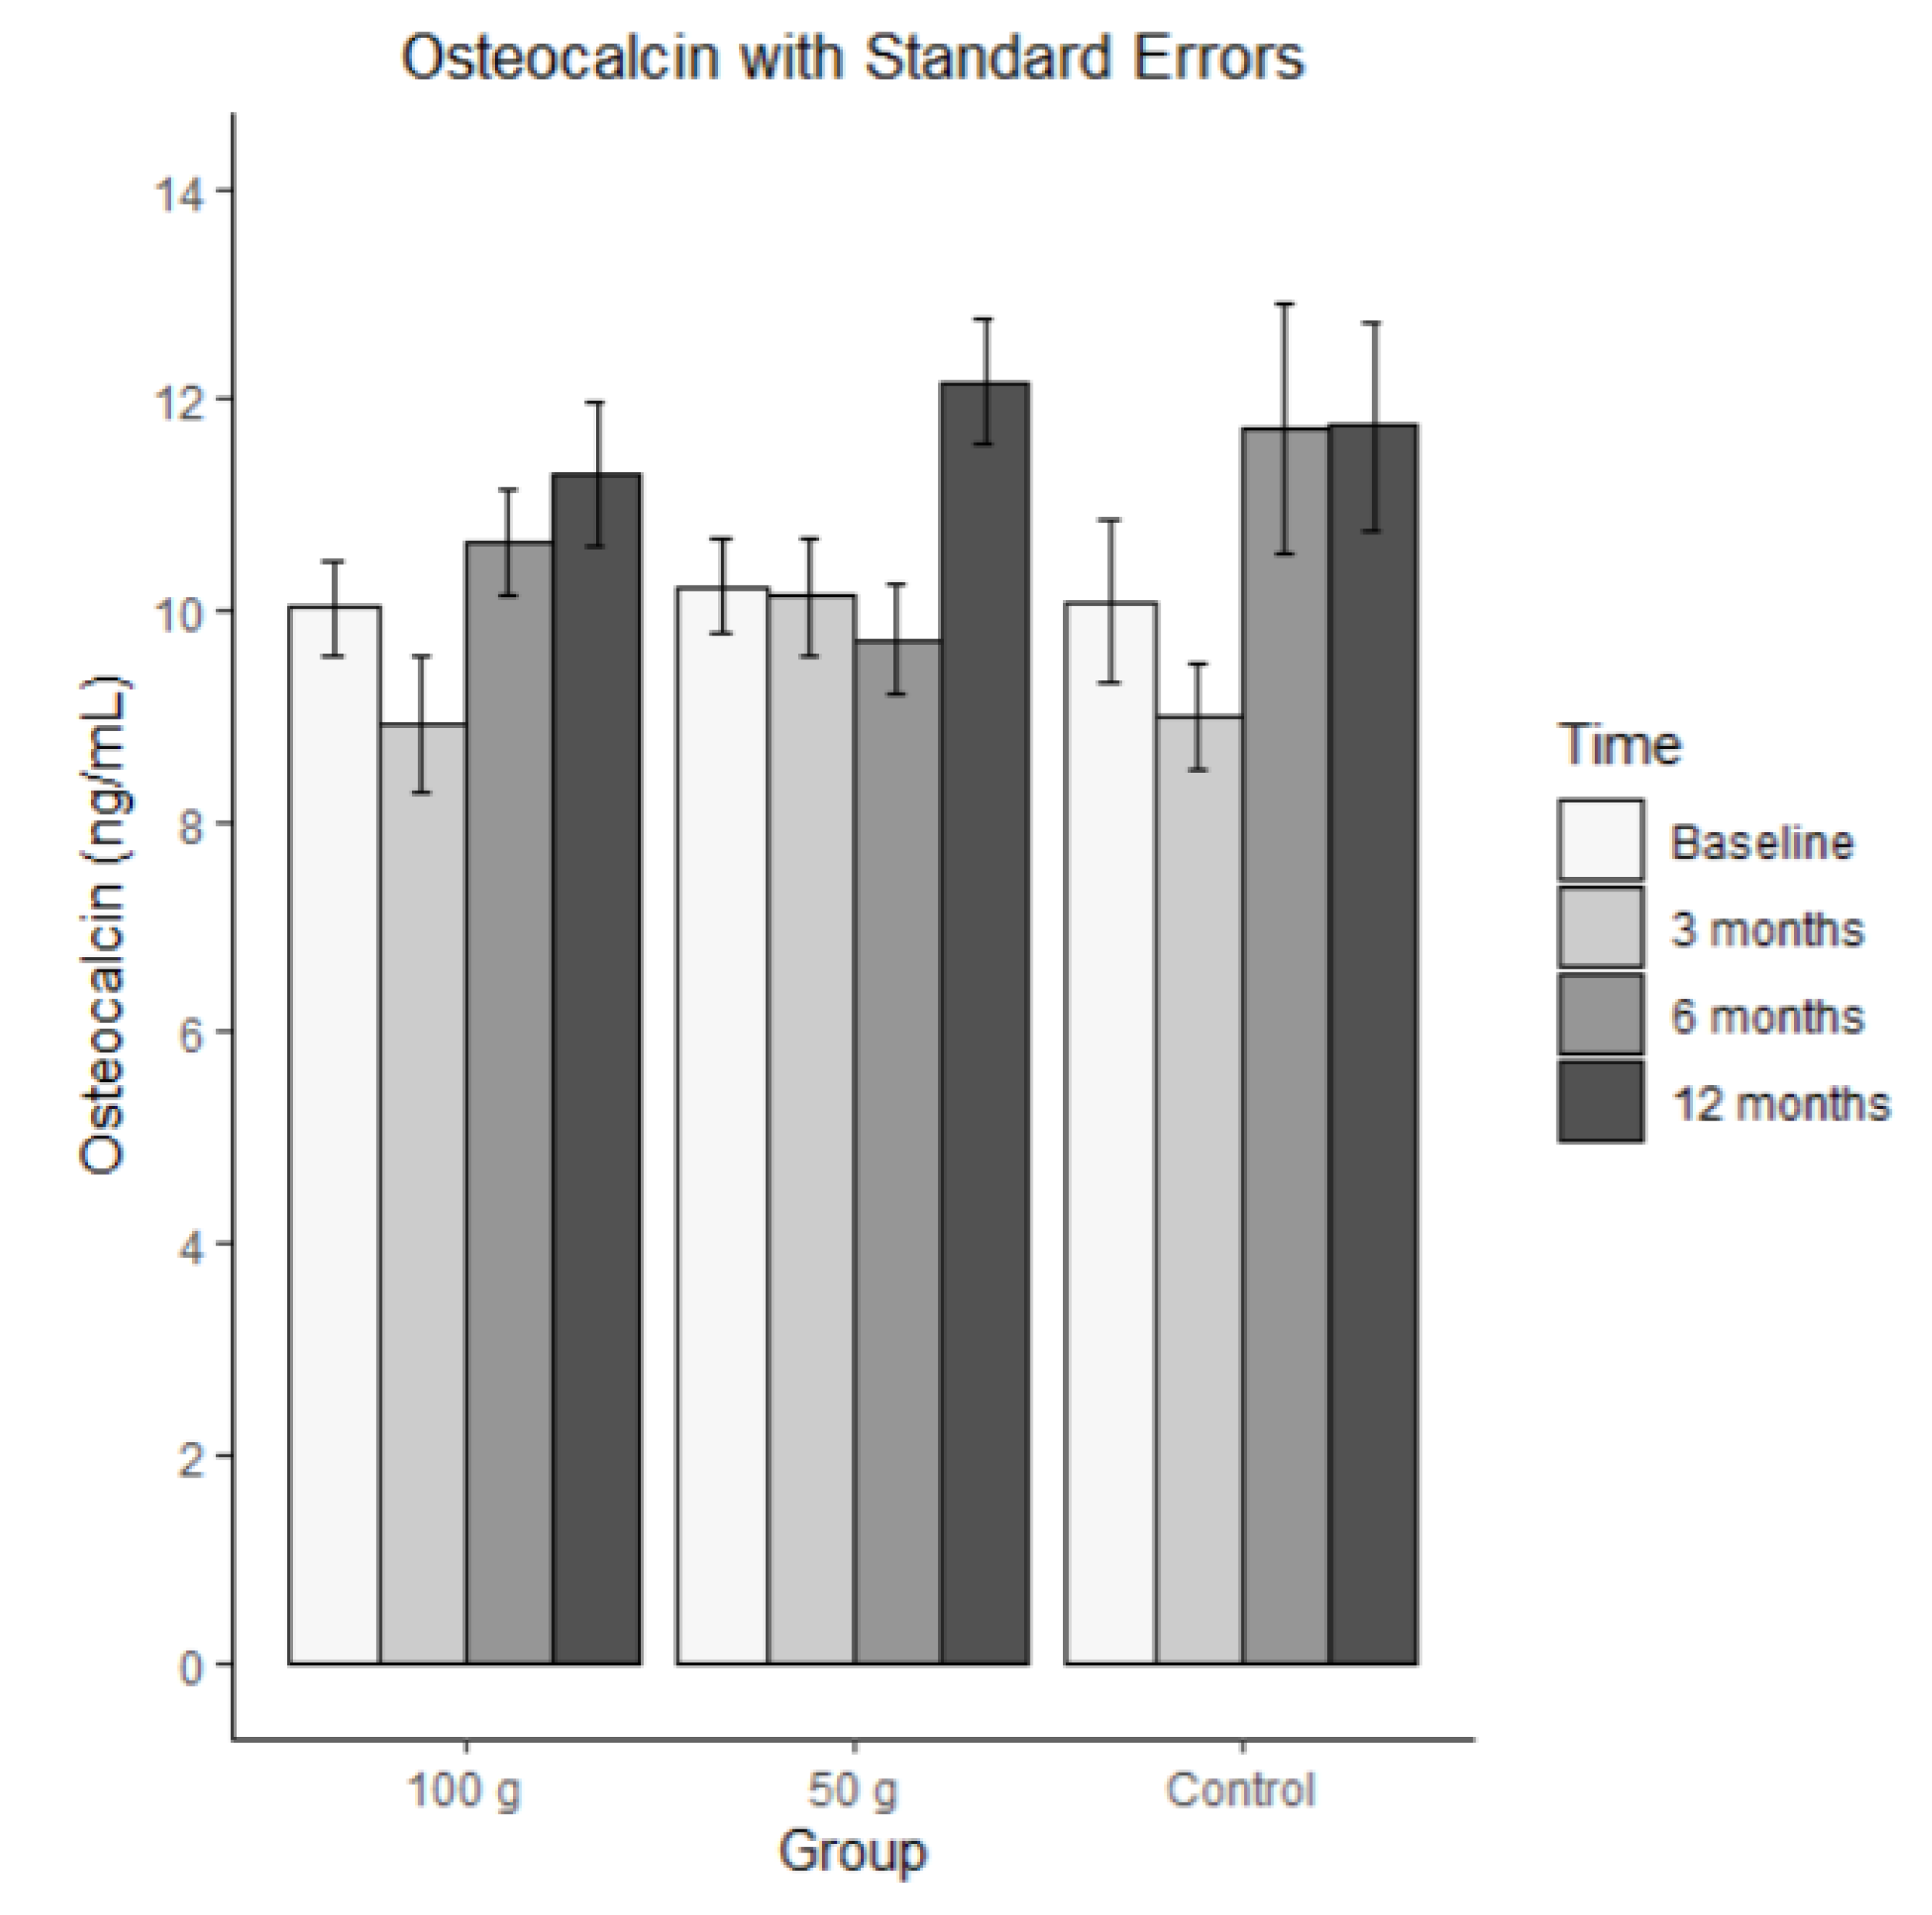
Bars represent mean osteocalcin in ng/mL (± SE) at baseline, 3 months, 6 months, and 12 months for each group (100 g prunes, 50 g prunes, and control). The ICC for osteocalcin was 0.469, meaning that there was a medium-sized correlation across the measurement points. The average osteocalcin levels are shown in Figure 8. The MLM analysis revealed that none of the effects were significant. That is, there was no significant change and no significant group difference.
3.8.4. SOST
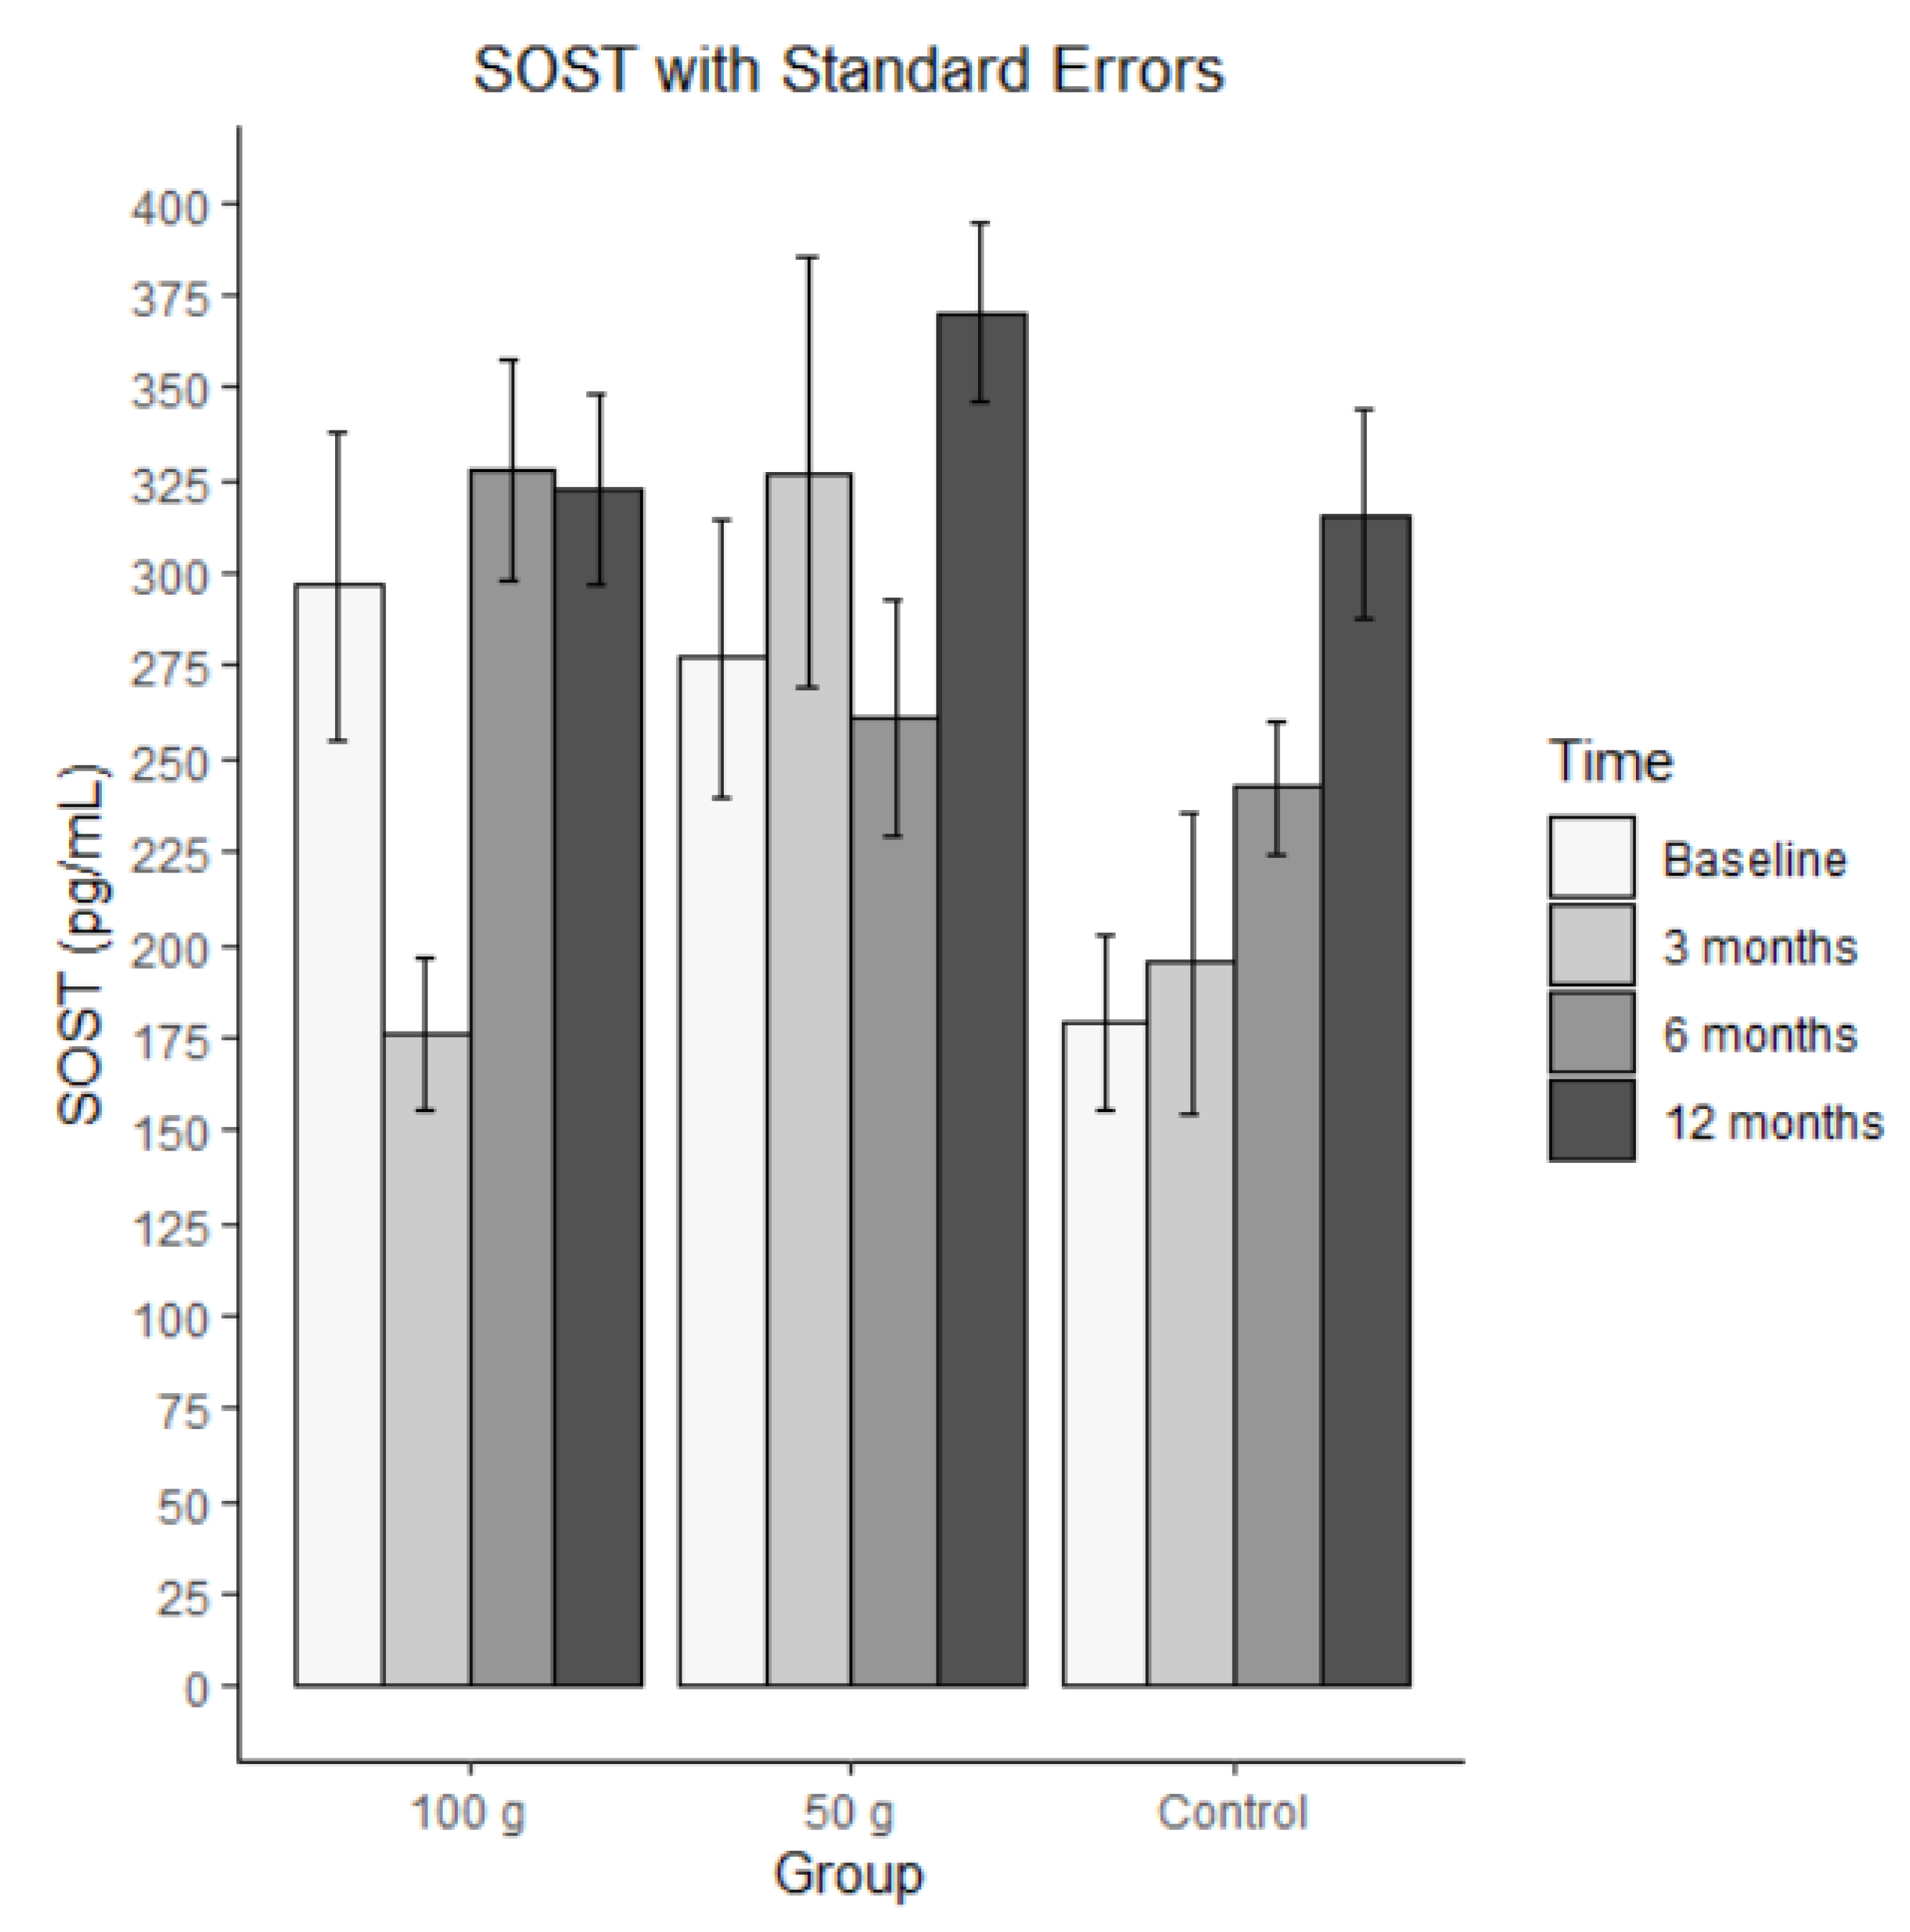
Bars represent mean SOST in pg/mL (± SE) at baseline, 3 months, 6 months, and 12 months for each group (100 g prunes, 50 g prunes, and control). There was a medium-sized ICC of .346 for SOST. The average SOST levels are shown in Figure 8. The MLM analysis revealed a significant time effect, indicating that there was a significant increase in SOST within the groups. None of the other effects were significant.
Figure 9.
Average SOST with standard errors.
3.8.5. TRAP5b
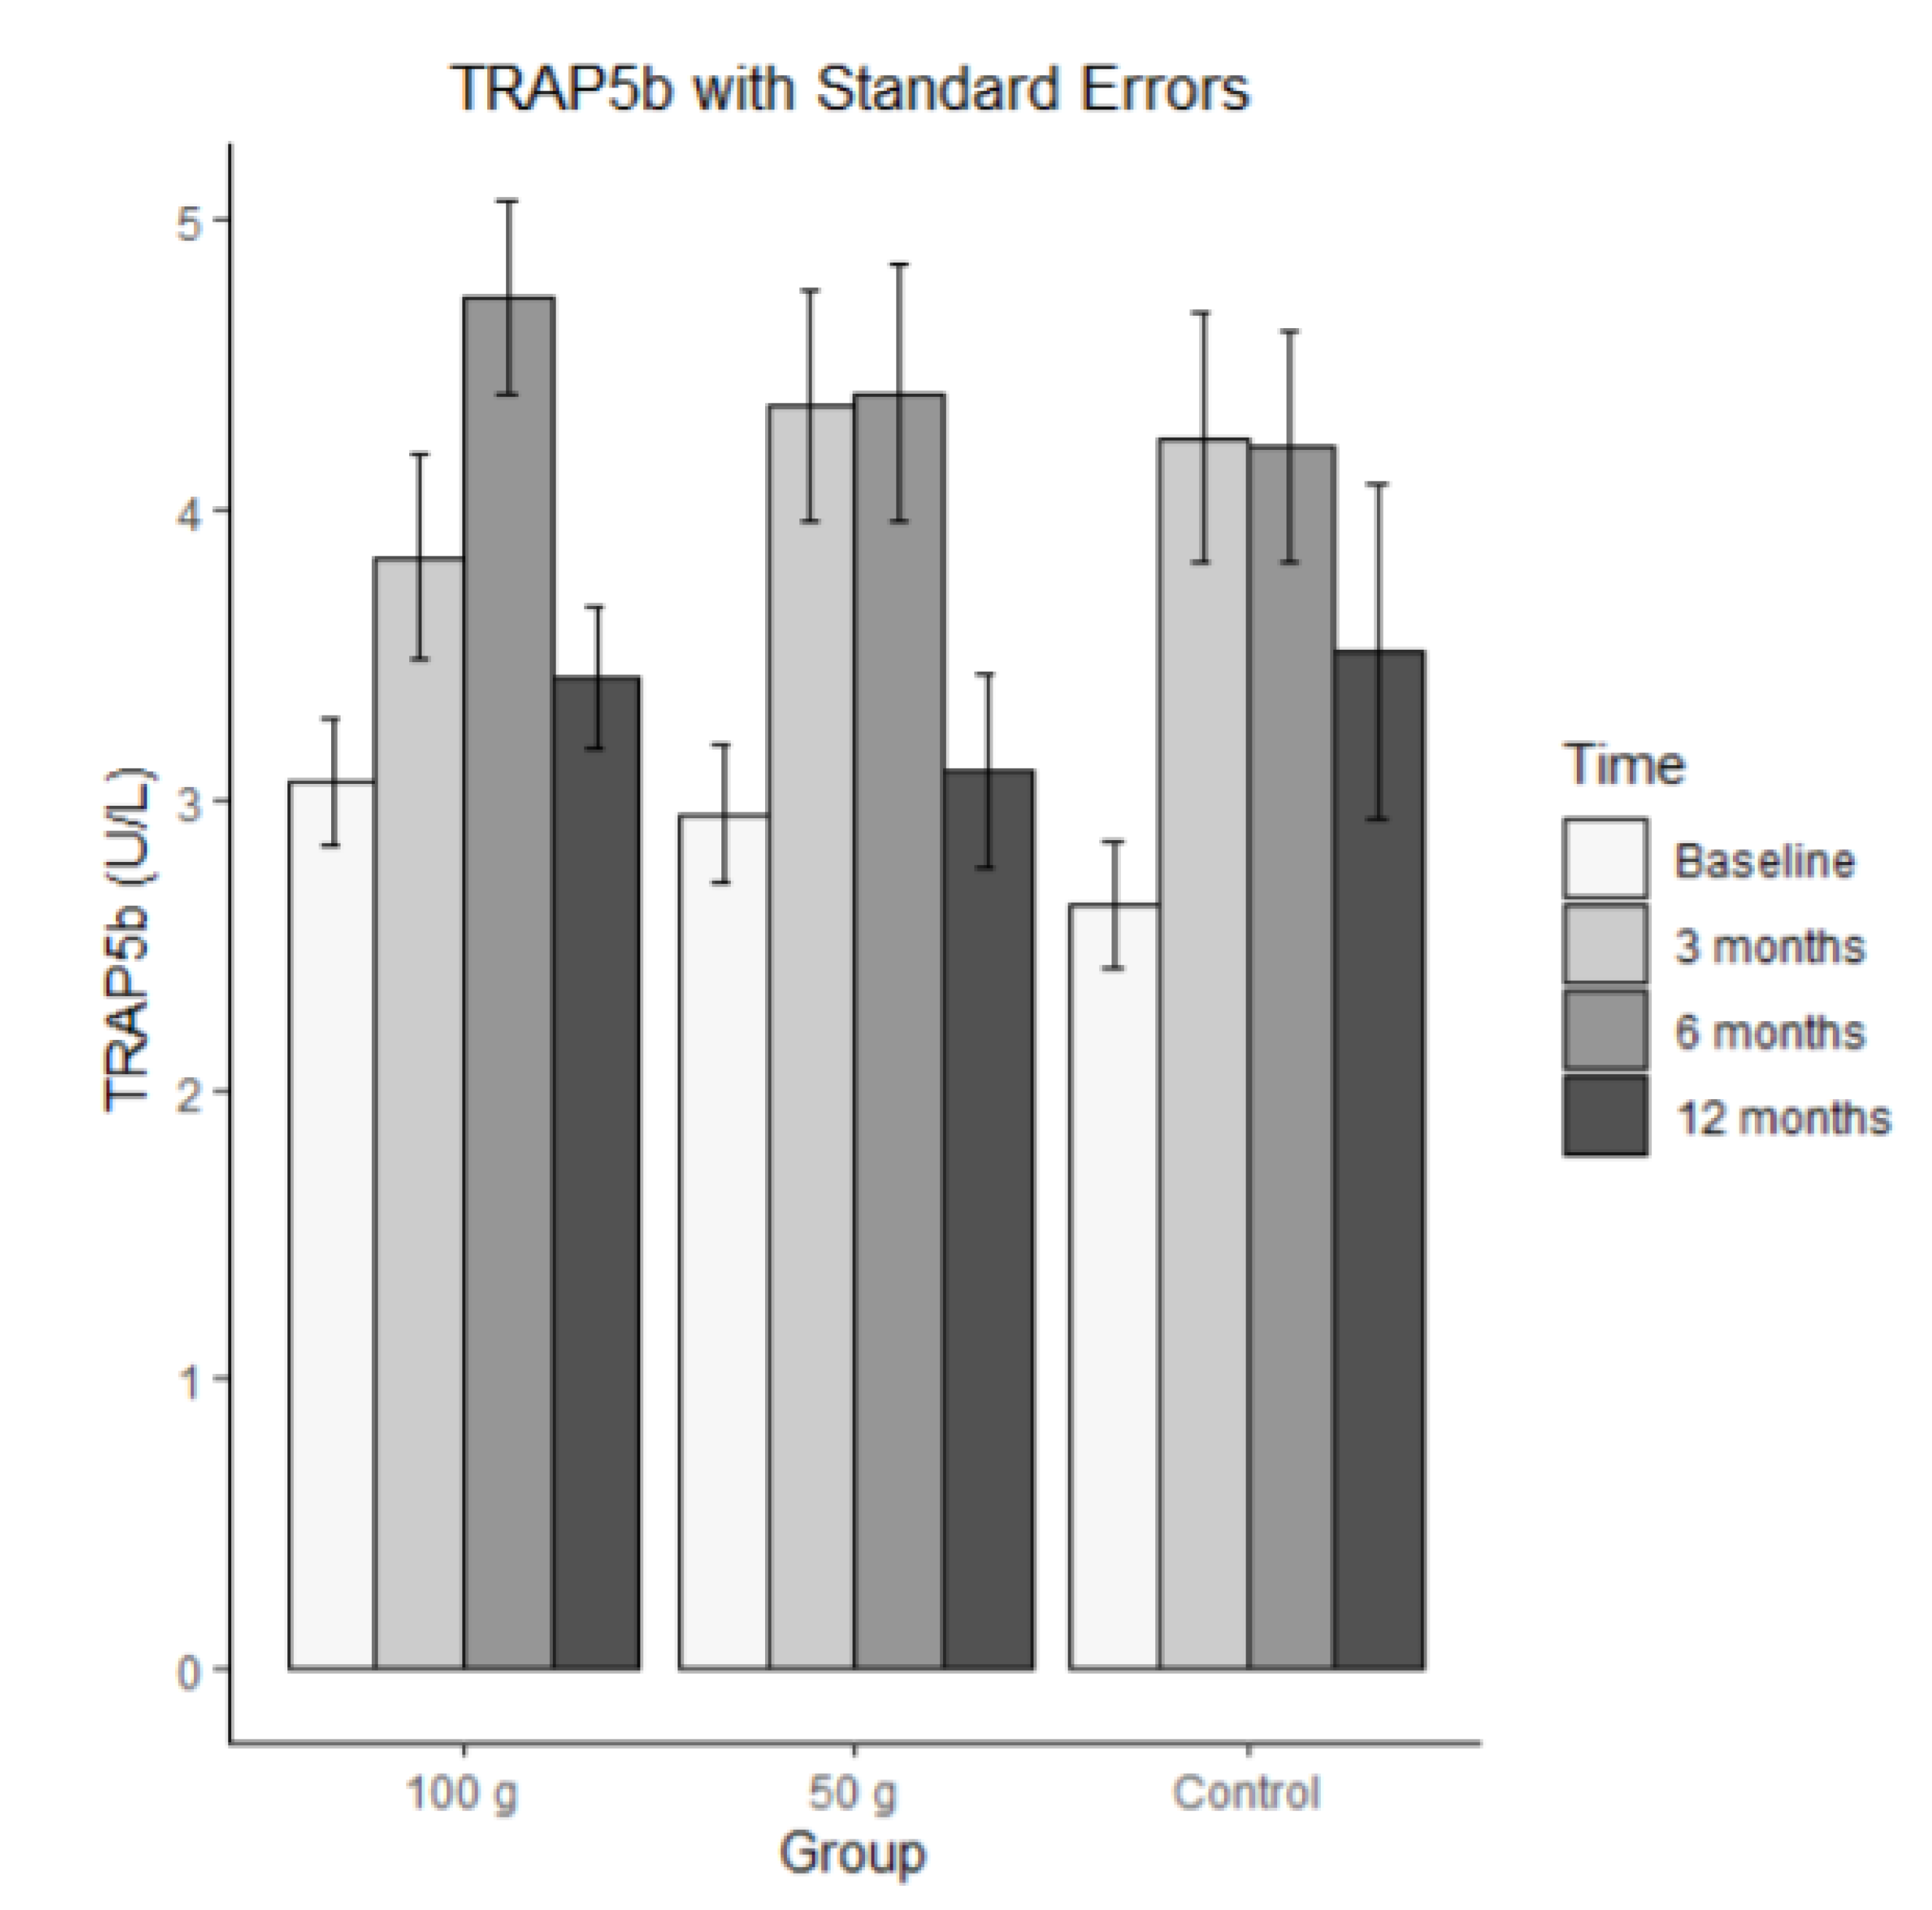
Bars represent mean TRAP5 in U/L (± SE) at baseline, 3 months, 6 months, and 12 months for each group (100 g prunes, 50 g prunes, and control). The ICC for TRAP5b was .295, indicating that there was a small correlation among the repeated measures. The MLM analysis revealed a significant time effect (b = 0.232) and a significant time by 100 g group interaction (b = -0.242). These results indicate that the control group and the 50 g group increased, whereas the individuals of the 100g group showed, on average, no linear change across the four time points. The other effects were not significant.
Figure 10.
Average TRAP5b with standard errors.
3.9. Results Summary
There was no significant change in total BMD over the course of the year. CRP was significantly higher in the control group at all time points compared to the 50 g prune group, while significance was not observed in any other group or over time. OPG significantly decreased over time in all groups; however, the decrease was significantly stronger in the control compared to the 100 g and 50 g groups. The 100g group was, on average, significantly higher at all times compared to the control group. No significant change was observed for osteocalcin. SOST significantly increased over time in all groups, albeit to a greater degree in the control group. TRAP5b increased over time in the 50 g and control groups, while a linear change was observed in the 100 g group over time.
4. Discussion
Though studies on prune consumption and bone health in men are scarce, our findings concur with previous literature in that one year of supplementation may aid in the preservation of bone mass and assist with slowing down the progression to osteoporosis in at risk populations but does not yield significant improvements in total body BMD. Interestingly, while data from Fajardo et al. also showed no significant increase in total BMD with 1-year prune supplementation, beneficial effects were observed with respect to changes in bone geometry detected by peripheral quantitative computed tomography (pQCT) ; used for BMD measurements in a peripheral part of the body, such as forearm or leg, specifically increases in periosteal and endosteal circumferences of the tibia [23,24]. This may indicate a positive role of prunes on bone strength, though not BMD directly and warrants further research including this variable.
While we would have expected to see a decrease in CRP in both treatment groups, they did remain constant while the control group was significantly higher at all time points compared to the 50 g group. One possible explanation to consider as to why a significant decrease wasn’t observed could be exposure to the COVID-19 virus and post-vaccine inflammatory response, which occurred throughout enrollment for many participants. As CRP is a pro-inflammatory cytokine found elevated in states of infection or disease, the elevated values we observed for this biomarker could be linked. Stringer et al. recently published data showing a correlation between increased levels of CRP and the severity of cases of the virus, noting significantly higher values among hospitalized patients [25]. Individuals who were enrolled in the current study during the pandemic time frame were required to be vaccinated in order to complete study timepoints, per mandated guidelines, and some were infected with COVID-19 during the 1-year enrollment period. Alternatively, aside from the infection or post-vaccine inflammatory response, the sheer stress and mental load during the pandemic could have potentially played a role in. Carpenter et al. and others have shown that elevated CRP concentrations are correlated to various mental health issues, including depression and anxiety, both of which spiked considerably during the pandemic in the general population [26]. This is of course speculatory in the current study participants, and warrants further research investigating this specific correlation, but could potentially help to explain the increase in CRP.
OPG plays a vital role in bone, aiding in the inhibition of osteoclastogenesis and bone resorption [20]. While the decrease in the current study over time in all groups is surprising and conflicts with findings from Hooshmand et al. [24,27], the decrease was significantly greater in the control group compared to the 100 g and 50 g groups. Additionally, the 100 g group showed significantly higher concentration of OPG across all time points in comparison to the 50 g and control groups, suggesting that prune supplementation, particularly at 100g, may provide a protective effect in the inhibition of osteoclastogenesis.
Osteocalcin, secreted by osteoblasts, plays a direct and crucial role in directly binding calcium to bone and aiding in bone formation [28]. While increases in this variable in the treatment groups would have been ideal, it is encouraging that a decline was not observed throughout the year enrollment. This also highlights the protective effects of prunes on bone mineral density, as they prevented a decrease in osteocalcin levels, which was observed in the control group. Additional research is warranted investigating the effects of prune on this particular variable.
SOST is an osteocyte-derived inhibitor [3] that binds to the LRP5/6 receptor on osteoblasts thereby leading to a decrease in bone formation [8,10]. Thus, inhibiting sclerostin activity will not only promote bone formation but also inhibit bone resorption resulting in maintenance of and possibly improved bone mineral density and bone homeostasis [29]. In osteopenia, where bone density is already compromised, increasing sclerostin levels would likely be detrimental, as it could further suppress bone formation and contribute to continued bone loss. Therefore, reducing sclerostin activity or inhibiting its expression may be beneficial in osteopenia to promote bone formation and improve bone density.
The current study results indicate that there was a significant increase in SOST across all groups over time; however, the increase was to a greater degree in the control group. These results conflict with previous literature showing slight decreases in SOST, following one year of prune supplementation, albeit these findings were in post-menopausal women [11,24]. Additionally, Hooshmand et al. observed a slight 1.1% decrease in SOST in a 100 g prune group compared to a 3.8% increase with dried apple, again in post-menopausal women [10]. That particular study, however, notes that a limitation is a small sample size and warrants further investigation. It is important to note that Mödder et al. demonstrated that serum sclerostin levels increase markedly with age in women but even more so in men, with lifespan values increasing 2.4 and 4.6-fold, respectively and that the mechanism for metabolizing circulating sclerostin is undetermined [30].
Higher levels of TRAP5b typically indicate increased bone resorption. In osteopenia, where there is already a risk of bone loss, an increase in TRAP5b could exacerbate the condition by promoting further breakdown of bone tissue. Therefore, managing TRAP5b levels and reducing excessive osteoclast activity are important in preventing the progression of osteopenia to osteoporosis. Previous literature by Gaffen et al. [24] demonstrated a time dependent reduction in serum TRAP5b levels with 1 year of 100 g/day prune consumption (in a male population) at both the three- and six-month time point, whereas significance was not observed in the control group. Hooshmand et al. [27] demonstrated time-dependent reductions in TRAP5b as well as C-terminal collagen cross-link (CTX) levels with 1-year prune supplementation at three-, six-, and twelve-month intervals compared with baseline. While we would have expected to see similar findings in the current study, there was an increase in the 50 g and control groups and no change over time in the 100 g group. This may indicate a protective effect with 100 g dosing specifically, though this is speculative based on the current data set and warrants further investigation.
Limitations from this study include the COVID-19 pandemic, which caused a reduction in recruitment numbers from what was originally proposed, as well as large periods of time when the study was put on hold, due to the virus and WHO (world health organization) guidelines for age and high risk of COVID-19. Additionally, there were possible negative effects on some variables due to actual COVID-19 infections during the study, as well as post-vaccine inflammation. Again, this is an area to further explore within this data set. It would have been beneficial to have a true placebo group who received no supplementation of any kind, to compare to the calcium/vitamin D3 and prune groups, however knowing that the recruited population already had bone loss, we could not ethically do so. Also, while we aimed to recruit a diverse population within Tallahassee and surrounding areas, the enrolled participants do not fully represent the diversity within our community. A larger scale study of one hundred plus individuals may shed more light on the effects of prune and biomarkers of bone resorption and remodeling.
Authors should discuss the results and how they can be interpreted from the perspective of previous studies and of the working hypotheses. The findings and their implications should be discussed in the broadest context possible. Future research directions may also be highlighted.
5. Conclusions
The results of the current study suggest that 1 year of prune supplementation does not aid in maintaining bone density beyond that of elemental Ca+ and vitamin D3 supplementation in osteopenic men but may have a modest effect on biomarkers of inflammation and bone metabolism. Further studies in this population are needed, and potentially larger scale and longer duration, to fully assess the role of prune supplementation on bone density and biomarkers of inflammation and bone metabolism.
Author Contributions
Conceptualization ,B.A; J.K; methodology, B.A.; R.H.; M.S.; T.L.; J.K software, T.L.; validation, B.A.; T.L.; ; formal analysis, T.L.; K.G.; J.M.; A.M.; investigation, B.A.; L.O; N.A., J.M.; K.G.; S.B.; A.M.; H.C.; R.B; resources, B.A.; data curation, K.D.; L.O., K.G.; J.M.; S.S.; writing—original draft preparation, L.O.; writing—review and editing, L.O.; K.D.; T.L.; B.A.; N.A., K.G.; R.B; R.H.; visualization, T,L.; supervision, B.A.; project administration, L.O., N.A., K.G, J.M.H.C.; funding acquisition, B.A. All authors have read and agreed to the published version of the manuscript.
Funding
This work was supported by the USDA-NIFA [grant number 2017-67017-26360].
Institutional Review Board Statement
This study was conducted in accordance with the Declaration of Helsinki and approved by the Institutional Review Board (STUDY00000885) at the Florida State University, Tallahassee, Fl, USA.
ClinicalTrials.gov:https://clinicaltrials.gov/study/NCT03408119.
Informed Consent Statement
: Informed consent was obtained from all subjects involved in the study.
Data Availability Statement
Data supporting these findings are available within the article or upon request.
Acknowledgments
We would like to acknowledge the California Prune Board for donating the prunes as well as Shaklee for donating the calcium/vitamin D3 supplementation for the current study.
Conflicts of Interest
The author(s) declare no conflict of interest.
References
- Branch NSC and O. Osteoporosis in Men [Internet]. National Institute of Arthritis and Musculoskeletal and Skin Diseases. 2023. Available from: https://www.niams.nih.gov/health-topics/osteoporosis-men.
- Skjødt MK, Frost M, Abrahamsen B. Side effects of drugs for osteoporosis and metastatic bone disease. British Journal of Clinical Pharmacology [Internet]. 2018 Oct 17;85(6):1063–71. Available from: https://pubmed.ncbi.nlm.nih.gov/30192026/.
- George KS, Munoz J, Ormsbee LT, Akhavan NS, Foley EM, Siebert SC, et al. The Short-Term Effect of Prunes in Improving Bone in Men. Nutrients [Internet]. 2022 Jan 1 [cited 2023 Apr 6];14(2):276. Available from: https://www.mdpi.com/2072-6643/14/2/276.
- McClung MR, Grauer A, Boonen S, Bolognese MA, Brown JP, Diez-Perez A, et al. Romosozumab in Postmenopausal Women with Low Bone Mineral Density. New England Journal of Medicine [Internet]. 2014 Jan 30 [cited 2019 Dec 5];370(5):412–20. Available from: https://www.nejm.org/doi/full/10.1056/NEJMoa1305224.
- Sarafrazi N, Wambogo EA, Shepherd JA. Osteoporosis or Low Bone Mass in Older Adults: United States, 2017-2018. NCHS data brief [Internet]. 2021 Mar 1 [cited 2023 Sep 7] ;(405):1–8. Available from: https://pubmed.ncbi.nlm.nih.gov/34029181/.
- Rinonapoli G, Ruggiero C, Meccariello L, Bisaccia M, Ceccarini P, Caraffa A. Osteoporosis in Men: A Review of an Underestimated Bone Condition. International Journal of Molecular Sciences. 2021 Feb 20;22(4):2105.
- Martinis MD, Sirufo MM, Polsinelli M, Placidi G, Silvestre DD, Ginaldi L. Gender Differences in Osteoporosis: A Single- Center Observational Study. World Journal of Men’s Health [Internet]. 2021 Oct 1 [cited 2021 Oct 26];39(4):750–9. Available from: https://web.s.ebscohost.com/ehost/pdfviewer/pdfviewer?vid=5&sid=b6b98458-914b-4ab6-98ba-4e5f78f7d2da%40redis.
- International Osteoporosis Foundation. Pathophysiology | International Osteoporosis Foundation [Internet]. www.osteoporosis.foundation. 2022. Available from: https://www.osteoporosis.foundation/health-professionals/about-osteoporosis/pathophysiology.
- Dunkin MA. Managing Inflammatory Arthritis and Bone Health [Internet]. Arthritis.org. 2016. Available from: https://www.arthritis.org/diseases/more-about/inflammatory-arthritis-bone-loss.
- Hooshmand S, Brisco JRY, Arjmandi BH. The effect of dried plum on serum levels of receptor activator of NF-κB ligand, osteoprotegerin and sclerostin in osteopenic postmenopausal women: a randomised controlled trial. British Journal of Nutrition. 2014 Apr 29;112(1):55–60.
- Hooshmand S, Chai SC, Saadat RL, Payton ME, Brummel-Smith K, Arjmandi BH. Comparative effects of dried plum and dried apple on bone in postmenopausal women. British Journal of Nutrition. 2011 May 31;106(6):923–30.
- Prynne CJ, Mishra GD, O’Connell MA, Muniz G, Laskey MA, Yan L, et al. Fruit and vegetable intakes and bone mineral status: a cross-sectional study in 5 age and sex cohorts. The American Journal of Clinical Nutrition. 2006 Jun 1;83(6):1420–8.
- MühlbauerRC, Lozano A, Reinli A, Wetli H. Various Selected Vegetables, Fruits, Mushrooms and Red Wine Residue Inhibit Bone Resorption in Rats. The Journal of Nutrition. 2003 Nov 1;133(11):3592–7.
- Arjmandi BH, Johnson SA, Pourafshar S, Navaei N, George KS, Hooshmand S, et al. Bone-Protective Effects of Dried Plum in Postmenopausal Women: Efficacy and Possible Mechanisms. Nutrients. 2017 May 14;9(5):496.
- Bowen PE. Role of Commodity Boards in Advancing the Understanding of the Health Benefits of Whole Foods. Nutrition Today. 2017;52(1):19–25.
- Hooshmand S, Arjmandi BH. Viewpoint: Dried plum, an emerging functional food that may effectively improve bone health. Ageing Research Reviews. 2009 Apr;8(2):122–7.
- National Institutes of Health. Vitamin D [Internet]. National Institutes of Health. 2024. Available from: https://ods.od.nih.gov/factsheets/VitaminD-HealthProfessional/.
- Sallis JF, Haskell WL, Wood PD, Fortmann SP, Rogers T, Blair SN, et al. Physical Activity Assessment Methodology In the Five-City Project. American Journal of Epidemiology. 1985 Jan;121(1):91–106.
- Ivanova M, Dao J, Noll L, Fikry J, Ozlem Goker-Alpan. TRAP5b and RANKL/OPG Predict Bone Pathology in Patients with Gaucher Disease. Journal of Clinical Medicine [Internet]. 2021 May 20 [cited 2024 Oct 28];10(10):2217–7. Available from: https://pubmed.ncbi.nlm.nih.gov/34065531/.
- Wikipedia Contributors. Osteoprotegerin [Internet]. Wikipedia. Wikimedia Foundation; 2019 [cited 2020 Jan 24]. Available from: https://en.wikipedia.org/wiki/Osteoprotegerin.
- Pinheiro JC, Bates DM. Mixed-effects models in S and S-PLUS. New York, Ny: Springer; 2000.
- Hadley Wickham, Springerlink (Online Service. ggplot2 : Elegant Graphics for Data Analysis. New York, Ny: Springer New York; 2009.
- Fajardo J, Gaffen D, Eisner A, Kern M, Hooshmand S. Effects of Dried Plum (Prunes) on Bone Density and Strength in Men. Current Developments in Nutrition. 2020 May 29;4(Supplement_2):21–1.
- Gaffen D, Tunstall A, Fajardo J, Ramachandran P, Kern M, Hooshmand S. Effects of Dried Plum on Bone Biomarkers in Men (P01-028-19). Current Developments in Nutrition. 2019 Jun 1;3(Supplement_1).
- Stringer D, Braude P, Myint P k, Evans L, Collins J, Verduri A. The role of C-reactive protein as a prognostic marker in COVID-19. International Journal Of Epidemiology. 2021;50((2) :420-429).
- Carpenter LL, Gawuga CE, Tyrka AR, Price LH. C-reactive protein, early life stress, and wellbeing in healthy adults. Acta Psychiatrica Scandinavica. 2012 Jun 11;126(6):402–10.
- Hooshmand S, Gaffen D, Eisner A, Fajardo J, Payton M, Kern M. Effects of 12 Months Consumption of 100 g Dried Plum (Prunes) on Bone Biomarkers, Density, and Strength in Men. Journal of Medicinal Food [Internet]. 2021 Oct 29;25(1):40–7. Available from: https://pubmed.ncbi.nlm.nih.gov/34714130/.
- Komori T. What is the function of osteocalcin? Journal of Oral Biosciences. 2020 Sep;62(3):223–7.
- Delgado-Calle J, Sato AY, Bellido T. Role and mechanism of action of sclerostin in bone. Bone [Internet]. 2017 Mar[cited2020Sep17]; 96:29–37. Available from: https://www.ncbi.nlm.nih.gov/pmc/articles/PMC5328835/pdf/nihms824626.pdf.
- Mödder, U, Hoey, K, Amin, S, McCready, LK, Achenbach, SJ, Lawrence Riggs, B. Relation of Age, Gender, and Bone Mass to Circulating Sclerostin Levels in Women and Men. J Bone Miner Res. 2010 Aug 18;26(2):373–379. [CrossRef]
Figure 1.
Screening/Enrollment Flowchart.
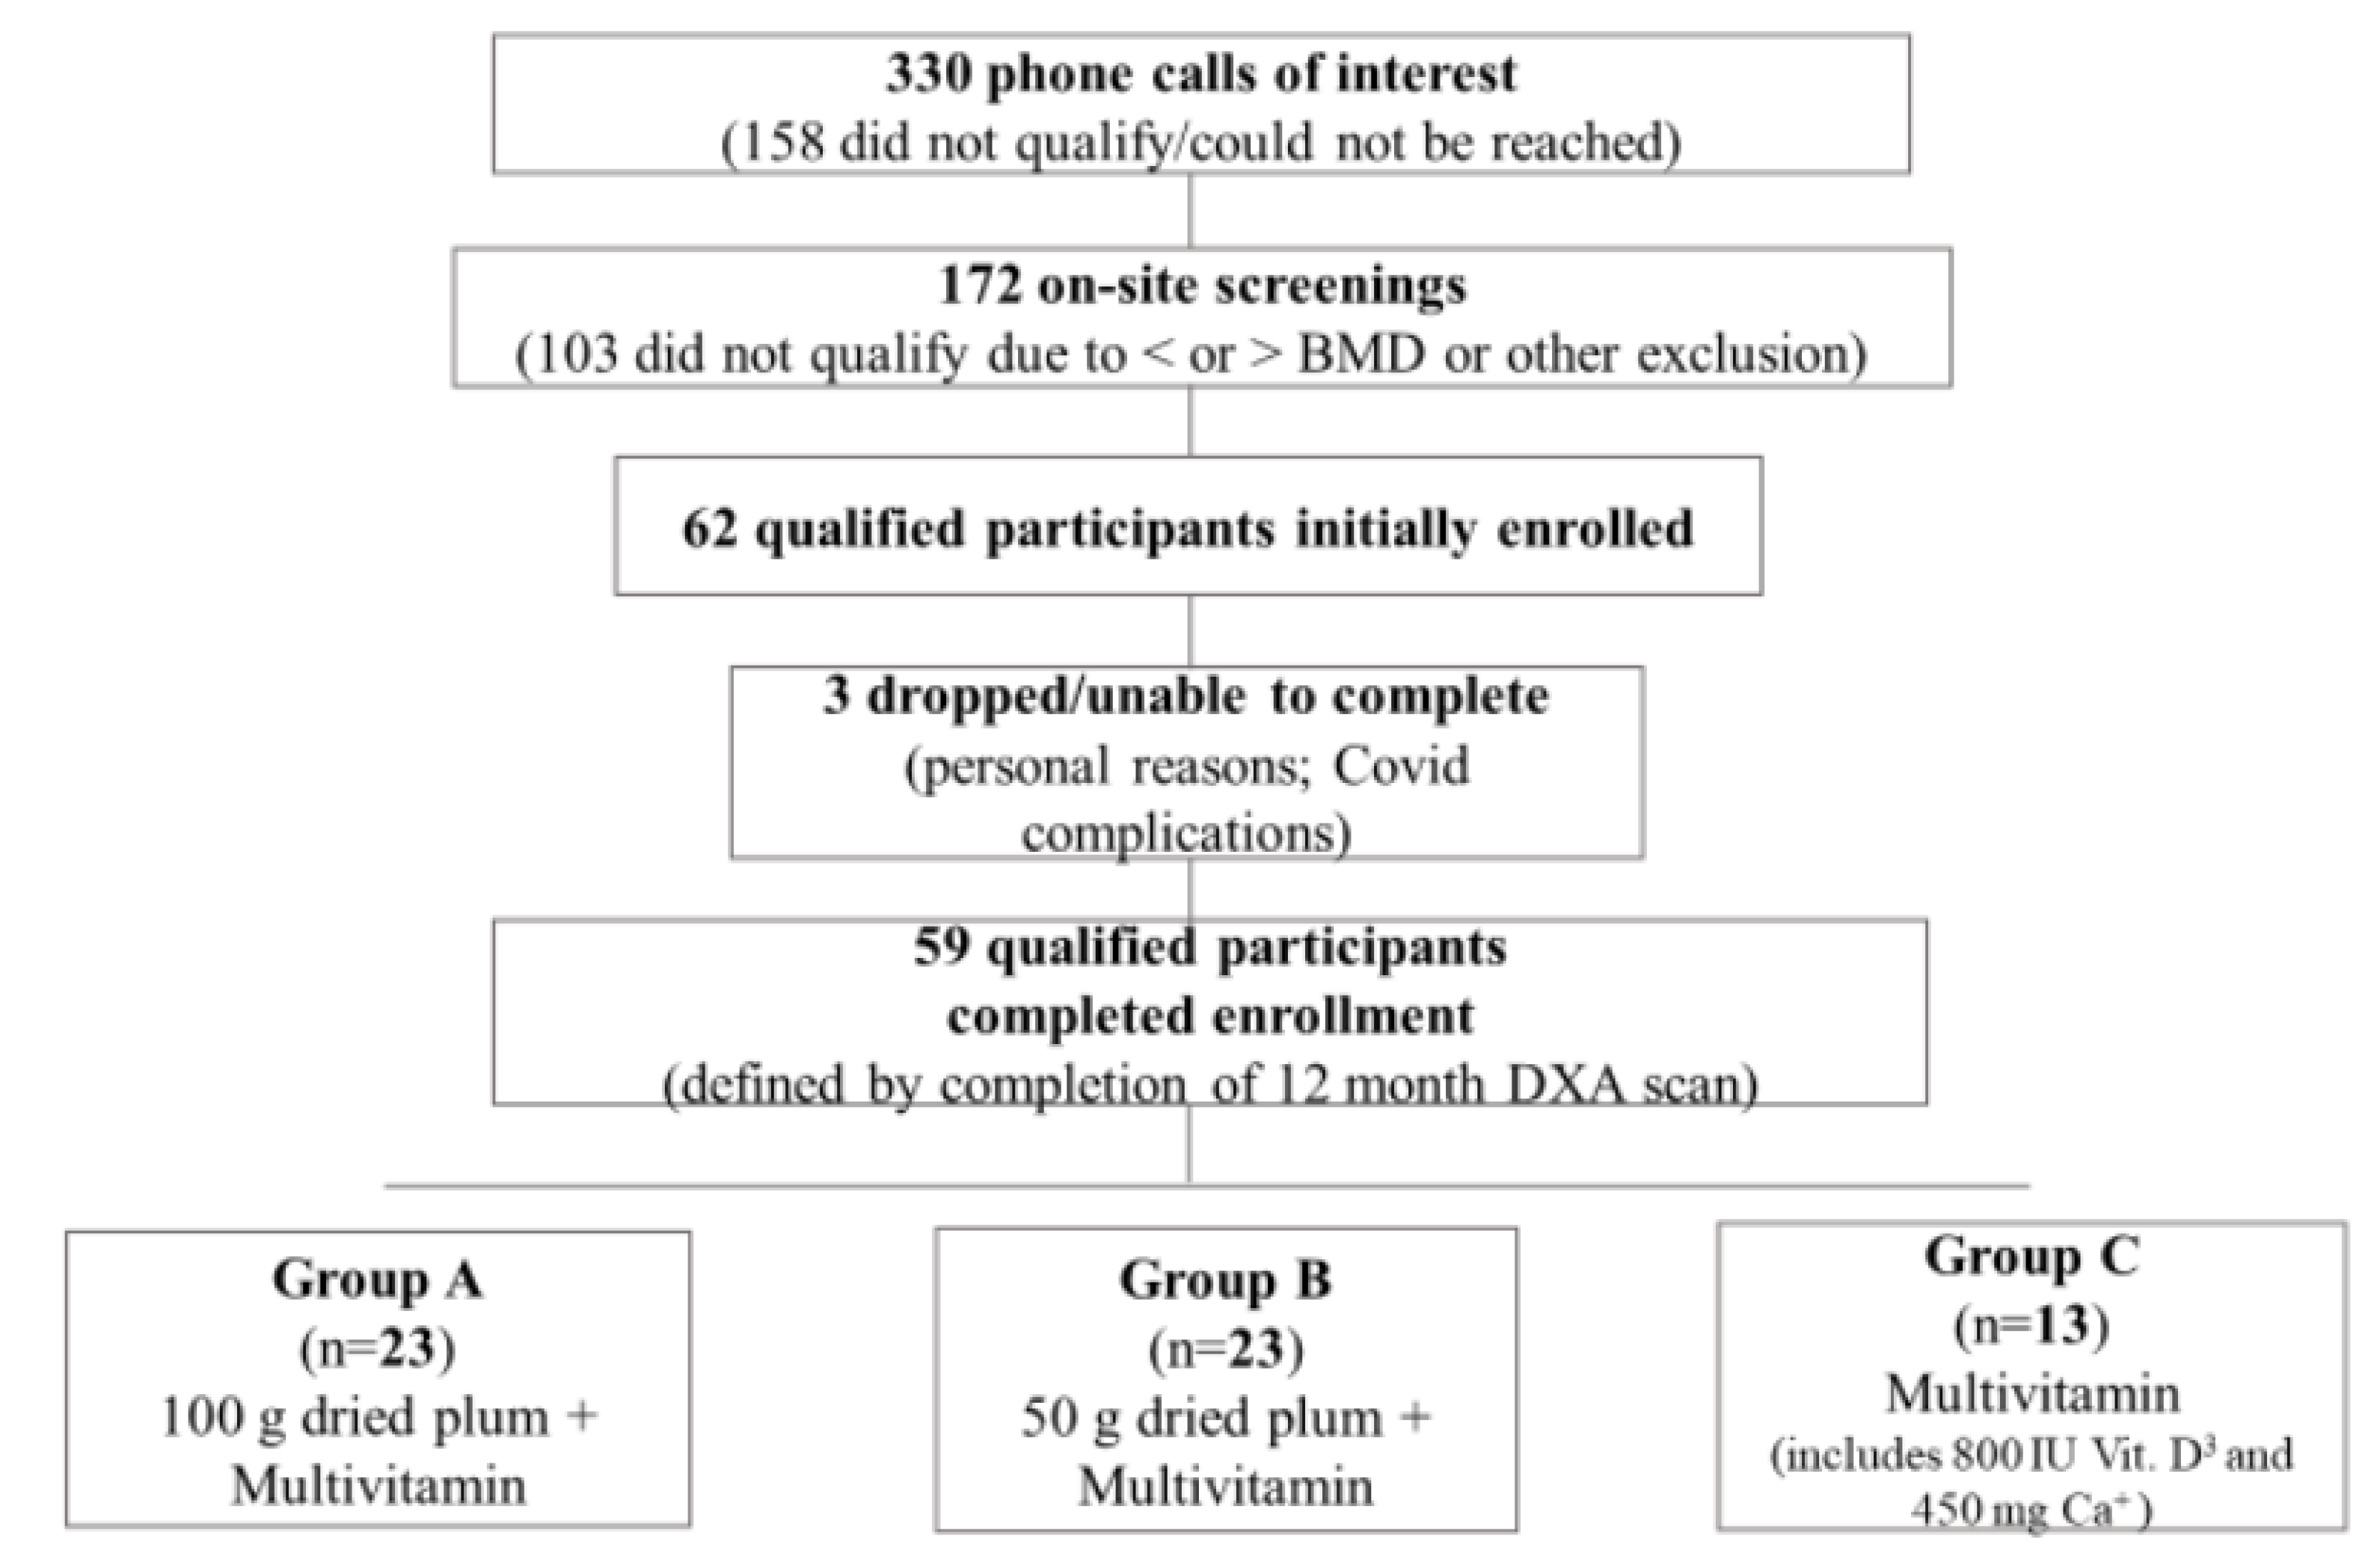
Figure 2.
Physical activity in hours per week with standard errors.
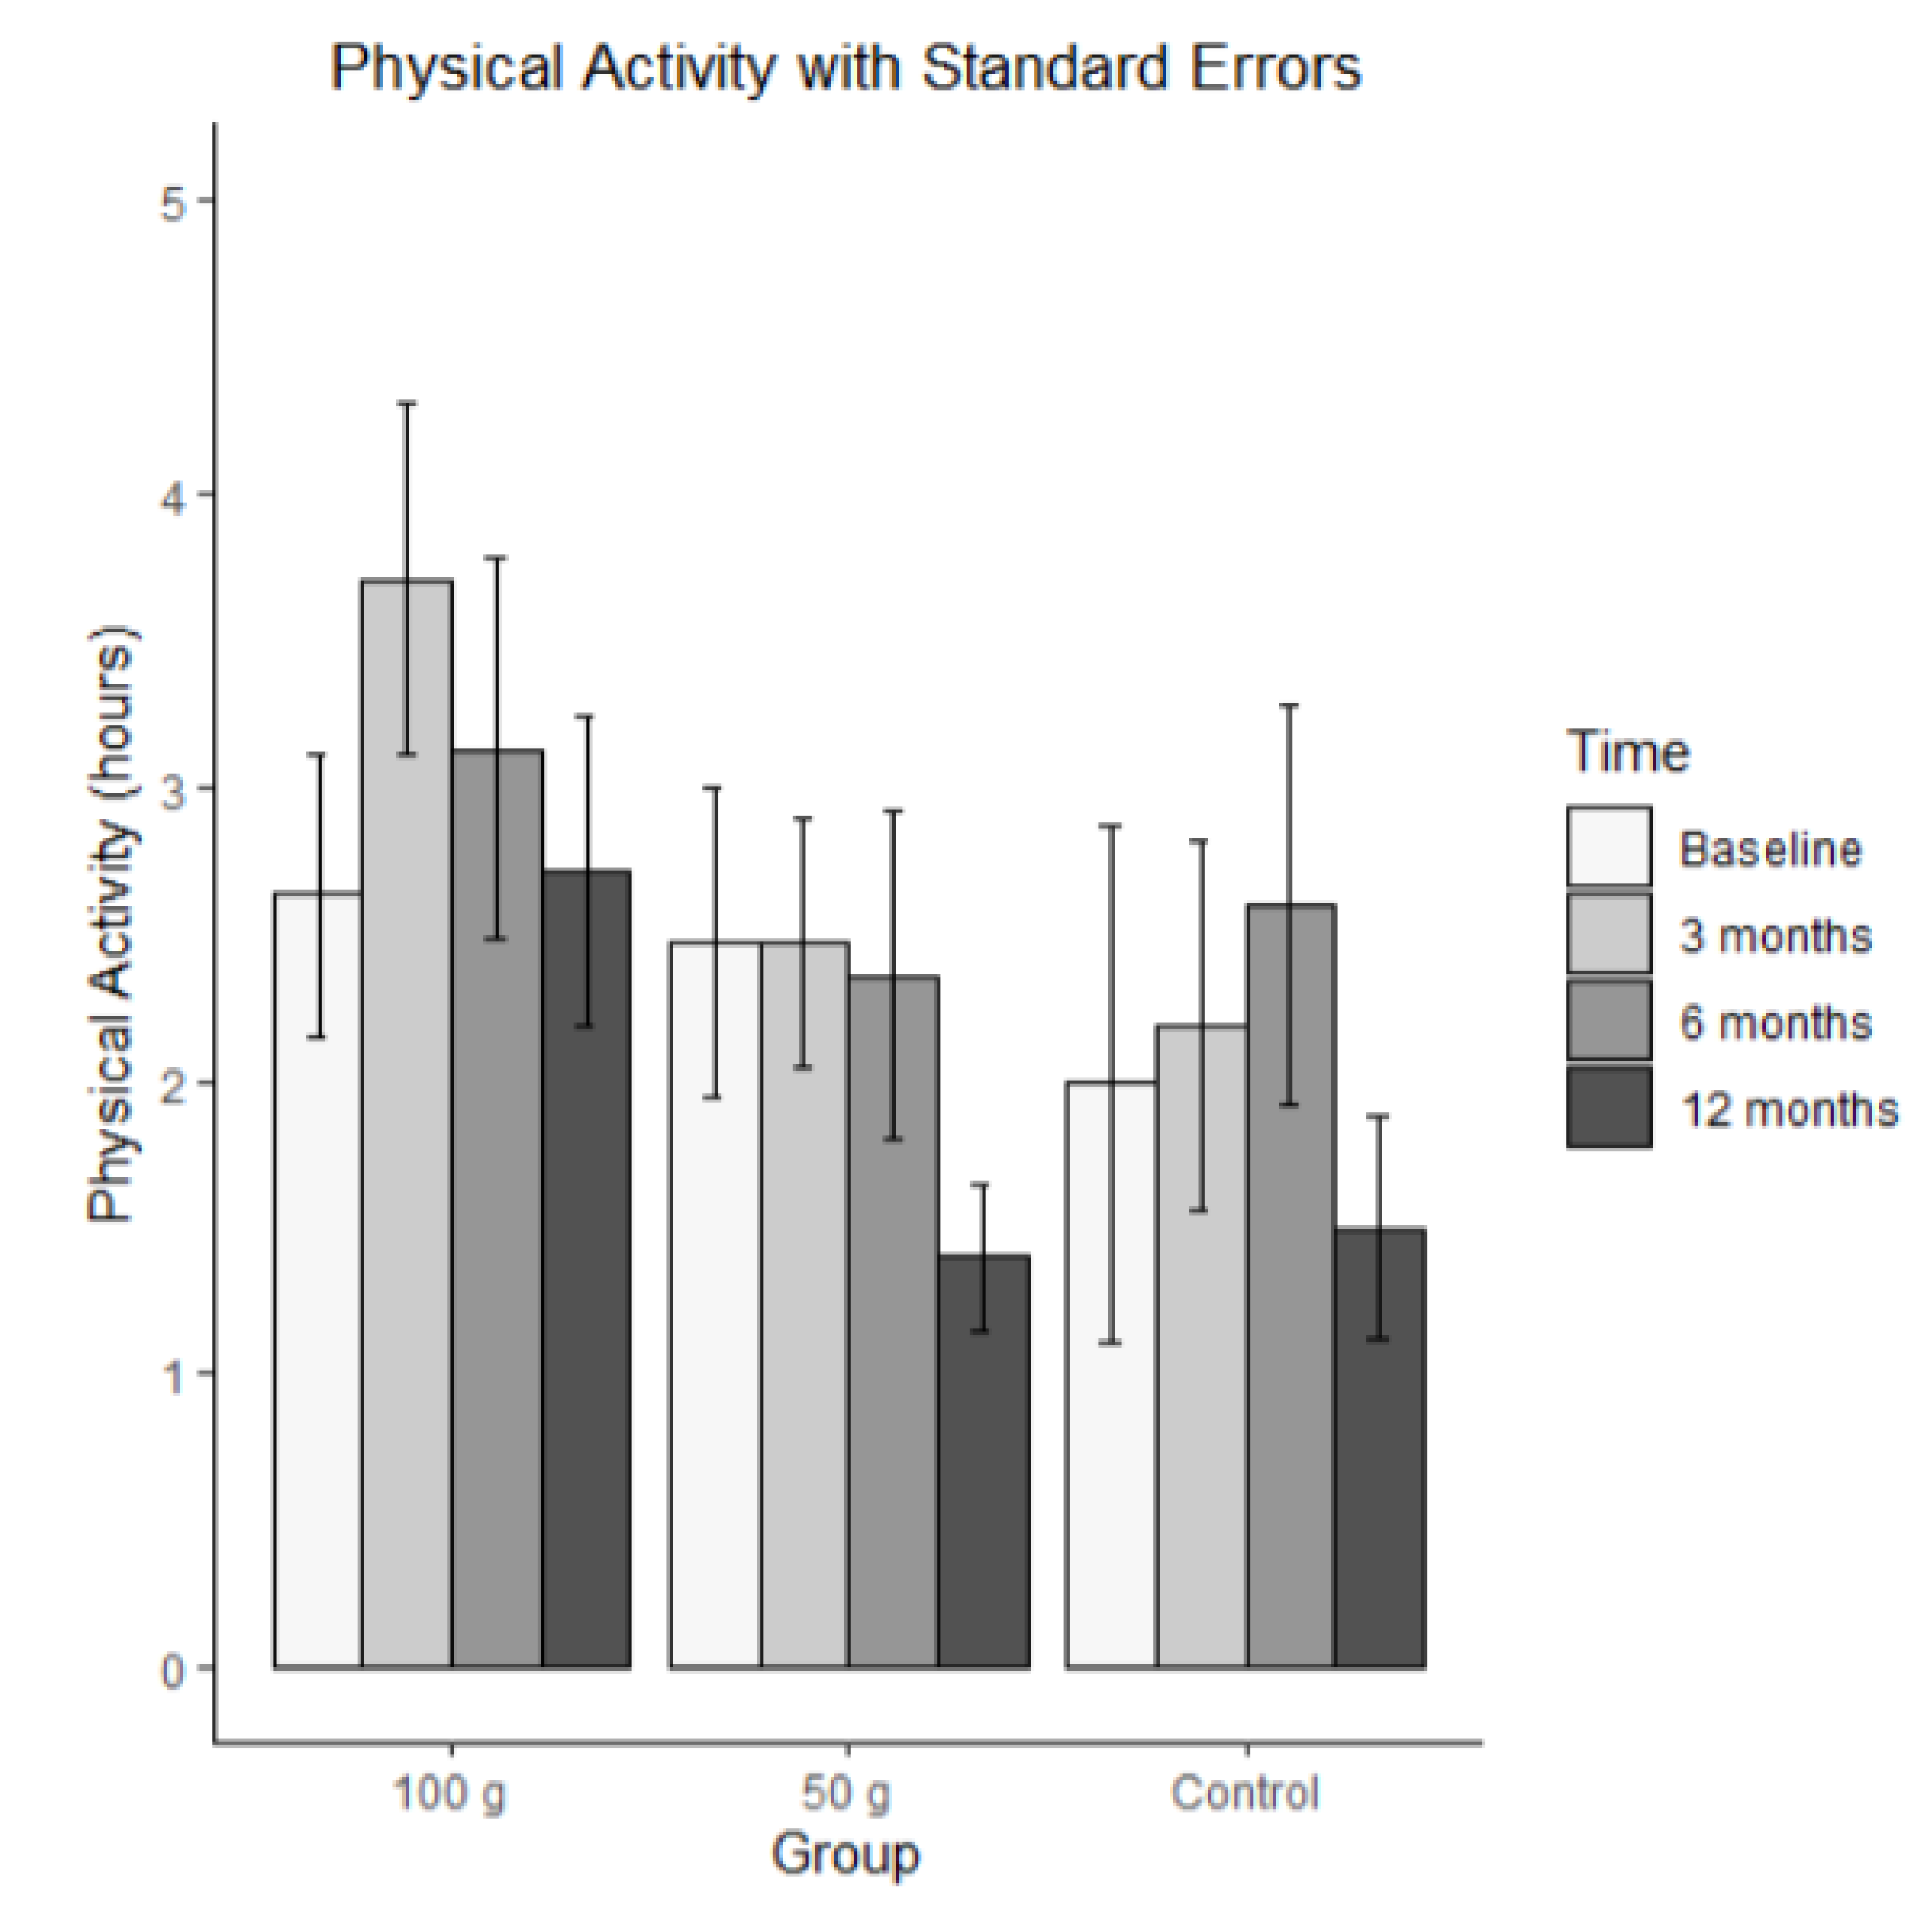
Figure 3.
Average sleep in hours per night with standard errors.
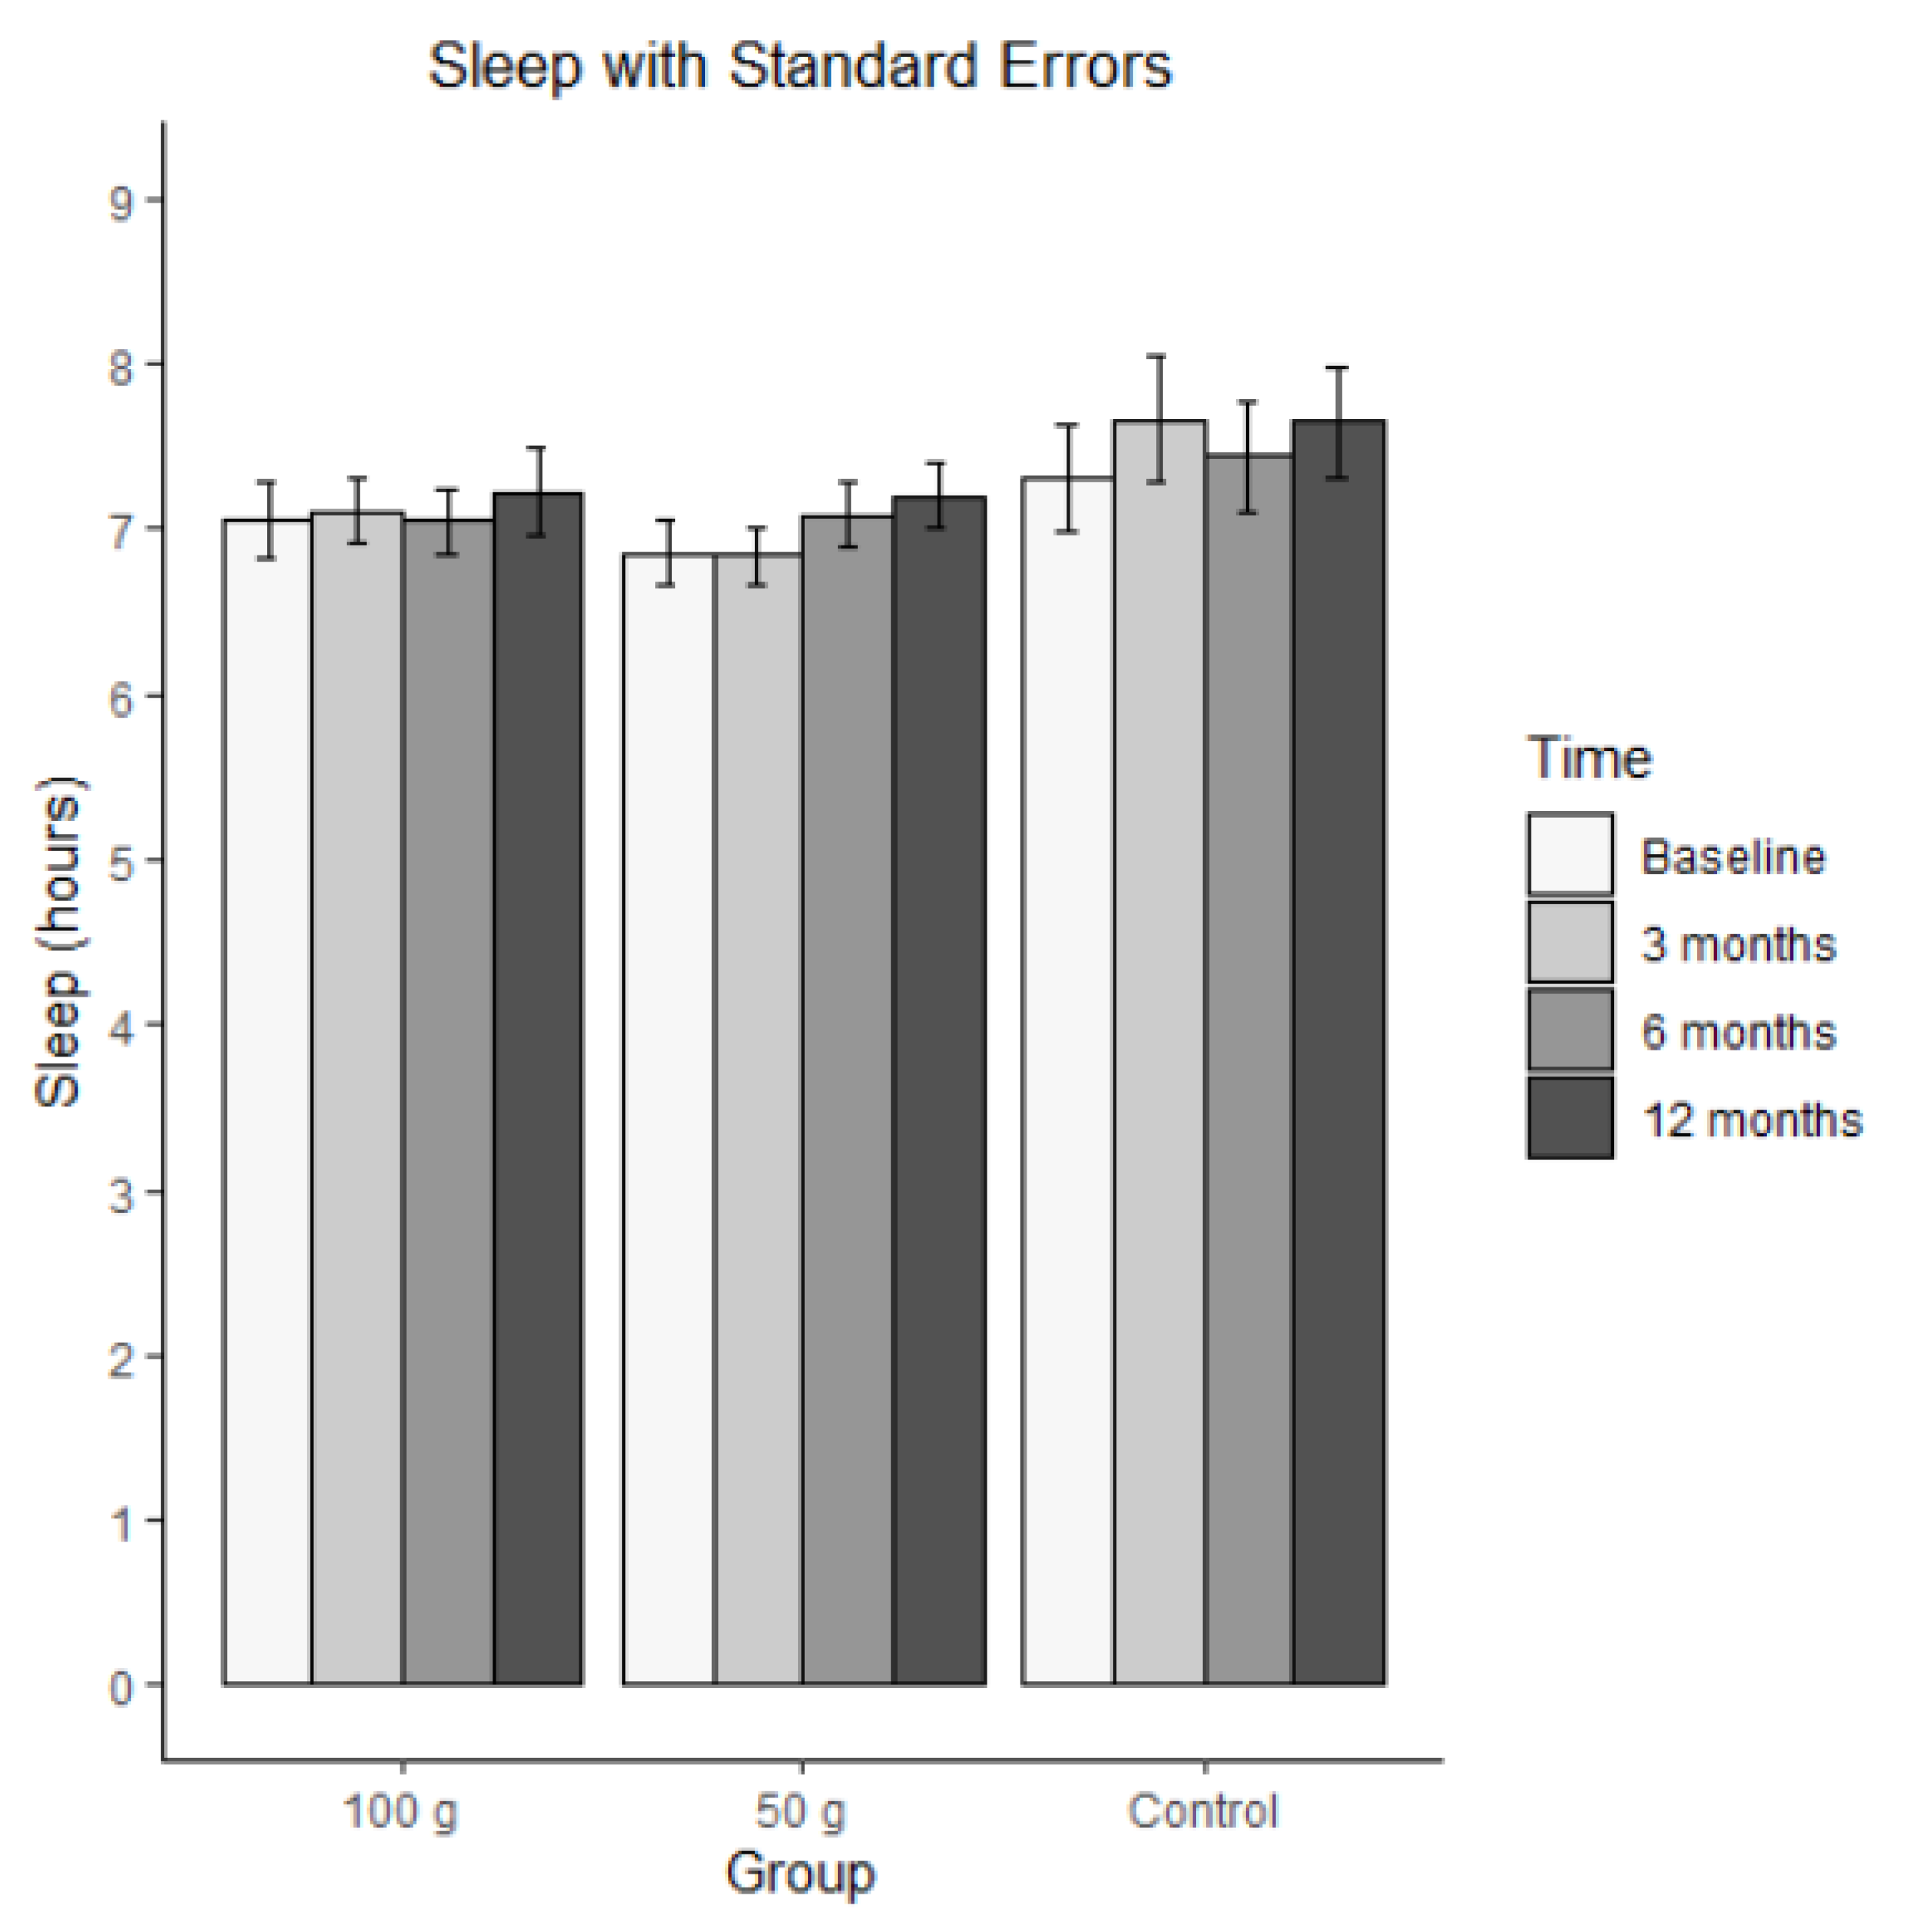
Figure 4.
Average bone mineral density with standard errors.
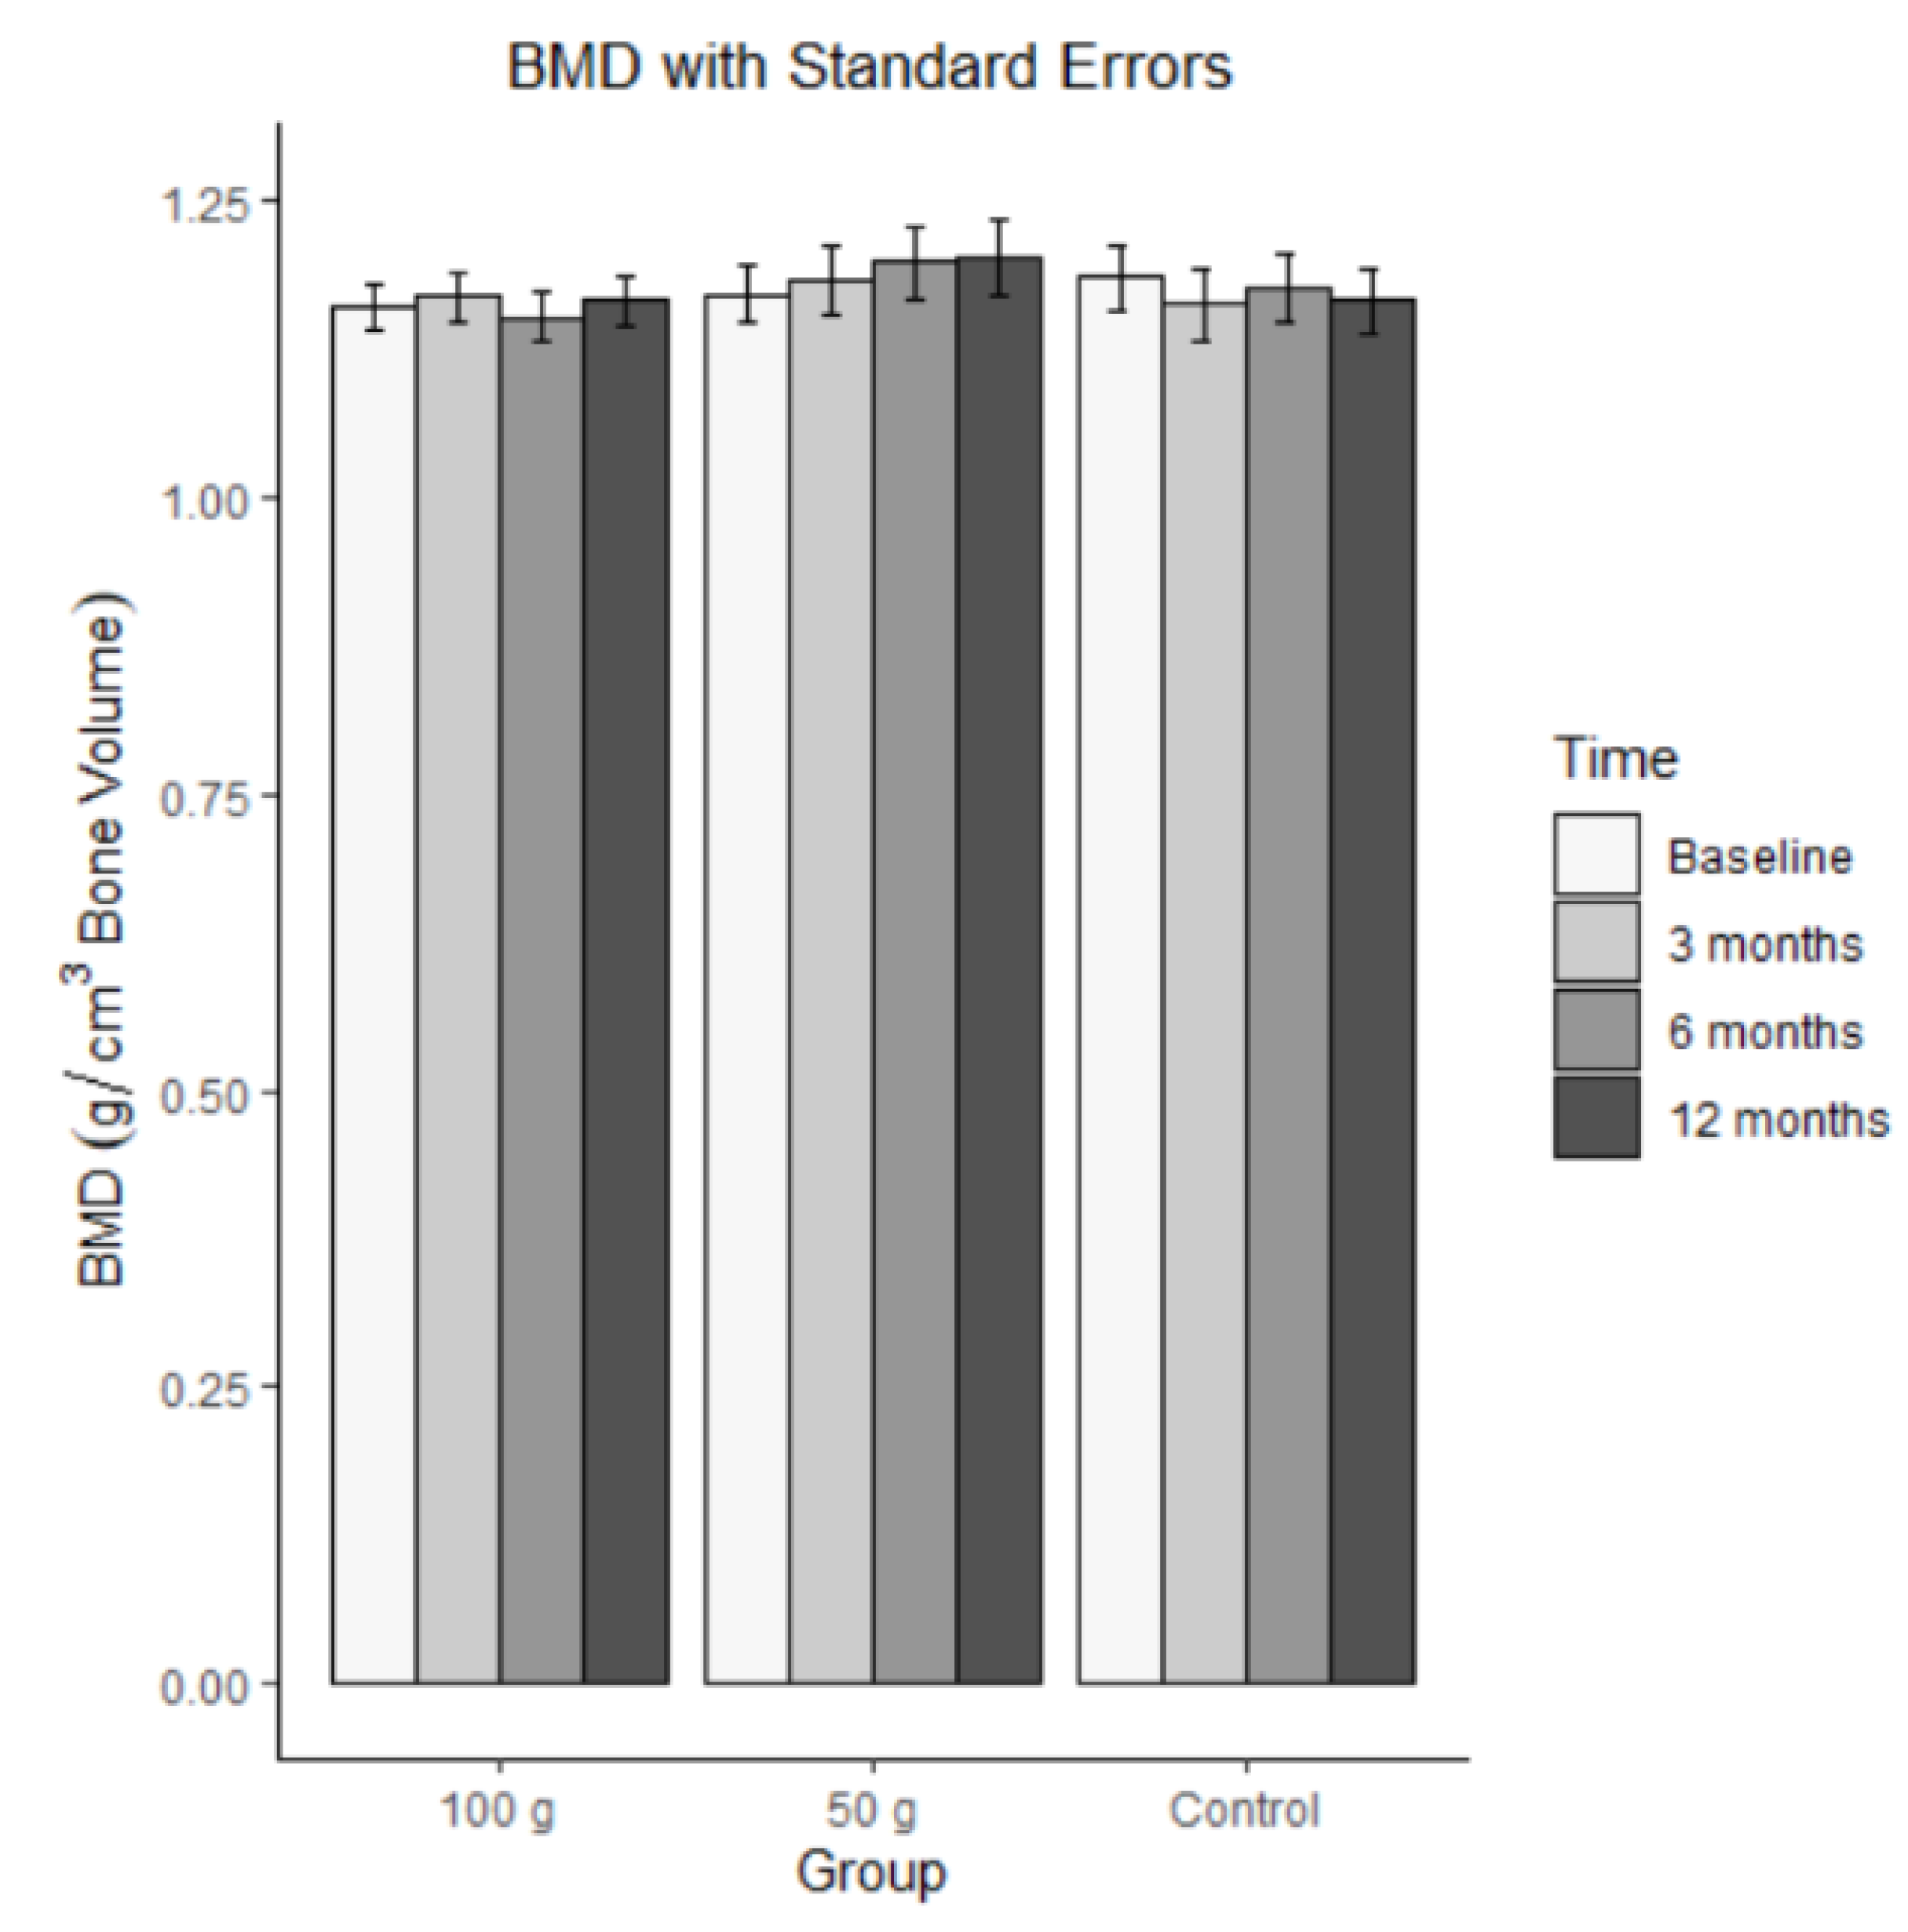
Figure 5.
Average DXA T-Scores with standard errors.
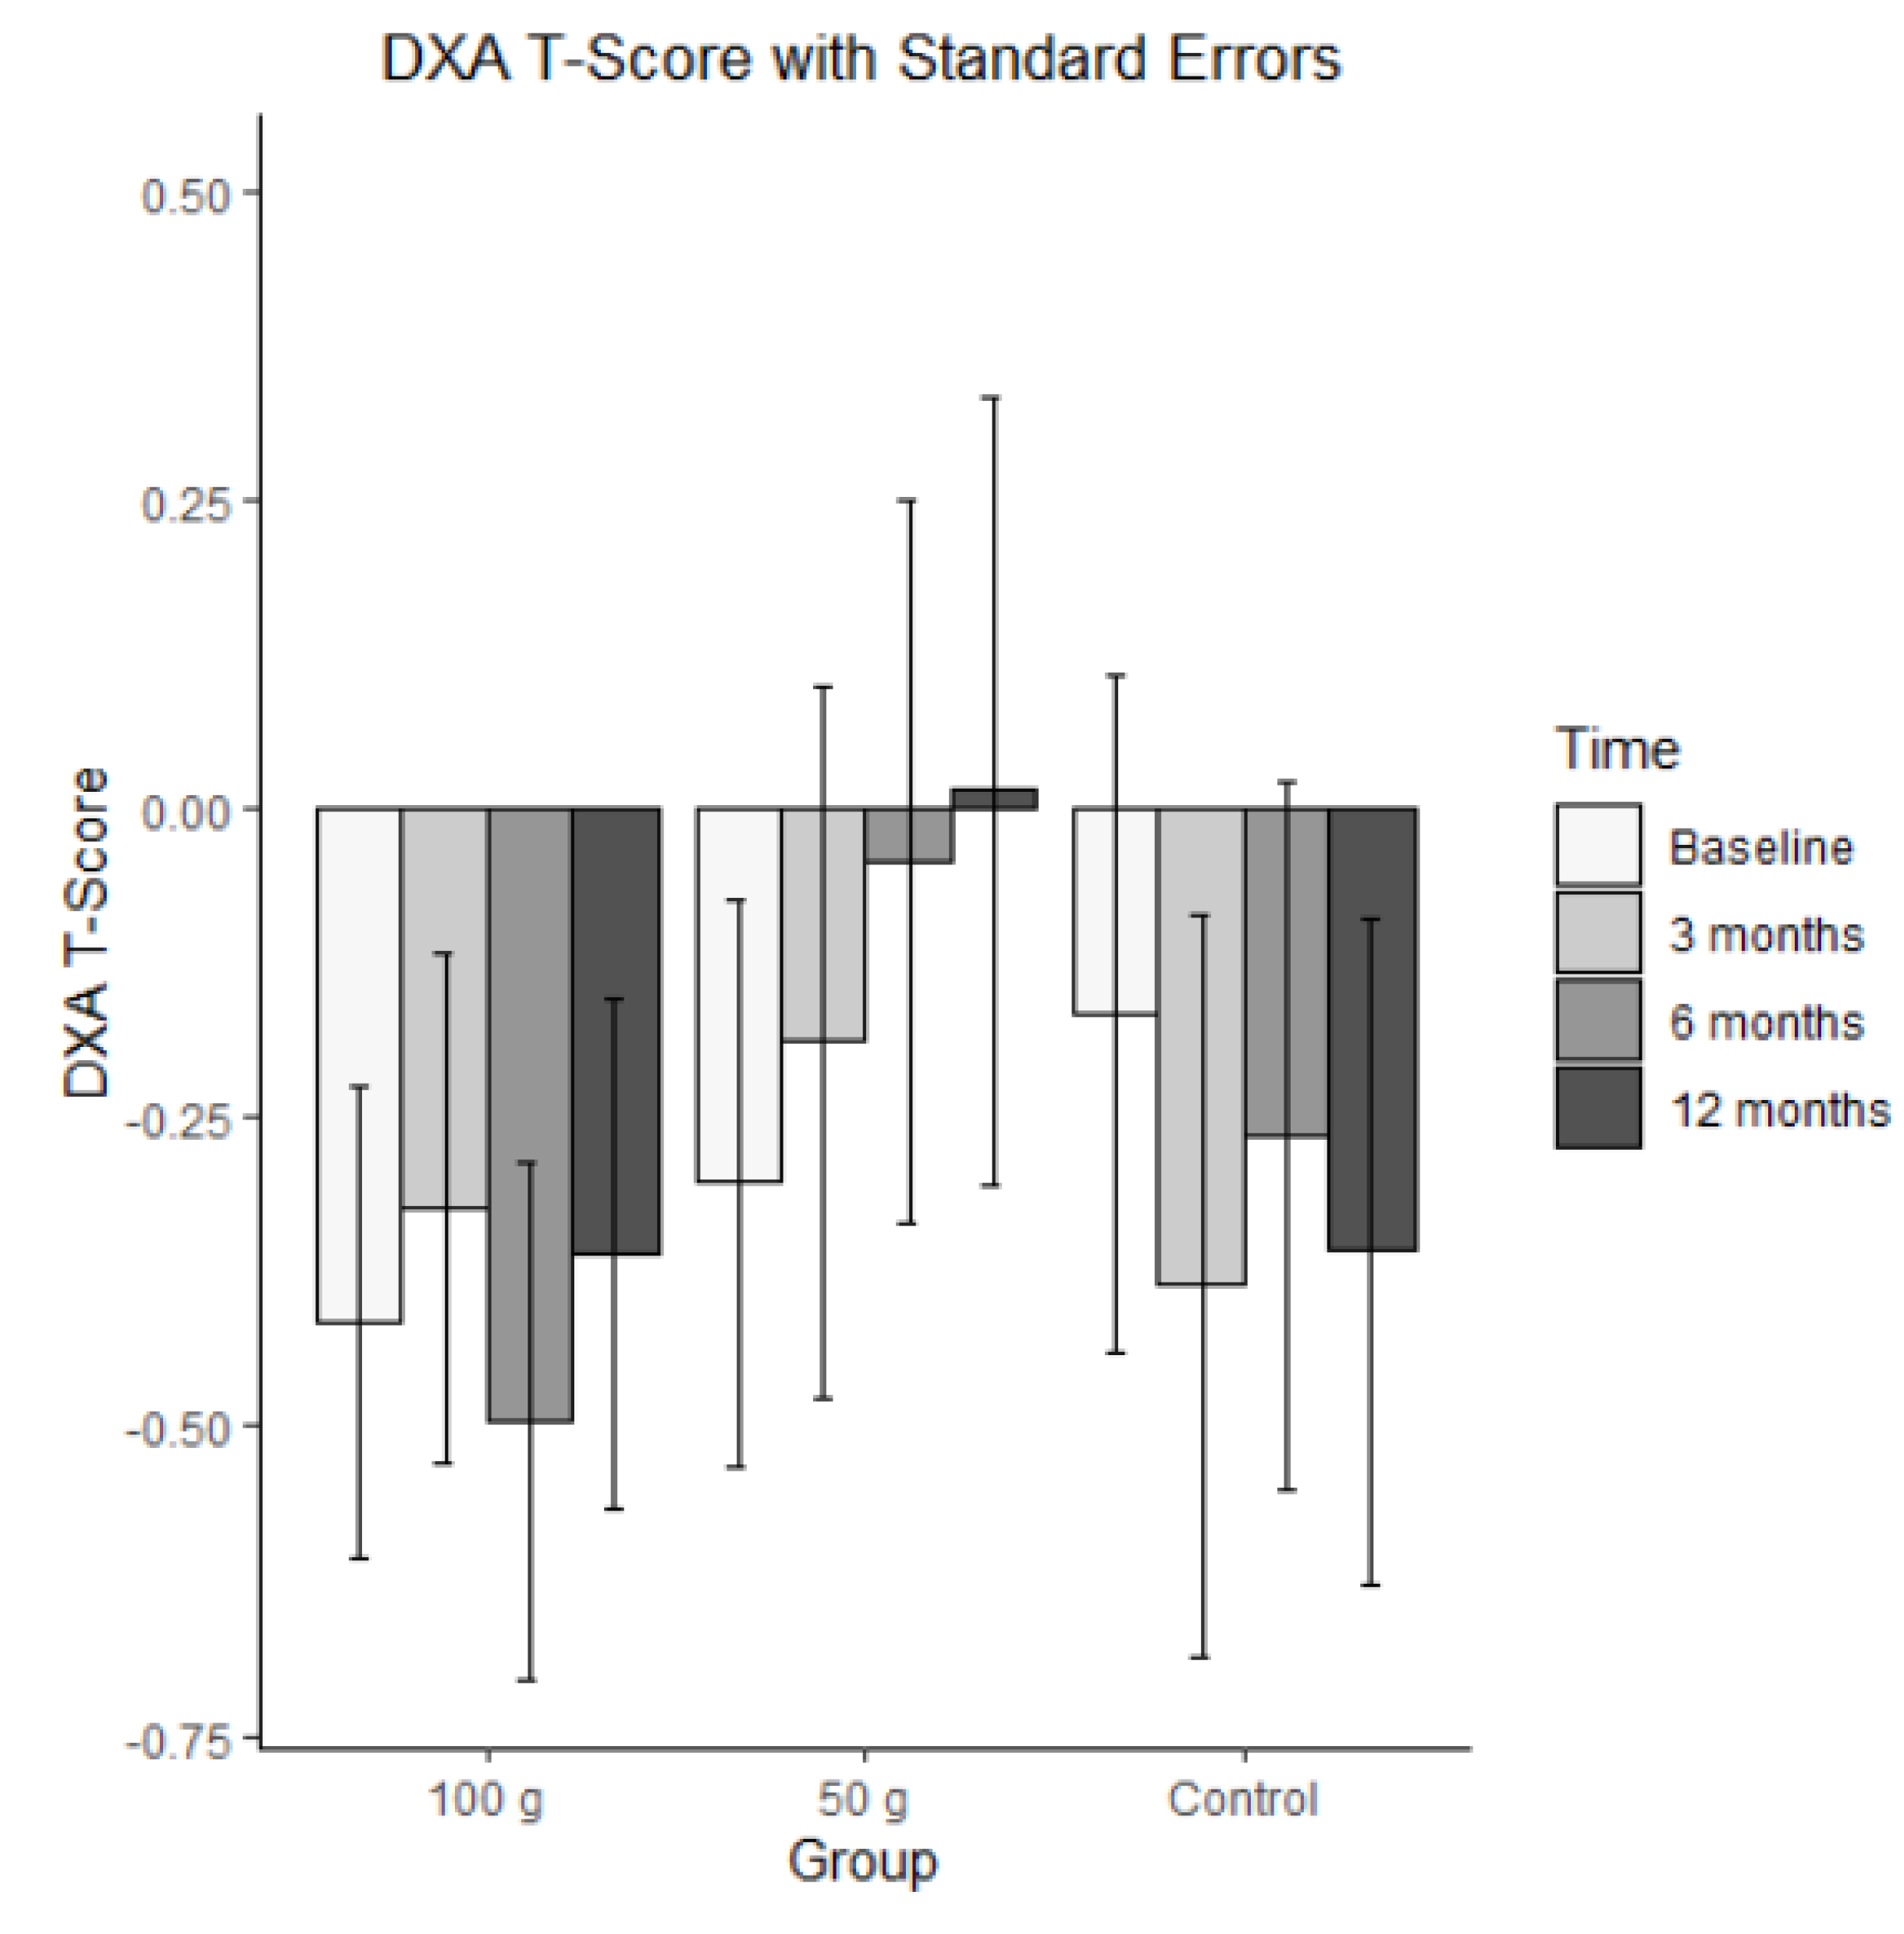
Figure 8.
Average osteocalcin levels with standard errors.
Disclaimer/Publisher’s Note: The statements, opinions and data contained in all publications are solely those of the individual author(s) and contributor(s) and not of MDPI and/or the editor(s). MDPI and/or the editor(s) disclaim responsibility for any injury to people or property resulting from any ideas, methods, instructions or products referred to in the content. |
© 2026 by the authors. Licensee MDPI, Basel, Switzerland. This article is an open access article distributed under the terms and conditions of the Creative Commons Attribution (CC BY) license (http://creativecommons.org/licenses/by/4.0/).
Copyright: This open access article is published under a Creative Commons CC BY 4.0 license, which permit the free download, distribution, and reuse, provided that the author and preprint are cited in any reuse.


