
Submitted:
05 January 2026
Posted:
06 January 2026
You are already at the latest version
Abstract
Customer Lifetime Value (CLV) prediction is a fundamental challenge in hospitality analytics, supporting revenue management, personalization, and long-term customer relationship strategies. However, existing models predominantly rely on structured behavioral data while overlooking the emotional intelligence embedded in guest narratives. This study proposes an interpretable multimodal deep learning framework that bridges behavioral and emotional intelligence for CLV prediction by integrating structured booking records with unstructured hotel review text. The proposed architecture combines a multilayer perceptron for behavioral feature encoding with a transformer-based language model for textual representation, followed by a cross-modal attention fusion mechanism. Model interpretability is ensured through SHAP analysis for structured attributes, LIME for local textual explanations, and attention visualization for modality interaction analysis. Experimental evaluation on large-scale hospitality datasets demonstrates that the proposed multimodal framework consistently outperforms traditional machine learning models, unimodal deep learning baselines and classical ensemble learners, achieving predictive improvements ranging from approximately 15 to 30 percent across evaluation metrics and a notable increase in goodness of fit. The results confirm that emotional intelligence extracted from guest reviews significantly enhances CLV prediction and provides actionable insights for hospitality decision making, supporting the deployment of transparent and explainable artificial intelligence (XAI) systems for strategic customer value management.
Keywords:
artificial intelligence
; multimodal deep learning
; customer lifetime value
; hospitality industry
; behavioral intelligence
; emotional intelligence
; reservations
; transformer models
; SHAP explainability
; predictive analytics
1. Introduction
The rapid digital transformation of the hospitality industry has intensified reliance on analytically informed managerial practices in areas including revenue management, personalized services, marketing optimization, and customer relationship management. The widespread adoption of artificial intelligence and machine learning technologies have enabled hotels to move beyond descriptive analytics toward predictive and prescriptive intelligence, supporting more agile and competitive business models. In this context, Customer Lifetime Value (CLV) has emerged as one of the most influential indicators for long-term profitability, as it captures the expected future contribution of each customer across multiple interactions rather than focusing on individual transactions. Accurate prediction of CLV allows hospitality organizations to optimize customer acquisition, retention strategies, dynamic pricing, and personalized engagement at scale [1].
From an economic and financial perspective, the hospitality industry operates under conditions of high fixed costs, volatile demand, seasonal fluctuations, and strong exposure to external macroeconomic shocks. Hotels must continuously balance occupancy rates, pricing strategies, and operational efficiency to maintain sustainable profitability. In this context, CLV represents an important marketing metric and a core financial indicator that links customer behavior directly to revenue streams, cost optimization, and capital allocation decisions [2]. Accurate CLV estimation helps hotels to quantify the economic return of customer acquisition investments, guide revenue management strategies, optimize customer portfolio profitability, and mitigate financial risks associated with churn, cancellations, and demand uncertainty. As competition evolves and marginal profit pressures increase, data-driven CLV prediction has become a critical financial instrument for sustainable growth, risk-aware management, and strategic financial planning in modern hospitality enterprises [3].
Recent research has demonstrated the growing effectiveness of machine learning and deep learning models in predicting CLV across financial, retail, and service industries. Predictive frameworks based on ensemble learning, gradient boosting, and neural networks have shown strong performance in capturing complex behavioral patterns underlying customer value. In hospitality specifically, CLV has been studied alongside customer loyalty, churn prediction, and repeat booking behavior, where models aim to identify high-value guests and optimize long-term engagement [4,5]. However, despite these advances, most existing models remain primarily focused on behavioral data, relying almost exclusively on structured transactional data such as booking frequency, recency, monetary value, length of stay, and cancellation behavior.
In parallel with structured analytics, the hospitality industry has also experienced growth in unstructured user-generated content through online review platforms involving Booking.com and TripAdvisor. These textual narratives encode information that reflects guest satisfaction, dissatisfaction, trust, and perceived service quality [6]. Research in sentiment analysis and opinion mining has increasingly relied on transformer architectures such as BERT and RoBERTa to model emotional cues in hotel reviews across different languages and cultures. Such pretrained encoders capture context-dependent semantics and subtle polarity shifts and consistently outperform traditional bag-of-words and recurrent models. Studies have shown that emotional tone and aspect-level sentiment strongly influence booking decisions, customer loyalty, and brand perception [7,8]. Nevertheless, this emotional intelligence remains largely disconnected from CLV modeling, creating a methodological gap between behavioral prediction and experiential intelligence.
The separation between behavioral and emotional intelligence represents one of the most significant limitations of current CLV prediction models in hospitality. While structured behavioral features effectively capture what customers do, they cannot fully explain why customers behave in a certain way, nor do they reflect subjective service experiences expressed in natural language [9]. This disconnect has motivated recent calls for multimodal learning frameworks that integrate heterogeneous data sources, including transactional records and textual narratives, into unified predictive architectures. Multimodal deep learning and multi-task optimization strategies have demonstrated strong potential for handling complex interactions between structured and unstructured signals in various application domains [10,11]. However, their application to CLV prediction in hospitality is still insufficiently explored, representing a gap in the literature and a missed opportunity for more precise personalization strategies.
A further critical constraint of deep learning models in hospitality analytics concerns the lack of transparency and interpretability. While inscrutable models may achieve high predictive accuracy, their limited explainability restricts trust, regulatory acceptance, and practical deployment in managerial domains. Explainable artificial intelligence methods including SHAP and LIME have gained attention for their ability to provide both global and local explanations for complex predictive systems [12,13]. These techniques enable domain experts to understand feature contributions, uncover hidden biases, and validate model behavior. Despite their growing use in fraud detection, review analysis, and recommendation systems, explainable CLV prediction in hospitality has received very limited attention and remains largely underexplored.
This research directly builds upon our previous work in automated anomaly detection and explainable modeling of hotel reviews. In earlier studies, we introduced data-driven frameworks for detecting inconsistent and anomalous hotel reviews using machine learning and deep learning techniques [14,15]. These studies demonstrated that review anomalies and emotional inconsistencies significantly impact trust and perceived service quality in online booking platforms. In our complementary work, we proposed a deep learning framework for automated detection of negative hotel reviews and showed that integrating convolutional and recurrent architectures offer efficient identification of impactful dissatisfaction narratives [16]. Furthermore, our recent work on explainable neural network models for CLV prediction emphasized the importance of transparency in financial forecasting and customer analytics [17,18]. The present study extends these findings by unifying behavioral and emotional intelligence into a single interpretable multimodal deep learning framework, thereby advancing from anomaly detection in reviews to strategic CLV prediction.
The central research gap addressed in this study lies in the absence of interpretable multimodal architectures that explicitly integrate structured behavioral data and unstructured emotional narratives for CLV prediction in the hospitality industry. Existing models tend to focus on either transactional signals or textual sentiment independently, without modeling their joint influence on long-term customer value. Moreover, most deep learning approaches prioritize predictive performance and offer limited insights about behavioral and emotional factors and how they interact within the model. As a result, hospitality managers face limitations in their ability to translate predictions into effective strategies and operational actions.
In response to this gap, the aim of this study is to develop and empirically evaluate an interpretable multimodal deep learning framework for CLV prediction that bridges behavioral and emotional intelligence in the hospitality industry. The proposed method integrates structured booking and transactional features with transformer representations of review text through a cross-modal attention fusion mechanism. Model interpretability is achieved through a combination of SHAP-based global explanations for structured behavioral attributes, LIME-based local explanations for textual narratives, and attention weight visualization for cross-modality interaction analysis. Experimental evaluation is conducted on extensive publicly available hospitality datasets, with performance compared against traditional machine learning, unimodal deep learning, and existing hybrid approaches.
The primary contributions of this study are threefold. First, it introduces an interpretable multimodal deep learning architecture for CLV prediction that unifies behavioral and emotional intelligence within a single predictive framework. Second, it provides a comprehensive explainability strategy that enables transparent interpretation of both structured and unstructured feature contributions. Third, it empirically demonstrates that integrating emotional intelligence extracted from guest narratives significantly improves CLV prediction accuracy and practical decision support in the hospitality industry.
2. Materials and Methods
This section presents the methodological framework developed for the proposed interpretable multimodal CLV prediction system. The research design follows a rigorous data science pipeline that integrates data acquisition, exploratory data analysis, preprocessing, anomaly filtering, feature engineering, multimodal deep learning, model optimization, and explainable artificial intelligence. Each stage of the methodology is described in detail to ensure full transparency, reproducibility, and methodological integrity. The section begins with a comprehensive justification of dataset selection, followed by an analysis of statistical and emotional patterns present in the data. A key contribution of the pipeline is the explicit integration of our previously proposed automated anomaly detection framework for filtering unreliable hotel reviews. The methodology then proceeds with structured behavioral feature extraction, transformer-based emotional representation learning, the design of the multimodal architecture, training and optimization strategies, and finally the formal definition of evaluation metrics and tuning procedures.
2.1. Dataset Selection and Research Design
This study adopts a multimodal supervised regression framework in which structured transactional data and unstructured textual review data are jointly exploited to estimate CLV. The supervised regression is selected due to the continuous and economically interpretable nature of CLV as a numerical target variable, enabling direct modeling of expected long-term monetary contribution. The multimodal design allows the model to simultaneously learn from objective behavioral signals and subjective emotional expressions, capturing transactional dynamics and experiential drivers of customer value formation. The datasets were collected from the Kaggle platform and selected using four strict criteria: (i) the presence of high-dimensional behavioral attributes relevant to financial value modeling, (ii) the availability of large-scale hotel review corpora containing rich emotional content, (iii) public accessibility for full experimental reproducibility, and (iv) extensive prior use in the hospitality analytics and machine learning literature, which ensures methodological comparability and benchmarking validity.
The structured behavioral dataset is the Hotel Booking Demand Dataset [19], which contains more than 119,000 reservation-level observations. Each record includes attributes such as lead time, length of stay, average daily rate, market segment, deposit type, distribution channel, repeated guest indicator, seasonality information, and final booking outcome, including cancellation status. These attributes collectively encode the temporal, monetary, and behavioral mechanisms underlying customer engagement, booking stability, purchasing intensity, and churn behavior. From a financial modeling perspective, these variables directly correspond to the fundamental economic components of CLV, namely transaction frequency, monetary value, timing of cash flows, and cancellation risk, all of which are essential to long-term profitability estimation.
The unstructured emotional insights are drawn from the 515K Hotel Reviews Data in Europe dataset [20,21], and consist of 515,000 hotel reviews written by guests across multiple European destinations. These reviews represent subjective post-consumption evaluations and contain descriptions of service quality, staff professionalism, facilities, cleanliness, food quality, comfort, and perceived price fairness. Unlike transactional attributes that describe what customers do, these narratives explain why customers behave in a certain way and how experiences shape satisfaction, trust formation, and loyalty development over time. From a behavioral economics standpoint, these texts encode affective and cognitive evaluations that influence repeat purchase behavior, word-of-mouth diffusion, and long-term revenue potential. Owing to its scale and diversity, the dataset provides a strong empirical basis for linking experiential signals to customer value.
A multimodal pairing strategy was designed to construct a joint dataset without relying on direct customer identifiers, which are unavailable due to privacy constraints. Multimodal alignment was achieved using a probabilistic mapping
where and denote the structured and textual feature dimensions, and denotes the final multimodal dataset. The alignment integrates three complementary criteria: hotel identity consistency, temporal proximity between stay and review publication, and semantic similarity of contextual metadata. This fusion strategy supports behavioral–emotional pairing while preserving user anonymity, ensuring compliance with ethical standards and data protection regulations. By avoiding hard deterministic linking, this approach also mitigates alignment noise and systematic pairing bias.
An overview of the complete data integration and preprocessing pipeline is illustrated in Figure 1. The figure reports the sequential stages of structured data cleaning, textual preprocessing, anomaly detection and filtering, leading to multimodal alignment. The exact numerical composition of the datasets before and after each preprocessing step is summarized in Table 1, highlighting the progressive refinement of the data and the final scale of the multimodal learning corpus.
2.2. Exploratory Data Analysis
Exploratory Data Analysis (EDA) was conducted in multiple stages to systematically examine the statistical structure, behavioral dynamics, and emotional distribution of the data prior to model construction. This step is essential for validating fundamental economic assumptions underlying CLV modeling, identifying non-stationary behavior, and guiding appropriate normalization, feature engineering, and loss function design. Let the structured feature matrix be denoted as
where denotes the number of reservation-level observations and represents the dimensionality of the behavioral feature space.
For each feature , descriptive statistics, including mean, standard deviation, variance, skewness, and kurtosis, were computed to quantify central tendency, dispersion, and distributional characteristics. The analysis revealed strongly right-skewed and heavy-tailed distributions for monetary value, booking frequency, and lead time. This indicates that a small fraction of customers generate a disproportionately large share of total revenue, while the majority exhibit sparse and irregular engagement. The observed pattern is fully in line with revenue distributions of the Pareto family and supports the central economic logic on which CLV theory is built. It also points to the need for stable normalization, nonlinear transformations of input features, and loss functions that react carefully to errors when extreme values are present.
Correlation analysis using both Pearson and Spearman rank coefficients revealed strong interdependencies between lead time, cancellation probability, pricing volatility, seasonal demand, and repeated guest behavior. While Pearson correlation captured dominant linear trends, Spearman correlation exposed additional nonlinear dependencies that would otherwise remain undetected [22,23]. These results show that customer engagement in hospitality is shaped by complex patterns that vary across situations and conditions and cannot be captured well by simple linear statistical models. This finding directly justifies the use of flexible ensemble learning methods and deep neural network architectures in subsequent CLV modeling stages.
Temporal density estimation was conducted using kernel density estimation (KDE)
where denotes a smoothing kernel and h is the bandwidth parameter controlling temporal resolution. In all experiments, a Gaussian kernel was used, and the bandwidth h was selected via Silverman’s rule of thumb. This analysis exposed distinct daily, weekly, and seasonal booking cycles driven by business travel patterns, weekend leisure demand, and annual tourism seasonality. The observed multimodal temporal structure confirms the nonstationary nature of booking behavior and directly supports the construction of behavioral features that account for seasonal patterns, as well as rolling temporal aggregates.
For the textual data corpus , comprehensive natural language exploratory analysis was performed, including token frequency analysis, document length distribution assessment, sentiment polarity estimation, and language detection. The corpus exhibits a wide emotional spectrum ranging from strongly negative dissatisfaction narratives to highly positive satisfaction expressions, with substantial variation in intensifier usage, affective polarity shifts, and terminology specific to a hospitality domain. This emotional heterogeneity confirms that guest narratives encode rich affective and experiential information that cannot be reduced to simple polarity scores alone.
The Figure 2 illustrates that cancellation probability is negatively associated with monetary value and repeated guest status, indicating that high-value and loyal customers are less likely to cancel reservations. Lead time shows a moderate positive correlation with both pricing volatility and seasonal demand, reflecting price adjustments and demand fluctuations across booking horizons. Monetary value is strongly correlated with repeated guest behavior, supporting the well-established regularity that loyal guests generate a disproportionate share of revenue. The presence of several medium-strength correlations further suggests that CLV drivers operate together rather than in isolation, reinforcing the need for multivariate modeling approaches capable of capturing interaction effects rather than relying solely on marginal feature contributions.
2.3. Automated Anomaly Detection and Review Filtering
One of the core methodological contributions of this work is the integration of our previously proposed automated review anomaly detection framework. Through earlier studies, we demonstrated that hotel review platforms contain a non-negligible proportion of inconsistent, duplicated, contradictory, or temporally anomalous reviews that can introduce systematic bias into learning systems if not properly addressed. Such review records distort emotional representation learning and downstream financial prediction by injecting artificially amplified or contradictory sentiment signals into multimodal models.
From a statistical learning perspective, the presence of anomalous textual observations increases the empirical risk by introducing noise with varying variance into the training distribution, which in turn harms generalization performance and makes the optimization process less stable. In particular, transformer-based language models are highly sensitive to sentiment polarity distributions and duplication artifacts, which may result in overconfident but misleading emotional embeddings. Therefore, robust anomaly filtering is a necessary preprocessing step to ensure semantic consistency, emotional authenticity, and financial realism within the learning pipeline. By embedding this filtering mechanism into the CLV modeling framework, the proposed approach directly links review integrity to economic inference quality and upgrades textual feedback from a noisy secondary source of information to a reliable driver of value prediction.
Each review was assigned a composite anomaly score defined as
where denotes the sentiment contradiction score between the review title and its body, quantifies semantic similarity to other reviews indicating duplication, and captures temporal posting irregularities. The weighting coefficients were normalized as
ensuring that the anomaly score represents an interpretable weighted combination of independent irregularity components. Prior to aggregation, each anomaly component , , and is linearly rescaled to the interval using min–max normalization, which guarantees that the final score .
The sentiment contradiction score is computed as the absolute polarity deviation between the review title sentiment and the review body sentiment , given by
where sentiment values are normalized to the interval . Large values of indicate logically inconsistent reviews, such as positive titles accompanied by strongly negative review content or vice versa.
The duplication score is derived from cosine similarity of the review embedding with all other review embeddings in the corpus
where values close to one indicate near-duplicate submissions frequently associated with spam or automated content generation.
The temporal anomaly score captures irregular posting behavior and is computed using deviations in the time gaps between consecutive reviews within review-level and platform-level temporal distributions. Let denote the posting interval between consecutive reviews, then
where and denote the mean and standard deviation of posting intervals across the dataset. Large standardized deviations indicate automated or coordinated activities.
Reviews satisfying
were excluded from the modeling process, where denotes a tuned anomaly acceptance threshold. This threshold was selected empirically to balance data retention and noise suppression, ensuring that only statistically and semantically irregular observations were removed. Formally, the retained dataset is defined as
This filtering ensures that emotional embeddings generated by the transformer model correspond to authentic guest experiences rather than artificially manipulated signals. By eliminating polarity inversions caused by contradictions, near duplicate textual artifacts, and short periods of irregular posting, the filtering process stabilizes the emotional feature distribution and prevents contamination of the multimodal latent space.
At a theoretical level, anomaly filtering reduces variance in the risk minimization process, improves the ratio of signal to noise in textual embeddings, and strengthens the stability of convergence in multimodal optimization. As a result, it enhances predictive accuracy and model interpretability by ensuring that explainability methods operate on credible emotional representations rather than on adversarial or corrupted inputs.
The numerical impact of anomaly removal is reported in Table 2, which confirms that approximately 10% of the initial review corpus is identified as anomalous and excluded prior to model training. This proportion is consistent with prior findings on user-generated content platforms. The stepwise retention rates indicate that the anomaly filtering pipeline removes problematic reviews in a controlled manner while preserving over 90% of the corpus, maintaining sufficient statistical power for training deep models and ensuring stable CLV estimation.
2.4. Structured Behavioral Feature Engineering
Raw transactional attributes extracted from reservation records were systematically transformed into indicators relevant for CLV using a hybrid feature engineering strategy that combines the classical Recency–Frequency–Monetary (RFM) framework with behavioral descriptors tailored to the hospitality sector. This transformation is essential for converting heterogeneous transactional logs into stable and economically interpretable predictors suitable for deep learning optimization.
For each customer i, the engineered behavioral feature vector is defined as
where:
- (Recency) denotes the elapsed time since the most recent booking and captures temporal customer engagement decay;
- (Frequency) denotes the total number of completed bookings within the observation window and reflects long-term interaction intensity;
- (Monetary Value) denotes the cumulative financial expenditure and directly encodes historical revenue contribution;
- (Length of Stay) represents the average duration of hotel stays and captures service consumption depth;
- (Cancellation Pressure) quantifies the empirical cancellation ratio and serves as a behavioral indicator for uncertainty, instability, and churn risk;
- (Price Sensitivity) measures the responsiveness of booking behavior to price variations and promotional conditions;
- (Behavioral Volatility) captures temporal irregularity in booking behavior and reflects shifts in engagement stability over time.
Because the datasets lack persistent customer identifiers, index i denotes a pseudo-customer obtained via probabilistic matching of recurring booking attributes.
This representation captures temporal, financial, and operational aspects of customer behavior, addressing the multidimensional nature of CLV determination in hospitality.
To ensure numerical stability, variance homogeneity, and balanced gradient propagation during neural network training, each continuous behavioral attribute was normalized using min–max scaling:
This transformation maps all behavioral features to the unit interval , eliminating scale dominance among monetary, temporal, and frequency-driven variables. From an optimization standpoint, min–max normalization improves the convergence speed of gradient-based learners and prevents saturation effects in activation functions.
Beyond static point estimates, temporal dynamics of customer behavior were explicitly modeled using rolling window statistics, exponential smoothing, and trend decomposition. Let denote a time-indexed transactional signal. The exponential smoothing is given as
where controls the memory depth of temporal influence. Rolling window aggregation further enables the extraction of short-term and long-term behavioral dynamics by computing localized statistics
Trend decomposition was applied to separate long-term behavioral drift from short-term seasonal fluctuations, thereby improving stationarity properties of the derived features. This is important in hospitality environments characterized by strong weekly and seasonal demand cycles.
The combined use of RFM encoding, volatility modeling, price responsiveness estimation, and temporal smoothing produces stationary, scale-normalized, and economically interpretable behavioral features. These engineered variables constitute the structured behavioral input branch of the multimodal deep learning architecture and support stable CLV estimation. This transformation reduces variance and enhances generalization by aligning transactional data with the assumptions of deep neural function approximation, making the resulting feature space suited for both deep encoders and explanation methods.
The structured feature engineering process converts raw booking variables into financially meaningful behavioral indicators suitable for CLV modeling. Temporal variables such as lead time and stay intervals are transformed into recency and volatility measures, transactional volumes are aggregated into frequency indicators, and monetary expenditures are consolidated into cumulative and average revenue descriptors. Adjustments tailored to hospitality further quantify cancellation pressure, price sensitivity, and stay stability.
2.5. Textual Preprocessing and Transformer Encoding
Textual preprocessing was designed to suppress linguistic noise while preserving the semantic content of guest narratives. Since hotel reviews exhibit high lexical variability, informal language patterns, and multilingual characteristics, a robust normalization pipeline is essential for stable deep representation learning. The preprocessing workflow consisted of Unicode normalization to eliminate encoding inconsistencies, systematic lowercasing to reduce lexical sparsity, removal of punctuation and non-informative stopwords, and truncation to a fixed maximum sequence length to ensure computational feasibility and uniform tensor dimensions during transformer inference.
Tokenization was performed using an encoding strategy that operates on subword units and is derived from byte-pair encoding (BPE), which breaks rare and morphologically complex words into statistically meaningful smaller units. This approach offers two critical advantages: (i) it mitigates the unknown word problem inherent in multilingual hospitality corpora, and (ii) it preserves semantic consistency across morphologically related word forms, enabling generalization across different languages and writing styles.
Each preprocessed review was embedded through RoBERTa transformer encoder as
where denotes the tokenization operator and the [CLS] token represents the global contextual embedding of the full review sequence. Unlike conventional bag-of-words or TF–IDF representations, the transformer-based embedding explicitly models bidirectional token dependencies through self-attention mechanisms, allowing context-aware interpretation of emotionally charged expressions and references to specific aspects of the service [24].
From a representational learning perspective, the resulting embedding vector captures high-level emotional polarity, sentiment intensity, and fine-grained experiential semantics related to staff behavior, cleanliness, comfort, location, noise, food quality, and perceived value for money. The self-attention layers compute token relevance weights
where is the query vector for token i, is the key vector for token j, and is the main dimensionality. The dot product measures how strongly token j is related to token i in the current context, while division by prevents excessively large values that would otherwise make the softmax distribution overly sharp. The subsequent softmax operation normalizes these scores into probabilities that sum to one across all tokens in the sentence, over all positions j for each query token i. As a result, the model assigns higher attention weights to emotionally charged or semantically important words (e.g., “rude”, “dirty”, “excellent”, “overpriced”) and attenuates irrelevant background tokens.
The use of RoBERTa is particularly justified in hospitality analytics because it benefits from pretraining on massive natural language corpora with dynamically masked language modeling and the removal of prediction constraints. These architectural refinements yield superior contextual sensitivity compared to traditional BERT, especially in capturing subtle affective shifts, contrastive evaluations, and satisfaction cues common in text reviews [25].
Thus, the extracted textual representation forms a dense emotional intelligence descriptor that complements structured transactional indicators in the multimodal CLV prediction framework. By embedding both sentiment polarity and experiential semantics into a unified latent space, the transformer branch provides the emotional foundation for explainable valuation modeling.
Figure 3 illustrates the full automated anomaly detection workflow employed in this study. The pipeline begins with raw review ingestion and proceeds through three independent anomaly dimensions. First, the sentiment contradiction module evaluates inconsistencies between review titles and bodies to identify polarity mismatches. Second, semantic duplication analysis quantifies abnormal review similarity patterns using similarity measures in the learned representation space. Third, temporal irregularity detection captures unnatural posting frequency and burst patterns indicative of artificial or coordinated behavior. The outputs of all three modules are aggregated through a weighted linear fusion scheme to form the final composite anomaly score .
2.6. Multimodal Deep Learning Architecture
The proposed multimodal CLV prediction architecture is designed as a neural network that explicitly models the complementary nature of structured behavioral intelligence and unstructured emotional intelligence. The architecture consists of two parallel representation learning branches followed by an attention-based cross-modal fusion module and a final regression head for CLV estimation.
The behavioral branch processes the feature vector and is defined as
where represents a multilayer perceptron composed of fully connected layers with nonlinear activation functions and denotes the corresponding learnable parameters. This branch is responsible for extracting latent representations of guest behavioral dynamics, including recency effects, spending intensity, booking stability, and cancellation patterns.
In parallel, the textual branch encodes the emotional and semantic content of guest reviews using a deep transformer-based encoder. The textual representation is obtained as
where denotes the contextual embedding produced by the transformer model for review , and corresponds to the fine-tuned transformer weights. This representation captures affective intensity, subjective service evaluations, and contextual experiential patterns that are not observable in structured transactional data.
To integrate the heterogeneous representations, a cross-modal attention-based fusion mechanism is employed. The attention score is computed as
where denotes feature concatenation, W is a trainable projection matrix, and denotes the sigmoid activation function. The scalar attention coefficient determines the relative weighting of behavioral and textual representations for each individual prediction instance.
The fused multimodal representation is then constructed as
which allows the model to dynamically interpolate between behavioral and emotional modalities for each customer. This formulation enables adaptive reweighting of transactional and experiential information depending on the customer segment, engagement intensity, and emotional extremity expressed in reviews.
Finally, the CLV prediction is obtained through a fully connected regression head
where denotes the output function and represents its learnable parameters. This final layer transforms the fused latent representation into a scalar estimate of CLV.
The overall architecture implements a fully differentiable end-to-end multimodal learning framework in which behavioral and emotional signals are jointly optimized to minimize prediction error. The attention-based fusion mechanism plays a central role in controlling the relative contribution of each modality, enabling personalized CLV estimation. This design ensures that emotionally driven service experiences can either reinforce or suppress financially driven behavioral trends depending on the individual customer profile.
The complete multimodal CLV prediction framework is illustrated in Figure 4. It highlights that the final CLV estimate arises from combining transactional information with signals extracted from guest reviews, where the relative contribution of each source is adaptively determined by the model.
2.7. Training Procedure and Optimization Strategy
Given a set of multimodal training samples , where denotes structured behavioral features, represents the transformer-based textual embeddings, and is the corresponding ground-truth CLV, the multimodal model parameters are estimated by minimizing the risk defined by the mean squared error (MSE) objective
where denotes the predicted CLV value produced by the multimodal fusion network. The use of MSE is analytically justified due to the continuous and unbounded nature of monetary CLV targets, as well as its strong penalization of large prediction deviations, which is particularly important for high-value customer segments.
Model optimization is performed using stochastic gradient-based learning through forward propagation, gradient backpropagation, and iterative parameter updates with the Adam optimizer. Adam estimates adaptive first- and second-order moments of the gradient, allowing stable convergence under heterogeneous feature scales and nonstationary gradient statistics. This property is especially critical in multimodal architectures where behavioral and textual feature distributions differ in magnitude and variability. At each iteration, Adam adjusts individual parameter learning rates based on past gradients, enabling faster progress along shallow directions of the loss surface, while preventing oscillations in steep regions.
To mitigate overfitting and improve generalization performance, dropout regularization is applied to hidden layer activations according to
where p denotes the dropout rate and is a binary mask that stochastically suppresses neuron activations during training. Each component takes the value 1 with probability p (unit kept) and 0 with probability (unit dropped), so that a different subnetwork is effectively sampled at every optimization step. This mechanism effectively performs implicit ensemble averaging across many such subnetworks, reduces co-adaptation of feature detectors across modalities, and improves robustness of the learned representations.
In addition, structural model complexity is constrained through weight decay, yielding the regularized training objective
where controls the strength of penalization applied to large parameter magnitudes. This regularization term improves numerical stability, reduces variance in parameter estimation, and mitigates the risk of overfitting in extensive architectures [26]. From a Bayesian perspective, regularization is equivalent to placing a zero-mean Gaussian prior on the weights, which constrains parameter growth and encourages smoother, more generalizable solutions.
Training is conducted over smaller batches to ensure computational scalability and stable gradient estimation. Early stopping is employed based on validation loss stabilization, where training is terminated if no meaningful improvement is observed over a predefined number of epochs. This strategy enables implicit regularization and ensures strong generalization performance without excessive parameter tuning.
Collectively, the combination of regression optimization, Adam adaptive learning, stochastic dropout regularization, and weight penalization provides a stable and scalable training framework suitable for comprehensive multimodal CLV modeling.
2.8. Baseline Models
Baseline models were introduced to establish strong comparative reference points and to isolate the individual contributions of multimodal fusion and explainability mechanisms. The selected baselines represent three major families of predictive modeling commonly used in hospitality analytics: ensemble tree-based learning, classical neural networks, and deep transformer-based textual regression.
Random Forest Regression was selected as a nonparametric ensemble method capable of capturing nonlinear relationships and feature interactions in structured behavioral data without requiring extensive feature scaling. Its inherent bagging mechanism and random feature selection make it particularly resistant to overfitting in noisy transactional environments [27].
Gradient Boosting Machines were included as a strong sequential ensemble learner that iteratively corrects residual prediction errors. This class of models is widely regarded as one of the strongest baselines for tabular financial prediction tasks and serves as a highly competitive point of reference for evaluating deep learning performance [28].
A classical Multilayer Perceptron trained solely on structured behavioral features was also included to assess the incremental contribution of deep nonlinear representation learning in the absence of emotional intelligence. This model isolates the benefit of neural architectures for behavioral CLV modeling while preserving comparability with classical machine learning.
Finally, a unimodal Transformer Regression model trained exclusively on textual embeddings was implemented to quantify the isolated predictive contribution of emotional intelligence derived from guest narratives. This baseline allows comparison between purely behavioral CLV prediction and purely emotional CLV prediction, providing a direct empirical justification for multimodal fusion.
Taken together, these baseline models facilitate a structured analysis of performance gains, distinguishing contributions from behavioral information, emotional language, model complexity, and cross-modal interaction mechanisms.
2.9. Hyperparameter Tuning
Hyperparameter optimization was conducted to ensure that both baseline and proposed models operated under optimal learning conditions and that performance differences reflect genuine modeling advantages instead of suboptimal parameter choices. Two complementary methods were used: structured grid search for low-dimensional hyperparameter spaces and Bayesian optimization for high-dimensional, nonlinear optimization surfaces.
The hyperparameter space included learning rate, depth and width of hidden layers, batch size, dropout probability, attention projection dimension, and regularization coefficients. Formally, hyperparameter tuning is treated as a validation-loss minimization problem. The optimal configuration is defined as
Grid search was applied primarily to baseline tree-based and shallow neural models due to their relatively limited parameter complexity. Bayesian optimization was used for the multimodal deep learning architecture to efficiently explore high-dimensional hyperparameter interactions [29].
Early stopping, learning rate scheduling, and gradual increase of the learning rate were applied throughout tuning to prevent unstable convergence and overfitting. This structured strategy ensures a balanced trade-off between predictive accuracy, training stability, and generalization performance.
2.10. Explainability Framework
A central objective of this study is not only to achieve high predictive accuracy in CLV estimation but also to ensure full transparency, interpretability, and managerial usability of the proposed multimodal deep learning framework. In hospitality analytics, predictive models that do not provide interpretability (“black-box” models) offer limited practical value, as revenue managers, marketers, and decision-makers must understand why specific customers are classified as high or low value in order to translate predictions into actionable strategies. To address this requirement, a comprehensive explainability framework was adopted that integrates global feature attribution, localized instance-level interpretation, and cross-modal interaction analysis [30,31].
Global behavioral feature importance was computed using SHAP (SHapley Additive exPlanations), a theoretically grounded explainability approach based on cooperative game theory. SHAP values decompose each individual CLV prediction into additive feature contributions by computing the average marginal effect of a given feature across all possible feature coalitions. Formally, the SHAP value of feature i is defined as
where F denotes the full set of input features and S represents all possible subsets that exclude feature i. This formulation ensures three fundamental properties: local accuracy, consistency, and additivity. As a result, SHAP provides a reliable and stable ranking of behavioral drivers such as monetary value, booking frequency, cancellation pressure, and price sensitivity in terms of their marginal financial influence on CLV predictions at the population level.
Local textual interpretability was obtained using LIME (Local Interpretable Model-Agnostic Explanations), which approximates the highly nonlinear transformer-based prediction function in the vicinity of an individual instance using a locally weighted linear surrogate model. The local approximation is defined as
where z denotes the perturbed textual feature space and w represents the locally fitted coefficients that quantify the contribution of individual words and phrases to the predicted CLV value. This enables direct inspection of emotionally influential expressions within guest reviews, allowing identification of linguistic signals associated with satisfaction, dissatisfaction, loyalty, trust, comfort, and perceived service quality at the individual customer level [32].
Cross-modal attention visualization was additionally employed to reveal how the neural network dynamically allocates relative importance between structured behavioral signals and unstructured emotional representations. The attention weights learned during multimodal fusion directly quantify the contribution of each modality to the final prediction on a per-sample basis. This enables explicit interpretation of behavioral–emotional coupling across different customer segments, particularly for distinguishing patterns between high-value, medium-value, and low-value customers.
Together, this multi-level explainability framework transforms the proposed multimodal CLV prediction model from a purely predictive mechanism into a fully interpretable financial decision-support system. It enables hospitality managers to understand not only which customers are valuable, but also why specific behavioral and emotional factors drive long-term economic value, thereby supporting transparent, justifiable, and strategically actionable customer management decisions.
2.11. Evaluation Metrics
Model performance was evaluated using four complementary error and fit quality metrics that capture absolute deviations, variance sensitivity, explanatory power, and proportional predictive stability across heterogeneous customer value segments [33]. The combined use of these metrics ensures a robust assessment of CLV prediction accuracy that is not affected by scale and is financially interpretable.
Mean Absolute Error (MAE) is defined as
and provides a direct measure of the average absolute financial deviation between predicted and true CLV values. MAE is suitable for business applications because it preserves the original monetary scale of the target variable and assigns equal weight to all prediction errors. Unlike RMSE, MAE does not disproportionately penalize outliers, making it a conservative and business-friendly indicator of typical monetary error.
Root Mean Square Error (RMSE) is defined as
which penalizes large prediction errors more heavily due to the quadratic term and is therefore particularly sensitive to the misestimation of high-value customers. This property is crucial in CLV modeling, where underestimating high-revenue customers can have significant financial consequence. From a statistical perspective, RMSE can be interpreted as the standard deviation of the residuals, linking it directly to error dispersion around the true CLV values.
The coefficient of determination is defined as
and quantifies the proportion of CLV variance explained by the model relative to a predictor based on the sample mean. The metric provides a normalized measure of overall predictive explanatory strength and allows direct comparison between different model architectures. In CLV settings characterized by inherently noisy purchasing behavior, moderate values of may therefore still correspond to models with high practical utility.
Finally, Mean Absolute Percentage Error (MAPE) is defined as
which normalizes prediction errors relative to individual customer value and enables proportional comparison across customer segments with highly heterogeneous spending behavior. MAPE is especially informative for evaluating prediction stability across low- and high-CLV customers simultaneously.
However, MAPE may be unstable for customers with very small true CLV values, as even tiny absolute errors can translate into disproportionately large percentage errors. The interpretation should therefore be complemented with MAE or RMSE to provide a more balanced and reliable view of predictive accuracy across the entire customer base.
Finally, the joint use of MAE, RMSE, , and MAPE ensures a balanced evaluation that reflects absolute financial accuracy, sensitivity to value deviations, overall explanatory power, and relative proportional stability of the proposed CLV prediction framework. This design reflects the asymmetric business costs of prediction errors, where underestimating high-value customers and misjudging low-spending segments carry different implications.
3. Results
This section presents the experimental results obtained from the proposed interpretable multimodal deep learning framework for CLV prediction. The results are reported in a progressive manner, beginning with baseline model evaluation, followed by the initial performance of the unimodal and multimodal deep learning models. Subsequently, the impact of optimization strategies is analyzed, and the final improved model performance is reported. The section concludes with a set of analytical observations that reveal key behavioral, emotional, and financial insights derived from the learned model representations. All numerical results are reported using multiple complementary evaluation metrics to ensure reliability and financial interpretability.
3.1. Baseline Model Performance
To establish dependable reference points, several baseline models were first trained and evaluated using the structured behavioral dataset and the textual dataset separately. These models included Random Forest Regression, Gradient Boosting Machines, a Multilayer Perceptron trained on behavioral features only, and a unimodal Transformer Regression model trained solely on review embeddings.
Table 3 reports the predictive performance of the listed initial models. As expected, classical ensemble models achieved solid initial performance on structured transactional data due to their strong nonlinear approximation capabilities. However, their performance was limited by the absence of emotional intelligence extracted from guest narratives.
The unimodal transformer model trained exclusively on textual data produced weaker performance than behavioral models, indicating that emotional signals alone are insufficient for accurate monetary value estimation. However, the value confirms that the review text contains information relevant for CLV prediction.
3.2. Initial Multimodal Deep Learning Performance
The proposed deep learning framework was next evaluated using both structured behavioral features and transformer-based textual embeddings. In the first configuration, default architectural parameters and moderate regularization were applied.
The initial multimodal model achieved a substantial improvement over all baseline learners, as shown in Table 4. The reduction in error metrics and increase in explained variance demonstrate that jointly modeling behavioral and emotional intelligence significantly enhances CLV prediction accuracy. Relative to the strongest behavioral baseline, the initial multimodal model reduces all error metrics by roughly 15% and raises from 0.76 to 0.84, indicating that emotional features from reviews contribute substantial incremental value to monetary CLV prediction. Nevertheless, the performance of this configuration still leaves room for improvement through architectural refinement and targeted regularization.
3.3. Model Optimization Improvement Effects
Following the initial multimodal evaluation, a systematic optimization phase was conducted. Optimization strategies involved:
- Bayesian hyperparameter tuning for learning rates, hidden layer widths, and attention dimensions,
- increased dropout regularization to suppress overfitting among high-value customers,
- reweighting of loss function to emphasize high-CLV segments,
- refined anomaly filtering thresholds to strengthen emotional representation purity,
- learning rate warmup and cosine decay scheduling.
These modifications resulted in consistent performance improvements across all evaluation metrics. The final optimized model performance is reported in Table 5.
Figure 5 illustrates the comparative improvement between the strongest behavioral baseline (Behavioral MLP) and the optimized multimodal architecture. The optimized multimodal model achieves consistent gains across all four evaluation metrics: absolute errors (MAE and RMSE) are reduced by roughly 30% and 27%, respectively, while increases by about 17% and MAPE drops by more than one third. These results indicate that incorporating emotional review information lowers typical monetary error, strengthens overall explanatory power, and stabilizes performance across heterogeneous CLV segments.
Compared to the initial multimodal configuration, optimization achieved an additional MAE reduction of approximately 16.0% and increased the explained variance by five percentage points. Relative to classical ensemble baselines, the optimized multimodal framework yields a total MAE reduction exceeding 32%.
The specific hyperparameter settings that produced the optimized results are summarized in Table 6. This configuration reflects a balance between model capacity and regularization strength, ensuring that the network remains expressive enough to capture nonlinear CLV patterns while avoiding overfitting to high-value outliers. In particular, the moderate hidden layer width, relatively strong dropout, and non-zero weight decay together stabilize training in the presence of heterogeneous behavioral and textual inputs.
3.4. Explainability and Feature Influence Analysis
To ensure full transparency and managerial interpretability of the proposed multimodal CLV prediction framework, a two-tier explainability strategy was adopted, combining global behavioral feature attribution via SHAP with local textual interpretation through LIME. In combination, these methods deliver insights into financial patterns across the entire customer base and clarify the emotional determinants of CLV for individual cases.
Global feature attribution using SHAP (SHapley Additive exPlanations) revealed that monetary value, booking frequency, cancellation pressure, price sensitivity, and stay duration represent the strongest behavioral determinants of CLV. These values are computed based on cooperative game theory and quantify the marginal contribution of each feature to the predicted CLV output by averaging over all possible feature coalitions
where F denotes the full feature set and S represents all subsets that exclude feature i.
The SHAP analysis demonstrates that cumulative spending () and booking frequency () act as the dominant revenue drivers, while cancellation pressure () and price sensitivity () exhibit strong suppressive effects on predicted CLV values. Stay duration () contributes moderately by reflecting service consumption intensity and repeat engagement stability.
Emotional embeddings derived from review text provided influential corrections to behavioral estimates, particularly for customers exhibiting moderate transactional engagement but extreme emotional polarity. This confirms that behavioral value alone does not fully explain long-term financial potential without accounting for subjective experiential satisfaction.
Figure 6 presents the global SHAP beeswarm plot for structured features. A key empirical finding is that strongly negative emotional language is consistently associated with suppressed CLV predictions even for customers with high historical monetary contributions. These findings demonstrate that emotional dissatisfaction moderates the development of customer economic value over time, showing that strong historical profitability does not ensure continued financial contribution when service experiences decline.
While SHAP enables global interpretability across the customer population, localized interpretability at the individual level was obtained through LIME (Local Interpretable Model-Agnostic Explanations). LIME approximates the highly nonlinear multimodal prediction function in the neighborhood of a specific instance using a locally weighted linear surrogate model
where z represents perturbed textual instances and w denotes locally fitted coefficients reflecting approximate word importance.
Local textual explanations generated through LIME demonstrated that phrases semantically associated with service failures, noise disturbance, hygiene problems, and staff unprofessionalism exert strong negative influence on predicted CLV values. Conversely, expressions of loyalty, comfort, perceived safety, staff friendliness, and value-for-money consistently increased localized CLV predictions. The findings confirm that emotions expressed in guest narratives provide predictive economic information and are not limited to descriptive reflections of service encounters.
Figure 7 presents three representative LIME explanations for individual customers with low, moderate, and high predicted CLV. For each case, red bars correspond to linguistic expressions that decrease the predicted CLV, whereas blue bars correspond to expressions that increase it. The first example (Guest 1) shows that negative service experiences such as “dirty bathroom”, “rude staff”, and “noise at night” exert strong downward pressure on CLV, outweighing positive aspects such as price or location. In contrast, Guest 2 illustrates a predominantly positive experiential profile in which phrases such as “very clean”, “friendly reception”, and “quiet room” shift the prediction toward a higher CLV range. The third example demonstrates an important managerial pattern: strong loyalty cues (e.g., “always stay here”) increase CLV, but occurring safety concerns and negative breakfast evaluations partially offset this effect, resulting in only a moderate overall value. These examples confirm that the model is behaviorally and emotionally interpretable, connecting financial value estimates directly to concrete service attributes described by guests.
3.5. Cross-Modal Attention Insights
To gain deeper insight into how the proposed multimodal architecture integrates behavioral and emotional intelligence, the learned cross-modal attention weights were systematically analyzed across different CLV segments. The attention mechanism dynamically regulates the relative influence of structured behavioral features and unstructured emotional embeddings in the final CLV estimation. This allows the model to adaptively emphasize transactional stability or experiential sentiment depending on the specific customer profile.
For high-value customers, the attention distribution was consistently dominated by behavioral signals, including cumulative monetary value, booking frequency, and stay regularity. These customers exhibit stable and predictable transactional patterns, which the model correctly prioritizes as the main indicators of long-term financial contribution. In this segment, emotional cues extracted from review text act primarily as corrective modifiers rather than dominant predictors. Negative emotional expressions slightly suppress predicted CLV in cases of dissatisfaction, whereas strong positive sentiment reinforces already elevated behavioral valuation. This behavior is economically consistent with the notion that loyal, high-spending customers are less sensitive to short-term emotional fluctuations unless persistent dissatisfaction is observed.
In contrast, for mid- and low-value customers, the attention mechanism assigns significantly higher relative weight to emotional representations. For these customer groups, transactional histories are typically sparse, volatile, or economically modest, limiting the predictive power of behavioral indicators alone. As a result, the model increasingly relies on experiential cues encoded in review sentiment, satisfaction with specific service aspects, and emotional intensity. Strong dissatisfaction in this group leads to a downward correction of CLV predictions, reflecting elevated churn risk and reduced future revenue potential. Conversely, exceptionally positive service experiences can produce upward adjustments, signaling potential long-term value growth for customers who have not yet exhibited strong behavioral commitment.
The differentiated attention dynamics across customer segments confirm that the multimodal model does not apply a uniform fusion strategy but instead learns a context sensitive weighting policy that is economically and behaviorally coherent. When behavioral loyalty is already well established, emotional signals contribute only limited additional value. However, they are critical for influencing future customer value in the early and middle stages of the customer lifecycle. This aligns with classical marketing and service management theory, which emphasizes that emotional satisfaction is particularly crucial in the development of lasting loyalty, whereas mature customer relationships are more strongly governed by habitual and financial behavior.
Figure 8 illustrates the distribution of learned cross-modal attention weights across customer value segments. The heatmap confirms the progressive shift from behavior-dominant attention in high-CLV segments toward emotion-dominant attention in low- and mid-CLV segments. These findings empirically validate the theoretical motivation for integrating emotional intelligence into CLV modeling and demonstrate that the proposed attention-based fusion mechanism successfully captures the nonlinear interactions between behavior and sentiment in hospitality customer valuation.
3.6. Analytical Observations and Key Findings
Several important empirical findings emerge from the results. As demonstrated by the comparative performance trends reported earlier, the incorporation of emotional intelligence strengthens CLV prediction across all evaluation metrics. In particular, the optimized multimodal model outperforms behavioral-only and text-only baselines, confirming the necessity of joint modeling.
- Emotional intelligence extracted from guest reviews contributes significantly to CLV prediction when combined with structured behavioral data.
- Review text on its own is insufficient for precise CLV estimation, but serves as an important adjustment mechanism within the multimodal framework.
- Automated anomaly filtering improves predictive accuracy and interpretability by eliminating unreliable emotional signals.
- Attention-based multimodal fusion enables dynamic reweighting of behavioral and emotional contributions at the individual customer level.
- Explainability analysis reveals that dissatisfaction has a disproportionately strong suppressive effect on long-term customer value.
To further investigate the stability of the optimized multimodal model across different customer value groups, a performance evaluation was carried out separately for each CLV segment. The results are summarized in Table 7. The model achieves the lowest relative error for high-CLV customers while maintaining strong predictive accuracy for low- and mid-value segments, indicating effective generalization across heterogeneous financial profiles. Notably, the lowest MAPE is observed in the high-CLV segment, demonstrating that the model is most accurate precisely where financial stakes are greatest.
To quantify the individual contribution of each architectural component, an ablation study was performed by progressively removing behavioral features, textual features, and the attention-based fusion mechanism. The detailed results are reported in Table 8. The full multimodal model achieves the strongest predictive performance, clearly demonstrating that emotional embeddings and attention-based fusion are necessary for improving CLV estimation accuracy.
Overall, the findings indicate that CLV in hospitality reflects a combined behavioral and emotional mechanism rather than simple transaction history and that only joint modeling of these components enables accurate and actionable financial forecasting.
3.7. Summary of Experimental Results
For direct methodological comparison, Table 9 provides a consolidated overview of the predictive performance achieved by all baseline, unimodal, and multimodal models. The optimized multimodal framework yields the lowest error values and the highest explained variance among all evaluated methods. The progressive improvement from models relying only on behavioral features to the fully optimized multimodal architecture reveals a clear hierarchy of performance across all metrics, offering strong practical and empirical support for multimodal integration in CLV prediction.
For visual clarity, Figure 9 presents a consolidated radar plot comparing all evaluated models across the four primary performance metrics (MAE, RMSE, , and MAPE). The optimized multimodal architecture forms the outer boundary of the radar plot across these metrics, thereby confirming its consistent and substantial superiority over baseline and unimodal alternatives.
4. Discussion
This study investigated the effectiveness of an interpretable multimodal deep learning framework for Customer Lifetime Value prediction by jointly modeling structured behavioral data and unstructured emotional signals extracted from guest reviews. The experimental results provide strong evidence that the integration of emotional intelligence with traditional transactional analytics yields substantial predictive and explanatory benefits for forecasting in hospitality.
The baseline evaluation demonstrated that classical ensemble methods and behavioral neural networks achieved reasonable predictive accuracy when relying only on structured booking and spending attributes. However, their performance remained limited in capturing the full complexity of long-term customer value formation, as reflected by the relatively higher MAE and RMSE values. The unimodal transformer model trained only on review text further confirmed that emotional information alone is insufficient for precise monetary prediction, although it retained moderate explanatory power, indicating that guest narratives encode nontrivial financial signals.
A key contribution of this research lies in demonstrating that multimodal fusion significantly enhances prediction accuracy beyond what can be achieved using either behavioral or emotional intelligence independently. The initial multimodal configuration already reduced prediction error substantially compared to all baseline models, while the fully optimized architecture achieved the strongest performance across all evaluation metrics. Bayesian hyperparameter tuning, combined with increased dropout and refined loss weighting for high-value segments, further consolidated these gains.
Beyond predictive performance, the explainability analysis provided important managerial and methodological insights. SHAP analysis identified monetary value, booking frequency, cancellation pressure, price sensitivity, and stay duration as the essential behavioral drivers of CLV, consistent with classical Recency–Frequency–Monetary theory and prior hospitality analytics literature. In parallel, textual explanations supported by LIME revealed that dissatisfaction related to hotel service, particularly associated with hygiene, noise, and staff behavior, exerts a strong suppressive effect on customer value, even among guests with a history of high spending. This finding highlights the economic importance of service recovery and reputation management beyond short-term revenue considerations.
The cross-modal attention mechanism further demonstrated that the relative importance of behavioral and emotional inputs varies systematically across customer segments. For high-value customers, behavioral signals dominate the fusion process, while emotional signals act primarily as corrective factors that adjust predicted value in the presence of emerging risk. In contrast, for low- and mid-value customers, emotional expressions exert significantly greater influence on predicted CLV. This result provides a quantitative confirmation of marketing theories suggesting that emotional satisfaction plays a disproportionately larger role during early and mid stages of customer lifecycle development.
An additional methodological contribution of this study is the integration of automated review anomaly filtering into the multimodal learning pipeline. The observed improvements in accuracy and interpretability after anomaly removal confirm that emotionally corrupted or duplicated reviews introduce measurable bias into financial prediction systems. This supports recent concerns in the literature regarding the reliability of unfiltered content for downstream predictive modeling.
Practically speaking, the proposed framework enables hospitality managers to move beyond non-transparent revenue forecasting toward explainable and actionable CLV estimation. The combined use of SHAP, LIME, and attention visualization provides multi-level transparency that allows decision makers to understand not only which customers are valuable, but also why specific customers are predicted to exhibit high or low long-term value. This capability is particularly relevant for strategic applications such as targeted loyalty programs, proactive churn prevention, and customer experience optimization.
Despite its strengths, several limitations of the present study should be acknowledged. First, CLV is operationalized as observed cumulative value within the available data horizon rather than as a fully prospective discounted lifetime estimate, which should be considered when interpreting absolute monetary levels. Second, although publicly available datasets were used, the multimodal alignment between transactional records and reviews was achieved probabilistically rather than through direct customer identifiers; while this preserves privacy and ethical compliance, it may introduce uncertainty into behavioral–emotional pairing. Third, the study focuses primarily on regression-based CLV prediction and does not explicitly model temporal dynamics of lifetime value or causal intervention effects.
Future research directions can extend the framework toward longitudinal CLV modeling using recurrent or temporal attention architectures, integrating additional unstructured data modalities such as images and voice reviews, and deploying causal inference techniques to distinguish correlation from actionable causation in emotional–financial interactions. Moreover, validating the framework in real hotel management environments would provide more detailed evidence of its practical business impact. This would enable direct observation of whether improved CLV prediction translates into measurable gains in retention, loyalty, and revenue growth.
5. Conclusions
This study proposed and empirically validated an interpretable multimodal deep learning framework for Customer Lifetime Value prediction in the hospitality industry. By integrating structured behavioral transaction data with transformer-based emotional representations of guest review text, this approach successfully bridges behavioral and emotional intelligence within a unified predictive architecture.
The experimental results demonstrate that multimodal fusion consistently outperforms traditional ensemble models, unimodal deep learning approaches, and classical behavioral neural networks. Relative to the strongest behavioral baseline, the optimized multimodal configuration reduces MAE from 168.7 to 118.9 ( reduction) and RMSE from 271.5 to 199.4 ( reduction), while increasing from 0.76 to 0.89. These results confirm that emotional intelligence extracted from guest narratives provides complementary predictive information that cannot be recovered from transactional behavior alone.
A significant contribution of this work also lies in its comprehensive explainability framework. The combined use of SHAP, LIME, and attention visualization enables simultaneous global financial attribution, local textual interpretation, and cross-modal interaction analysis. Through this multi-layered transparency, CLV prediction evolves from a forecasting task into a decision-support system ready for managerial implementation.
From a theoretical perspective, the findings provide quantitative support for the view that sustainable customer value in hospitality is shaped not only by transactional engagement but also by subjective service experiences and emotional satisfaction. From a practical standpoint, the framework enables hospitality organizations to design more precise segmentation strategies, personalize loyalty programs, improve service recovery policies, and allocate marketing resources with higher economic efficiency.
Beyond methodological innovation, the proposed framework has clear practical implications for the hospitality industry. By providing accurate CLV forecasts and interpretable drivers behind those forecasts, the system supports hotels in transitioning from reactive revenue management toward proactive value strategies. Managers can identify high-value customers at risk due to negative experiential signals, detect emerging dissatisfaction earlier, and intervene through targeted service recovery actions. At the same time, the approach supports prioritization of marketing investments toward segments with high lifetime potential rather than short-term transactional volume, aligning analytics capabilities with strategic profitability objectives.
More broadly, the results demonstrate the viability of multimodal, explainable artificial intelligence for financial prediction that combines structured records with subjective human language. Although this work focused on hospitality, the proposed framework is directly transferable to domains such as airline loyalty programs, platforms that run on subscriptions, retail membership systems, and customer finance applications where experiential feedback plays a crucial economic role. Future research may extend this methodology for real-time streaming environments, online learning systems, and interfaces where analysts interact with explainable AI tools during operational decision-making. Such developments have the potential to strengthen trust, accountability, and adoption of CLV analytics powered by AI in practice.
In summary, this work demonstrates that explainable multimodal artificial intelligence can provide a powerful, transparent, and economically meaningful basis for strategic customer value management in hospitality. By unifying behavioral, emotional, and financial intelligence within a single framework, this approach moves CLV prediction from descriptive reporting to actionable analytics. It lays a solid foundation for future research at the intersection of deep learning, explainable AI, and financial intelligence oriented toward customer value management across service industries.
Author Contributions
Conceptualization, M.N.; methodology, M.N. and M.M.; machine learning model design and implementation, M.N.; software development and system integration, M.N.; data pre-processing and feature engineering, M.N.; validation, M.N., M.M. and Ž.R.; formal analysis, M.N.; investigation, M.N. and Ž.R.; economic and financial interpretation of CLV results, Ž.R.; business modeling and market relevance assessment, Ž.R.; resources, M.N.; data curation, M.N.; writing (original draft preparation), M.N.; writing (review and editing), M.M. and Ž.R.; visualization, M.N.; scientific supervision, methodological mentoring, and critical manuscript revision, M.M.; project administration, M.N. All authors have read and agreed to the published version of the manuscript and accept responsibility for its content.
Funding
This research received no external funding. The article processing charge (APC) was fully covered by the authors from their own funds.
Data Availability Statement
The data used in this study are publicly available from the Kaggle platform and include the Hotel Booking Demand Dataset and the 515K Hotel Reviews Data in Europe dataset. These datasets provide the structured transactional records and large-scale unstructured guest review texts used for multimodal Customer Lifetime Value modeling. The full source code, data preprocessing pipelines, feature engineering procedures, and trained deep learning model implementations were developed and executed using the Google Colab cloud-based Python environment and are available upon reasonable request for research verification and reproducibility purposes.
Acknowledgments
This research was supported by the Science Fund of the Republic of Serbia, Grant No. 7502, Intelligent Multi-Agent Control and Optimization Applied to Green Buildings and Environmental Monitoring Drone Swarms (ECOSwarm).
Conflicts of Interest
The authors declare no conflicts of interest. The authors further declare that there are no personal relationships or circumstances that could be perceived as inappropriately influencing the representation or interpretation of the reported research results. The funders had no role in the design of the study; in the collection, analyses, or interpretation of data; in the writing of the manuscript; or in the decision to publish the results.
Abbreviations
The following abbreviations are used in this manuscript:
| AI | Artificial Intelligence |
| CLV | Customer Lifetime Value |
| DL | Deep Learning |
| EDA | Exploratory Data Analysis |
| KDE | Kernel Density Estimation |
| ML | Machine Learning |
| MLP | Multilayer Perceptron |
| RF | Random Forest |
| GBM | Gradient Boosting Machine |
| RFM | Recency–Frequency–Monetary |
| SHAP | SHapley Additive exPlanations |
| LIME | Local Interpretable Model–Agnostic Explanations |
| XAI | Explainable Artificial Intelligence |
| NLP | Natural Language Processing |
| RoBERTa | Robustly Optimized BERT Pretraining Approach |
| BERT | Bidirectional Encoder Representations from Transformers |
| CLS | Classification Token |
| MAE | Mean Absolute Error |
| MSE | Mean Squared Error |
| RMSE | Root Mean Square Error |
| MAPE | Mean Absolute Percentage Error |
| Coefficient of Determination |
References
- Firmansyah, E.B.; Machado, M.R.; Moreira, J.L.R. How Can Artificial Intelligence (AI) Be Used to Manage Customer Lifetime Value (CLV)—A Systematic Literature Review. Int. J. Inf. Manag. Data Insights 2024, 4, 100279. [Google Scholar] [CrossRef]
- Ali, N.; Shabn, O.S. Customer Lifetime Value (CLV) Insights for Strategic Marketing Success and Its Impact on Organizational Financial Performance. Cogent Bus. Manag. 2024, 11, 2361321. [Google Scholar] [CrossRef]
- Ma, H. Optimization of Hotel Financial Management Information System Based on Computational Intelligence. Wirel. Commun. Mob. Comput. 2021, 8680306. [Google Scholar] [CrossRef]
- Kanchanapoom, K.; Chongwatpol, J. Integrated Customer Lifetime Value (CLV) and Customer Migration Model to Improve Customer Segmentation. J. Mark. Anal. 2023, 11, 172–185. [Google Scholar] [CrossRef]
- Guillet, B.D.; Zhang, Y.R.; Madanoglu, M.; Gao, L. Attribute-Based Pricing in Hotels: Analyzing Industry, Customer, and Behavioral Insights. Int. J. Hosp. Manag. 2026, 133, 104445. [Google Scholar] [CrossRef]
- Rita, P.; Ramos, R.; Borges-Tiago, M.T.; Rodrigues, D. Impact of the Rating System on Sentiment and Tone of Voice: A Booking.com and TripAdvisor Comparison Study. Int. J. Hosp. Manag. 2022, 104, 103245. [Google Scholar] [CrossRef]
- Xu, W.; Yao, Z.; Ma, Y.; Li, Z. Understanding Customer Complaints from Negative Online Hotel Reviews: A BERT-Based Deep Learning Approach. Int. J. Hosp. Manag. 2025, 126, 104057. [Google Scholar] [CrossRef]
- Botunac, I.; Brkić Bakarić, M.; Matetić, M. Comparing Fine-Tuning and Prompt Engineering for Multi-Class Classification in Hospitality Review Analysis. Appl. Sci. 2024, 14, 6254. [Google Scholar] [CrossRef]
- Manosuthi, N.; Lee, J.S.; Han, H. Causal-Predictive Model of Customer Lifetime/Influence Value: Mediating Roles of Memorable Experiences and Customer Engagement in Hotels and Airlines. J. Travel Tour. Mark. 2021, 38, 461–477. [Google Scholar] [CrossRef]
- Li, Y.; Zeng, F.; Zhang, N.; Chen, Z.; Zhou, L.; Huang, M.; Zhu, T.; Wang, J. Multitask Learning Using Feature Extraction Network for Smart Tourism Applications. IEEE Internet of Things Journal 2023, 10(21), 18790–18798. [Google Scholar] [CrossRef]
- Pei, Y.; Wang, Y.; Wang, W.; Qi, J. Aspect-Based Sentiment Analysis with Multi-Task Learning. In Proceedings of the 2022 5th International Conference on Computing and Big Data (ICCBD), December 2022. [Google Scholar] [CrossRef]
- Shah, R.; Pawar, A.; Kumar, M. Enhancing Machine Learning Model Using Explainable AI. In Advances in Data and Information Sciences; Tiwari, S., Trivedi, M.C., Kolhe, M.L., Singh, B.K., Eds.; ICDIS 2023; Lecture Notes in Networks and Systems, Vol. 796; Springer: Singapore, 2024. [CrossRef]
- Salih, A.M.; Raisi-Estabragh, Z.; Galazzo, I.B.; Radeva, P.; Petersen, S.E.; Lekadir, K.; Menegaz, G. A Perspective on Explainable Artificial Intelligence Methods: SHAP and LIME. Adv. Intell. Syst. 2025, 7, 2400304. [Google Scholar] [CrossRef]
- Nikolić, M.; Stojanović, M.; Marjanović, M. Anomaly Detection in Hotel Reviews: Applying Data Science for Enhanced Review Integrity. In Proceedings of the 2024 32nd Telecommunications Forum (TELFOR); IEEE: Belgrade, Serbia November 2024. ; pp. 1–4. [CrossRef]
- Nikolić, M.; Stojanović, M.; Marjanović, M. Integrating Data Science and Predictive Modeling for Detecting Inconsistent Hotel Reviews. In UNITECH 2024—Selected Papers; Technical University of Gabrovo: Gabrovo, Bulgaria, 2024; pp. 104–110. [Google Scholar] [CrossRef]
- Nikolić, M.; Stojanović, M.; Marjanović, M. Integrating Deep Learning for Automated Detection of Negative Hotel Reviews. Facta Univ., Ser. Autom. Control Robot. 2025, 1–16. [Google Scholar] [CrossRef]
- Nikolić, M.; Rađenović, Ž.; Marjanović, M. Enhancing Hotel Management through Predictive AI Models for Customer Lifetime Value (CLV). In Proceedings of the International Multidisciplinary Scientific Conference “AI for a Smarter Tomorrow: AI-SMART 2025”, Belgrade, Serbia, 25–26 September 2025. to be published in proceedings. [Google Scholar]
- Nikolić, M.; Rađenović, Ž.; Marjanović, M. From Integrity to Income: Quantifying the Economic Impact of Reliable Online Reviews in the Hospitality Industry. In Proceedings of the International Scientific Conference ITEMA 2025 to be published in conference proceedings, Milan, Italy, 6 November 2025. [Google Scholar]
- Mostipak, J. Hotel Booking Demand. Kaggle Dataset. Available online: https://www.kaggle.com/datasets/jessemostipak/hotel-booking-demand (accessed on 9 Dec 2025).
- Liu, J. 515K Hotel Reviews Data in Europe [Dataset]. Kaggle. Available online: https://www.kaggle.com/datasets/jiashenliu/515k-hotel-reviews-data-in-europe (accessed on 9 Dec 2025).
- Antonio, N.; de Almeida, A.; Nunes, L. Hotel booking demand datasets. Data Brief 2019, 22, 41–49. [Google Scholar] [CrossRef]
- Asenova, M.; Llopis, J.; Gasco, J.; Gonzalez, R. Electronic Word-of-Mouth in the Hospitality Industry: A Comparative Study in Top Hotels. Int. J. Bus. Excell. 2024, 34, 201–225. [Google Scholar] [CrossRef]
- Abdirazakov, N.M.; Kushebayev, Z.T.; Numanova, F.A.; Orynbet, P.Z.; Myltykbayeva, G.E. Understanding the Relationships between Hotel Variables in Almaty, Kazakhstan: An Investigation Using Booking.com Data. Buketov Bus. Rev. 2023, 112, 7–18. [Google Scholar] [CrossRef]
- Souza, F.D.; Filho, J.B.D.O.E.S. Embedding Generation for Text Classification of Brazilian Portuguese User Reviews: From Bag-of-Words to Transformers. Neural Comput. Appl. 2023, 35, 9393–9406. [Google Scholar] [CrossRef]
- Pramudya, Y.G.; Alamsyah, A. Hotel Reviews Classification and Review-Based Recommendation Model Construction Using BERT and RoBERTa. In 2023 6th International Conference on Information and Communications Technology (ICOIACT); IEEE, 2023; pp. 437–442. [Google Scholar] [CrossRef]
- Moradi, R.; Berangi, R.; Minaei, B. A Survey of Regularization Strategies for Deep Models. Artif. Intell. Rev. 2020, 53, 3947–3986. [Google Scholar] [CrossRef]
- Singgalen, Y. Optimizing Machine Learning in Hospitality Industry: Implementation of Random Forest Model in Forecasting Hotel Guest Length of Stay. J. Kepariwisataan: Destinasi, Hospitalitas dan Perjalanan 2025, 9, 63–77. [Google Scholar] [CrossRef]
- Messias, A.; Rosa, G.; Couto, P.; Rodrigues, V.; Silva, L.M.; Marques, J. A New Hotel Classification Model Combining Guest Reviews with Official Hotel Classification Systems: Bridging Expert and Consumer Ratings. Tour. Hosp. Res. 2025, 0, 0. [Google Scholar] [CrossRef]
- Yadav, A.R.; Shekhar, S.; Vidyarthi, A.; Prakash, R.; Gowri, R. Hyper-Parameter Tuning with Grid and Randomized Search Techniques for Predictive Models of Hotel Booking. In Proceedings of the 2023 International Conference on Electrical, Electronics, Communication and Computers (ELEXCOM). [CrossRef]
- Gregoriades, A.; Pampaka, M.; Herodotou, H.; Christodoulou, E. Explaining Tourist Revisit Intention Using Natural Language Processing and Classification Techniques. J. Big Data 2023, 10, 60. [Google Scholar] [CrossRef]
- Harris, C.G. Using Explainable AI (XAI) to Understand Sentiment Analysis of Hotel Reviews. In International Conference on Frontiers of Artificial Intelligence, Ethics, and Multidisciplinary Applications; Springer Nature Singapore: Singapore, 2024; pp. 215–226. [CrossRef]
- Czerwinska, U. Interpretability of Machine Learning Models: How Can One Explain Machine Learning Models? In Applied Data Science in Tourism: Interdisciplinary Approaches, Methodologies, and Applications; Springer International Publishing: Cham, Switzerland, 2022; pp. 275–303. [CrossRef]
- Phumchusri, N.; Suwatanapongched, P. Forecasting Hotel Daily Room Demand with Transformed Data Using Time Series Methods. J. Revenue Pricing Manag. 2023, 22, 44–56. [CrossRef]
Figure 1.
Overview of the multimodal dataset construction and integration pipeline, illustrating structured transactional data preprocessing, textual review preprocessing, anomaly filtering, and final multimodal alignment.
Figure 1.
Overview of the multimodal dataset construction and integration pipeline, illustrating structured transactional data preprocessing, textual review preprocessing, anomaly filtering, and final multimodal alignment.
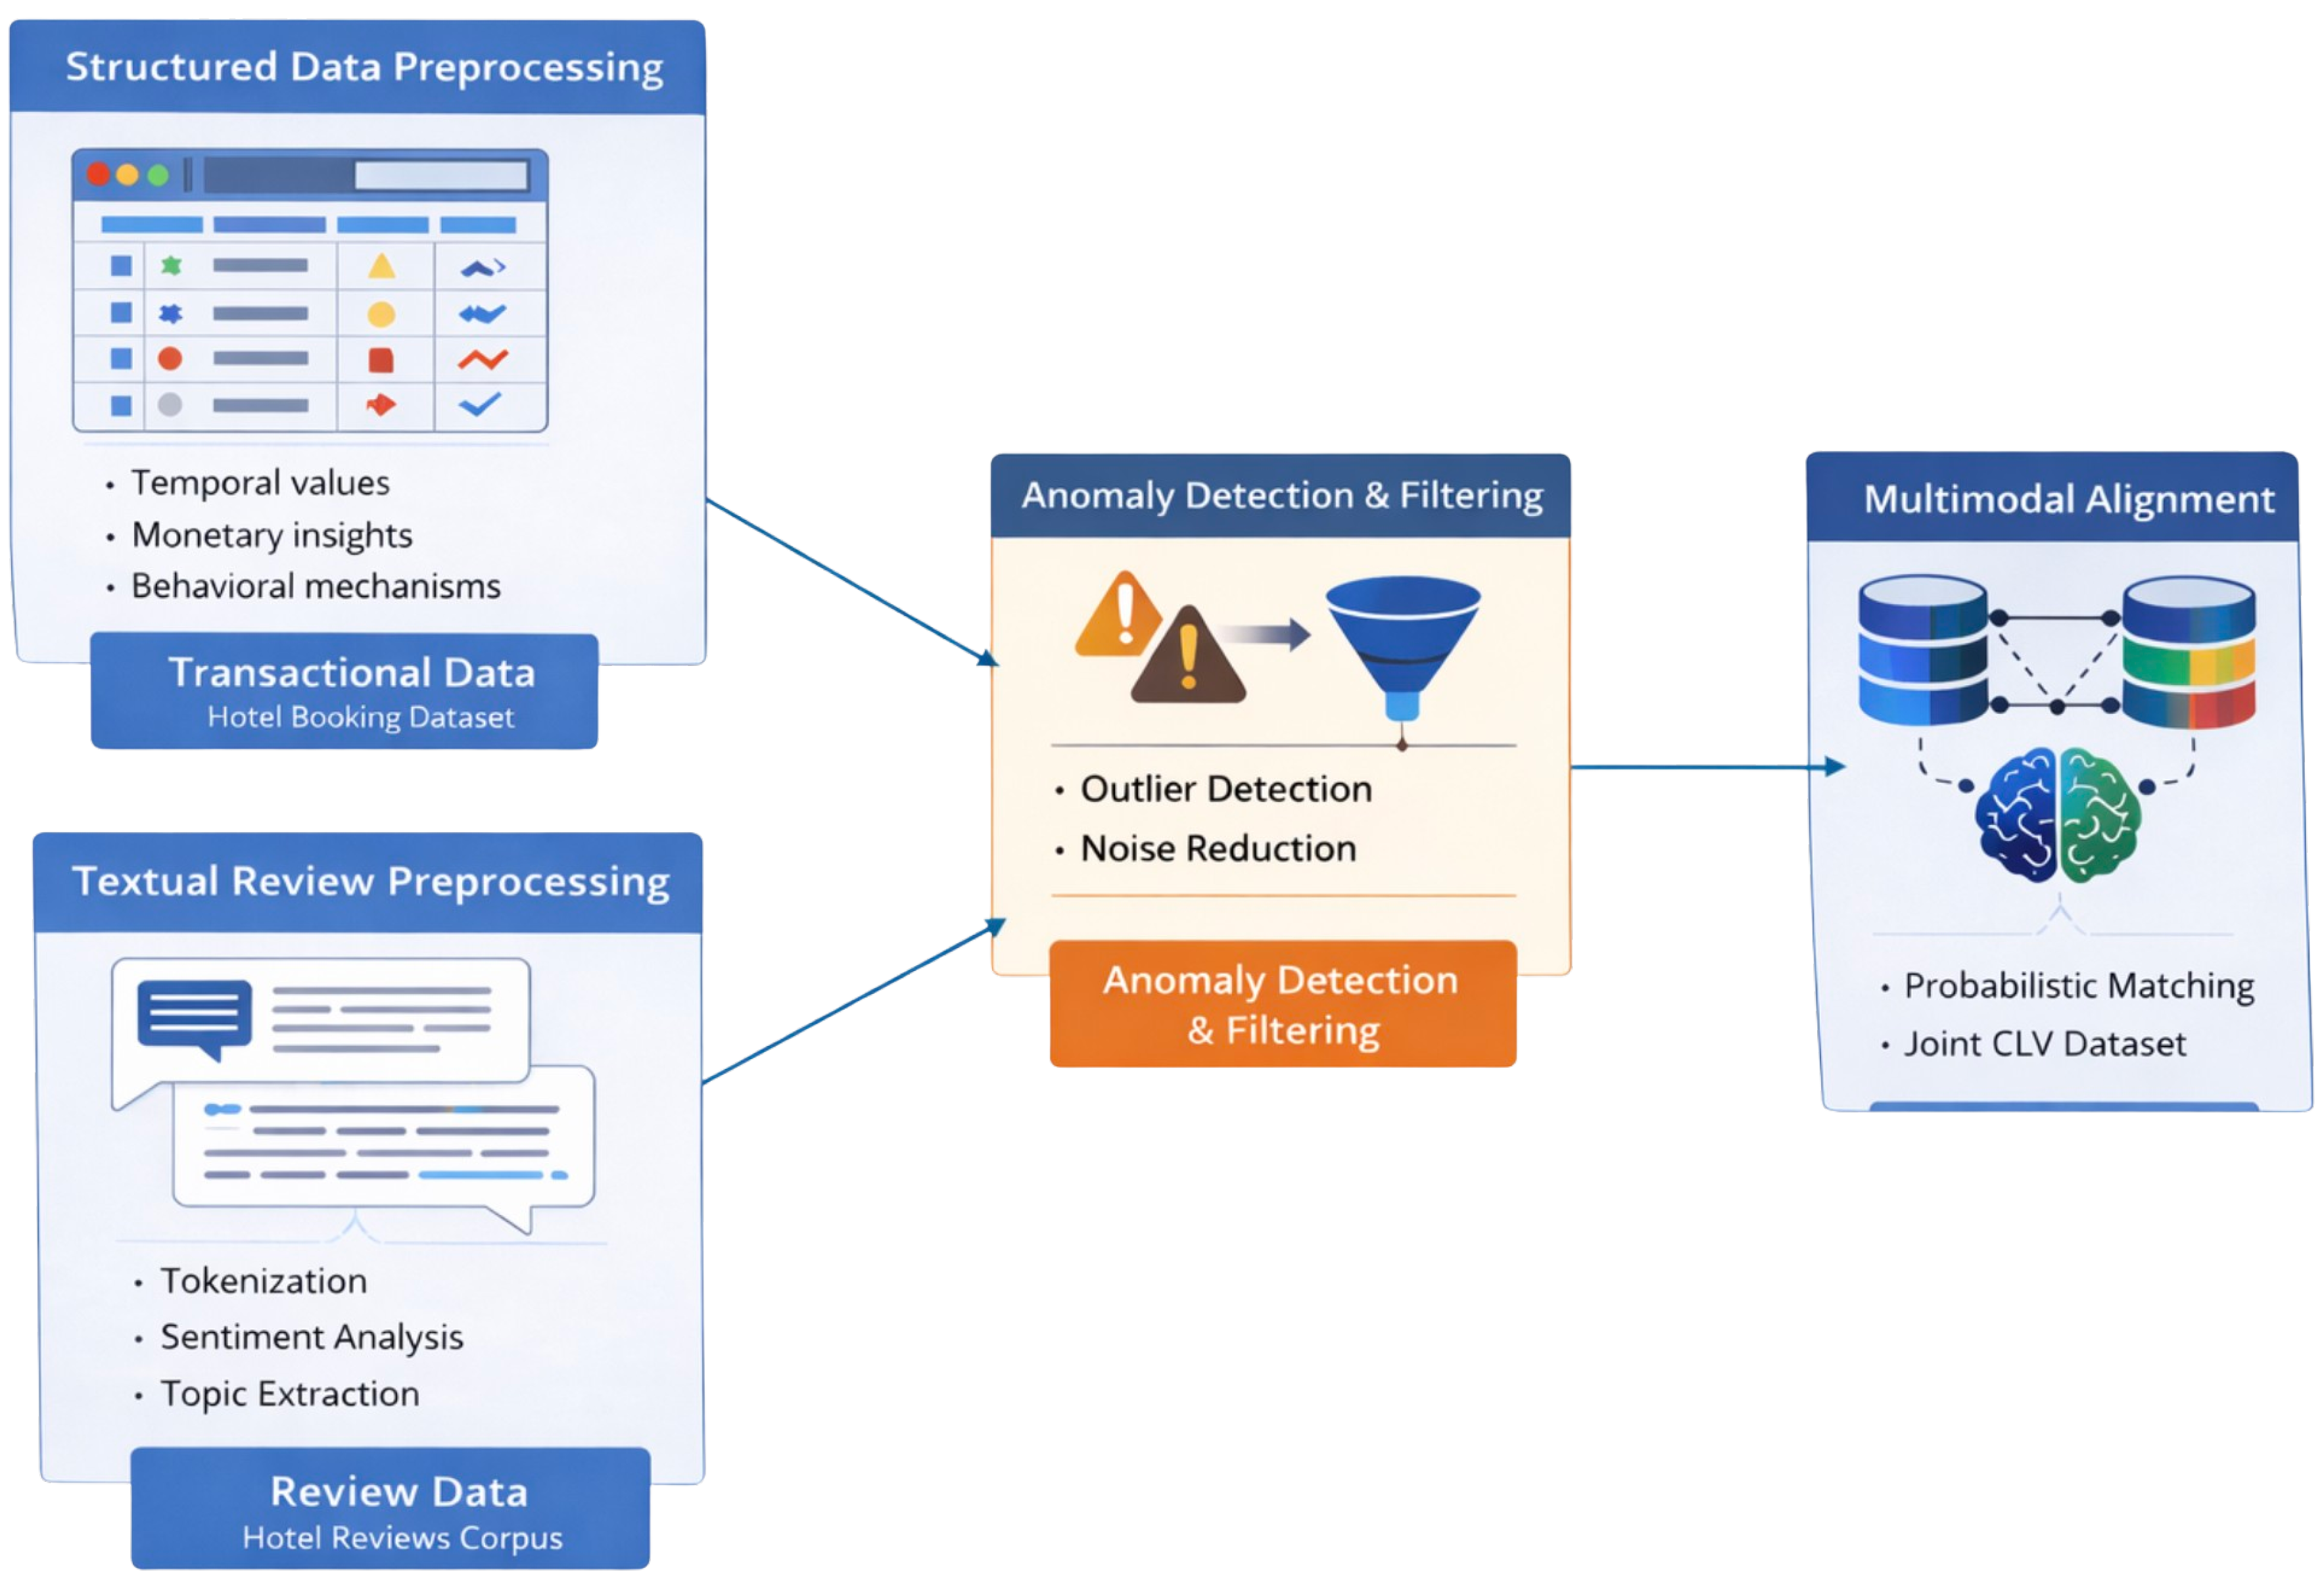
Figure 2.
EDA results showing correlation structure between key behavioral variables, including lead time, cancellation probability, repeated guest status, pricing volatility, and seasonal demand.
Figure 2.
EDA results showing correlation structure between key behavioral variables, including lead time, cancellation probability, repeated guest status, pricing volatility, and seasonal demand.
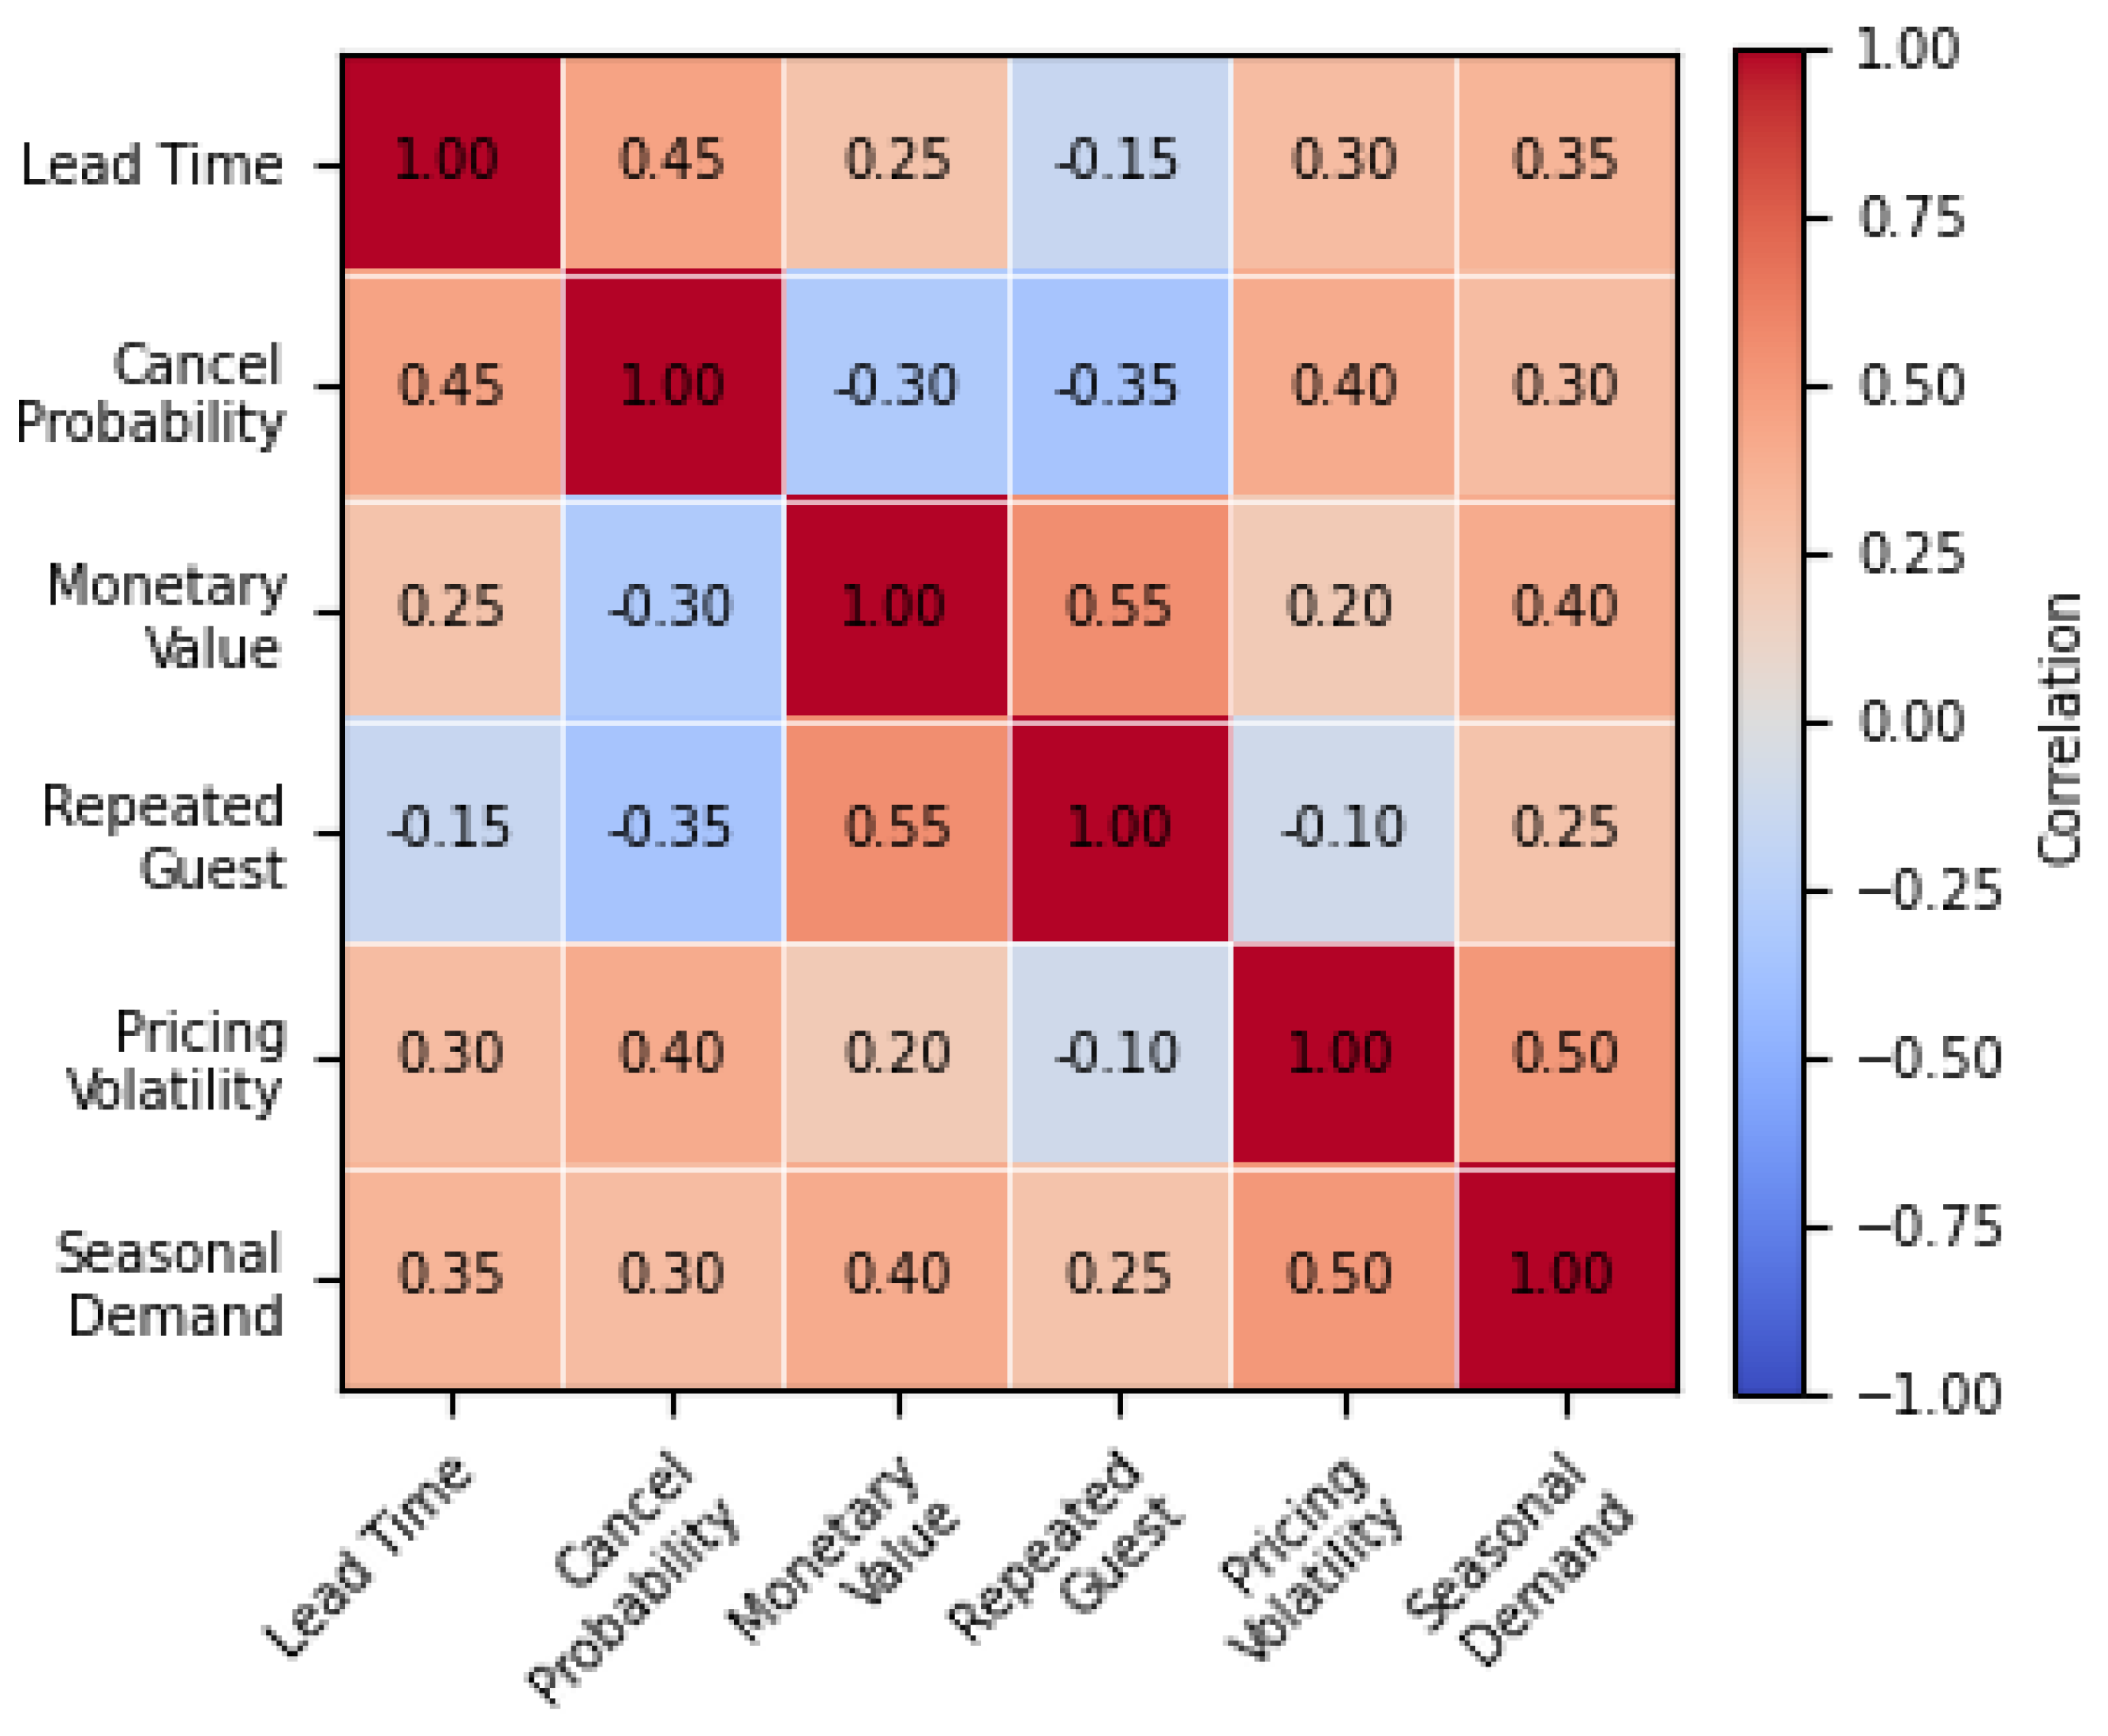
Figure 3.
Automated anomaly detection and review filtering pipeline. The framework integrates three independent detection modules: sentiment contradiction analysis, semantic duplication detection, and temporal irregularity analysis, whose outputs are linearly combined into a final anomaly score.
Figure 3.
Automated anomaly detection and review filtering pipeline. The framework integrates three independent detection modules: sentiment contradiction analysis, semantic duplication detection, and temporal irregularity analysis, whose outputs are linearly combined into a final anomaly score.
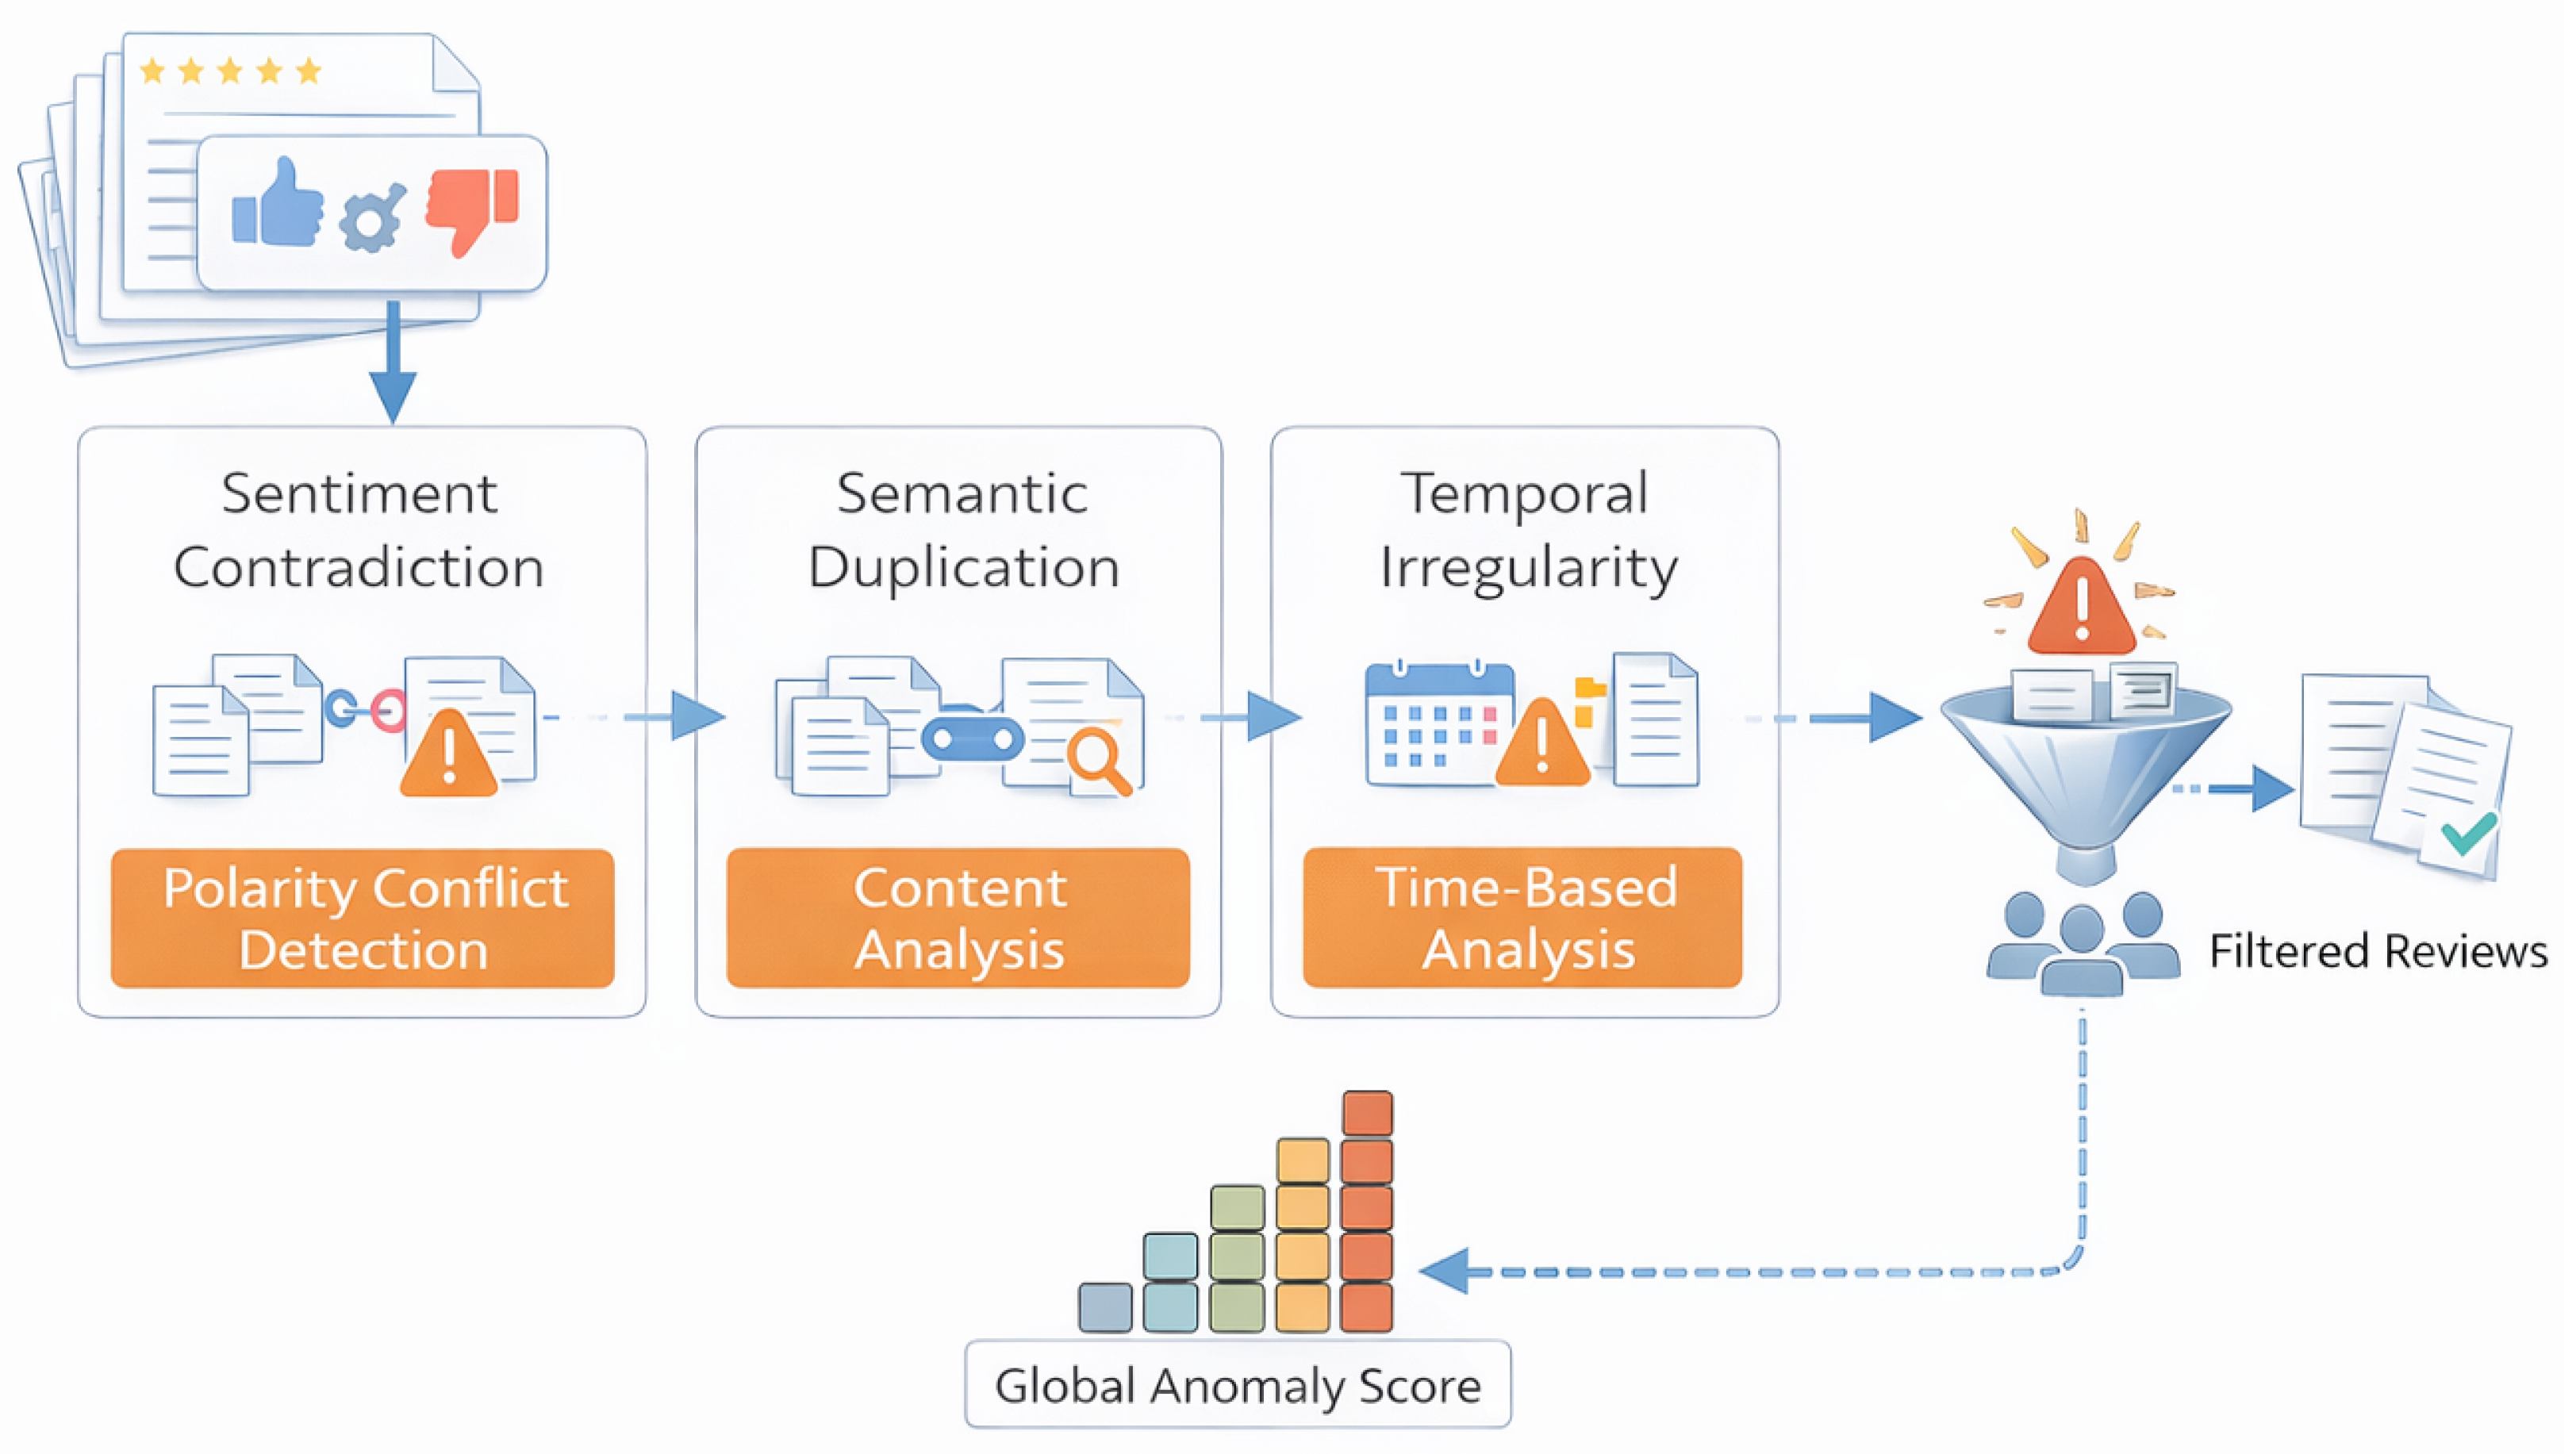
Figure 4.
Architecture of the proposed multimodal deep learning framework, consisting of a behavioral branch, a transformer-based textual branch, and an attention-based cross-modal fusion layer.
Figure 4.
Architecture of the proposed multimodal deep learning framework, consisting of a behavioral branch, a transformer-based textual branch, and an attention-based cross-modal fusion layer.
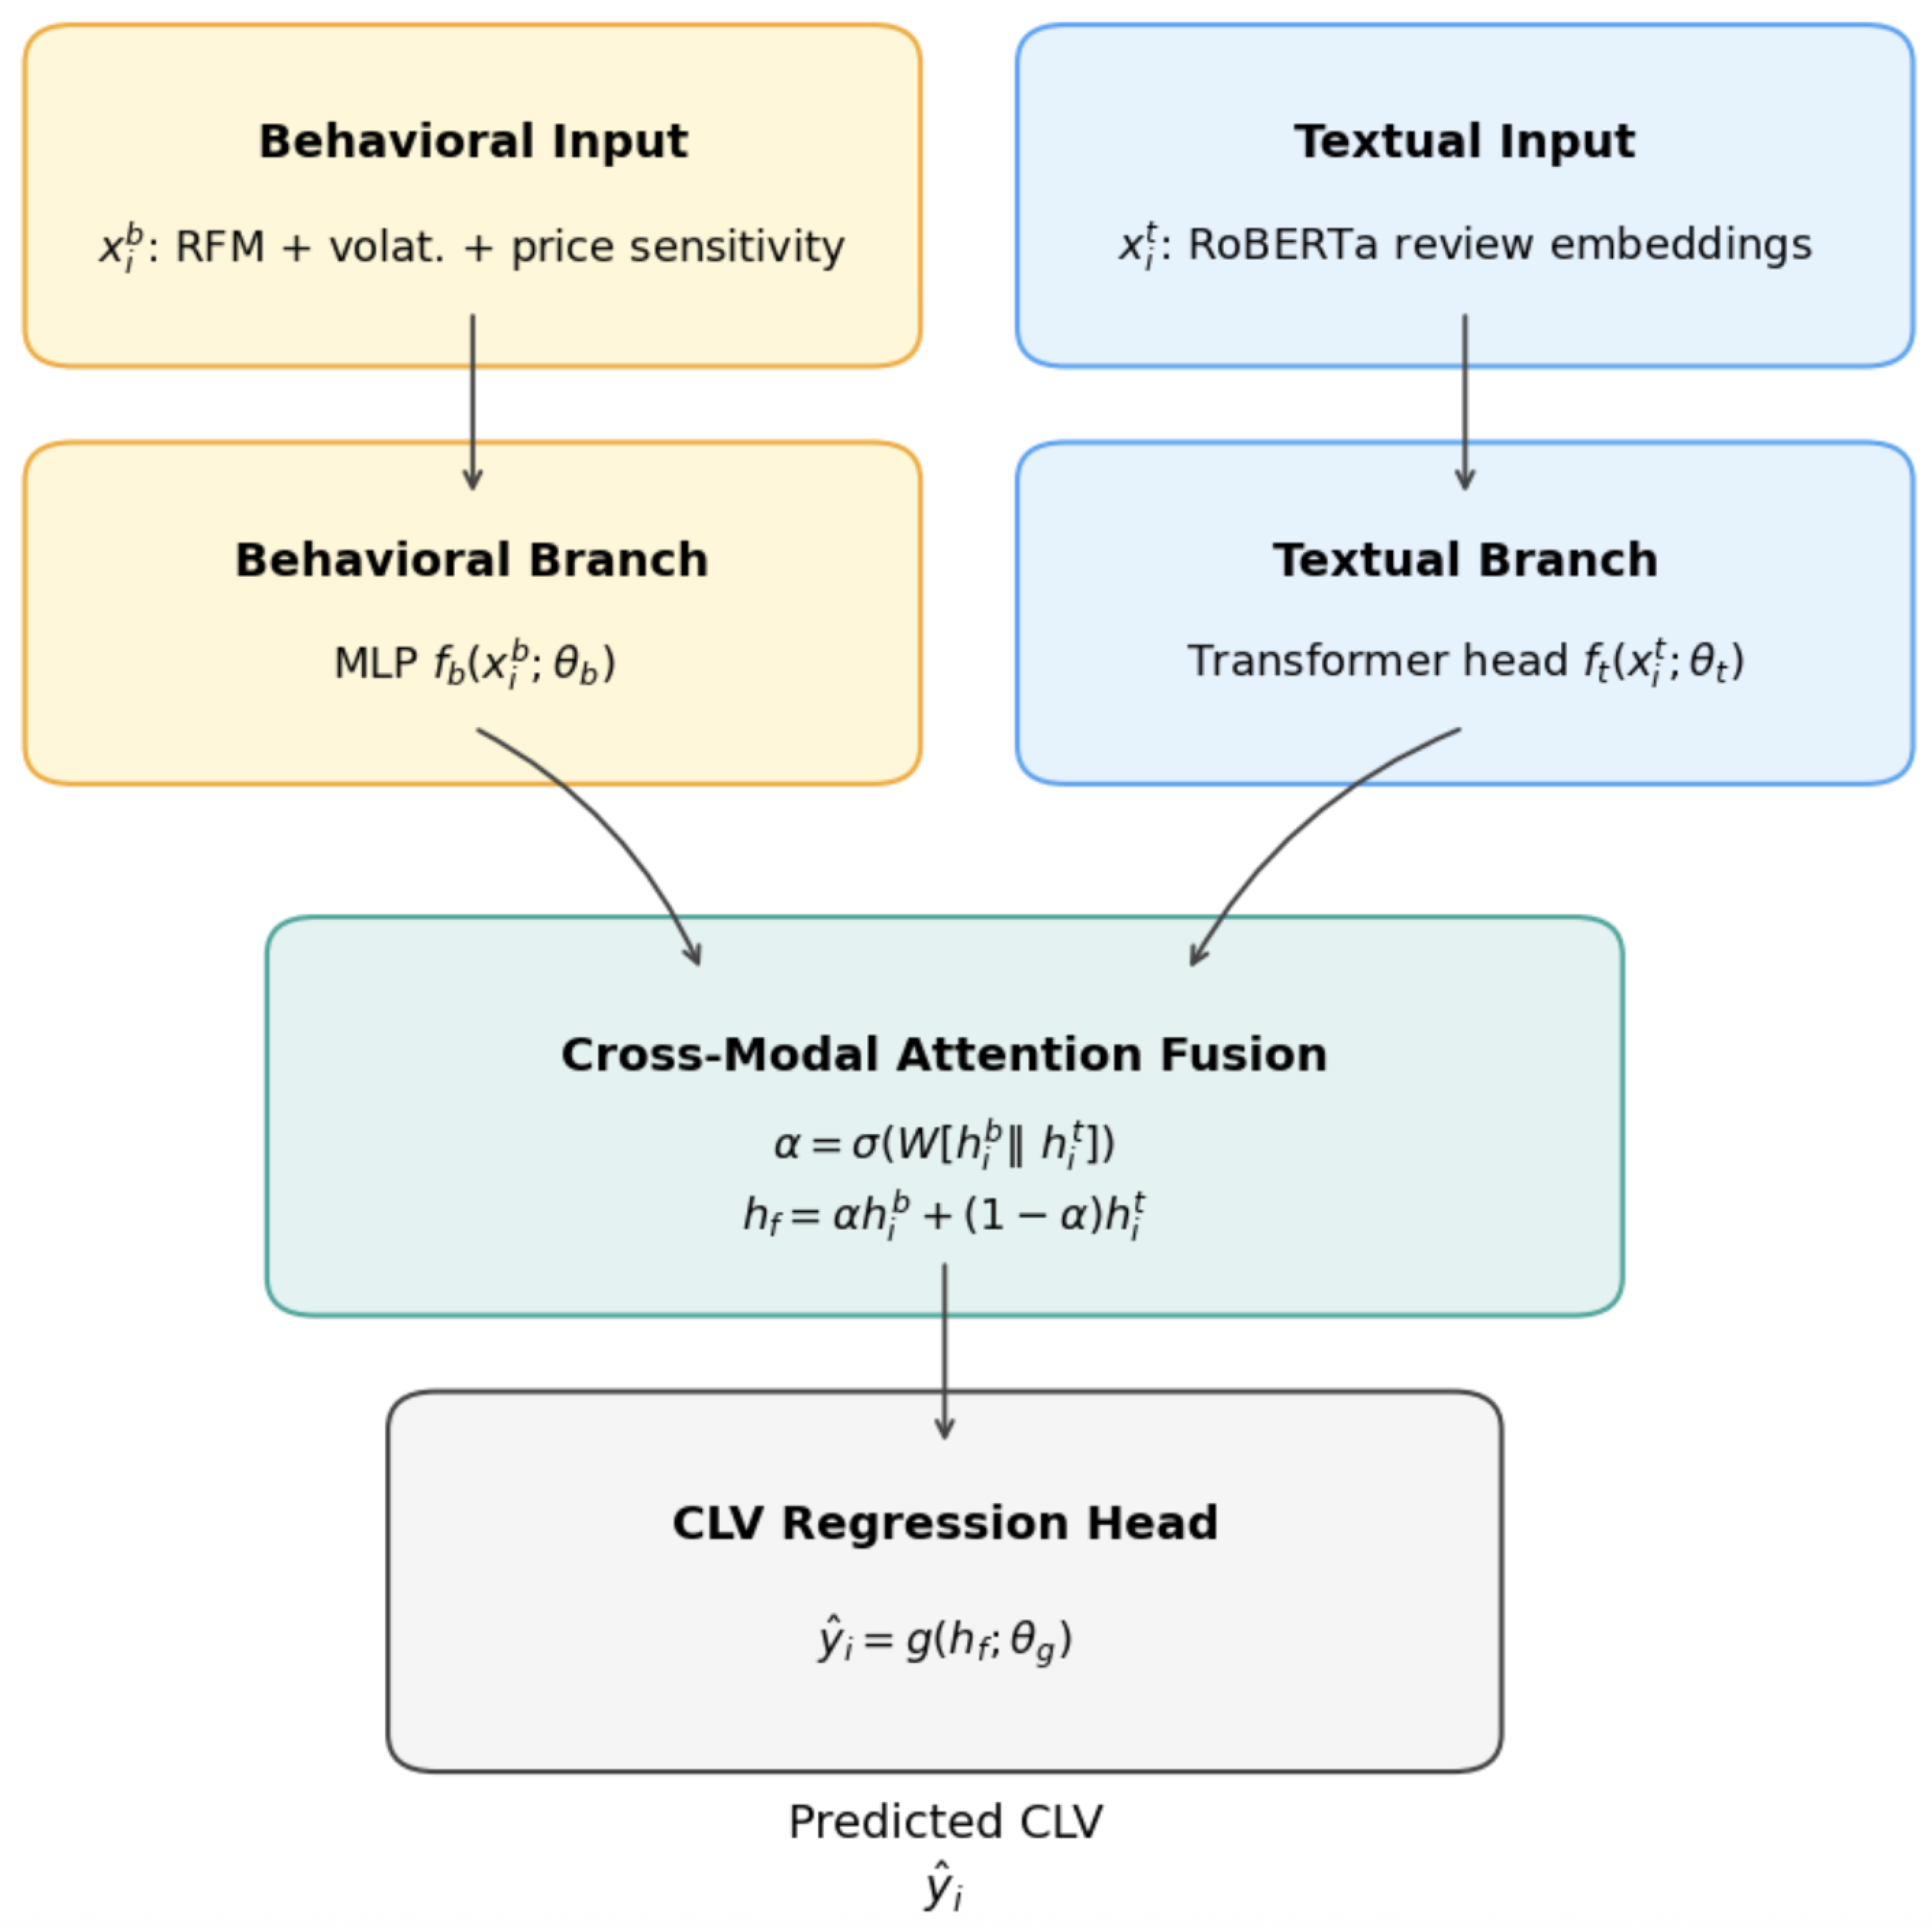
Figure 5.
Performance improvement of the optimized multimodal deep learning model compared to the strongest baseline (Behavioral MLP). The multimodal architecture achieves simultaneous reductions in MAE and RMSE and a notable increase in explained variance.
Figure 5.
Performance improvement of the optimized multimodal deep learning model compared to the strongest baseline (Behavioral MLP). The multimodal architecture achieves simultaneous reductions in MAE and RMSE and a notable increase in explained variance.
Figure 6.
Global SHAP beeswarm plot illustrating feature contributions to CLV prediction. Monetary value, booking frequency, cancellation pressure, and price sensitivity dominate global influence.
Figure 6.
Global SHAP beeswarm plot illustrating feature contributions to CLV prediction. Monetary value, booking frequency, cancellation pressure, and price sensitivity dominate global influence.
Figure 7.
Representative LIME explanations for individual predictions, highlighting words and phrases from guest reviews that most strongly influence local CLV estimates.
Figure 7.
Representative LIME explanations for individual predictions, highlighting words and phrases from guest reviews that most strongly influence local CLV estimates.
Figure 8.
Cross-modal attention distribution across customer value segments. Behavioral signals dominate high-CLV predictions, while emotional signals exert stronger influence in mid- and low-CLV segments.
Figure 8.
Cross-modal attention distribution across customer value segments. Behavioral signals dominate high-CLV predictions, while emotional signals exert stronger influence in mid- and low-CLV segments.
Figure 9.
Consolidated visual comparison of all CLV prediction models across MAE, RMSE, , and MAPE performance metrics. The optimized multimodal model consistently outperforms all baseline and unimodal approaches across all evaluation dimensions.
Figure 9.
Consolidated visual comparison of all CLV prediction models across MAE, RMSE, , and MAPE performance metrics. The optimized multimodal model consistently outperforms all baseline and unimodal approaches across all evaluation dimensions.
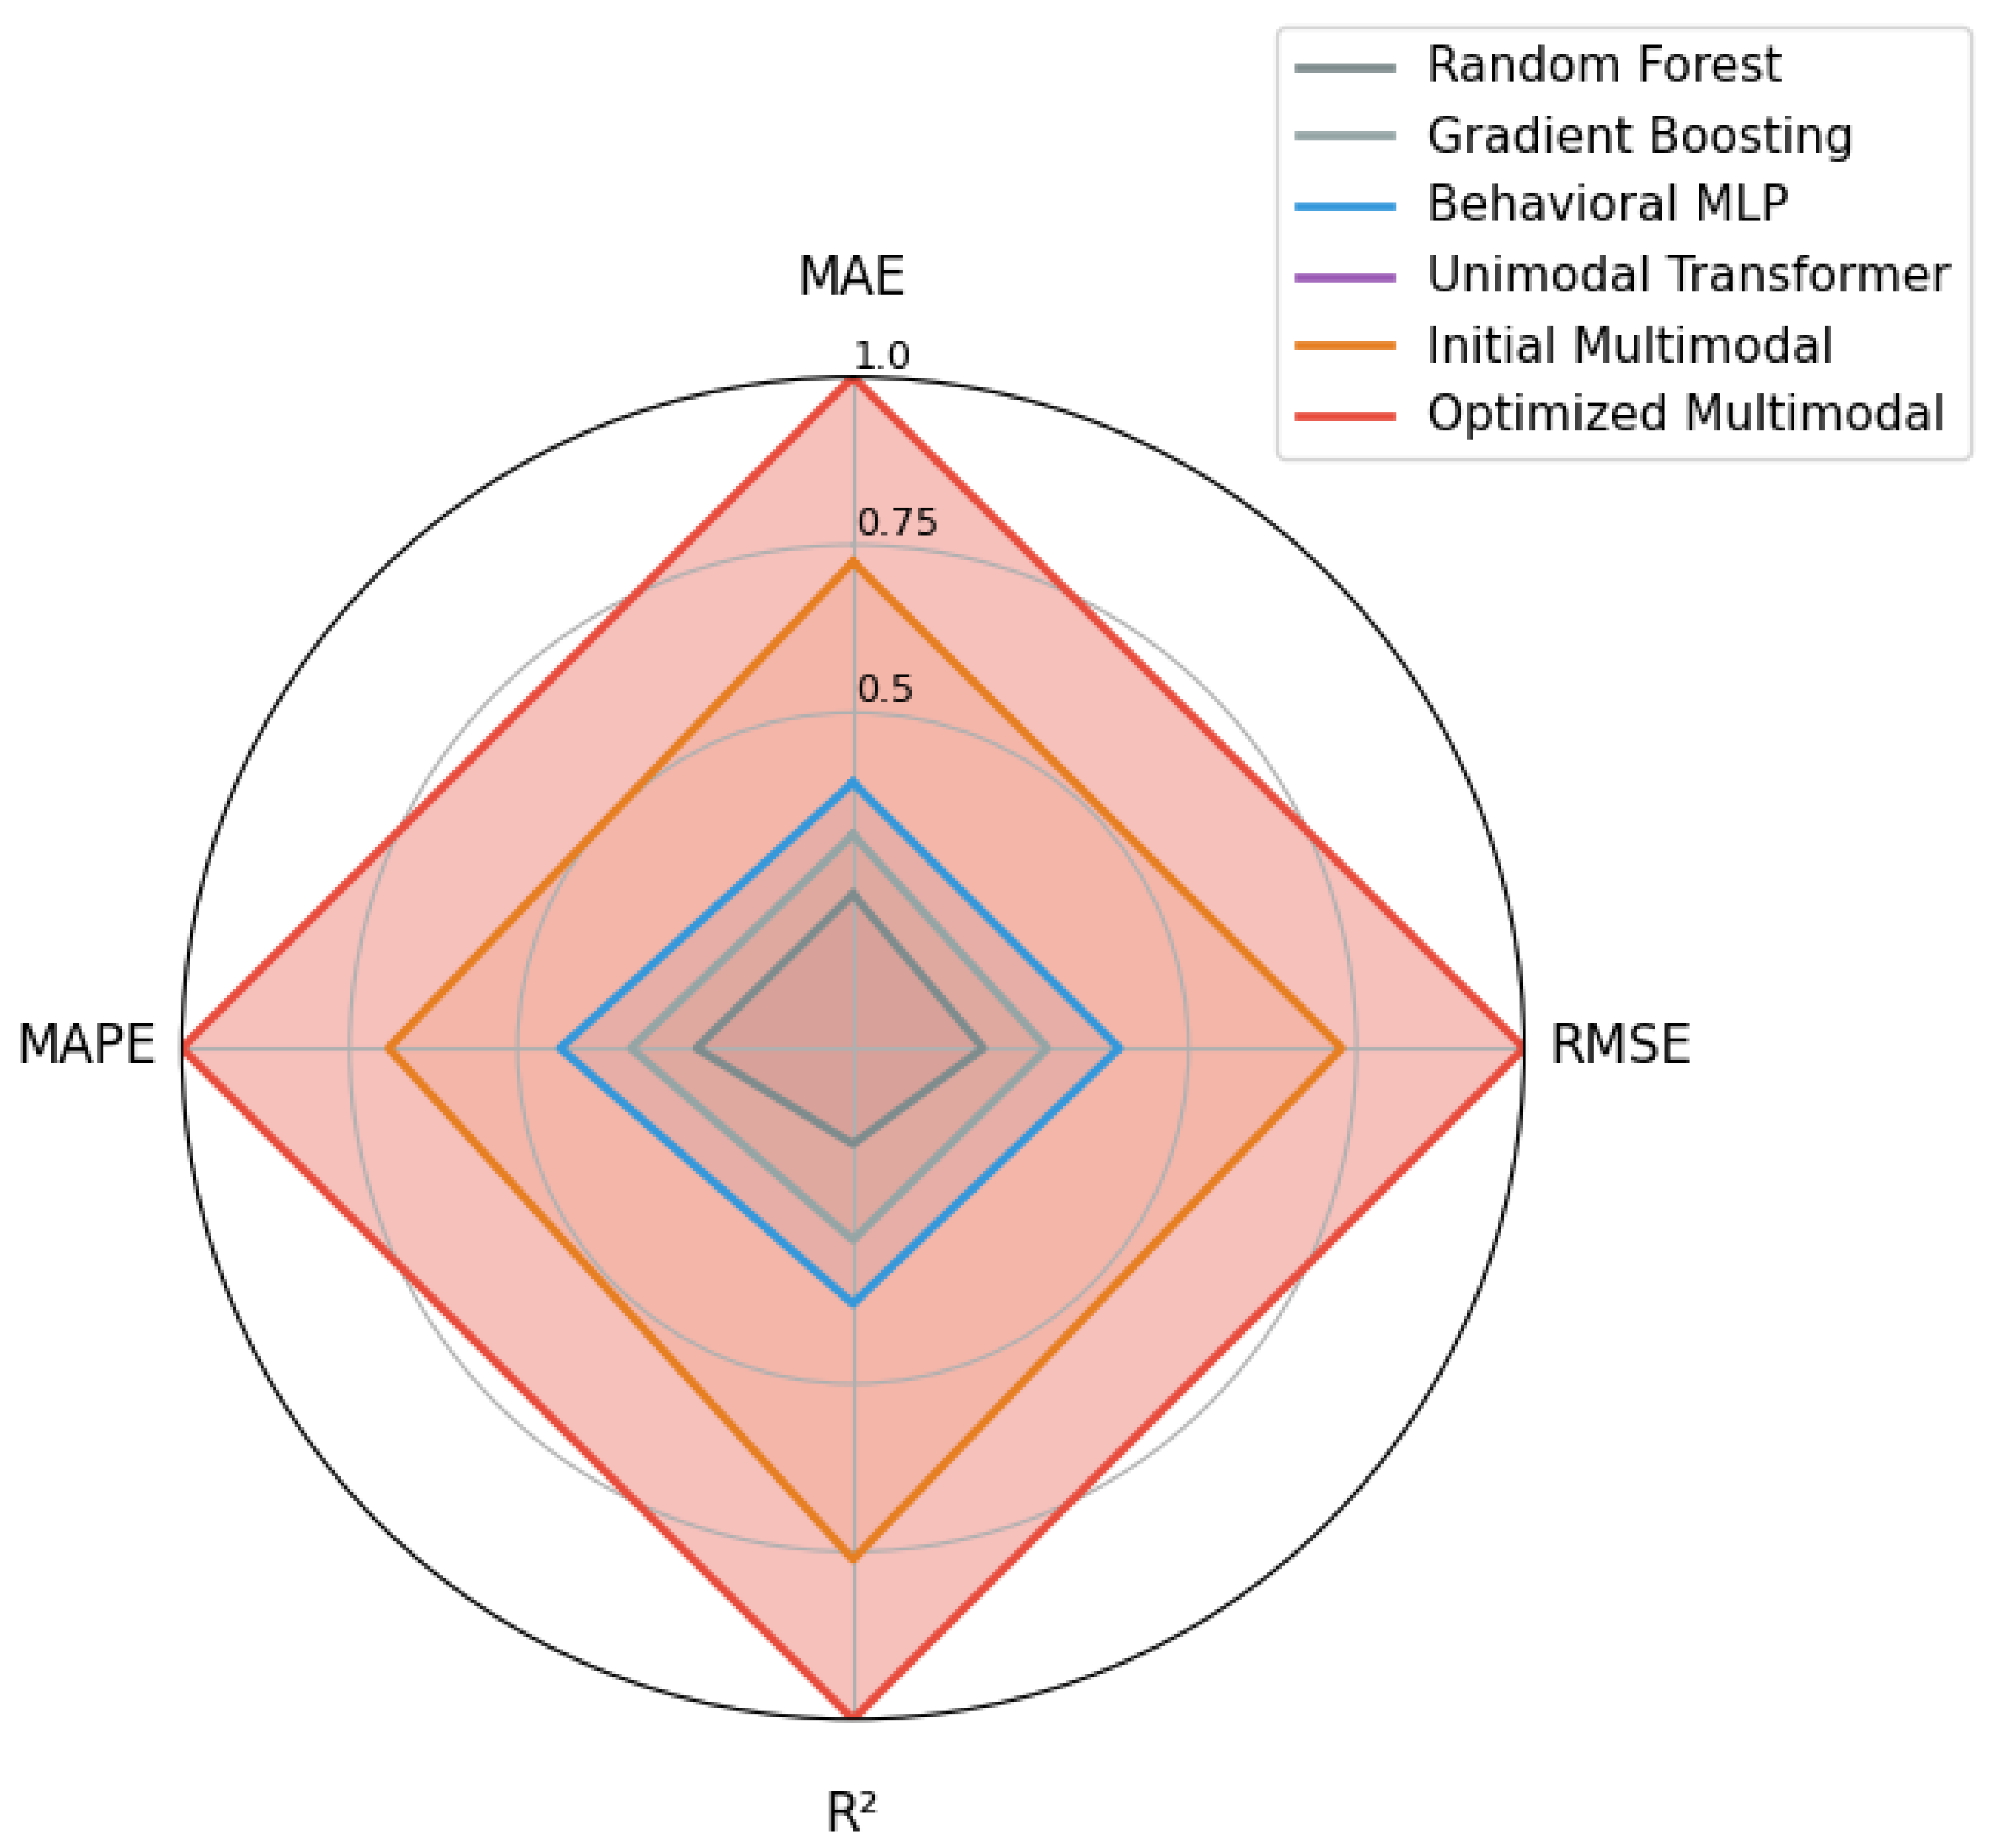

Table 1.
Dataset composition before and after preprocessing and anomaly filtering.
| Stage | Structured Records | Reviews | Multimodal Pairs |
|---|---|---|---|
| Raw datasets | 119,390 | 515,738 | – |
| After duplicate removal | 117,812 | 498,204 | – |
| After missing value handling | 115,064 | 482,991 | – |
| After language filtering | – | 446,213 | – |
| After anomaly detection filtering | – | 402,587 | – |
| Final aligned multimodal dataset | 108,937 | 402,587 | 96,214 |
Table 2.
Impact of automated anomaly detection on hotel review data.
| Stage | Number of Reviews | Retention Rate (%) |
|---|---|---|
| Initial review corpus | 446,213 | 100.0 |
| After sentiment contradiction filtering | 421,590 | 94.5 |
| After duplication filtering | 409,873 | 91.9 |
| After temporal anomaly filtering | 402,587 | 90.2 |
Table 3.
Baseline model performance for CLV prediction.
| Model | MAE | RMSE | MAPE (%) | |
|---|---|---|---|---|
| Random Forest Regression | 182.4 | 295.7 | 0.71 | 24.8 |
| Gradient Boosting Machines | 175.1 | 284.3 | 0.74 | 23.5 |
| Behavioral MLP (Structured Only) | 168.7 | 271.5 | 0.76 | 22.1 |
| Unimodal Transformer (Text Only) | 201.3 | 318.9 | 0.68 | 27.9 |
Table 4.
Initial performance of the multimodal deep learning model.
| Model | MAE | RMSE | MAPE (%) | |
|---|---|---|---|---|
| Initial Multimodal Model | 141.6 | 231.9 | 0.84 | 18.7 |
Table 5.
Performance of the optimized multimodal model.
| Model | MAE | RMSE | MAPE (%) | |
|---|---|---|---|---|
| Optimized Multimodal Model | 118.9 | 199.4 | 0.89 | 14.6 |
Table 6.
Optimized hyperparameter configuration of the multimodal CLV prediction model.
| Hyperparameter | Final Value |
|---|---|
| Learning rate | 0.0003 |
| Behavioral hidden layers | [128, 64] |
| Textual embedding size | 768 |
| Attention projection size | 128 |
| Batch size | 64 |
| Dropout probability | 0.35 |
| Weight decay () | |
| Optimizer | Adam |
Table 7.
Segment-wise CLV prediction performance of the optimized multimodal model.
| Customer Segment | MAE | RMSE | MAPE (%) | |
|---|---|---|---|---|
| Low-CLV Customers | 82.4 | 134.1 | 0.84 | 16.2 |
| Mid-CLV Customers | 115.7 | 187.9 | 0.88 | 14.9 |
| High-CLV Customers | 161.3 | 248.5 | 0.91 | 12.7 |
Table 8.
Ablation study: contribution of each model component.
| Model Variant | MAE | RMSE | MAPE (%) | |
|---|---|---|---|---|
| Behavioral Only (No Text) | 168.7 | 271.5 | 0.76 | 22.1 |
| Text Only (No Behavior) | 201.3 | 318.9 | 0.68 | 27.9 |
| Multimodal (No Attention) | 137.2 | 225.4 | 0.86 | 17.9 |
| Full Multimodal Model | 118.9 | 199.4 | 0.89 | 14.6 |
Table 9.
Summary of CLV prediction performance across all models.
| Model | MAE | RMSE | MAPE (%) | |
|---|---|---|---|---|
| Random Forest Regression | 182.4 | 295.7 | 0.71 | 24.8 |
| Gradient Boosting | 175.1 | 284.3 | 0.74 | 23.5 |
| Behavioral MLP | 168.7 | 271.5 | 0.76 | 22.1 |
| Unimodal Transformer | 201.3 | 318.9 | 0.68 | 27.9 |
| Initial Multimodal Model | 141.6 | 231.9 | 0.84 | 18.7 |
| Optimized Multimodal Model | 118.9 | 199.4 | 0.89 | 14.6 |
Disclaimer/Publisher’s Note: The statements, opinions and data contained in all publications are solely those of the individual author(s) and contributor(s) and not of MDPI and/or the editor(s). MDPI and/or the editor(s) disclaim responsibility for any injury to people or property resulting from any ideas, methods, instructions or products referred to in the content. |
© 2026 by the authors. Licensee MDPI, Basel, Switzerland. This article is an open access article distributed under the terms and conditions of the Creative Commons Attribution (CC BY) license (http://creativecommons.org/licenses/by/4.0/).
Copyright: This open access article is published under a Creative Commons CC BY 4.0 license, which permit the free download, distribution, and reuse, provided that the author and preprint are cited in any reuse.


