
Submitted:
05 January 2026
Posted:
05 January 2026
You are already at the latest version
Abstract
This study examines how banks navigate the dual strategic imperatives of securing market power and optimizing multidimensional operational efficiency—technical, scale, and allocative efficiency—within emerging and transitional banking systems. Focusing on business model diversification and financial stability, the study also accounts for the conditioning roles of governance quality, institutional complexity, credit risk, and digitalization. Using bank-level data from ASEAN and MENA countries, the analysis applies Partial Least Squares Structural Equation Modeling (PLS-SEM) and multi-group analysis to assess direct, mediating, and moderating relationships. The results indicate that diversification and financial stability significantly strengthen market power, while their effects on efficiency are largely negative across efficiency dimensions. Governance quality partially mediates the stability–market power relationship, whereas institutional complexity weakens this linkage. Digital transformation maturity and market digitalization condition the diversification–efficiency nexus, with effects varying across efficiency types and regions. Overall, the findings reveal a strategic trade-off between competitive positioning and operational efficiency, emphasizing the importance of governance structures and digital capabilities in shaping bank performance across heterogeneous institutional contexts.
Keywords:
bank market power
; multidimensional efficiency
; business model diversification
; financial stability
; digitalization
; governance quality
; ASEAN
; MENA
1. Introduction
In the aftermath of the 2008 Global Financial Crisis (GFC), the banking sector has been compelled to operate within a prolonged low-interest-rate environment, largely driven by accommodative monetary policy regimes (Claessens et al., 2018; Lopez et al., 2020). This macroeconomic condition has significantly compressed net interest margins (NIMs), eroding the traditional profitability of lending-based activities (Gehrig, 2015). As a result, banks have faced increasing pressure to reconfigure their business models by reducing their reliance on interest income and expanding into non-interest income (NNIN) sources in order to remain competitive in a more challenging financial landscape (Alzoubi, 2025; Nisar et al., 2018). At the same time, post-crisis regulatory reforms have imposed stricter requirements on financial stability and risk containment to mitigate the likelihood of future systemic failures (Aderogba et al., 2025; Karkowska & Acedański, 2020). Consequently, modern banks are subject to a form of “dual pressure”: the commercial necessity to diversify for profitability and the regulatory imperative to maintain robust stability buffers.
Despite its strategic appeal, the transition toward more diversified business models presents a persistent theoretical and empirical paradox. Classical economic theory posits that diversification enhances efficiency through economies of scope; however, a substantial body of empirical evidence documents a “diversification discount,” particularly in the banking sector (Guerry & Wallmeier, 2017; Kim et al., 2022). Early studies by K. J. Stiroh (2004) and K. Stiroh and Rumble (2006) demonstrate that greater engagement in non-interest activities often exposes banks to higher income volatility without corresponding performance gains. Evidence from emerging markets further reinforces this ambiguity. For example, studies focusing on ASEAN banking systems suggest that revenue diversification does not necessarily improve bank stability (Lestari et al., 2023). In parallel, the relationship between financial stability and market power remains a contested issue. While market power is widely recognized as a crucial determinant of competitive strength (Fukuyama & Tan, 2022), the “quiet life” hypothesis posits that excessive stability or dominance may erode managerial incentives to enhance efficiency, thereby limiting productivity improvements (Ikeda et al., 2018; Le et al., 2024).
These challenges are further amplified by increasing institutional complexity within banking organizations. As banks expand their product portfolios and geographic reach, they often develop intricate organizational structures involving multiple subsidiaries and cross-border operations (Buch & Goldberg, 2022). Such complexity generates governance challenges, obscures risk exposure, and increases monitoring and coordination costs (Krause et al., 2017; Pham & Doan, 2023). High operational costs associated with inefficient processes, legacy systems, and regulatory compliance, commonly referred to as institutional complexity, may reduce organizational agility and weaken banks' ability to translate strategic initiatives into improvements in market power and efficiency (Olarewaju, 2018; Palermo et al., 2017).
In response to these inefficiencies, banks are increasingly turning toward digital transformation. The Fourth Industrial Revolution and the rapid expansion of the digital economy have positioned information and communication technology (ICT) as a critical driver of banking performance (Mavlutova et al., 2023; Vuong et al., 2025). Digitalization offers a potential mechanism for resolving the diversification–efficiency paradox by reducing operational costs, enhancing service delivery through online and mobile platforms, and facilitating more effective data-driven decision-making (Beccalli, 2007; Manta et al., 2024). Nevertheless, the performance implications of digital transformation remain heterogeneous. While digitalization can enhance efficiency and competitive differentiation (Y. Li et al., 2025; Shanti et al., 2024), legacy infrastructure and organizational rigidities continue to pose significant barriers to implementation (Bueno et al., 2024). Moreover, the effectiveness of internal digital strategies may depend critically on the broader digital maturity of the external market environment—a dimension that remains underexplored in comparative banking studies.
Against this background, the present study investigates how business model diversification and financial stability interact with institutional complexity and digitalization to shape banks’ market power and multidimensional operational efficiency across two distinct regions: the Association of Southeast Asian Nations (ASEAN) and the Middle East and North Africa (MENA). These regions provide a compelling comparative context. ASEAN banking systems operate within rapidly digitalizing markets characterized by expanding digital infrastructure and high fintech adoption, which significantly reshape competitive dynamics (Khan et al., 2021). In contrast, the MENA banking sector functions in environments shaped by commodity price volatility, geopolitical risks, and relatively concentrated market structures, where regulatory priorities often emphasize stability over aggressive competition (Aliyu et al., 2023; Alzoubi, 2025; Mateev et al., 2023).
The primary objective of this study is to examine how banks navigate the dual strategic imperatives of securing market power and optimizing multidimensional operational efficiency, measured by technical, scale, and allocative efficiency, within emerging and transitional banking systems. Specifically, the study examines how business model diversification and financial stability influence these two distinct performance outcomes, while considering the conditioning roles of governance quality, institutional complexity, credit risk, and digitalization.
This study contributes to the existing literature in banking and financial economics in three important ways. First, it explicitly incorporates institutional complexity as a moderating structural constraint that may weaken the effectiveness of financial stability in translating into market power, thereby extending the stability–competition debate beyond traditional risk–return perspectives. Second, the study disentangles the dual role of digitalization by examining Digital Transformation Maturity (DTM) as an internal mediating mechanism through which business model diversification affects bank efficiency, and Market Digitalization Level (MDL) as an external moderating condition shaping the diversification–efficiency nexus. Third, by employing a multi-group analysis (MGA) across ASEAN and MENA banking systems, the study reveals systematic cross-regional differences in how banks balance diversification, stability, and digital transformation, offering nuanced insights for policymakers and practitioners in emerging and transitional economies.
2. Literature Review, Theoretical Framework, and Hypothesis
2.1. Business Model Diversification, Financial Stability, and Bank Market Power
Bank market power is a central concept in banking research, particularly under conditions of increasing competition and structural change. It reflects a bank’s ability to price above marginal cost and is commonly measured using the Lerner Index (Gischer et al., 2015; Srivastava et al., 2022). Beyond competitive positioning, market power captures a bank’s capacity to preserve franchise value and sustain long-term profitability.
Business model diversification represents a strategic channel through which banks can strengthen their market power. Diversification refers to banks’ engagement across multiple products and services, allowing them to broaden revenue sources beyond traditional lending (Z. Li & Kim, 2024). From a business model perspective, diversification reflects how banks create and capture value in competitive markets (Ritter & Pedersen, 2020).
In practice, diversification in banking is often operationalized through the expansion of non-interest income, including fees, commissions, and trading activities (J. Nguyen, 2012). This strategic shift is widely viewed as a response to declining net interest margins and intensified competition in loan markets (Lee et al., 2014; Nisar et al., 2018). By expanding into non-traditional activities, banks can reduce their dependence on interest income and capitalize on segments with lower competitive pressure (Das & Pati, 2025).
Empirical evidence supports a positive association between diversification and bank market power. Cross-country studies indicate that banks with higher shares of non-interest income tend to exhibit stronger pricing power and more resilient business models (Das & Pati, 2025; Setianto et al., 2025). Similar findings are reported in emerging markets, including South Asia, Vietnam, and the MENA region, where diversification enhances profitability and competitive positioning (Abu Khalaf et al., 2024; Nisar et al., 2018; Oanh et al., 2024).
However, the benefits of diversification are not uniform across banks. Prior studies document that its effectiveness depends on bank size, capitalization, and institutional conditions, with evidence of non-linear effects in some settings (Lin et al., 2021; Tabak et al., 2011). Moreover, the relationship between diversification and market power may be bidirectional. While diversification can strengthen market power, banks with greater market power may also be better positioned to pursue diversification strategies (M. Nguyen et al., 2016).
Financial stability constitutes another key determinant of bank market power. Stability is commonly measured using the Z-score, which captures the distance to insolvency by combining profitability, capitalization, and earnings volatility (Karadima & Louri, 2020). Higher stability enhances franchise value and allows banks to sustain pricing power over time (Herwald et al., 2024; Repullo, 2004).
Empirical studies consistently report a positive link between stability and market power. Stable and well-capitalized banks are better able to maintain higher margins and withstand competitive pressure, particularly in emerging and developing economies (Kasman & Carvallo, 2014; Soedarmono et al., 2011; Wu et al., 2019). Evidence from the ASEAN and Asia-Pacific regions further suggests that financial stability strengthens banks’ bargaining position and long-term strategic capacity (Minh et al., 2020; Qori’ah et al., 2025).
Overall, the literature suggests that business model diversification and financial stability play complementary roles in shaping a bank's market power. Diversification expands revenue opportunities, while stability protects franchise value and pricing capacity. Nevertheless, these relationships remain context-dependent and are shaped by institutional and competitive conditions, particularly in emerging banking systems.
2.2. Diversification, Stability, and Multidimensional Bank Efficiency
Bank efficiency is fundamentally a measure of managerial quality, reflecting how effectively banks transform inputs into outputs, operate at optimal scale, and allocate resources given prevailing prices. Within this framework, business model diversification—particularly through the expansion of non-interest income activities- has been widely discussed as a strategic mechanism to enhance efficiency by exploiting economies of scope and improving resource utilization (Landi & Venturelli, 2005; Lown et al., 2000).
A substantial body of empirical evidence supports the view that income diversification can enhance bank efficiency. Diversified banks benefit from imperfect correlations between interest-based and non-interest-based activities, which allow them to smooth income streams, generate informational advantages, and improve the risk–return trade-off (Doan et al., 2018). Cross-country evidence suggests that diversification is positively associated with cost and profit efficiency, particularly in developing and emerging banking systems, where the benefits of diversification tend to be more pronounced (Chronopoulos et al., 2011). Similar findings are reported for banks in Asia and Africa, where higher reliance on non-interest income improves technical efficiency and facilitates better utilization of inputs (Alhassan & Tetteh, 2017; A. Berger et al., 2010).
However, the diversification–efficiency relationship is neither uniform nor linear. Several studies document diminishing or even adverse efficiency effects when diversification exceeds optimal levels or when banks expand into unfamiliar and highly competitive sectors. Excessive diversification may intensify agency problems, increase monitoring costs, and dilute managerial focus, thereby eroding technical and allocative efficiency (DeYoung & Roland, 2001; T. L. A. Nguyen, 2018). Empirical evidence from Vietnam, Luxembourg, and Ghana further suggests that certain forms of diversification, particularly funding diversification, are consistently associated with lower technical efficiency, challenging the conventional wisdom that diversification is universally beneficial (Alhassan, 2015; Curi et al., 2015).
These mixed findings underscore the importance of efficiency heterogeneity across dimensions. While diversification may improve scale efficiency by enabling banks to spread fixed costs over a broader range of activities, its effects on technical and allocative efficiency depend on managerial capability, bank size, and institutional context (Ayadi et al., 2023; Vidyarthi, 2019). In this sense, diversification enhances efficiency primarily when it aligns with banks’ core competencies and operates within an optimal range.
Beyond business model choices, financial stability plays a critical role in shaping efficiency outcomes. Stable banks, typically characterized by higher Z-scores and stronger capital positions, are better positioned to allocate resources efficiently, absorb shocks, and avoid costly loan impairments (Barra & Zotti, 2019; Maghyereh & Awartani, 2014). Empirical evidence consistently shows that banks with lower default risk tend to exhibit higher cost and technical efficiency, as reduced risk-taking lowers monitoring costs and improves managerial focus (Akins et al., 2016; Fiordelisi et al., 2011).
Nevertheless, the stability–efficiency nexus is also nuanced. While financial stability generally supports efficiency by creating a predictable operating environment, excessively high capitalization or liquidity buffers may reduce cost efficiency by limiting leverage and scale advantages (Miah & Uddin, 2017; Sakouvogui & Shaik, 2020). Moreover, some studies argue that efficiency improvements can precede stability rather than result from it, suggesting potential bidirectional causality between the two constructs (Hafez, 2022; D. T. Nguyen et al., 2024). These findings highlight that stability does not automatically translate into efficiency unless supported by sound managerial practices and competitive discipline.
Overall, the literature suggests that both business model diversification and financial stability are central, yet conditional, determinants of multidimensional bank efficiency. Diversification can enhance efficiency by exploiting economies of scope and improving resource utilization, while financial stability provides the foundation for efficient operations by reducing risk-related distortions. However, the magnitude and direction of these effects depend on the form of diversification, bank characteristics, and institutional environment. Accordingly, this study explicitly examines bank efficiency as a multidimensional construct, encompassing technical, scale, and allocative efficiency, thereby underscoring the need for an integrated empirical assessment across multiple efficiency dimensions.
2.3. Governance as a Strategic Transmission Mechanism
Corporate governance plays a pivotal role in linking bank-level resources to strategic and market outcomes. In the banking sector, governance extends beyond the traditional principal–agent relationship between shareholders and managers. Given banks’ unique contractual structure and systemic importance, governance frameworks must also account for depositors, creditors, and supervisory authorities (Mayes et al., 2001; Muranda, 2006). Consequently, governance functions as an institutional mechanism through which financial stability is monitored, disciplined, and strategically deployed.
A growing body of literature emphasizes that financial stability alone is insufficient to ensure sound performance or competitive strength. Instead, stability provides the foundational conditions under which governance mechanisms can operate effectively. Stable banks possess greater slack resources, enabling them to invest in costly governance infrastructures, such as internal audits, risk management systems, transparency mechanisms, and board oversight (K. Li et al., 2020; Susanto & Walyoto, 2022). In the absence of such structures, financial stability may be exploited by managers to pursue private benefits or take on excessive risk, thereby intensifying agency problems.
Empirical evidence consistently shows that weak governance undermines stability and increases the risk of failure. Studies from the Global Financial Crisis demonstrate that ownership and compensation structures significantly shape managerial risk-taking incentives, with high shareholdings among non-CEO managers associated with greater failure risk due to moral hazard behavior (A. N. Berger et al., 2016). Similar patterns are observed in emerging economies, where governance failures and weak regulatory oversight frequently precede financial distress and institutional collapse (Muranda, 2006).
Conversely, strong governance frameworks enhance banks’ capacity to translate financial stability into sustainable performance. Effective governance constrains opportunistic behavior, improves asset allocation, and strengthens internal discipline, thereby supporting long-term institutional resilience (Rahim & Aisyah, 2025; Riahi, 2020). Evidence from both conventional and Islamic banking systems further suggests that governance design, particularly board structure, plays a critical role in shaping stability outcomes, although the effectiveness of specific mechanisms varies across institutional contexts (Mamatzakis et al., 2023).
Beyond stability, governance also influences banks’ strategic positioning and market outcomes. Well-functioning governance structures enhance operational efficiency, resource management, and stakeholder confidence, factors that are especially important in concentrated or low-competition markets where external discipline is limited (Bhatia, 2024; Uddin & Ahmmed, 2018; Wahyudin & Solikhah, 2017). However, when governance constraints are weak, market power and ownership concentration may instead intensify risk-taking behavior (Yeddou, 2024). Overall, the literature converges on the view that corporate governance acts as a strategic transmission mechanism through which financial stability is converted into sustainable bank market power.
2.4. The Boundaries of Market Power: Credit Risk and Institutional Complexity
Market power enables banks to influence pricing, expand credit, and secure competitive rents; however, its strategic effectiveness is inherently constrained by risk conditions and organizational structure. In particular, credit risk and institutional complexity shape whether financial stability can be transformed into sustained market dominance or instead becomes a source of fragility.
Credit risk, commonly proxied by non-performing loans (NPLs), represents a direct limitation on banks’ strategic capacity. Rising NPLs reflect deteriorating loan quality and weaknesses in screening and monitoring, eroding profitability through higher provisioning needs and capital pressures (Laryea et al., 2016; Ngoc Nguyen, 2019). Empirical evidence consistently shows that elevated NPLs reduce returns and weaken financial performance, as losses from impaired loans outweigh any risk-related gains (Bhattarai, 2020; Laryea et al., 2016). As a result, resources that could otherwise support market expansion are diverted toward loss absorption and repairing the balance sheet.
Beyond their impact on performance, high NPL levels alter banks’ competitive behavior. Credit risk discourages aggressive lending and induces more conservative credit policies, particularly following periods of financial stress (Cucinelli, 2015). This contraction in credit supply limits banks’ ability to expand market share through loan growth, a key channel through which market power is typically established. Moreover, problem loans increase operational and monitoring costs, drawing managerial attention away from strategic positioning and reducing organizational flexibility (A. N. Berger & DeYoung, 1997). In such environments, financial stability becomes defensive rather than a platform for market dominance.
The presence of threshold effects further complicates the interaction between market power and credit risk. While moderate market power may incentivize prudent behavior through franchise value protection, excessive credit risk can undermine this self-disciplining mechanism. Large stocks of NPLs constrain lending capacity and capital accumulation, weakening the link between stability and competitive strength (Karadima & Louri, 2020; Louhichi et al., 2019). Evidence from emerging and developing banking systems confirms that high NPL environments are associated with greater instability and reduced strategic leverage, even among well-capitalized banks (Kulu & Osei, 2023; Sain & Kashiramka, 2023).
Institutional complexity constitutes a second boundary condition in the stability–market power relationship. As banks expand across activities, affiliates, and geographic regions, organizational, business, and geographic complexity increase, generating both diversification benefits and governance challenges (Cetorelli & Goldberg, 2014). While complexity may enhance risk sharing and insulation from localized shocks, it also raises agency costs, monitoring difficulties, and supervisory burdens (Krause et al., 2017; Laeven et al., 2016).
Empirical findings suggest that the effects of complexity are heterogeneous across dimensions. Organizational and business complexity are frequently associated with higher risk due to coordination failures and weaker internal control, whereas geographic complexity may provide diversification gains and reduce default risk under effective oversight (Anani, 2024; Argimón & Rodríguez-Moreno, 2022). However, when governance and supervisory capacity fail to keep pace with structural expansion, complexity absorbs managerial resources and impedes efficient capital deployment, diluting the strategic value of financial stability (Buch & Goldberg, 2022; Pham & Doan, 2023).
Overall, the literature suggests that financial stability does not automatically translate into market power. Elevated credit risk can drain capital, restrict lending, and divert managerial focus, while excessive institutional complexity can weaken strategic coherence through governance frictions and coordination costs. Together, these factors define the boundaries within which stable banks can effectively convert balance sheet strength into competitive dominance.
2.5. Digital Transformation Maturity as an Internal Strategic Bridge
Digital transformation maturity represents a critical internal mechanism through which banks convert strategic initiatives into efficiency gains. In the banking sector, digital transformation reflects the depth of integration of digital technologies into core processes, value chains, and organizational routines rather than mere technology adoption (Mavlutova et al., 2023). As such, it functions as a strategic bridge linking complex business strategies, particularly business model diversification, to improvements in bank efficiency across multiple dimensions.
Prior studies indicate that diversification strategies can stimulate digital transformation by increasing operational complexity and the need for advanced information-processing capabilities. Z. Li and Kim (2024) show that product and geographical diversification significantly enhance digital transformation by broadening access to heterogeneous knowledge, technologies, and resources. In banking, diversification into multiple products and markets amplifies coordination demands and data intensity, thereby strengthening incentives to invest in digital infrastructures. Consistent with this view, Stulz (2019) argues that competitive pressure from FinTech and BigTech firms compels banks to adopt digital technologies to support cross-selling, exploit economies of scope, and maintain informational advantages.
The effectiveness of digital transformation depends not only on the scale of IT investment but also on its composition and strategic orientation. Beccalli (2007) demonstrates that aggregate IT spending does not automatically improve bank efficiency, highlighting a profitability paradox. Crucially, investments in IT services, such as consulting, implementation, training, and support, are found to enhance profit efficiency, whereas excessive reliance on hardware and software may weaken performance. This evidence supports the use of IT investment intensity relative to operating costs as a proxy for digital transformation maturity, capturing banks’ ability to translate technological inputs into productive outcomes.
A growing empirical literature confirms that digital transformation maturity enhances bank efficiency, although effects are often dynamic and heterogeneous. Digital initiatives tend to improve efficiency over time, albeit with lags, and may initially impose adjustment costs (Kriebel & Debener, 2019; Shanti et al., 2024). Cross-country evidence further shows that digitalization and FinTech adoption contribute to efficiency improvements through cost reduction, process automation, and better resource allocation (Goel & Kashiramka, 2025; Y. Li et al., 2025; Liu et al., 2024; Zuo et al., 2021). By enabling banks to manage complexity and optimize scale and scope economies, digital transformation maturity provides a key internal channel through which diversification strategies are expected to translate into improvements in technical, scale, and allocative efficiency.
2.6. Market Digitalization as an External Contingency Factor
Market digitalization reflects the extent to which an economy is supported by digital infrastructure, the diffusion of ICT, digital skills, and the widespread adoption of digital services. As an external environmental condition, market digitalization shapes how effectively banks can deploy internal strategies and convert them into efficiency gains. Prior studies emphasize that digitalized markets facilitate faster information transmission, lower transaction costs, and improved coordination across economic actors, thereby altering firms’ operational environments and productivity outcomes (Cheng et al., 2021). In banking, these external digital conditions are particularly relevant given the sector’s reliance on information processing, customer connectivity, and scale economies.
Empirical evidence suggests that the level of ICT diffusion strongly conditions the efficiency effects of financial development and banking activities. Cheng et al. (2021) show that while financial development alone may exert adverse growth effects, especially in high-income countries, ICT diffusion mitigates these effects through positive interaction mechanisms. Mobile connectivity, in particular, enhances information dissemination and operational efficiency, whereas internet-based infrastructure yields more ambiguous outcomes in less developed markets. This suggests that market-level digitalization does not uniformly enhance efficiency, but rather moderates how financial institutions leverage scale, scope, and allocative mechanisms.
Recent banking-specific studies further confirm that the benefits of digitalization depend on market readiness and institutional alignment. Vuong et al. (2025) find that ICT investment improves bank profitability and efficiency in Vietnam; however, its effectiveness depends on strategic fit, workforce capability, and regulatory support. Similarly, Citterio et al. (2024) demonstrate that country-level IT infrastructure and digital skills strengthen banks’ ability to translate digital transformation into performance gains, particularly by enabling customer reach through digital channels. These findings suggest that banks operating in digitally mature markets encounter fewer obstacles in deploying diversified products and coordinating multi-channel operations.
Cross-country evidence from emerging and developing economies reinforces the contingent role of market digitalization. Studies covering Africa, ASEAN, and Central and Eastern Europe highlight that ICT diffusion enhances financial depth, access, and operational efficiency when complemented by regulatory quality and digital infrastructure (Manta et al., 2024; D. T. N. Nguyen, 2025; Raifu et al., 2024). However, several works also document nonlinear or threshold effects, suggesting diminishing returns or transitional inefficiencies when digital adoption outpaces institutional capacity or user readiness (Fuseini, 2025; Fuseini et al., 2024). These patterns underscore that market digitalization acts as a conditioning factor rather than an automatic driver of efficiency.
Taken together, the literature indicates that market digitalization provides a critical external context within which banks’ diversification strategies operate. In highly digitalized markets, characterized by robust ICT infrastructure, widespread digital usage, and supportive governance, banks can distribute a diversified range of products more efficiently, reduce coordination costs, and better leverage economies of scale and scope. Conversely, in less digitalized environments, diversification may intensify inefficiencies due to higher transaction costs and limited digital absorption. Thus, market digitalization shapes the strength and direction of the diversification–efficiency relationship across technical, scale, and allocative dimensions.
2.7. Theoretical Framework and Hypotheses
This study adopts an integrated theoretical framework combining the structure–conduct–performance (SCP) paradigm, the resource-based view (RBV), and agency theory, complemented by the quiet life hypothesis and the diversification discount perspective. This multi-theoretical approach is necessary to explain how banks simultaneously pursue market dominance and operational efficiency, particularly within emerging and transitional banking systems.
The SCP paradigm underpins the analysis of bank market power, measured by the Lerner Index. Rooted in Bain (1951) and adapted to banking by A. N. Berger (1995), SCP posits that market structure shapes banks’ pricing behavior and performance. In concentrated markets, banks with greater financial stability and diversified business models are better positioned to absorb regulatory constraints and exercise pricing power without substantial market share losses (Fukuyama & Tan, 2022). Empirical evidence further confirms that market concentration and bank-specific advantages can reinforce market power, although such dominance does not always reflect superior efficiency (Chortareas et al., 2011; Ghaemi Asl et al., 2021).
To explain heterogeneity in efficiency outcomes, the framework incorporates the resource-based view (RBV). RBV argues that sustainable competitive advantage arises from internal resources that are valuable, rare, and difficult to imitate (Barney, 1991; Wernerfelt, 1984). In this context, financial stability (Z-score) is conceptualized as strategic financial slack that enables banks to withstand shocks and support diversification. Meanwhile, digital transformation maturity (DTM) represents a critical intangible capability that allows banks to integrate diversified activities and achieve efficiency gains. These internal resources are particularly salient in banking systems undergoing structural and technological transition.
However, diversification and stability may also intensify organizational complexity and agency problems. Drawing on agency theory (Jensen & Meckling, 1976), the framework acknowledges that complex banking structures exacerbate information asymmetry between shareholders and managers, potentially leading to inefficiencies and the misallocation of risk. Corporate governance quality (CGQ), therefore, serves as a key monitoring mechanism that disciplines managerial behavior and ensures that financial stability is translated into sustainable market power rather than managerial slack.
Finally, the quiet life hypothesis (A. N. Berger & Hannan, 1998) and the diversification discount argument (Laeven & Levine, 2007) provide important countervailing insights. These perspectives suggest that banks with substantial market power or excessive diversification may experience reduced competitive pressure, higher agency costs, and declining technical or allocative efficiency. This highlights the need for mediating mechanisms, such as digital transformation maturity, and moderating conditions, such as market digitalization, to prevent dominance from eroding efficiency.
In addition to the main explanatory variables, this study controls for leverage, bank size, and risk management quality (RMQ), which are widely recognized as fundamental determinants of bank performance and efficiency. Leverage captures capital structure effects and risk-bearing capacity, while bank size reflects scale-related advantages and complexity. Meanwhile, RMQ accounts for differences in banks’ ability to manage credit and operational risks. These controls ensure that the estimated relationships are not confounded by fundamental balance sheet and risk management characteristics.
Based on this integrated framework, the conceptual model illustrated in Figure 1 depicts the assumed direct and moderated relationships among the key constructs, and the following hypotheses are formulated:
H1.
Business model diversification has a positive effect on bank market power;
H2.
Financial stability has a positive effect on bank market power;
H3.
Business model diversification has a positive effect on bank (a) technical, (b) scale, and (c) allocative efficiency;
H4.
Financial stability has a positive effect on bank (a) technical, (b) scale, and (c) allocative efficiency;
H5.
Corporate governance quality mediates the relationship between financial stability and bank market power;
H6.
Non-performing loans (NPL) moderate the relationship between financial stability and bank market power;
H7.
Institutional complexity moderates the relationship between financial stability and bank market power;
H8.
Digital transformation maturity mediates the relationship between business model diversification and bank (a) technical, (b) scale, and (c) allocative efficiency;
H9.
Market digitalization moderates the relationship between business model diversification and bank (a) technical, (b) scale, and (c) allocative efficiency.
3. Materials and Methods
This study utilizes secondary data from conventional commercial banks operating in ASEAN and MENA countries from 2010 to 2019. The data are sourced from Bloomberg, which is widely used in cross-country banking studies due to its standardized financial reporting and extensive institutional coverage. The observation period is deliberately chosen to exclude the Global Financial Crisis and the COVID-19 pandemic, thereby capturing banking behavior under relatively stable regulatory and macroeconomic conditions. The sample consists of the ten largest banks by total assets in each country, following prior studies that emphasize the systemic relevance and market influence of large banking institutions. The conceptual framework illustrating the direct, mediating, and moderating relationships examined in this study is presented in Figure 1 (Conceptual framework showing direct and moderated relationships). A detailed summary of variable measurements is reported in Table 2.
Business model diversification is proxied by non-interest income (NNIN), which reflects banks’ reliance on non-traditional activities beyond interest-based intermediation. Consistent with the diversification literature, NNIN is measured as the ratio of non-interest operating income to total operating income, expressed as:
where represents the aggregate share of non-interest income for bank i in year t. Non-interest income includes fees and commissions, trading and derivatives income, and other operating revenues. Operating income, on the other hand, comprises net interest income and non-interest income. This measure builds upon prior studies that utilize income structure to capture banks’ strategic diversification choices (Aliyu et al., 2023).
Bank financial stability is measured using the Z-score, a widely adopted indicator of bank risk and distance-to-default in the banking and finance literature (Banna & Alam, 2021). The Z-score explicitly compares profitability and capitalization buffers against earnings volatility and is defined as:
where denotes return on assets, represents the equity-to-total-assets ratio, and is the standard deviation of ROA. Higher Z-score values indicate greater financial stability and lower risk of insolvency. Following recent empirical studies, the logarithm of the Z-score is employed to mitigate skewness in the distribution (Banna & Alam, 2021; Lestari et al., 2023), while risk-adjusted ROA and ROE are used as complementary stability measures.
Bank efficiency is estimated using Data Envelopment Analysis (DEA), a non-parametric frontier technique originally developed by Charnes et al. (1978) and widely applied in banking efficiency studies (Alhassan & Tetteh, 2017; Vidyarthi, 2019). DEA measures relative efficiency by maximizing the ratio of weighted outputs to weighted inputs, expressed as:
Where is the efficiency score of bank s, and denote output and input quantities, and and are the corresponding weights. Efficiency scores range between 0 and 1. This study applies both Constant Returns to Scale (CRS) and Variable Returns to Scale (VRS) assumptions to derive technical efficiency, allocative efficiency, and scale efficiency. The VRS specification is used to capture both pure technical and allocative efficiency, reflecting the assumption that banks may not operate at optimal scale. In contrast, scale efficiency is computed as the ratio of CRS to VRS scores (Chortareas et al., 2011; Liu et al., 2024).
Market power is proxied by the Lerner Index, a non-structural measure of pricing power widely used in banking competition studies (Lin et al., 2021; Tan & Anchor, 2017). The Lerner Index is calculated as:
where represents the ratio of total revenue to total assets for bank s at time t, and denotes marginal cost. Marginal cost is estimated from a translog cost function using Stochastic Frontier Analysis (SFA), as described in A. N. Berger et al. (2017). Higher Lerner values indicate greater market power and weaker competitive pressure, consistent with evidence from both developed and emerging banking systems (Das & Pati, 2025; T. T. H. Nguyen et al., 2022; Pak & Nurmakhanova, 2013).
Digital Transformation Maturity (DTM) is constructed as a composite index capturing banks’ digital capabilities and technology deployment. Following recent digital banking studies, DTM is defined as:
Where DI represents digital infrastructure, OO online operations, PI payment innovation, and ITI IT investment intensity, each component is normalized to a 0–1 scale using publicly disclosed information. This approach is consistent with prior efforts to operationalize digital transformation in the presence of data constraints (Banna & Alam, 2021; Citterio et al., 2024).
Corporate Governance Quality (CGQ) is measured using a weighted composite index reflecting board effectiveness, ownership structure, disclosure quality, and executive alignment, expressed as:
Where BI denotes board independence, OA ownership adjustment, DQ disclosure quality, and EA executive alignment. The index design draws on governance dimensions commonly used in banking governance research (Bhatia, 2024; Dedu & Chitan, 2013; Muranda, 2006).
Market Digitalization (MDL) captures the digital financial ecosystem at the country level and is measured as:
Where DI represents national digital infrastructure, FI financial inclusion, RR regulatory readiness, and PS policy support, this construction aligns with ICT-based and digital inclusion indices used in cross-country studies (Cheng et al., 2021; Khera et al., 2022; Vuong et al., 2025).
Organizational complexity is measured using a composite Complexity Index that integrates asset, geographic, and organizational dimensions, defined as:
Where AC denotes asset complexity, GC geographic complexity, and OC organizational complexity, this approach is consistent with the multidimensional view of banking complexity proposed by Cetorelli and Goldberg (2014) and extended by Carmassi and Herring (2016) and Krause et al. (2017).
Credit risk is proxied by the non-performing loan (NPL) ratio, which is measured as the ratio of non-performing loans to total loans. This ratio is a standard indicator of asset quality and risk-taking behavior in banking studies (Maghyereh & Awartani, 2014; Ngoc Nguyen, 2019). Leverage, bank size (natural logarithm of total assets), and risk management quality are included as control variables. Risk Management Quality (RMQ) is constructed as a composite index capturing monitoring, credit assessment, compliance, internal controls, and audit quality, following prior risk governance frameworks and Bloomberg disclosures.
All data are analyzed using Partial Least Squares Structural Equation Modeling (SEM-PLS) with WarpPLS 8. SEM-PLS is particularly suitable for complex models involving latent constructs, mediation, and moderation effects, as well as non-normal data distributions. The structural analysis is conducted using two separate models: the first specifies market power as the dependent variable, while the second focuses on multidimensional efficiency outcomes. This separation allows clearer identification of the distinct strategic mechanisms underlying competition and efficiency. A multi-group analysis using the Satterthwaite method is employed to examine structural differences between the ASEAN and MENA banking systems.

Table 1.
Summary of variable measurement.
| Variable | Symbol | Proxy / Measurement Formula |
|---|---|---|
| Business model | NNIN | Non-Interest Income / Operating Income. |
| Bank stability | Z-Score | |
| Market power | LI | |
| Technical efficiency | TE | DEA Score (VRS Model). Input-oriented. |
| Allocative efficiency | AE | DEA Score reflecting optimal input mix at given prices. |
| Scale efficiency | SE | Ratio of DEA CRS to DEA VRS |
| Digital transformation | DTM | Composite index of infrastructure, operations, payments, IT intensity |
| Corporate governance quality | CGQ | Composite index of board, ownership, disclosure, incentives |
| Market digitalization | MDL | Composite index of national digital infrastructure, financial inclusion, regulatory readiness, and policy support |
| Complexity index | CI | Composite index of asset complexity, geographic complexity, and organizational complexity |
| Non-performing loan | NPL | Non-Performing Loans / Total Gross Loans |
| Bank size | Size | Natural Logarithm of Total Assets |
| Leverage | Leverage | Total Debt / Total Equity |
| Risk management quality | RMQ | Weighted Score (0-100): Monitoring, Assessment, Compliance, Controls, Audit |
3. Results
4.1. Descriptive Statistics
Table 2 presents the descriptive statistics for all variables across the full sample and by regional classification (ASEAN and MENA). Overall, the statistics reveal substantial heterogeneity in bank characteristics, business models, and operational conditions across regions.
Table 2.
Descriptive statistics by regional classification.
| Variables | All countries | ASEAN | MENA | ||||||
| Mean | Median | Std. Dev. | Mean | Median | Std. Dev. | Obs. | Mean | Std. Dev. | |
| NNIN | 8,821.20 | 3,927.56 | 10,244.92 | 12,483.42 | 8,801.49 | 11,260.67 | 4,450.16 | 1,608.70 | 6,632.12 |
| Z-Score | 54.91 | 43.43 | 37.35 | 67.93 | 63.04 | 39.70 | 39.38 | 29.46 | 27.18 |
| LI | 0.9736 | 0.9745 | 0.0121 | 0.9751 | 0.9772 | 0.0133 | 0.9718 | 0.9729 | 0.0102 |
| TE | 0.7841 | 0.8265 | 0.1901 | 0.7327 | 0.7465 | 0.2086 | 0.8454 | 0.8735 | 0.1432 |
| SE | 0.9031 | 0.9740 | 0.1409 | 0.8608 | 0.9530 | 0.1661 | 0.9536 | 0.9805 | 0.0775 |
| AE | 0.7245 | 0.7290 | 0.1801 | 0.6963 | 0.7110 | 0.1916 | 0.7580 | 0.7515 | 0.1592 |
| NPL | 3.6250 | 3.5017 | 1.9435 | 3.0930 | 3.0897 | 1.7381 | 4.2598 | 3.9755 | 1.9872 |
| CI | 0.5160 | 0.5689 | 0.4483 | 0.4127 | 0.1664 | 0.4423 | 0.6393 | 0.9020 | 0.4241 |
| Leverage | 1.3543 | 1.3475 | 0.3193 | 1.3071 | 1.3136 | 0.2856 | 1.4106 | 1.4340 | 0.3475 |
| RMQ | 0.7790 | 0.7796 | 0.1035 | 0.8042 | 0.7931 | 0.0770 | 0.7489 | 0.7395 | 0.1217 |
| Bank Size | 12.3789 | 12.4933 | 1.5401 | 12.6834 | 12.9059 | 1.5658 | 12.0154 | 12.0383 | 1.4286 |
| DTM | 0.5484 | 0.5432 | 0.0948 | 0.5360 | 0.5282 | 0.1008 | 0.5632 | 0.5599 | 0.0849 |
| CGQ | 0.5761 | 0.5658 | 0.1062 | 0.5964 | 0.5819 | 0.1222 | 0.5518 | 0.5554 | 0.0767 |
| MDL | 0.4212 | 0.4144 | 0.1031 | 0.3897 | 0.3804 | 0.0930 | 0.4588 | 0.4510 | 0.1021 |
Banks in ASEAN exhibit markedly higher levels of business model diversification, as reflected in the mean non-interest income (NNIN), compared to their counterparts in the MENA region. This suggests a stronger reliance on fee-based and non-traditional income sources in ASEAN banking systems. Financial stability, measured by the Z-score, also appears considerably higher in ASEAN, indicating a greater distance to default and more resilient balance sheets relative to banks in the MENA region.
Market power, proxied by the Lerner Index, is high across both regions, with limited dispersion, suggesting relatively concentrated banking markets. However, efficiency patterns differ notably. MENA banks demonstrate higher average technical, scale, and allocative efficiency, accompanied by lower variability, implying more consistent operational performance. In contrast, ASEAN banks exhibit greater dispersion in efficiency scores, particularly in terms of technical and scale efficiency, reflecting the heterogeneous production structures and competitive environments within the region.
Risk and organizational characteristics further distinguish the regions. ASEAN banks report lower non-performing loan ratios and higher risk management quality (RMQ), while MENA banks exhibit greater institutional complexity (CI) and higher leverage. ASEAN banks are, on average, larger in size and display slightly stronger corporate governance quality (CGQ). In contrast, MENA banks show higher levels of digital transformation maturity (DTM) and market digitalization (MDL), indicating more advanced digital environments at the country level.
Taken together, these descriptive patterns underscore meaningful regional differences in stability, diversification, efficiency, governance, and digitalization, justifying the subsequent structural and multi-group analyses.
4.2. Correlation Analysis of Latent Variables
This study employs Partial Least Squares Structural Equation Modeling (PLS-SEM) to investigate the relationships between banks’ strategic characteristics, stability, market power, multidimensional efficiency, and contextual factors. Prior to estimating the structural models, the measurement model is evaluated to ensure the adequacy of construct validity.
Discriminant validity is assessed using latent variable correlation analysis. As reported in Table 3 and Table 4, all pairwise correlations among latent constructs remain below the commonly accepted threshold of 0.70, indicating satisfactory discriminant validity (MacKenzie et al., 2005). These results confirm that the constructs capture conceptually distinct dimensions and are appropriate for subsequent structural model estimation.
4.3. Measurement Model Assessment
The adequacy of the measurement and structural models was evaluated using the PLS-SEM model fit and quality criteria provided by WarpPLS, as summarized in Table 5. Overall, the results indicate that both Model 1 (Market Power) and Model 2 (Efficiency) meet the recommended thresholds for goodness-of-fit, multicollinearity, and predictive relevance, supporting the robustness of subsequent hypothesis testing.
In terms of global model fit, the Average Path Coefficient (APC), Average R-squared (ARS), and Average Adjusted R-squared (AARS) are all statistically significant at the 1% level in both models, indicating that the structural relationships are jointly meaningful. The Tenenhaus Goodness-of-Fit (GoF) values of 0.749 for Model 1 and 0.515 for Model 2 exceed the cut-off for a large effect size (≥ 0.36), suggesting strong overall explanatory power.
Multicollinearity diagnostics further confirm model adequacy. The Average Variance Inflation Factor (AVIF) and Average Full Collinearity VIF (AFVIF) values for both models are well below the conservative threshold of 3.3, indicating that multicollinearity is not a concern and that the estimated path coefficients are stable. In addition, the Sympson’s Paradox Ratio (SPR), R-squared Contribution Ratio (RSCR), and Statistical Suppression Ratio (SSR) meet or exceed their respective minimum requirements, providing further evidence of a well-specified model without pathological suppression effects.
Regarding explanatory power, the R-squared values indicate moderate explanatory strength for market power (LI) and scale efficiency (SE). In contrast, technical efficiency (TE) and allocative efficiency (AE) exhibit relatively weaker explanatory levels. A similar pattern is observed for the adjusted R-squared values, suggesting that efficiency outcomes—particularly TE and AE—are influenced by additional operational and institutional factors beyond the core variables included in the model. This finding is consistent with the notion that bank efficiency is inherently multidimensional and heterogeneous across efficiency components.
Finally, the Stone–Geisser Q² values for all endogenous constructs are positive, confirming adequate predictive relevance for both models. Collectively, these results demonstrate that the measurement and structural specifications are statistically sound, free from critical estimation issues, and suitable for analyzing the determinants of bank market power and multidimensional efficiency.
4.4. Structural Model Results: Determinants of Market Power
The structural model results for bank market power are presented in Table 6, while the estimated path coefficients and interaction effects are visually summarized in Figure 2. Overall, the findings provide strong empirical support for the proposed direct and mediated relationships, with selective evidence for moderation effects.
Regarding the direct effects, business model diversification, measured by non-interest income (NNIN), shows a positive and statistically significant relationship with market power (β = 0.356, p < 0.001), providing empirical support for H1. Financial stability, proxied by the Z-score, also exhibits a positive and significant effect on market power (β = 0.243, p < 0.001), supporting H2. These results indicate that both NNIN and financial stability are significant predictors of market power in the estimated model.
The mediation analysis further reveals a significant indirect effect of financial stability on market power through the quality of corporate governance (CGQ). As reported in Table 6, the indirect path from Z-score to CGQ and subsequently to market power is positive and statistically significant (β = 0.179, p < 0.001), indicating partial mediation and supporting H5. This suggests that the effect of financial stability on market power operates through both direct and indirect channels.
In terms of moderation effects, the interaction between non-performing loans (NPL) and financial stability does not have a statistically significant effect on market power (β = −0.007, p = 0.425). Accordingly, H6 is not supported. Conversely, the interaction between the complexity index (CI) and financial stability is negative and statistically significant (β = −0.243, p < 0.001), providing support for H7. This indicates that institutional complexity moderates the relationship between financial stability and market power.
Regarding the control variables, bank size exhibits a positive and statistically significant effect on market power (β = 0.195, p < 0.001). Financial leverage does not show a significant relationship with market power (β = −0.010, p = 0.399). Risk management quality (RMQ) exhibits a statistically significant negative effect on market power (β = −0.091, p = 0.008).
4.5. Structural Model Results: Determinants of Bank Efficiency
The structural model results for bank efficiency are presented in Table 7, with the estimated path relationships visualized in Figure 3. Bank efficiency is assessed using three dimensions, namely technical efficiency (TE), scale efficiency (SE), and allocative efficiency (AE), allowing for a comprehensive evaluation of efficiency determinants.
Regarding the direct effects, business model diversification measured by non-interest income (NNIN) exhibits negative and statistically significant relationships with all three efficiency measures. Specifically, NNIN has a negative effect on technical efficiency (β = −0.142, p < 0.001), scale efficiency (β = −0.285, p < 0.001), and allocative efficiency (β = −0.181, p < 0.001). Consequently, hypotheses H3a, H3b, and H3c are not supported. Similarly, financial stability, proxied by the Z-score, shows either negative or statistically insignificant effects on efficiency. The Z-score has a negative impact on technical efficiency (β = −0.123, p < 0.001) and allocative efficiency (β = −0.176, p < 0.001), while its relationship with scale efficiency is statistically insignificant (β = −0.016, p = 0.333). Therefore, hypotheses H4a, H4b, and H4c are not supported.
The mediation analysis indicates limited support for the indirect role of digital transformation (DTM). As reported in Table 7, DTM partially mediates the relationship between NNIN and technical efficiency, with a positive and statistically significant indirect effect (β = 0.072, p = 0.004), supporting H8a. However, the indirect effects of NNIN on scale efficiency (β = 0.012, p = 0.330) and allocative efficiency (β = 0.036, p = 0.093) through DTM are not statistically significant. Accordingly, hypotheses H8b and H8c are not supported.
Regarding moderation effects, market discipline (MDL) significantly moderates the relationship between NNIN and technical efficiency (β = 0.176, p < 0.001), providing support for H9a. In contrast, the interaction between MDL and NNIN does not significantly influence scale efficiency (β = −0.006, p = 0.440), leading to the rejection of H9b. The moderating effect of MDL on the relationship between NNIN and allocative efficiency is positive and statistically significant (β = 0.088, p = 0.011), supporting H9c.
Regarding control variables, bank size (log of total assets) has a statistically significant negative effect on scale efficiency (β = −0.524, p < 0.001), while its effects on technical efficiency (β = −0.024, p = 0.265) and allocative efficiency (β = 0.039, p = 0.157) are not statistically significant. Financial leverage has a negative impact on technical efficiency (β = −0.422, p < 0.001) and allocative efficiency (β = −0.078, p = 0.020), but does not significantly affect scale efficiency (β = 0.045, p = 0.118). Risk management quality (RMQ) is negatively associated with technical efficiency (β = −0.237, p < 0.001) and allocative efficiency (β = 0.101, p = 0.004), while its relationship with scale efficiency is not statistically significant (β = 0.004, p = 0.462).
4.6. Multi-Group Analysis Results (ASEAN vs. MENA)
This study further employs Multi-Group Analysis (MGA) to examine whether the structural relationships differ significantly between banks operating in ASEAN and MENA regions. The results of the MGA are reported in Table 8, with statistically significant group differences identified based on the absolute difference in path coefficients.
For the direct effects on market power, the relationship between business model diversification (NNIN) and market power (LI) is positive in both regions, with a coefficient of 0.227 for ASEAN and 0.304 for MENA, although the difference between the two groups is not statistically significant (Δβ = 0.076). In contrast, the effect of financial stability (as measured by the Z-score) on market power varies substantially across regions. The Z-score exhibits a negative coefficient in ASEAN (β = −0.119) but a positive and stronger coefficient in MENA (β = 0.442), with a statistically significant group difference (Δβ = 0.561, p < 0.01), supporting the presence of regional heterogeneity for H2.
Regarding efficiency-related direct effects, the relationship between NNIN and technical efficiency is weak in both regions and does not show a statistically significant difference (Δβ = 0.098). However, significant regional differences are observed for scale efficiency and allocative efficiency. The effect of NNIN on scale efficiency is negative in ASEAN (β = −0.243) but positive in MENA (β = 0.174), with a significant difference between the two groups (Δβ = 0.417, p < 0.01). Similarly, NNIN shows a positive coefficient for allocative efficiency in ASEAN (β = 0.037) and a negative coefficient in MENA (β = −0.155), with a statistically significant difference (Δβ = 0.192, p < 0.01).
The effects of financial stability on efficiency also vary across regions. The relationship between the Z-score and technical efficiency is negative in ASEAN (β = −0.114) and positive in MENA (β = 0.035), with a significant group difference (Δβ = 0.149, p < 0.05). A similar pattern is observed for scale efficiency, where the Z-score has a negative coefficient in ASEAN (β = −0.064) and a positive coefficient in MENA (β = 0.087), with the difference being statistically significant (Δβ = 0.152, p < 0.05). In contrast, the effect of the Z-score on allocative efficiency does not differ significantly between the two regions (Δβ = 0.105).
Note: *P-Value < 0.05; **P-Value < 0.01.
For moderation effects related to market power, the interaction between non-performing loans (NPL) and the Z-score shows opposite signs across regions, with a negative coefficient in ASEAN (β = −0.115) and a positive coefficient in MENA (β = 0.147). The difference between the two groups is statistically significant (Δβ = 0.263, p < 0.01). The moderating effect of the complexity index (CI) on the Z-score–market power relationship is negative in both regions and does not exhibit a significant group difference (Δβ = 0.087).
Substantial regional heterogeneity is also evident in the moderation effects on efficiency. The interaction between market discipline (MDL) and NNIN on technical efficiency is positive in ASEAN (β = 0.118) but negative in MENA (β = −0.199), with a statistically significant difference (Δβ = 0.317, p < 0.01). Similarly, the moderating effect of MDL on scale efficiency is negative in both regions, although it is stronger in MENA (β = −0.321) than in ASEAN (β = −0.086), with a significant group difference (Δβ = 0.235, p < 0.01). For allocative efficiency, the MDL × NNIN interaction is strongly positive in ASEAN (β = 0.398) but negative in MENA (β = −0.089), with the largest observed group difference (Δβ = 0.487, p < 0.01).
Regarding control variables, several statistically significant regional differences are observed. Bank size exhibits a positive effect on market power in ASEAN (β = 0.154) but a negative effect in MENA (β = −0.057), with a significant difference (Δβ = 0.211, p < 0.01). Bank size also shows significant group differences across all efficiency measures, with positive effects on technical and allocative efficiency in ASEAN but negative or weaker effects in MENA. Financial leverage exhibits significant regional differences in technical efficiency, with a stronger negative effect in ASEAN (β = −0.524) compared to MENA (β = −0.265). In contrast, no significant differences are observed for scale and allocative efficiency. Finally, risk management quality (RMQ) shows a significant regional difference only for scale efficiency (Δβ = 0.133, p < 0.05). In contrast, its effects on market power, technical efficiency, and allocative efficiency do not differ significantly between the two regions.
5. Discussion
The empirical findings of this study offer a nuanced understanding of how business model diversification, financial stability, governance mechanisms, and digital transformation collectively shape bank market power and efficiency. By analyzing conventional banks across the ASEAN and MENA regions, the results reveal distinct pathways for market dominance versus operational efficiency, highlighting the critical role of institutional and digital factors in reconciling these competing strategic objectives.
The positive and statistically significant effect of business model diversification on market power supports the premise that expanding into non-interest activities strengthens a bank's competitive positioning. This finding aligns with the Structure-Conduct-Performance (SCP) paradigm. It corroborates empirical evidence from Setianto et al. (2025), who observed that diversification enhances market power by stabilizing revenue streams and enabling more favorable pricing strategies. Similarly, Das and Pati (2025) argue that banks generating a larger portion of revenue from non-interest sources enjoy higher margins because these niche markets face less intense competition than traditional lending activities. By reducing reliance on interest income, banks can cross-subsidize products and create higher switching costs for customers, thereby consolidating their market dominance.
In parallel, financial stability, proxied by the Z-score, exhibits a strong positive association with market power, suggesting that stability itself acts as a strategic resource. This result supports the “competition-stability” view found in Louhichi et al. (2019), where higher stability and capitalization allow banks to protect their franchise value and signal reliability to the market. As noted by Qori’ah et al. (2025) and Wu et al. (2019), stable banks possess the capital buffers necessary to absorb shocks and maintain lending during downturns, effectively "buying" market share when weaker competitors retreat.
However, stability alone is insufficient without effective oversight. The significant mediating role of corporate governance quality (CGQ) indicates that stability requires robust mechanisms to direct financial resources toward value-creating strategies. This finding echoes that of Mamatzakis et al. (2023), who found that board structure is a significant determinant of financial stability. Furthermore, Bhatia (2024) demonstrated that adherence to governance standards, such as effective boards and transparency, is crucial for enhancing profitability and resilience, particularly in low-competition environments.
Crucially, this study identifies structural frictions that limit the benefits of stability. The negative moderation of institutional complexity on the stability–market power nexus supports the “diseconomies of complexity” argument. As highlighted by (2014) and Laeven et al. (2016), complex organizational structures, characterized by numerous subsidiaries and geographic dispersion, exacerbate agency problems and increase monitoring costs. Consequently, even financially stable banks may fail to leverage their capital effectively if their complex structures slow down decision-making or obscure risk signals, a view supported by Krause et al. (2017). While the aggregate moderation of non-performing loans (NPLs) was less dominant, the theoretical underpinning suggests that high NPLs can drain managerial attention, as noted by A. N. Berger and DeYoung (1997), effectively severing the link between stability and aggressive market expansion due to the burden of bad management.
Turning to operational performance, the results reveal a dark side to diversification and stability in terms of efficiency. The negative association between business model diversification and multiple efficiency dimensions strongly supports the diversification discount theory. Curi et al. (2015) and Elyasiani and Wang (2012) similarly found that diversification often destroys technical efficiency due to increased coordination costs and the complexity of managing disparate business lines. Likewise, the negative impact of financial stability on efficiency aligns with the quiet life hypothesis described by Ikeda et al. (2018). This hypothesis suggests that managers of highly stable and dominant banks may feel insulated from market discipline, leading to managerial slack where they avoid difficult cost-cutting decisions or underinvest in necessary innovations. Consequently, excessive stability can breed inefficiency, as managers prioritize safety over optimal resource utilization, a trend also observed by Miah and Uddin (2017).
The study’s most novel contribution lies in identifying digital transformation maturity (DTM) as the solution to this efficiency paradox. The positive mediation effect of DTM confirms that digitalization is the missing link that enables banks to manage the complexity of diversification efficiently. This supports Beccalli (2007) and Citterio et al. (2024), who argue that while IT investment alone may not yield immediate returns, the strategic adoption of digital channels and infrastructure can significantly reduce operating costs and enhance network efficiency. By automating processes and enabling scalable service delivery, digital maturity allows diversified banks to overcome coordination costs, turning potential inefficiencies into productivity gains, as evidenced by Liu et al. (2024).
Moreover, the moderating role of market digitalization level (MDL) underscores the importance of the external environment. Consistent with Cheng et al. (2021) and Vuong et al. (2025), banks operating in countries with robust digital infrastructure and policy support are better positioned to reap the efficiency benefits of their internal digital strategies. A mature ecosystem reduces transaction frictions and facilitates the adoption of fintech innovations. As noted by Khera et al. (2022), the widespread adoption of digital financial services acts as a key driver for inclusion and efficiency, amplifying the positive impact of diversification.
Finally, the Multi-Group Analysis reveals significant regional divergences. The stronger stability–market power link in the MENA region reflects its unique market structure, often characterized by high concentration and a reliance on economic stability tied to oil prices, as noted by Aliyu et al. (2023). In this context, stability acts as a primary signal of reliability. In contrast, the ASEAN region shows more dynamic efficiency relationships, likely driven by its rapidly evolving digital landscape and diverse levels of financial development. This heterogeneity highlights that "one-size-fits-all" policies are ineffective; MENA banks may benefit more from stability-enhancing governance reforms, while ASEAN banks need to prioritize digital integration to manage the efficiency costs of diversification, aligning with the regional governance insights provided by D. T. N. Nguyen (2025).
6. Conclusions
This study examines how banks balance the dual strategic imperatives of securing market power and optimizing multidimensional operational efficiency, as measured by technical, scale, and allocative efficiency, within emerging and transitional banking systems. The findings demonstrate that business model diversification and financial stability play asymmetric roles across these two performance domains. While both factors significantly strengthen banks’ market power, they do not uniformly enhance efficiency and are instead associated with efficiency trade-offs across multiple dimensions. This confirms that strategies aimed at competitive positioning and risk resilience do not automatically translate into superior operational efficiency.
The results further indicate that governance quality and digital transformation act as critical conditioning mechanisms in shaping these relationships. Governance quality partially channels the stabilizing effects of financial soundness into market power, reinforcing the role of institutional oversight in transforming stability into strategic advantage. At the same time, digital transformation maturity mitigates some of the efficiency losses associated with diversification, particularly in terms of technical efficiency, while market digitalization selectively amplifies or constrains the effectiveness of diversification strategies. The multi-group analysis reveals substantial regional heterogeneity, indicating that the relative importance of stability, diversification, and moderating mechanisms varies between ASEAN and MENA banking systems, reflecting differences in institutional development, market structure, and digital readiness.
Theoretically, this study advances the banking literature by integrating market power and multidimensional efficiency within a unified analytical framework and demonstrating that their determinants operate through distinct and conditional pathways. By explicitly accounting for governance, risk, and digitalization, the findings refine existing views that often treat diversification and stability as universally beneficial. From a practical perspective, the results suggest that banks should strike a balance between diversification-driven growth and investments in governance and digital capabilities to prevent efficiency erosion. Meanwhile, policymakers should prioritize strengthening institutional quality and digital infrastructure to support sustainable banking performance.
Several limitations should be acknowledged. The analysis relies on secondary indicators and a cross-sectional design, which may not fully capture dynamic strategic adjustments or causal mechanisms. Future research could extend this framework using longitudinal data, alternative efficiency measures, or broader regional coverage to examine further how banks balance competitive power and operational efficiency under evolving institutional and digital conditions.
Author Contributions
Conceptualization, A.W., J.K.W., and D.S.; methodology, A.W., D.D., and A.Z.A.; software, A.Z.A.; validation, A.W., J.K.W., D.S., and A.Z.A.; formal analysis, A.W., D.S., and A.Z.A.; investigation, J.K.W., and D.S.; resources, A.W.; data curation, A.Z.A.; writing—original draft preparation, A.W. and J.K.W.; writing—review and editing, A.W. and A.Z.A.; visualization, A.Z.A.; supervision, A.W.; project administration, A.W. All authors have read and agreed to the published version of the manuscript.
Funding
This research received no external funding.
Institutional Review Board Statement
Not applicable.
Informed Consent Statement
Not applicable.
Data Availability Statement
The data used in this study were obtained from the Bloomberg database, which is a proprietary data source. Due to licensing restrictions, the data cannot be made publicly available. However, all variables, measurement procedures, and model specifications are fully described in the paper to ensure transparency and replicability. Researchers with authorized access to Bloomberg may replicate the analysis using the same data sources, subject to Bloomberg’s terms and conditions.
Conflicts of Interest
The authors declare that they have no conflicts of interest.
References
- Abu Khalaf, B.; Awad, A. B.; Ellis, S. The Impact of Non-Interest Income on Commercial Bank Profitability in the Middle East and North Africa (MENA) Region. Journal of Risk and Financial Management 2024, Vol. 17(Issue 3), 103. [Google Scholar] [CrossRef]
- Aderogba, T.; Adekunle, I. A.; Atoyebi, O. E. Post-Crisis Bank Profitability in BRICS: A CAMEL Approach. Journal of Emerging Market Finance 2025, 24(3), 360–384. [Google Scholar] [CrossRef]
- Akins, B.; Li, L.; Ng, J.; Rusticus, T. Bank Competition and Financial Stability: Evidence from the Financial Crisis. Journal of Financial and Quantitative Analysis 2016, 51, 1–28. [Google Scholar] [CrossRef]
- Alhassan, A. L. Income diversification and bank efficiency in an emerging market. Managerial Finance 2015, 41(12), 1318–1335. [Google Scholar] [CrossRef]
- Alhassan, A. L.; Tetteh, M. L. Non-Interest Income and Bank Efficiency in Ghana: A Two-Stage DEA Bootstrapping Approach. Journal of African Business 2017, 18(1), 124–142. [Google Scholar] [CrossRef]
- Aliyu, S.; Mohammad, A. R.; Abd. Wahab, N. Bank diversification, stability and oil price in MENA region. Journal of Islamic Accounting and Business Research 2023, 16(6), 1074–1099. [Google Scholar] [CrossRef]
- Alzoubi, M. Noninterest income and bank performance in Europe and Middle East and North Africa (MENA). Cogent Business & Management 2025, 12(1), 2500678. [Google Scholar] [CrossRef]
- Anani, M. Geographic complexity and bank risk: Evidence from cross-border banks in Africa. Economic Systems 2024, 48(3), 101190. [Google Scholar] [CrossRef]
- Argimón, I.; Rodríguez-Moreno, M. Risk and control in complex banking groups. Journal of Banking & Finance 2022, 134, 106038. [Google Scholar] [CrossRef]
- Ayadi, R.; Challita, S.; Cucinelli, D. Cooperative banks, business models and efficiency: a stochastic frontier approach analysis. Annals of Operations Research 2023, 1–43. [Google Scholar] [CrossRef]
- Bain, J. S. Relation of Profit Rate to Industry Concentration: American Manufacturing, 1936-1940. The Quarterly Journal of Economics 1951, 65(3), 293–324. [Google Scholar] [CrossRef]
- Banna, H.; Alam, M. R. Impact of digital financial inclusion on ASEAN banking stability: implications for the post-Covid-19 era. Studies in Economics and Finance 2021, 38(2), 504–523. [Google Scholar] [CrossRef]
- Barney, J. Firm Resources and Sustained Competitive Advantage. Journal of Management 1991, 17(1), 99–120. [Google Scholar] [CrossRef]
- Barra, C.; Zotti, R. Bank Performance, Financial Stability and Market Concentration: Evidence From Cooperative and Non-Cooperative Banks. Annals of Public and Cooperative Economics 2019, 90(1), 103–139. [Google Scholar] [CrossRef]
- Beccalli, E. Does IT investment improve bank performance? Evidence from Europe. Journal of Banking & Finance 2007, 31(7), 2205–2230. [Google Scholar] [CrossRef]
- Berger, A.; Hasan, I.; Zhou, M. The Effects of Focus versus Diversification on Bank Performance: Evidence from Chinese Banks. Journal of Banking & Finance 2010, 34, 1417–1435. [Google Scholar] [CrossRef]
- Berger, A. N. The Profit-Structure Relationship in Banking--Tests of Market-Power and Efficient-Structure Hypotheses. Journal of Money, Credit and Banking 1995, 27(2), 404–431. [Google Scholar] [CrossRef]
- Berger, A. N.; DeYoung, R. Problem loans and cost efficiency in commercial banks. Journal of Banking & Finance 1997, 21(6), 849–870. [Google Scholar] [CrossRef]
- Berger, A. N.; Hannan, T. H. The Efficiency Cost of Market Power in the Banking Industry: A Test of the “Quiet Life” and Related Hypotheses. The Review of Economics and Statistics 1998, 80(3), 454–465. Available online: http://www.jstor.org/stable/2646754. [CrossRef]
- Berger, A. N.; Imbierowicz, B.; Rauch, C. The Roles of Corporate Governance in Bank Failures during the Recent Financial Crisis. Journal of Money, Credit and Banking 2016, 48(4), 729–770. [Google Scholar] [CrossRef]
- Berger, A. N.; Klapper, L. F.; Turk-Ariss, R. Chapter 10: Bank competition and financial stability. In Handbook of Competition in Banking and Finance; Edward Elgar Publishing, 2017. [Google Scholar] [CrossRef]
- Bhatia, M. Corporate Governance, Market Competition and Performance of Indian Banks. Global Business Review 2024, 09721509241269416. [Google Scholar] [CrossRef]
- Bhattarai, B. P. Effects of non-performing loan on profitability of commercial banks in Nepal. The Journal Of Indian Management 2020, 10(4), 15–22. [Google Scholar] [CrossRef]
- Buch, C. M.; Goldberg, L. S. Complexity and riskiness of banking organizations: Evidence from the International Banking Research Network. Journal of Banking & Finance 2022, 134, 106244. [Google Scholar] [CrossRef]
- Bueno, L. A.; Sigahi, T. F. A. C.; Rampasso, I. S.; Leal Filho, W.; Anholon, R. Impacts of digitization on operational efficiency in the banking sector: Thematic analysis and research agenda proposal. International Journal of Information Management Data Insights 2024, 4(1), 100230. [Google Scholar] [CrossRef]
- Carmassi, J.; Herring, R. The Corporate Complexity of Global Systemically Important Banks. Journal of Financial Services Research 2016, 49(2), 175–201. [Google Scholar] [CrossRef]
- Cetorelli, N.; Goldberg, L. S. Measures of global bank complexity. FRBNY Economic Policy Review 2014, 20(2), 107–126. Available online: https://www.newyorkfed.org/research/epr/2014/1412ceto.html.
- Charnes, A.; Cooper, W. W.; Rhodes, E. Measuring the efficiency of decision making units. European Journal of Operational Research 1978, 2(6), 429–444. [Google Scholar] [CrossRef]
- Cheng, C.-Y.; Chien, M.-S.; Lee, C.-C. ICT diffusion, financial development, and economic growth: An international cross-country analysis. Economic Modelling 2021, 94, 662–671. [Google Scholar] [CrossRef]
- Chortareas, G. E.; Garza-Garcia, J. G.; Girardone, C. Banking Sector Performance in Latin America: Market Power versus Efficiency. Review of Development Economics 2011, 15(2), 307–325. [Google Scholar] [CrossRef]
- Chronopoulos, D. K.; Girardone, C.; Nankervis, J. C. Are there any cost and profit efficiency gains in financial conglomeration? Evidence from the accession countries. The European Journal of Finance 2011, 17(8), 603–621. [Google Scholar] [CrossRef]
- Citterio, A.; King, T.; Locatelli, R. Is digital transformation profitable for banks? Evidence from Europe. Finance Research Letters 2024, 70, 106269. [Google Scholar] [CrossRef]
- Claessens, S.; Coleman, N.; Donnelly, M. “Low-For-Long” interest rates and banks’ interest margins and profitability: Cross-country evidence. Journal of Financial Intermediation 2018, 35, 1–16. [Google Scholar] [CrossRef]
- Cucinelli, D. The Impact of Non-performing Loans on Bank Lending Behavior: Evidence from the Italian Banking Sector. Eurasian Journal of Business and Economics 2015, 8(16 SE-), 59–71. [Google Scholar] [CrossRef]
- Curi, C.; Lozano-Vivas, A.; Zelenyuk, V. Foreign bank diversification and efficiency prior to and during the financial crisis: Does one business model fit all? Journal of Banking & Finance 2015, 61, S22–S35. [Google Scholar] [CrossRef]
- Das, S.; Pati, A. P. Bank market power drivers: comparative insights from India and Bangladesh. South Asian Journal of Business Studies 2025, 14(2), 221–236. [Google Scholar] [CrossRef]
- Dedu, V.; Chitan, G. The Influence of Internal Corporate Governance on Bank Performance - An Empirical Analysis for Romania. Procedia - Social and Behavioral Sciences 2013, 99, 1114–1123. [Google Scholar] [CrossRef]
- DeYoung, R.; Roland, K. P. Product Mix and Earnings Volatility at Commercial Banks: Evidence from a Degree of Total Leverage Model. Journal of Financial Intermediation 2001, 10(1), 54–84. [Google Scholar] [CrossRef]
- Doan, A.-T.; Lin, K.-L.; Doong, S.-C. What drives bank efficiency? The interaction of bank income diversification and ownership. International Review of Economics & Finance 2018, 55, 203–219. [Google Scholar] [CrossRef]
- Elyasiani, E.; Wang, Y. Bank holding company diversification and production efficiency. Applied Financial Economics 2012, 22(17), 1409–1428. [Google Scholar] [CrossRef]
- Fiordelisi, F.; Marques-Ibanez, D.; Molyneux, P. Efficiency and Risk in European Banking. Journal of Banking & Finance 2011, 35, 1315–1326. [Google Scholar] [CrossRef]
- Fukuyama, H.; Tan, Y. A new way to estimate market power in banking. Journal of the Operational Research Society 2022, 73(2), 445–453. [Google Scholar] [CrossRef]
- Fuseini, E. I. Institutional quality-banking efficiency nexuses in Africa. How does ICT moderate? Information Technology for Development 2025, 31(4), 1147–1171. [Google Scholar] [CrossRef]
- Fuseini, E. I.; Ibrahim, M.; Adam, I. O.; Vinh Vo, X. Re-examining the moderating role of ICT in the nexus between financial development and banking efficiency: evidence from Africa. Cogent Economics & Finance 2024, 12(1), 2325833. [Google Scholar] [CrossRef]
- Gehrig, T. P. Changing Business Models in Banking and Systemic Risk. In Management of Permanent Change; Albach, H., Meffert, H., Pinkwart, A., Reichwald, R., Eds.; Springer Fachmedien Wiesbaden, 2015; pp. 145–160. [Google Scholar] [CrossRef]
- Ghaemi Asl, M.; Rashidi, M. M.; Ghorbani, A. Empirical evaluation of structure-conduct-performance paradigm as applied to the Iranian Islamic banking system. International Journal of Islamic and Middle Eastern Finance and Management 2021, 15(4), 759–787. [Google Scholar] [CrossRef]
- Goel, R.; Kashiramka, S. FinTech Advancement in the Banking Industry: Is It Driving Efficiency? International Journal of Finance & Economics 2025, n/a(n/a). [Google Scholar] [CrossRef]
- Guerry, N.; Wallmeier, M. Valuation of diversified banks: New evidence. Journal of Banking & Finance 2017, 80, 203–214. [Google Scholar] [CrossRef]
- Hafez, H. M. M. Does the efficiency of banks adversely affect financial stability? A Comparative study between traditional and Islamic banks: Evidence from Egypt. Banks and Bank Systems 2022, 17(2), 13–26. [Google Scholar] [CrossRef] [PubMed]
- Herwald, S.; Voigt, S.; Uhde, A. The impact of market concentration and market power on banking stability – evidence from Europe. Journal of Risk Finance 2024, 25(3), 510–536. [Google Scholar] [CrossRef]
- Ikeda, N.; Inoue, K.; Watanabe, S. Enjoying the quiet life: Corporate decision-making by entrenched managers. Journal of the Japanese and International Economies 2018, 47, 55–69. [Google Scholar] [CrossRef]
- Jensen, M. C.; Meckling, W. F. Theory of the firm: Managerial behavior, agency costs, and ownership structure. Journal of Financial Economics 1976, 3, 305–360. [Google Scholar] [CrossRef]
- Karadima, M.; Louri, H. Non-performing loans in the euro area: Does bank market power matter? International Review of Financial Analysis 2020, 72, 101593. [Google Scholar] [CrossRef]
- Karkowska, R.; Acedański, J. The effect of corporate board attributes on bank stability. Portuguese Economic Journal 2020, 19(2), 99–137. [Google Scholar] [CrossRef]
- Kasman, A.; Carvallo, O. Financial Stability, Competition and Efficiency in Latin American and Caribbean Banking. Journal of Applied Economics 2014, 17(2), 301–324. [Google Scholar] [CrossRef]
- Khan, A. B.; Fareed, M.; Salameh, A. A.; Hussain, H. Financial Innovation, Sustainable Economic Growth, and Credit Risk: A Case of the ASEAN Banking Sector. Frontiers in Environmental Science 2021, 9, 729922. [Google Scholar] [CrossRef]
- Khera, P.; Ng, S.; Ogawa, S.; Sahay, R. Measuring Digital Financial Inclusion in Emerging Market and Developing Economies: A New Index. Asian Economic Policy Review 2022, 17(2), 213–230. [Google Scholar] [CrossRef]
- Kim, B.; Jung, J.; Cho, S. Can ESG mitigate the diversification discount in cross-border M&A? Borsa Istanbul Review 2022, 22(3), 607–615. [Google Scholar] [CrossRef]
- Kock, N.; Lynn, G. Lateral collinearity and misleading results in variance-based SEM: An illustration and recommendations. Journal of the Association for Information Systems 2012, 13(7), 546–580. [Google Scholar] [CrossRef]
- Krause, T.; Sondershaus, T.; Tonzer, L. Complexity and bank risk during the financial crisis. Economics Letters 2017, 150, 118–121. [Google Scholar] [CrossRef]
- Kriebel, J.; Debener, J. The effect of digital transformation on bank performance. SSRN. 2019. Available online: https://ssrn.com/abstract=3461594.
- Kulu, E.; Osei, B. Drivers of financial stability gap: evidence from sub-Saharan Africa. Journal of Financial Economic Policy 2023, 16(1), 19–33. [Google Scholar] [CrossRef]
- Laeven, L.; Levine, R. Is there a diversification discount in financial conglomerates? Journal of Financial Economics 2007, 85(2), 331–367. [Google Scholar] [CrossRef]
- Laeven, L.; Ratnovski, L.; Tong, H. Bank size, capital, and systemic risk: Some international evidence. Journal of Banking & Finance 2016, 69, S25–S34. [Google Scholar] [CrossRef]
- Landi, A.; Venturelli, V. The Diversification Strategy of European Banks: Determinants and Effects on Efficiency and Profitability. SSRN Electronic Journal 2005, 1–30. [Google Scholar] [CrossRef]
- Laryea, E.; Ntow-Gyamfi, M.; Alu, A. A. Nonperforming loans and bank profitability: evidence from an emerging market. African Journal of Economic and Management Studies 2016, 7(4), 462–481. [Google Scholar] [CrossRef]
- Le, T. D. Q.; Nguyen, D. T.; Ngo, T. Revisiting the Quiet-Life Hypothesis in the Banking Sector: Do CEOs’ Personalities Matter? International Journal of Financial Studies 2024, Vol. 12(Issue 1), 28. [Google Scholar] [CrossRef]
- Lee, C.-C.; Yang, S.-J.; Chang, C.-H. Non-interest income, profitability, and risk in banking industry: A cross-country analysis. The North American Journal of Economics and Finance 2014, 27, 48–67. [Google Scholar] [CrossRef]
- Lestari, D.; Ma, S.; Jun, A. Enhancing bank stability from diversification and digitalization perspective in ASEAN. Studies in Economics and Finance 2023, 40(4), 606–624. [Google Scholar] [CrossRef]
- Li, K.; Kong, Y.; Sampson; Bentum-Micah, G.; Michael. Corporate Governance and Banking Stability: The Case of Universal Banks in Ghana. International Journal of Economics and Business Administration 2020, 8(1), 325–352. [Google Scholar] [CrossRef] [PubMed]
- Li, Y.; Stasinakis, C.; Yeo, W. M.; Fernandes, F. D. S. Fintech, financial development and banking efficiency: evidence from Chinese commercial banks. The European Journal of Finance 2025, 31(10), 1245–1295. [Google Scholar] [CrossRef]
- Li, Z.; Kim, S. Diversification Strategies and Digital Transformation: Evidence from Chinese-Listed Enterprises. Cuadernos de Economía 2024, 47(134), 169–179. Available online: https://cude.es/submit-a-manuscript/index.php/CUDE/article/view/595.
- Lin, Y.; Shi, X.; Zheng, Z. Diversification strategy and bank market power: does foreign ownership matter? Applied Economics Letters 2021, 28(4), 269–273. [Google Scholar] [CrossRef]
- Liu, T. L.; Naveed, M. M.; Mustafa, S.; Naveed, M. T. Analysing the impact of digital technology diffusion on the efficiency and convergence process of the commercial banking industry of Pakistan. Humanities and Social Sciences Communications 2024, 11(1), 792. [Google Scholar] [CrossRef]
- Lopez, J. A.; Rose, A. K.; Spiegel, M. M. Why have negative nominal interest rates had such a small effect on bank performance? Cross country evidence. European Economic Review 2020, 124, 103402. [Google Scholar] [CrossRef]
- Louhichi, A.; Louati, S.; Boujelbene, Y. Market-power, stability and risk-taking: an analysis surrounding the riba-free banking. Review of Accounting and Finance 2019, 18(1), 2–24. [Google Scholar] [CrossRef]
- Lown, C.; Osler, C.; Strahan, P.; Sufi, A. The Changing Landscape of the Financial Services Industry: What Lies Ahead? Economic Policy Review 2000, 6, 39–54. [Google Scholar]
- MacKenzie, S. B.; Podsakoff, P. M.; Jarvis, C. B. The problem of measurement model misspecification in behavioral and organizational research and some recommended solutions. The Journal of Applied Psychology 2005, 90(4), 710–730. [Google Scholar] [CrossRef]
- Maghyereh, A. I.; Awartani, B. The effect of market structure, regulation, and risk on banks efficiency: Evidence from the Gulf cooperation council countries. Journal of Economic Studies 2014, 41(3), 405–430. [Google Scholar] [CrossRef]
- Mamatzakis, E.; Alexakis, C.; Yahyaee; Al, K.; Pappas, V.; Mobarek, A.; Mollah, S. Does corporate governance affect the performance and stability of Islamic banks? Corporate Governance 2023, 23(4), 888–919. [Google Scholar] [CrossRef]
- Manta, A. G.; Bădîrcea, R. M.; Gherțescu, C.; Manta, L. F. How Does the Nexus Between Digitalization and Banking Performance Drive Digital Transformation in Central and Eastern European Countries? Electronics 2024, Vol. 13(Issue 22), 4383. [Google Scholar] [CrossRef]
- Mateev, M.; Sahyouni, A.; Tariq, M. U. Bank regulation, ownership and risk taking behavior in the MENA region: policy implications for banks in emerging economies. Review of Managerial Science 2023, 17(1), 287–338. [Google Scholar] [CrossRef]
- Mavlutova, I.; Spilbergs, A.; Verdenhofs, A.; Natrins, A.; Arefjevs, I.; Volkova, T. Digital Transformation as a Driver of the Financial Sector Sustainable Development: An Impact on Financial Inclusion and Operational Efficiency. Sustainability (Switzerland) 2023, 15(1), 207. [Google Scholar] [CrossRef]
- Mayes, D. G.; Halme, L.; Liuksila, A. Corporate Governance and Financial Stability. In Improving Banking Supervision; Mayes, D. G., Halme, L., Liuksila, A., Eds.; Palgrave Macmillan UK, 2001; pp. 91–120. [Google Scholar] [CrossRef]
- Miah, M. D.; Uddin, H. Efficiency and stability: A comparative study between islamic and conventional banks in GCC countries. Future Business Journal 2017, 3(2), 172–185. [Google Scholar] [CrossRef]
- Minh, S. N.; Hong, V. N. T.; Le Hoang, L.; Thuy, T. N. T. Does banking market power matter on financial stability? Management Science Letters 2020, 10(2), 343–350. [Google Scholar] [CrossRef]
- Muranda, Z. Financial distress and corporate governance in Zimbabwean banks. Corporate Governance 2006, 6(5), 643–654. [Google Scholar] [CrossRef]
- Ngoc Nguyen, K. Revenue Diversification, Risk and Bank Performance of Vietnamese Commercial Banks. Journal of Risk and Financial Management 2019, Vol. 12(Issue 3), 138. [Google Scholar] [CrossRef]
- Nguyen, D. T.; Le, T. D. Q.; Tran, S. Competition and bank financial stability: evidence from an emerging economy. Cogent Business and Management 2024, 11(1), 1–16. [Google Scholar] [CrossRef]
- Nguyen, D. T. N. Impact of e-government development, economic growth and government management efficiency on financial performance of commercial banks in ASEAN countries. Asian Journal of Economics and Banking 2025, 9(3), 395–417. [Google Scholar] [CrossRef]
- Nguyen, J. The relationship between net interest margin and noninterest income using a system estimation approach. Journal of Banking & Finance 2012, 36(9), 2429–2437. [Google Scholar] [CrossRef]
- Nguyen, M.; Perera, S.; Skully, M. Bank market power, ownership, regional presence and revenue diversification: Evidence from Africa. Emerging Markets Review 2016, 27, 36–62. [Google Scholar] [CrossRef]
- Nguyen, P. H.; Pham, D. T. B. Income diversification and cost-efficiency of Vietnamese banks. International Journal of Managerial Finance 2020, 16(5), 623–643. [Google Scholar] [CrossRef]
- Nguyen, T. L. A. Diversification and bank efficiency in six ASEAN countries. Global Finance Journal 2018, 37, 57–78. [Google Scholar] [CrossRef]
- Nguyen, T. T. H.; Phan, G. Q.; Wong, W.-K.; Moslehpour, M. The influence of market power on liquidity creation of commercial banks in Vietnam. Journal of Asian Business and Economic Studies 2022, 30(3), 166–186. [Google Scholar] [CrossRef]
- Nisar, S.; Peng, K.; Wang, S.; Ashraf, B. N. The Impact of Revenue Diversification on Bank Profitability and Stability: Empirical Evidence from South Asian Countries. International Journal of Financial Studies 2018, Vol. 6(Issue 2), 40. [Google Scholar] [CrossRef]
- Oanh, D. L. K.; Loc, N. H. V.; Nga, D. Q. The Impact of Non-interest Income on Vietnamese Bank Performance BT. In Partial Identification in Econometrics and Related Topics; Ngoc Thach, N., Trung, N. D., Ha, D. T., Kreinovich, V., Eds.; Springer Nature Switzerland, 2024; pp. 635–651. [Google Scholar] [CrossRef]
- Olarewaju, O. M. Income Diversification in Low Income Sub-Saharan African Countries’ Commercial Banks: A “Blessing” or “Curse”? Folia Oeconomica Stetinensia 2018, 18(2), 90–105. [Google Scholar] [CrossRef]
- Pak, O.; Nurmakhanova, M. The Effect of Market Power on Bank Credit Risk-Taking and Bank Stability in Kazakhstan. Transition Studies Review 2013, 20(3), 335–350. [Google Scholar] [CrossRef]
- Palermo, T.; Power, M.; Ashby, S. Navigating Institutional Complexity: The Production of Risk Culture in the Financial Sector. Journal of Management Studies 2017, 54(2), 154–181. [Google Scholar] [CrossRef]
- Pham, T. H. A.; Doan, N. T. Global bank complexity and financial fragility around the world. Economic Systems 2023, 47(1), 101057. [Google Scholar] [CrossRef]
- Qori’ah, C. G.; Wardhono, A.; Yaqin, M.; Nasir, M. A. Market Power and Financial Stability : An Empirical Study of the Banking Industry in Selected ASEAN Countries. IRJEMS International Research Journal of Economics and Management Studies 2025, 4(11), 162–169. [Google Scholar] [CrossRef]
- Rahim, S. A.; Aisyah, E. N. Corporate Social Responsibility, Good Corporate Governance and Financial Sustainability: A Financial Stability Role. Asian Journal of Economics, Business and Accounting 2025, 25(2), 231–242. [Google Scholar] [CrossRef]
- Raifu, I. A.; Okunoye, I. A.; Aminu, A. The effect of ICT on financial sector development in Africa: does regulatory quality matter? Information Technology for Development 2024, 30(3), 424–451. [Google Scholar] [CrossRef]
- Repullo, R. Capital requirements, market power, and risk-taking in banking. Journal of Financial Intermediation 2004, 13(2), 156–182. [Google Scholar] [CrossRef]
- Riahi, Y. Examining the relationship between bank stability and earnings quality in Islamic and conventional banks. International Journal of Islamic and Middle Eastern Finance and Management 2020, 13(5), 803–826. [Google Scholar] [CrossRef]
- Ritter, T.; Pedersen, C. L. Digitization capability and the digitalization of business models in business-to-business firms: Past, present, and future. Industrial Marketing Management 2020, 86, 180–190. [Google Scholar] [CrossRef]
- Sain, A.; Kashiramka, S. Profitability–Stability Nexus in Commercial Banks: Evidence from BRICS. Global Business Review 2023, 09721509231184765. [Google Scholar] [CrossRef]
- Sakouvogui, K.; Shaik, S. Impact of financial liquidity and solvency on cost efficiency: evidence from US banking system. Studies in Economics and Finance 2020, 37(2), 391–410. [Google Scholar] [CrossRef]
- Setianto, R. H.; Azman-Saini, W. N. W.; Law, S. H.; Ahmad, A. H.; Mohd Daud, S. N. Does financial inclusion affect bank market power? International evidence. Finance Research Letters 2025, 85, 1–15. [Google Scholar] [CrossRef]
- Shanti, R.; Siregar, H.; Zulbainarni, N.; Tony. Revolutionizing Banking: Neobanks’ Digital Transformation for Enhanced Efficiency. Journal of Risk and Financial Management 2024, Vol. 17(Issue 5), 188. [Google Scholar] [CrossRef]
- Soedarmono, W.; Machrouh, F.; Tarazi, A. Bank market power, economic growth and financial stability: Evidence from Asian banks. Journal of Asian Economics 2011, 22(6), 460–470. [Google Scholar] [CrossRef]
- Stiroh, K. J. Diversification in Banking: Is Noninterest Income the Answer. Journal of Money Credit and Banking 2004, 36, 853–882. [Google Scholar] [CrossRef]
- Stiroh, K.; Rumble, A. The Dark Side of Diversification: The Case of US Financial Holding Companies. Journal of Banking & Finance 2006, 30, 2131–2161. [Google Scholar] [CrossRef]
- Stone, M. Cross-Validatory Choice and Assessment of Statistical Predictions. Journal of the Royal Statistical Society: Series B (Methodological) 1974, 36(2), 111–133. [Google Scholar] [CrossRef]
- Stulz, R. M. FinTech, BigTech, and the Future of Banks. Journal of Applied Corporate Finance 2019, 31(4), 86–97. [Google Scholar] [CrossRef]
- Susanto, J.; Walyoto, S. The Effect of Corporate Governance on Financial Performance. Journal of Management and Islamic Finance 2022, 2(1), 132–143. [Google Scholar] [CrossRef]
- Tabak, B. M.; Fazio, D. M.; Cajueiro, D. O. The effects of loan portfolio concentration on Brazilian banks’ return and risk. Journal of Banking and Finance 2011, 35(11), 3065–3076. [Google Scholar] [CrossRef]
- Tan, Y.; Anchor, J. Does competition only impact on insolvency risk? New evidence from the Chinese banking industry. International Journal of Managerial Finance 2017, 13(3), 332–354. [Google Scholar] [CrossRef]
- Uddin, M.; Ahmmed, M. Islamic Banking and Green Banking for Sustainable Development: Evidence from Bangladesh. In Al-Iqtishad: Jurnal Ilmu Ekonomi Syariah; 2018; Volume 10, pp. 97–114. [Google Scholar] [CrossRef]
- Vidyarthi, H. Dynamics of income diversification and bank performance in India. Journal of Financial Economic Policy 2019, 12(3), 383–407. [Google Scholar] [CrossRef]
- Vuong, N. L.; Pham, H. M.; Le, T. T.; Nguyen, V. C.; Nguyen, T. H. T. Information and communication technology as a catalyst for bank efficiency: Empirical evidence from Vietnam. Asia and the Global Economy 2025, 5(2), 100119. [Google Scholar] [CrossRef]
- Wahyudin, A.; Solikhah, B. Corporate governance implementation rating in Indonesia and its effects on financial performance. Corporate Governance: The International Journal of Business in Society 2017, 17, 250–265. [Google Scholar] [CrossRef]
- Wernerfelt, B. A resource-based view of the firm. Strategic Management Journal 1984, 5(2), 171–180. [Google Scholar] [CrossRef]
- Wu, J.; Guo, M.; Chen, M.; Jeon, B. N. Market power and risk-taking of banks: Some semiparametric evidence from emerging economies. Emerging Markets Review 2019, 41, 1–21. [Google Scholar] [CrossRef]
- Yeddou, N. Ownership structure and bank performance: the impact of market competition. Applied Economics 2024, 56(49), 5987–6019. [Google Scholar] [CrossRef]
- Zuo, L.; Strauss, J.; Zuo, L. The Digitalization Transformation of Commercial Banks and Its Impact on Sustainable Efficiency Improvements through Investment in Science and Technology. Sustainability 2021, Vol. 13(Issue 19), 11028. [Google Scholar] [CrossRef]
Figure 1.
Conceptual Framework Showing Direct, Mediated, and Moderated Relationships.
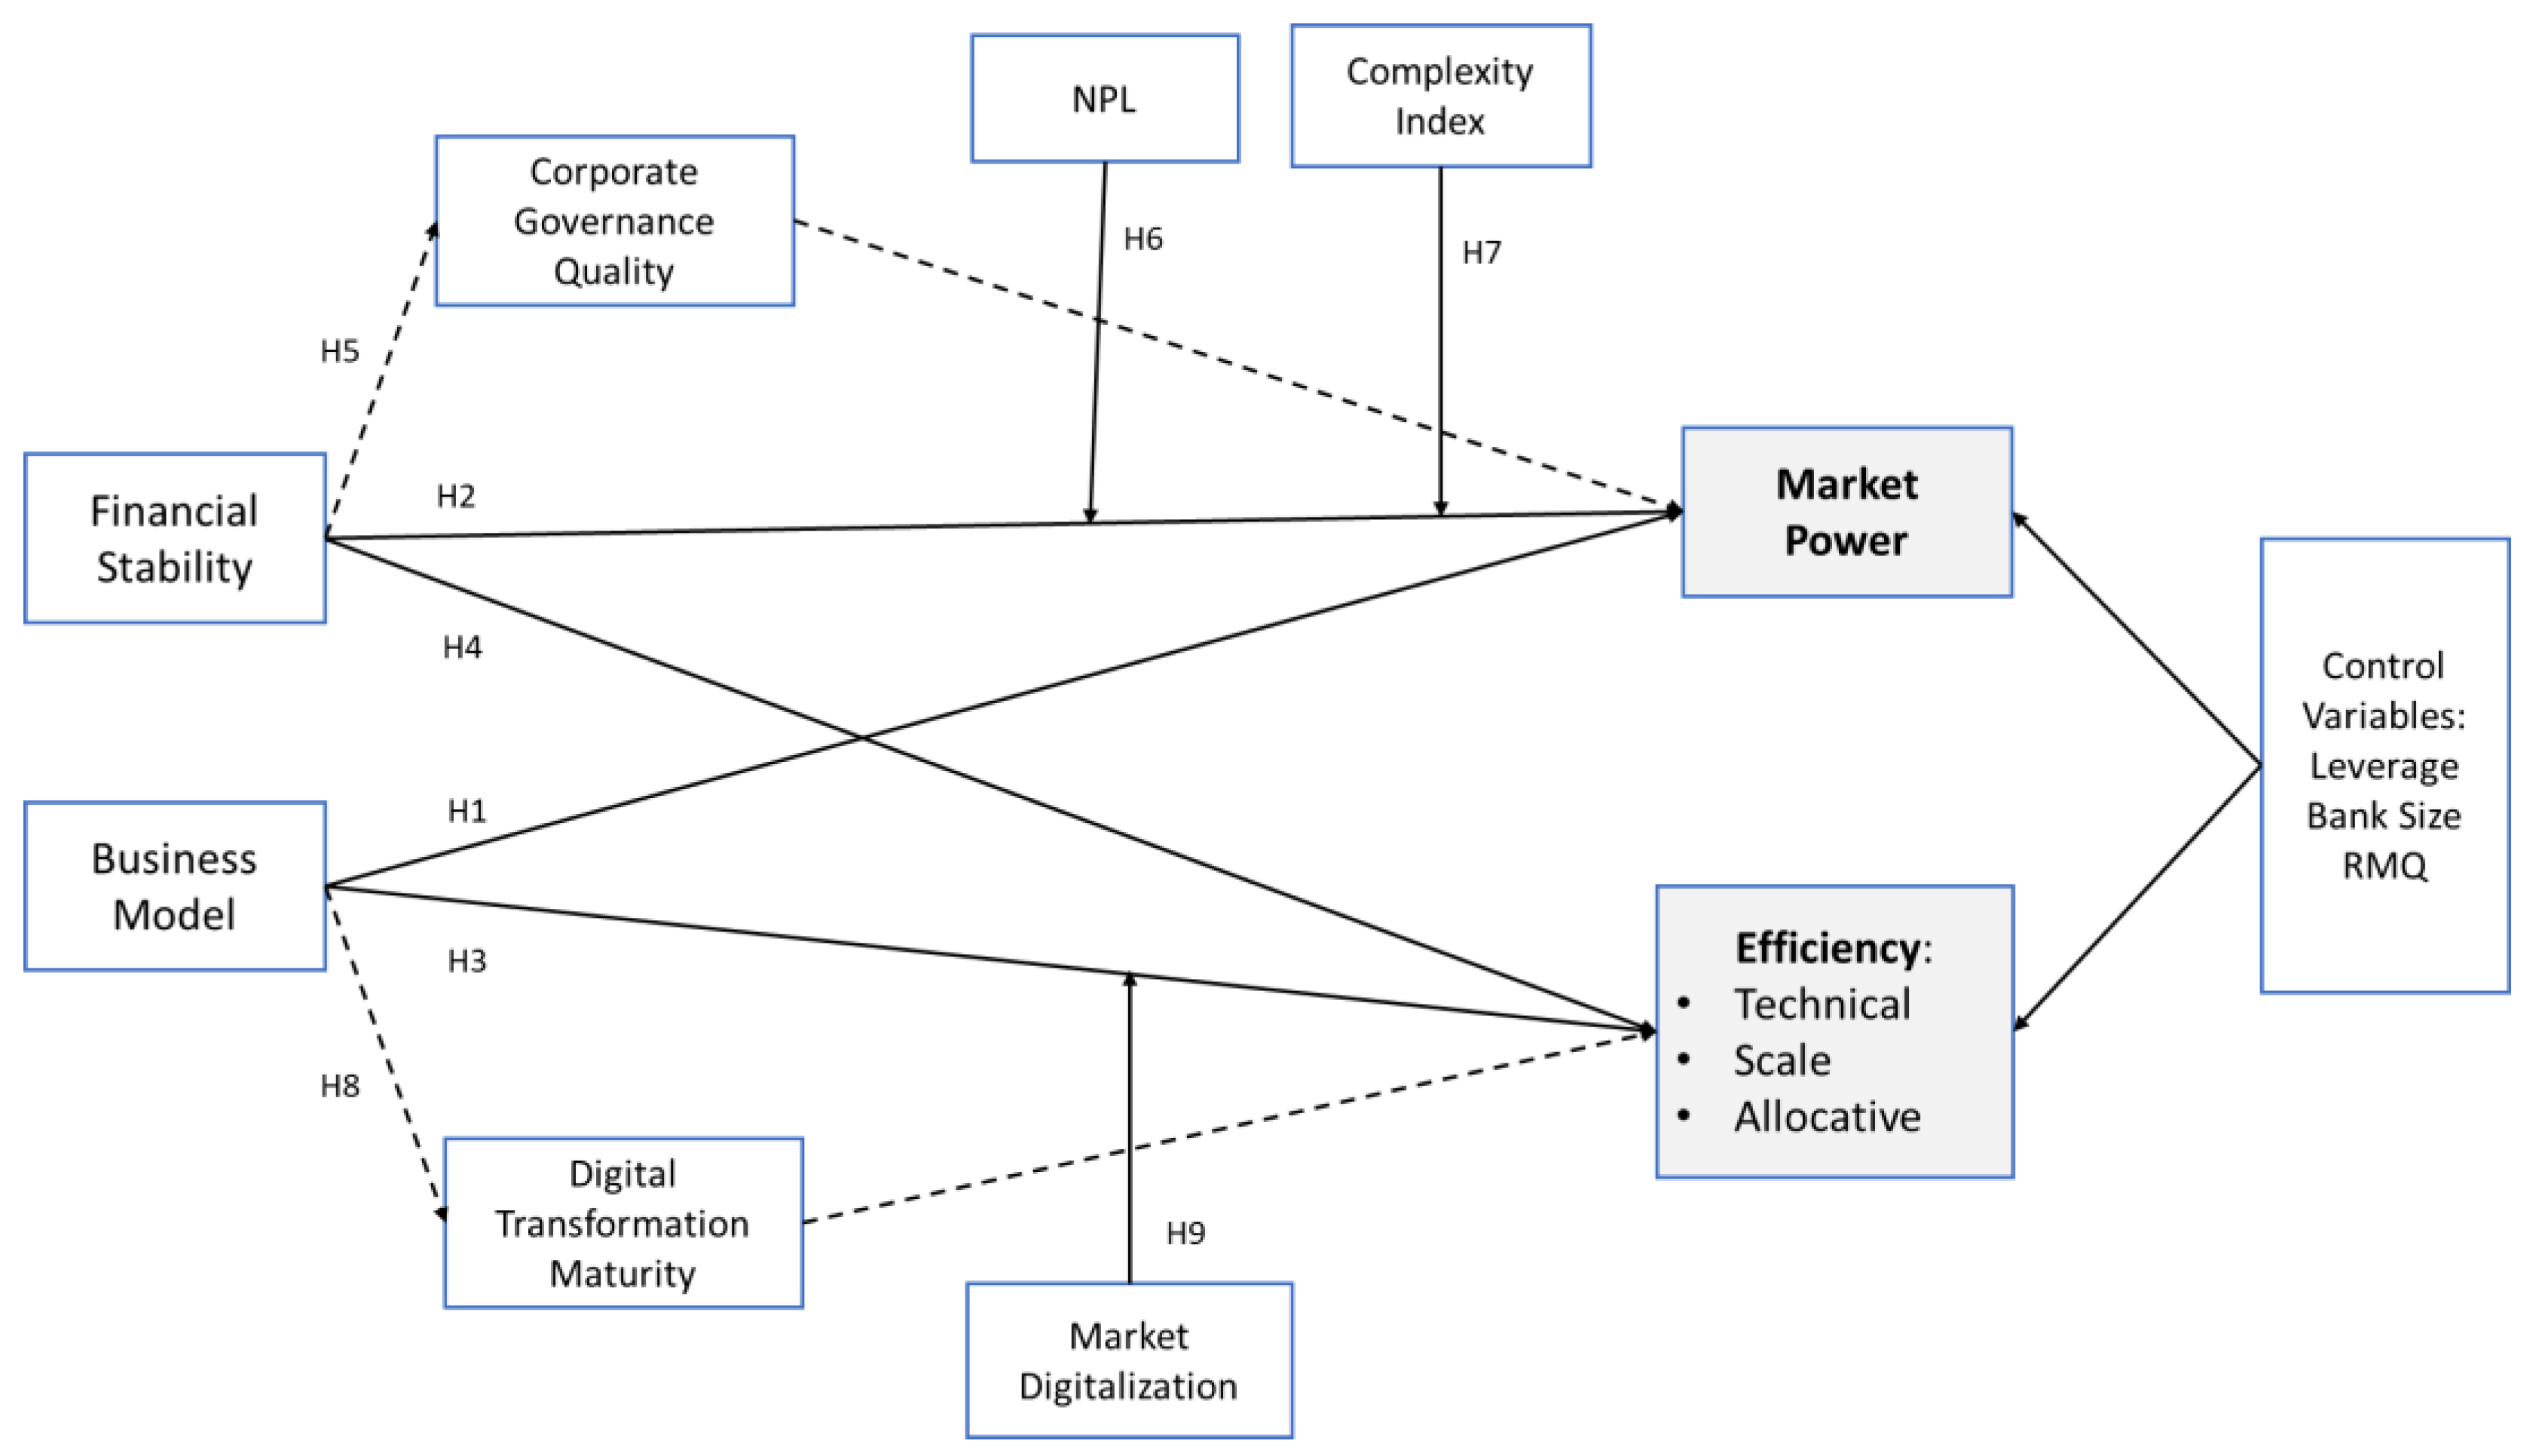
Figure 2.
Structural Model Results: Determinants of Market Power.
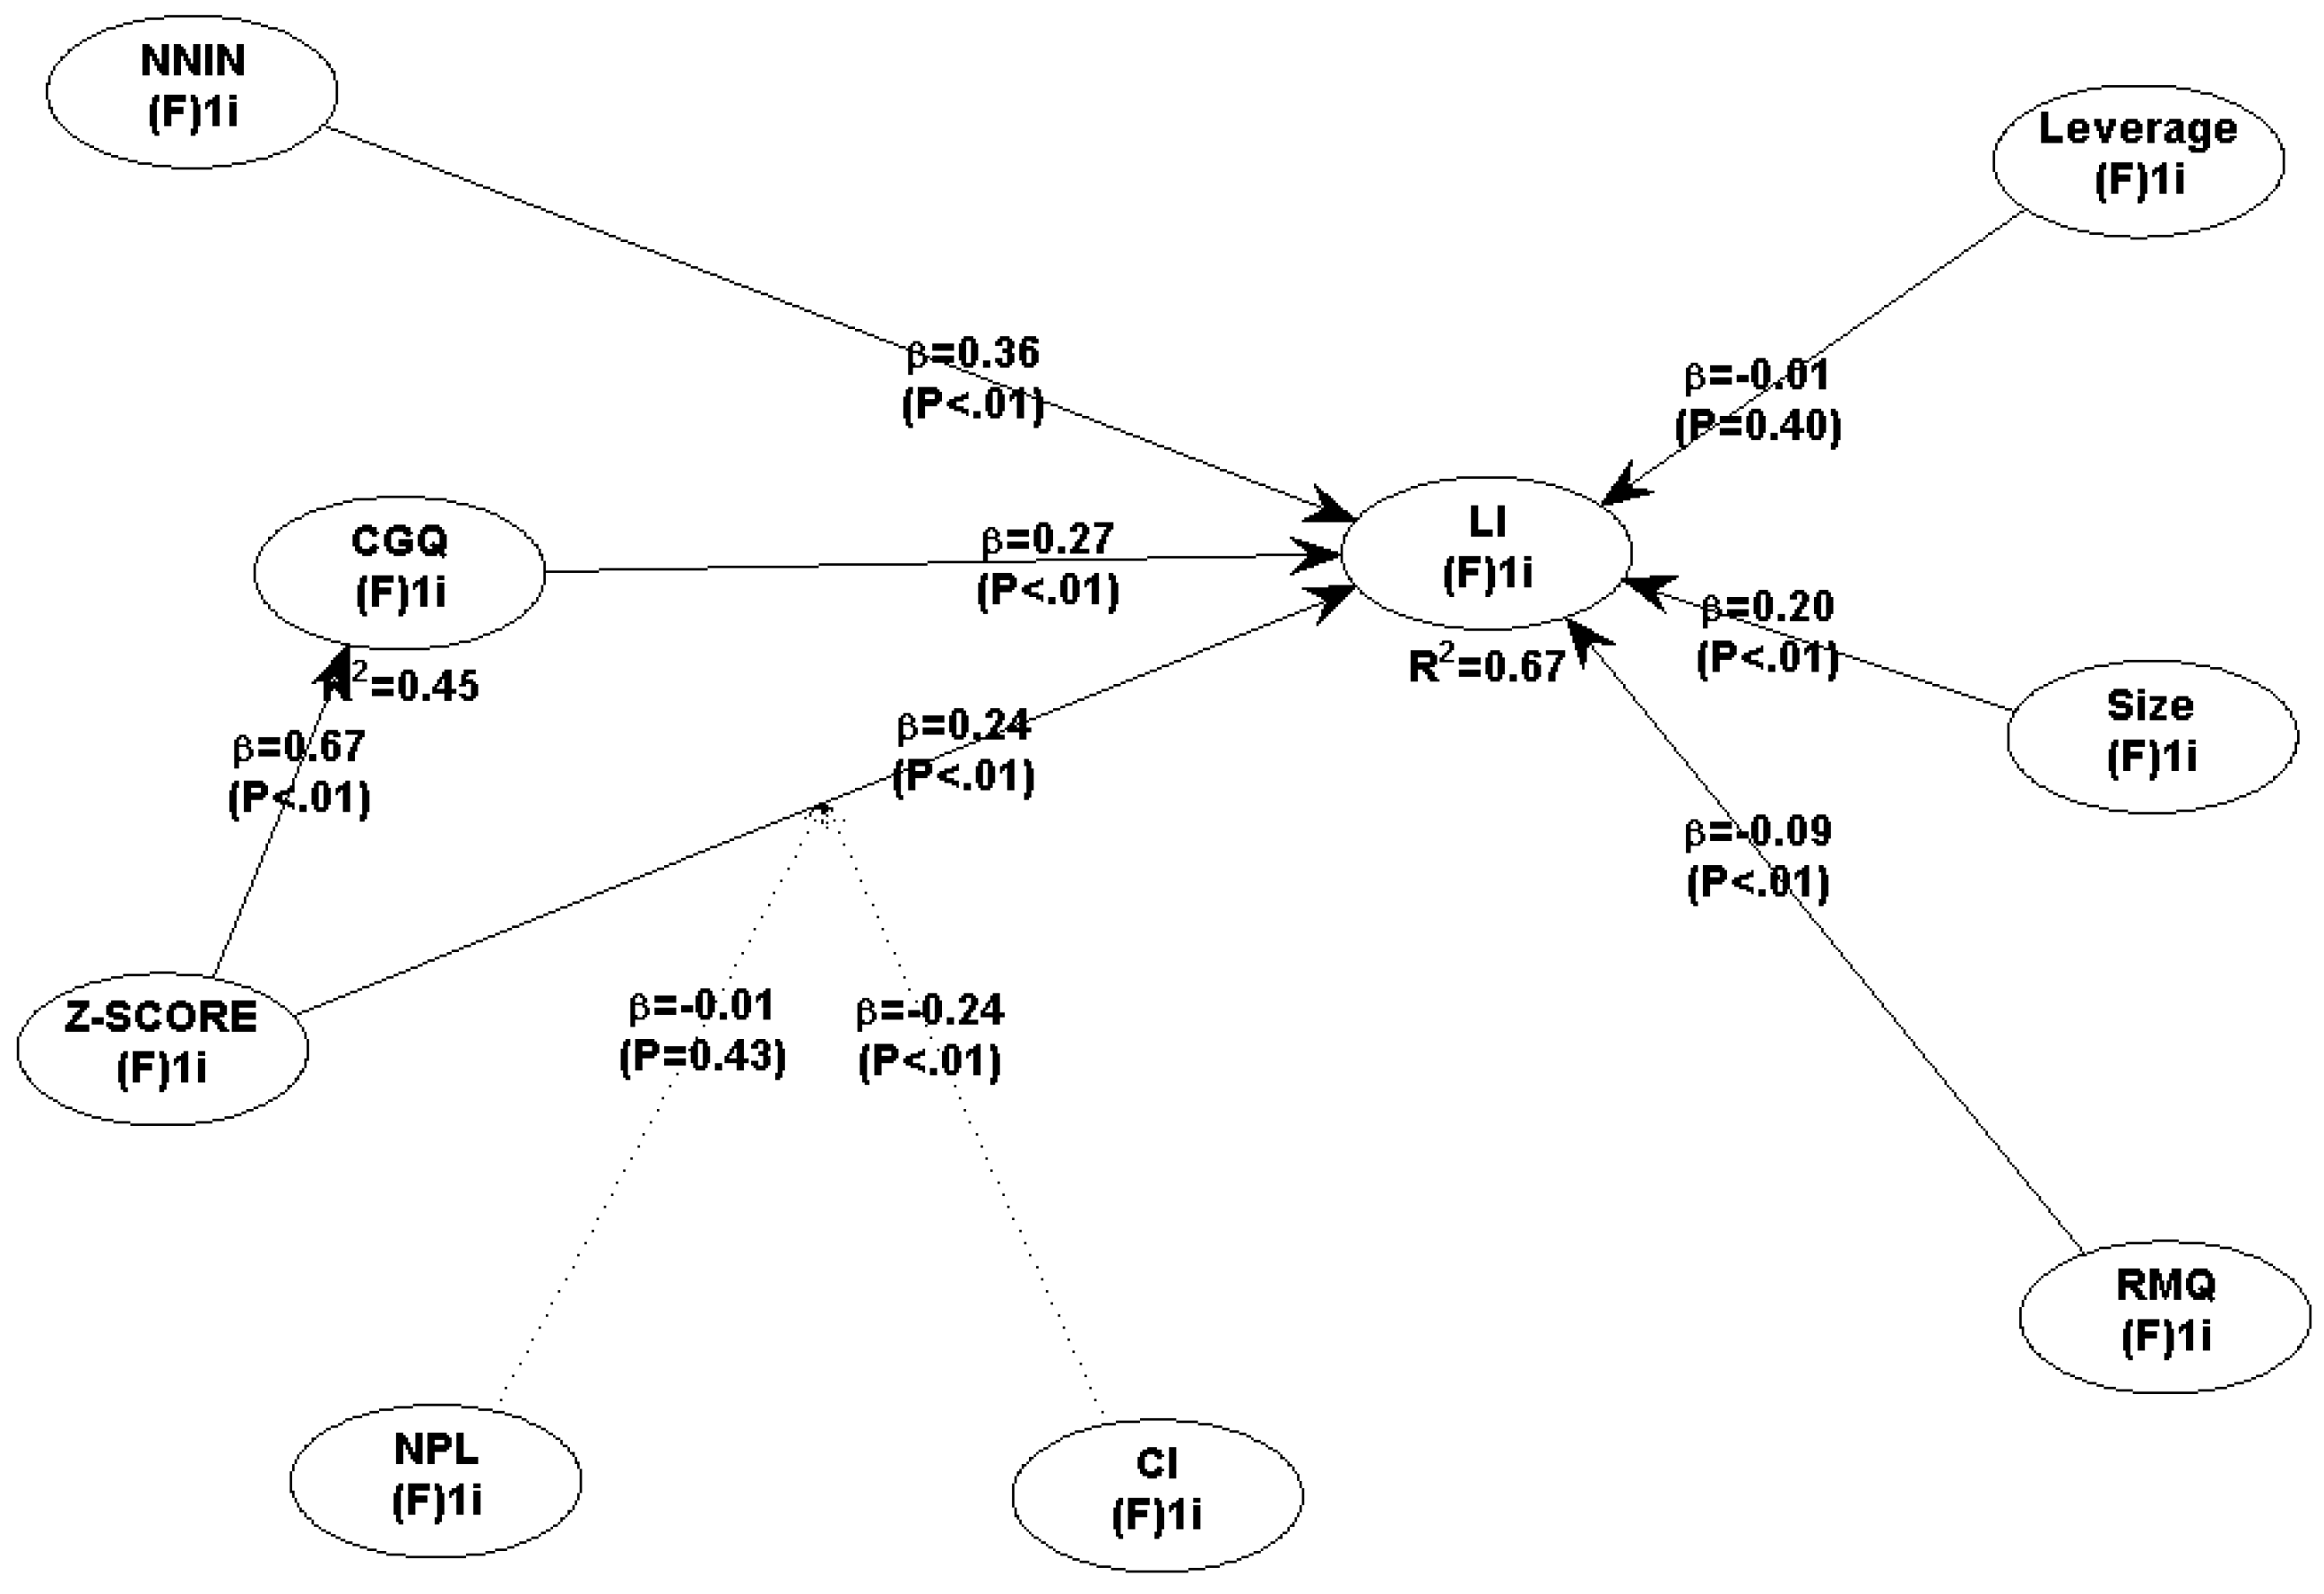
Figure 3.
Structural Model Results: Determinants of Efficiency.
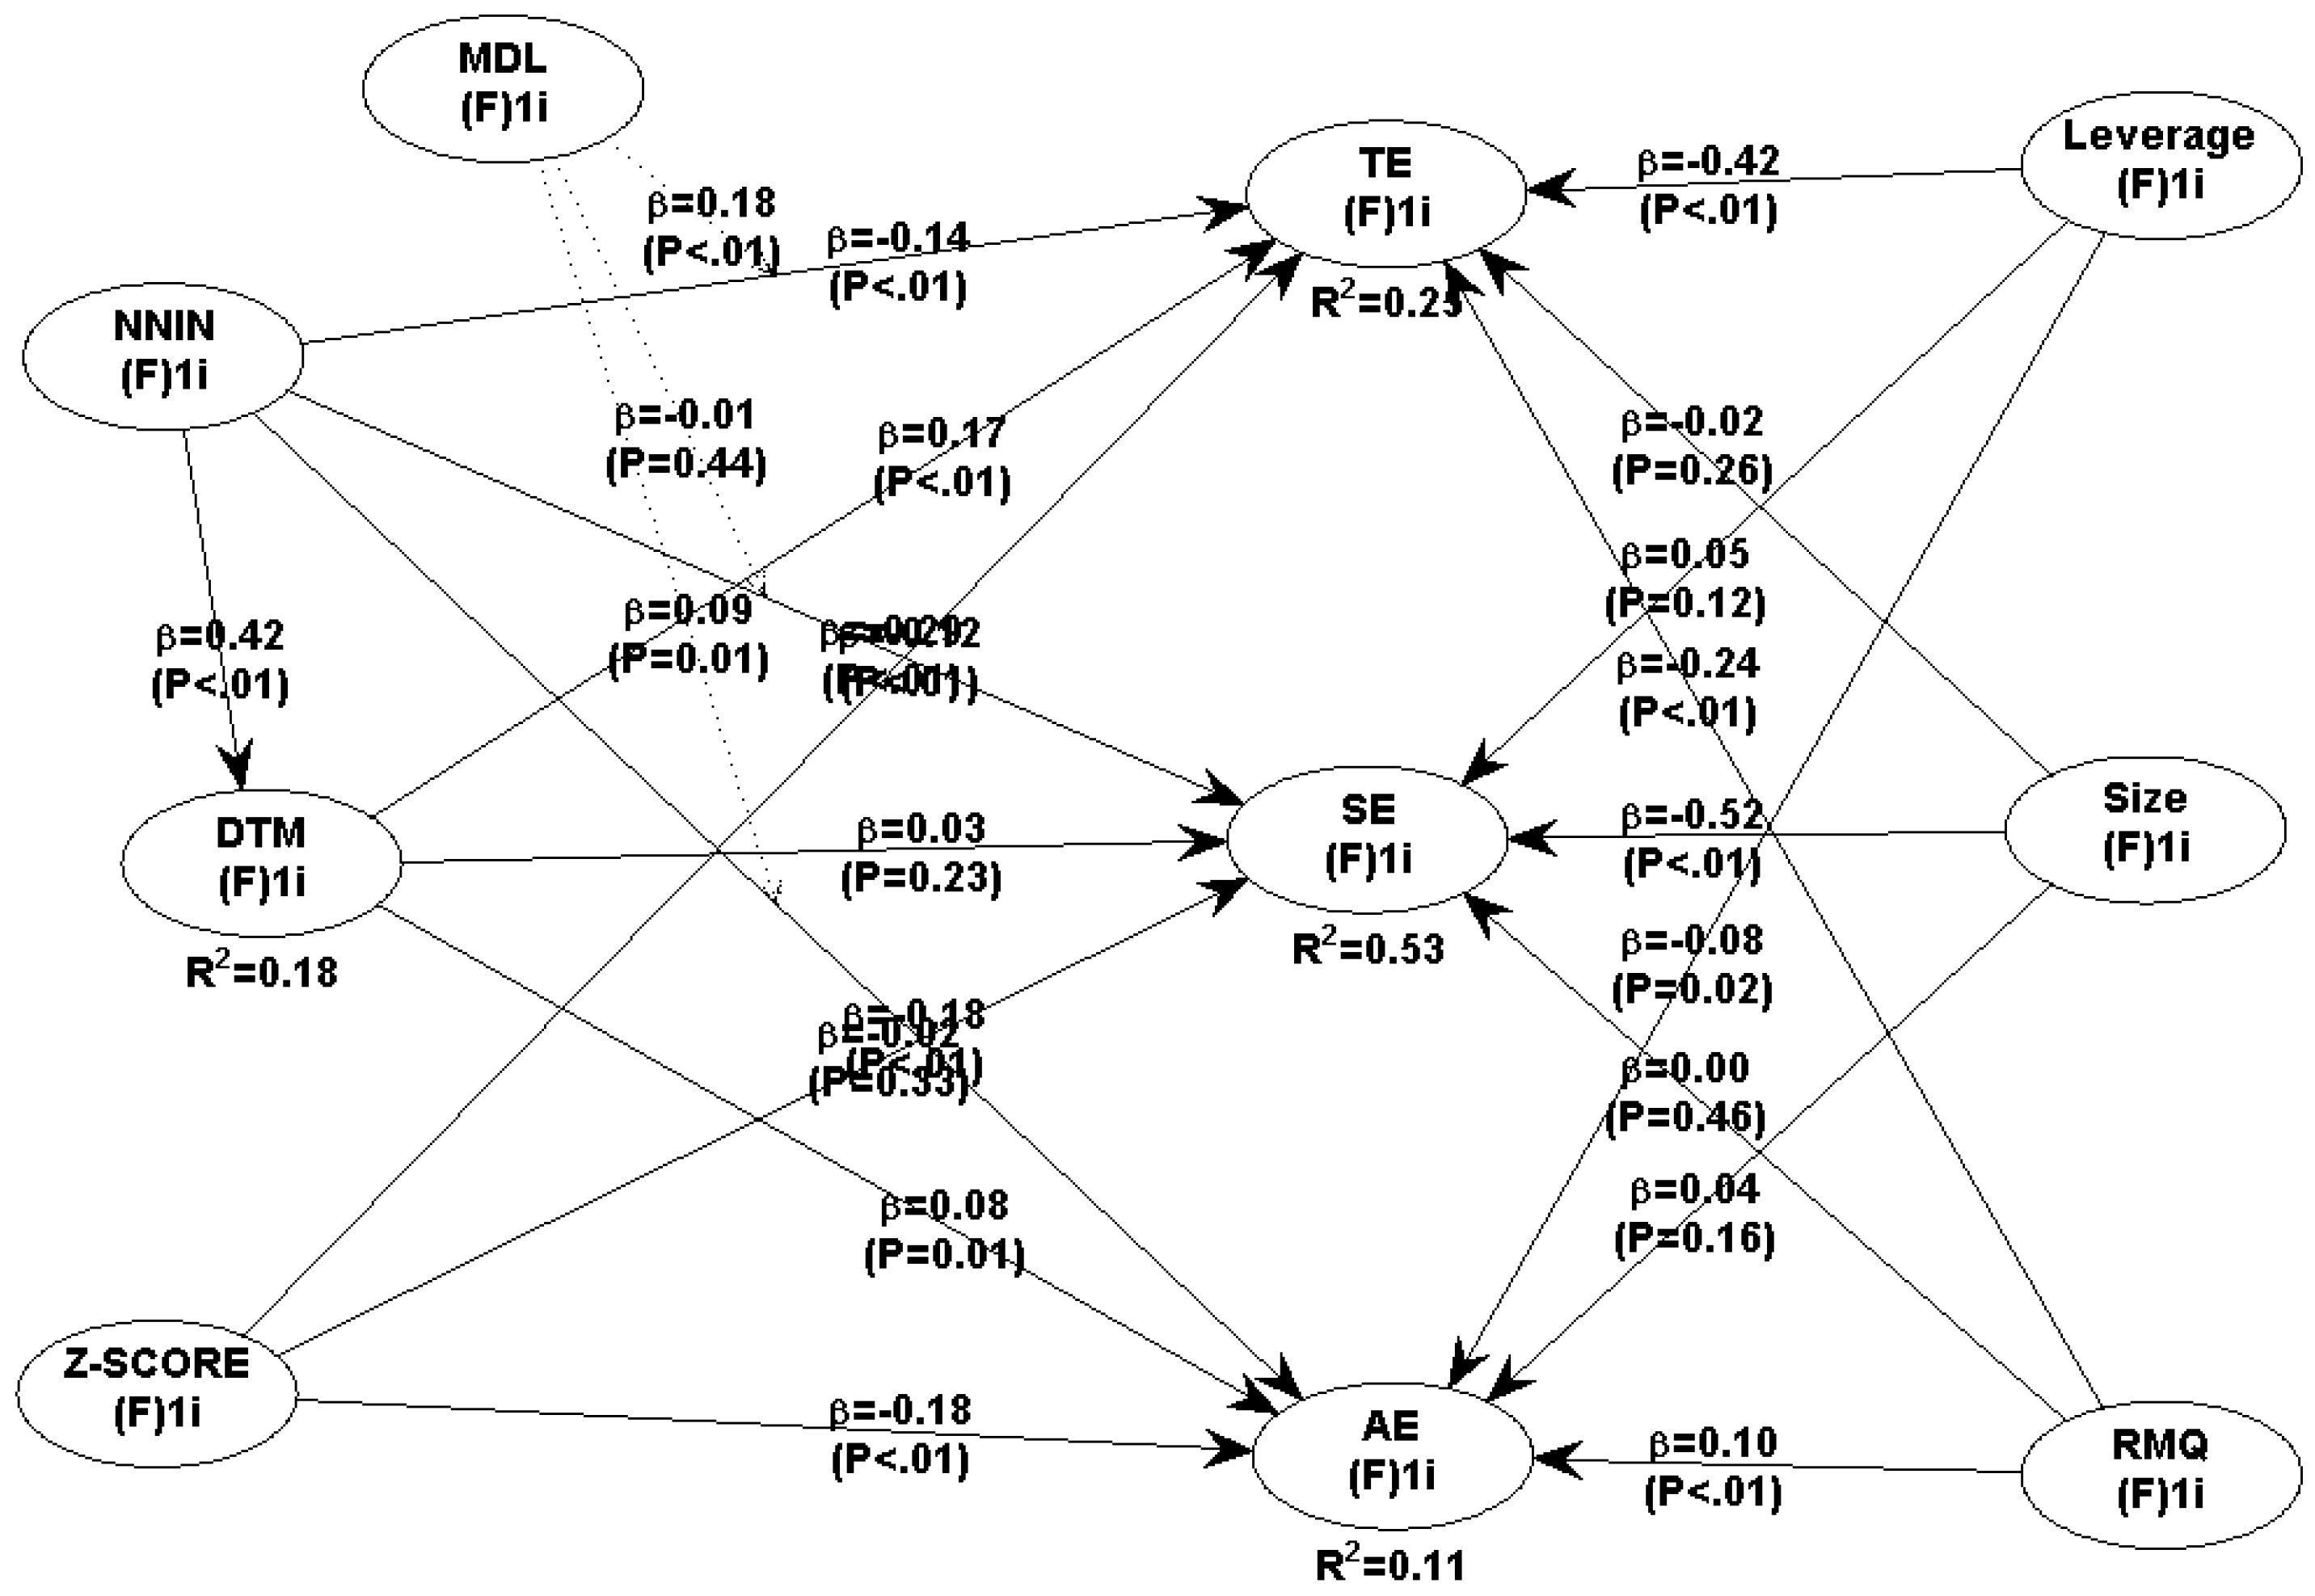
Table 3.
Correlation Matrix of Latent Variables: Market Power Model.
| 1 | 2 | 3 | 4 | 5 | 6 | 7 | 8 | 9 | |
|---|---|---|---|---|---|---|---|---|---|
| 1. NNIN | 1.000 | ||||||||
| 2. Z-Score | 0.471*** | 1.000 | |||||||
| 3. LI | 0.529*** | 0.603*** | 1.000 | ||||||
| 4. CGQ | 0.429*** | 0.663*** | 0.578*** | 1.000 | |||||
| 5. NPL | −0.077** | −0.205*** | −0.040 | −0.450*** | 1.000 | ||||
| 6. CI | −0.154*** | −0.633*** | 0.011 | −0.311*** | 0.113*** | 1.000 | |||
| 7. Leverage | −0.162*** | −0.196*** | −0.181*** | −0.456*** | 0.607*** | 0.049*** | 1.000 | ||
| 8. Size | 0.219*** | 0.146*** | 0.114*** | 0.378*** | −0.479*** | 0.051*** | −0.400*** | 1.000 | |
| 9. RMQ | 0.126*** | 0.287*** | 0.166*** | 0.446*** | −0.397*** | −0.164*** | −0.347*** | 0.245*** | 1.000 |
Note: *p < 0.10; **p < 0.05; ***p < 0.01.
Table 4.
Correlation Matrix of Latent Variables: Multidimensional Efficiency Model.
| 1 | 2 | 3 | 4 | 5 | 6 | 7 | 8 | 9 | 10 | |
|---|---|---|---|---|---|---|---|---|---|---|
| 1. NNIN | 1.000 | |||||||||
| 2. Z-Score | 0.471*** | 1.000 | ||||||||
| 3. Leverage | −0.162*** | −0.196*** | 1.000 | |||||||
| 4. Size | 0.219*** | 0.146*** | −0.400*** | 1.000 | ||||||
| 5. RMQ | 0.126*** | 0.287*** | −0.347*** | 0.245*** | 1.000 | |||||
| 6. TE | −0.086** | −0.092** | −0.271*** | −0.057 | −0.098** | 1.000 | ||||
| 7. SE | −0.588*** | −0.325*** | 0.181*** | −0.295*** | −0.128*** | 0.095** | 1.000 | |||
| 8. AE | −0.117*** | −0.153*** | −0.115*** | −0.025 | 0.046 | 0.303*** | 0.001 | 1.000 | ||
| 9. DTM | 0.385*** | 0.320*** | −0.760*** | 0.545*** | 0.462*** | 0.027 | −0.335*** | 0.069* | 1.000 | |
| 10. MDL | 0.130*** | 0.131*** | −0.210*** | 0.190*** | 0.329*** | 0.237*** | −0.155*** | 0.245*** | 0.296*** | 1.000 |
Note: *p < 0.10; **p < 0.05; ***p < 0.01.
Table 5.
PLS-SEM Model Fit and Measurement Indicators.
| Criterion | Model 1: Market Power |
Model 2: Efficiency | Threshold / Cut-off | Information |
|---|---|---|---|---|
| Model Fit Indices | ||||
| APC | 0.232 (P<0.001) | 0.153 (P<0.001) | P < 0.05 | Significant |
| ARS | 0.561 (P<0.001) | 0.265 (P<0.001) | P < 0.05 | Significant |
| AARS | 0.558 (P<0.001) | 0.259 (P<0.001) | P < 0.05 | Significant |
| AVIF | 1.734 | 1.581 | ≤3.3 (Ideal) | Ideal |
| AFVIF | 2.855 | 1.846 | ≤3.3 (Ideal) | Robust |
| Tenenhaus GoF | 0.749 | 0.515 | ≥0.36 (Large) | Large Fit |
| SPR | 0.889 | 0.864 | ≥0.700, Ideal = 1.000 | Acceptable |
| RSCR | 0.980 | 0.985 | ≥0.900, Ideal = 1.000 | Ideal |
| SSR | 1.000 | 0.864 | ≥0.700 | Acceptable |
| R-Squared (R2) | Kock and Lynn (2012) | |||
| LI | 0.668 | 0.25≤Rs≤0.70 | Moderate | |
| TE | 0.248 | 0.25≤Rs≤0.70 | Weak | |
| SE | 0.526 | 0.25≤Rs≤0.70 | Moderate | |
| AE | 0.109 | 0.25≤Rs≤0.70 | Weak | |
| Adj. R-Squared | Kock and Lynn (2012) | |||
| LI | 0.664 | 0.25≤Rs≤0.70 | Moderate | |
| TE | 0.240 | 0.25≤Rs≤0.70 | Weak | |
| SE | 0.521 | 0.25≤Rs≤0.70 | Moderate | |
| AE | 0.100 | 0.25≤Rs≤0.70 | Weak | |
| Stone-Geisser Q2 | Stone (1974) | |||
| LI | 0.561 | >0 (Relevant) | Predictive Value | |
| TE | 0.224 | >0 (Relevant) | Predictive Value | |
| SE | 0.511 | >0 (Relevant) | Predictive Value | |
| AE | 0.118 | >0 (Relevant) | Predictive Value |
Table 6.
Structural Model Results: Determinants of Market Power.
| Hypothesis | Path Relationship | Coeff (β) | P-Value | Result |
|---|---|---|---|---|
| Direct Effects | ||||
| H1 | Business Model (NNIN) → Market Power (LI) |
0.356 | < 0.001 | Supported |
| H2 | Stability (Z-Score) → Market Power (LI) |
0.243 | < 0.001 | Supported |
| Mediation Effect | ||||
| H5 | Z-Score → Governance (CGQ) → Market Power (LI) | 0.179 | < 0.001 | Supported (Partial) |
| Moderation Effects | ||||
| H6 | NPL × Z-Score → Market Power | −0.007 | 0.425 | Not Supported |
| H7 | Complexity Index (CI) × Z-Score → Market Power (LI) | −0.243 | < 0.001 | Supported |
| Control Variables | ||||
| Bank Size → LI | 0.195 | < 0.001 | Significant (+) | |
| Financial Leverage → LI | −0.010 | 0.399 | Insignificant | |
| RMQ → LI | −0.091 | 0.008 | Significant (−) |
Table 7.
Structural Model Results: Determinants of Efficiency.
| Hypothesis | Path Relationship | Coeff (β) | P-Value | Result |
| Direct Effects | ||||
| H3a | Business Model (NNIN) → TE | −0.142 | < 0.001 | Not Supported |
| H3b | Business Model (NNIN) → SE | −0.285 | < 0.001 | Not Supported |
| H3c | Business Model (NNIN) → AE | −0.181 | < 0.001 | Not Supported |
| H4a | Stability (Z-Score) → TE | −0.123 | < 0.001 | Not Supported |
| H4b | Stability (Z-Score) → SE | −0.016 | 0.333 | Not Supported |
| H4c | Stability (Z-Score) → AE | −0.176 | < 0.001 | Not Supported |
| Mediation Effect | ||||
| H8a | NNIN → DTM → TE | 0.072 | 0.004 | Supported (Partial) |
| H8b | NNIN → DTM → SE | 0.012 | 0.330 | Not Supported |
| H8c | NNIN → DTM → AE | 0.036 | 0.093 | Not Supported |
| Moderation Effects | ||||
| H9a | MDL × NNIN → TE | 0.176 | <0.001 | Supported |
| H9b | MDL × NNIN → SE | −0.006 | 0.440 | Not Supported |
| H9c | MDL × NNIN → AE | 0.088 | 0.011 | Supported |
| Control Variables | ||||
| Bank Size (Log Asset) → TE | −0.024 | 0.265 | Insignificant | |
| Bank Size (Log Asset) → SE | −0.524 | <0.001 | Significant (−) | |
| Bank Size (Log Asset) → AE | 0.039 | 0.157 | Insignificant | |
| Financial Leverage → TE | −0.422 | <0.001 | Significant (−) | |
| Financial Leverage → SE | 0.045 | 0.118 | Insignificant | |
| Financial Leverage → AE | −0.078 | 0.020 | Significant (−) | |
| Risk Mgmt (RMQ) → TE | −0.237 | <0.001 | Significant (−) | |
| Risk Mgmt (RMQ) → SE | 0.004 | 0.462 | Insignificant | |
| Risk Mgmt (RMQ) → AE | 0.101 | 0.004 | Significant (−) |
Table 8.
Multi-Group Analysis Results (ASEAN vs. MENA).
| Hypothesis. | Path Relationship | ASEAN (β) | MENA (β) | Abs. Different (β) |
|---|---|---|---|---|
| Direct Effects | ||||
| H1 | Business Model (NNIN) → LI | 0.227 | 0.304 | 0.076 |
| H2 | Stability (Z-Score) → LI | −0.119 | 0.442 | 0.561** |
| H3a | Business Model (NNIN) → TE | 0.023 | −0.075 | 0.098 |
| H3b | Business Model (NNIN) → SE | −0.243 | 0.174 | 0.417** |
| H3c | Business Model (NNIN) → AE | 0.037 | −0.155 | 0.192** |
| H4a | Stability (Z-Score) → TE | −0.114 | 0.035 | 0.149* |
| H4b | Stability (Z-Score) → SE | −0.064 | 0.087 | 0.152* |
| H4c | Stability (Z-Score) → AE | −0.212 | −0.107 | 0.105 |
| Moderation Effects | ||||
| H6 | NPL × Z-Score → LI | −0.115 | 0.147 | 0.263** |
| H7 | CI × Z-Score → LI | −0.216 | −0.129 | 0.087 |
| H9a | MDL × NNIN → TE | 0.118 | −0.199 | 0.317** |
| H9b | MDL × NNIN → SE | −0.086 | −0.321 | 0.234** |
| H9c | MDL × NNIN → AE | 0.398 | −0.089 | 0.487** |
| Control Variables | ||||
| Bank Size → LI | 0.154 | −0.057 | 0.211** | |
| Financial Leverage → LI | −0.064 | −0.042 | 0.022 | |
| RMQ → LI | 0.098 | 0.105 | 0.007 | |
| Bank Size → TE | 0.151 | −0.130 | 0.281** | |
| Bank Size → SE | −0.748 | −0.495 | 0.253** | |
| Bank Size → AE | 0.224 | −0.015 | 0.239** | |
| Financial Leverage → TE | −0.524 | −0.265 | 0.259** | |
| Financial Leverage → SE | 0.025 | 0.013 | 0.012 | |
| Financial Leverage → AE | −0.057 | −0.027 | 0.030 | |
| RMQ → TE | −0.200 | −0.122 | 0.078 | |
| RMQ → SE | −0.015 | 0.118 | 0.133* | |
| RMQ → AE | 0.123 | 0.097 | 0.026 |
Disclaimer/Publisher’s Note: The statements, opinions and data contained in all publications are solely those of the individual author(s) and contributor(s) and not of MDPI and/or the editor(s). MDPI and/or the editor(s) disclaim responsibility for any injury to people or property resulting from any ideas, methods, instructions or products referred to in the content. |
© 2026 by the authors. Licensee MDPI, Basel, Switzerland. This article is an open access article distributed under the terms and conditions of the Creative Commons Attribution (CC BY) license (http://creativecommons.org/licenses/by/4.0/).
Copyright: This open access article is published under a Creative Commons CC BY 4.0 license, which permit the free download, distribution, and reuse, provided that the author and preprint are cited in any reuse.


