Submitted:
05 January 2026
Posted:
06 January 2026
You are already at the latest version
Abstract
ligocene rocks and fluids of A-1X well were conducted for source rock and fluid characterization and implying the suitable geological sites for CO2 storage from high-salinity water in sandstone reservoirs based on Rock-Eval pyrolysis, vitrinite reflectance measurement, bitumen extraction, hydrocarbon fractionation, gas chromatography, stable carbon isotope, formation water and X-Ray Diffraction analyses. Shale source rocks reveal fairly good potential of hydrocarbon generation. Compositions of gas sample in gas-related zones 1010-1110m are mainly composed of CH4, following C2+, N2, and a little content of CO2 and no noticeable of H2S. Carbon isotopes of oil and gas samples reveal the organic matters mainly derived from sapropelic and little humic sources, entering the mature stage to oil window phases. The formation water is classified as Calcium-Chloride type that contain high concentrations of total dissolved solid, salinity, and K+, Na+ and Cl- cations. This formation water is associated with deep source, and close system that are effective conditions for a large pool with good sealing capacity and not impacted by dissolution of the salt rock around. Most sandstones comprise very high visual porosities including high quartz, plagioclase and calcite minerals that are favorable conditions for subsurface pore space and CO2 injection in over saturated fluids. The popular presence of brittle minerals in the upper part of strongly fractured basement indicates this could be a good sandstone reservoir. The finding is identification of suitable candidate for storing CO2 in the saline aquifer under the active petroleum system with current oil and gas accumulations.
Keywords:
CCUS
; mature field
; mineral
; carbon isotope
; formation water
; Song Hong basin
1. Introduction
To ensure success in exploration and production activities, petroleum companies rely on subsurface data to gain insights that guide operational decisions over the life of their wells. But as the wells near the end of their lives and production slowly down, the wells are subsequently shut and abandoned, and the accompanying subsurface data are set aside. However, these data still hold very high value when it comes to evaluating mature, near-end-of-life wells and fields to determine if they are suitable candidates for carbon capture, utilisation, and storage (CCUS). CO2 storage is a crucial component of the CCUS value chain as permanently storing CO2 is the cornerstone of large-scale emissions reductions. The storage process entails capturing, compressing, and injecting CO2 into a reservoir of porous rock beneath an impermeable layer of caprock, which functions as a seal. The caprock prevents the CO2 from reaching the surface, as do other trapping mechanisms including structural, residual, solubility, and mineral trapping. CO2 is safely stored in geological formations. This is similar to the unexplored state of oil and gas reserves trapped underground for millions of years. If a well has been deemed viable for repurposing, the specific type of reuse must be considered. Generally, there are three ways to repurpose a well during a CO2 storage operation: (i) water extraction during CO2 injection for pressure management; (ii) monitoring of CO2 plume; (iii) CO2 injection [1]. However, the location of the wells where CO2 is injected can impact on CO2 migration. If the migration route is close to the crest, opportunities for residual and solubility trapping are limited. If a well is close to the spill point, the plume probably migrates beneath the spill point. Ideally, the well will be located at a midpoint between the spill point and crest to allow CO2 to migrate towards the crest under buoyancy. Among the available reservoirs for carbon storage, deep saline formations and depleted oil and gas reservoirs offer the largest CO2 storage capacity [2].
Evaluating subsurface data allows us to accurately determine which wells are the best suited for CO2 storage as well as to ensure durable long-term storage. Geochemistry techniques play an important role in providing solutions for site selection such as selecting suitable wells, well integrity by determining geochemical processes in geological structures, assessing potential leakage risks by identifying the existing of shallow gas indication above the candidate reservoirs flow assurance. Therefore, A-1X is a suitable well that selected for assessment of viability of the region for safe and secure carbon storage in the northern Song Hong basin. Subsurface geochemical data were used as a case study in CCS research in the northern Vietnam. This study can be incorporated into the models that support for better characterize the storage capacity, containment security and injection of the site.
1. Geological Settings of Northern Song Hong Basin (SH)
1.1. Tectonic Position in This Area
The study area is mainly located to the South of South China plate. In the southwestern part of the study area is Song Ma Suture Zone, which is the boundary between Indochina and South China plates (Figure 1). Continental part of the study area belongs to the North Vietnam and Song Da terranes; boundary between them is SH styrike-slip fault. The oceanic part belongs to the SH and Northern Tonkin Gulf Basin. The SH basin is formed by strike-slip process of the SH fault. The Northern Tonkin Gulf basin is formed by extension process during the Paleocene-Eocene. The South China and Indochina plates were mainly influenced by extension process that constituted oceanic crust in the Paleozoic period. In the Paleozoic period, closing process that constituted Song Ma Suture Zone occurred. In Mesozoic period, the S-W part of study area belonged to Song Da trough while N-E part belonged to An Chau trough and Tan Mai-Co To uplift block [3].
The Northeastern part of Tonkin Gulf basin has a half graben with maximum depth of approximately 6000 m, which is covered by thick Cenozoic sediment. Therefore, the other wells only drilled into Cenozoic sedimentary formations and did not reach Pre-Tertiary basement, whereas, A-1X well was drilled to basement that was uplifted in this half graben and covered by thin sediments [3].
2.2. Stratigraphy
The stratigraphy column of this well is divided into Pre-Cenozoic basement and clastic sediments that are presented in Figure 2 and Figure 3 as follows:
- (i)
- Pre-Cenozoic basement
The A-1X well was drilled 345m into basement section that mainly comprises metasediments such as quartz-feldspar-mica schist and minor part quart-sericite-chlorite schist.
- (ii)
- Clastic sediments
Oligocene: A-1X penetrated into Dinh Cao formation is 400m thick. The lithologies mainly comprise interbedded claystone, mudstone and sandstone sequences. Calcareous claystone is sub-blocky, soft, light grey and brownish grey. Calcareous siltstone is blocky, light grey, firm, argillaceous matrix, occasionally mixed with sandstone. Sandstone is light grey, commonly transparent, very fine to fine grain, moderately sorted grain, weakly consolidated with siliceous cement and argillaceous matrix, lithic fragments.
Lower-Middle Miocene: this sequence comprises Phong Chau and Phu Cu formations (N11-N12) with the thickness of about 270m. Lithology of Phong Chau formation is mainly claystone interbedded with fine- to very fine-grained, well-sorted sandstones. Phu Cu formation includes conglomerate bedding in the middle part; the lower and upper parts are thin calcareous claystones, siltstones interbedded with fine to coarse grain sandstones.
Upper Miocene-Quarternary: The uppermost stratigraphic sequence comprises Tien Hung, Vinh Bao, Hai Duong and Kien Xuong formation (N13-Q). The thickness of this sequence is about 630m and comprising sandstone, siltstone and claystone in lithology [5].
3. Samples and Methods
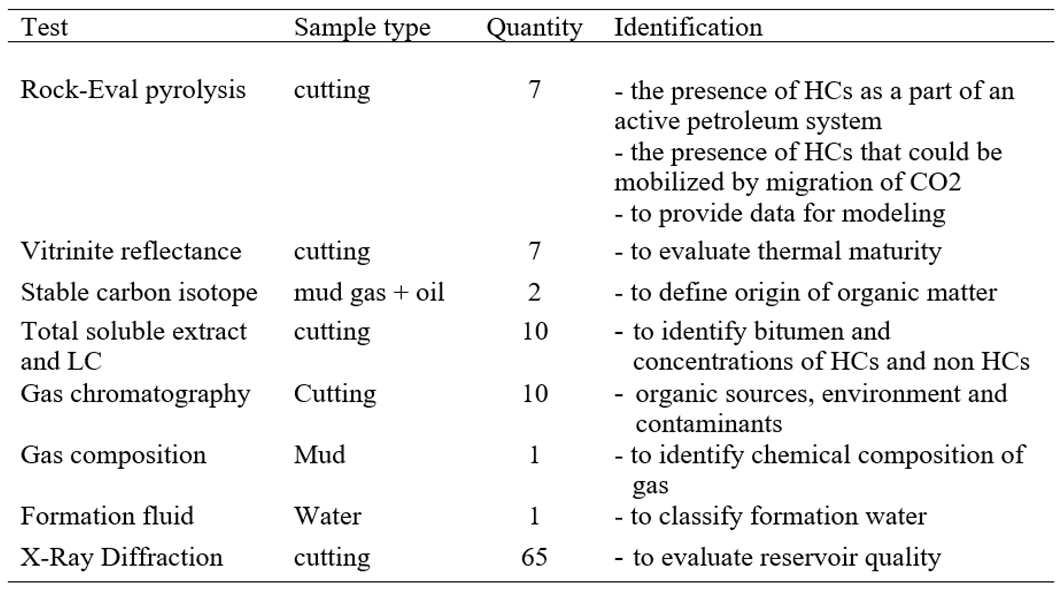
List of quantities of rock, gas, oil and water samples of the A-1X for geochemical and petrological analyses are presented in Table 1.

Table 1.
Quantity of samples and analytical methods.
3.1. Rock-Eval Pyrolysis (RE)
The Rock-Eval 6 instrument provides a rapid source rock analysis, providing potential source rock intervals on which suggest following detailed analyses may be performed. RE is conducted on rock sample, typically about 50-100 mg, which was placed into a crucible that will be moved into the pyrolytic oven. The rock samples are heated in the inert gas of Helium (He) at 300oC and kept isothermal condition up to five minutes. During the time, the evaporative organic materials are recorded by a Flame Ionization Detector (FID) and named as S1 peak. Continuing the isothermal heating, rock samples are still kept in the linearly increasing thermal condition from 300 to 650oC at the rate of 25oC/1 minute, and the S2 peak was recorded. The temperature Tmax (oC) is defined at the maximum of peak S2 and used as the thermal maturity parameter. An infrared cells (IR) detects amount of CO2 (mgCO2/g original rock) from cracking kerogen and named as S3 peak. This CO2 content is generated during the progress of isothermal heating steps and setting up to 400oC. CO2 which released between 400 and 650oC is measured by the decomposion of carbonate minerals through heating. Pyrolysis mineral carbon or type of kerogen is determined based on CO and CO2 produced during pyrolysis and oxidation state. Total organic carbon (TOC, wt.%) is calculated from the quantity of the pyrolysis organic carbon [6].
3.2. Bitumen Extraction and C15+ Fractionations
Soluble organic matter in a rock can be derived from the organic matter deposited with the rock or from the introduction of non-indigenous migrated hydrocarbons. It is important to know how much soluble organic matter is present for evaluating oil generation potential of source rocks. The amount of indigenous soluble organic matter reflects the total organic matter of source rock, types of organic matter and thermal history.
The fraction of organic matter that is soluble in organic solutes is extracted from about 10-20 grams of powdered rock samples by Soxhlett extraction for 24 hours with dichloromethane and methanol solvents. The solvents are evaporated by rotary evaporation and after transfer of the liquid extract into small vials, drying by air, then obtaining mass of extractable organic matter (EOM). The extract mass is separated into four hydrocarbon groups using liquid chromatography column. The stationary phase in this column is silica gel that is activated for 1 hour at 150oC. Three fractions including aliphatic, aromatic and NSO components are eluted with dichloromethane, n-pentane and methanol, respectively. The asphaltene fraction is not dissolved in these solvents and still remain on the column. The mass of each fraction is determined by weight percent [7].
3.3. Gas Chromatography (GC) for C15+ Saturated Hydrocarbons
This test was performed on gas chromatography instrument GC-2010. The saturated hydrocarbon fraction from liquid chromatography is obtained for gas chromatography analysis before it is evaporated to dryness. This analysis performed for C15+ saturated hydrocarbons whether petroleum-like hydrocarbons are present in a rock sample. A high resolution glass capillary column is used to separate the hydrocarbon compositions. The temperature-programmed analysis is performed on a gas chromatography that equipped with a flame ionization detector (FID). Saturated hydrocarbon distribution provides significant information for oil-to-source rock correlation. The percentage composition of n-paraffins, isoprenoids and the ratios of pristane/phytane, pristane/nC17, phytane/nC18 and Carbon Productivity Index (CPI) are calculated from a gas chromatogram for better understanding of organic matter sources, thermal maturity, and depositional environment [7].
3.3.1. Gas Composition
This test was performed on temperature programmed gas chromatography instrument GC HP-6890 that equipped with thermal column detector (TCD) following GPA standard 2286-14. This test is used to identify the chemical compositions of natural gas and similar gaseous mixtures that precise physical property data of the hexanes and heavier fractions are required. The procedure is applicable for mixtures which may contain components of N2, CO2, and/or hydrocarbon compounds C1-C14. Components to be determined in a gaseous sample are physically separated by GC and compared to calibration data obtained under identical operating conditions on a mixtures of known composition. Fixed volumes of sample in the gaseous phases are isolated in suitable sample inlet valve and each volume will be injected into a chromatographic system. The chromatograms are interpreted by comparing the areas of the component peaks obtained from the unknown sample with corresponding areas obtained from an analysis of a selected reference standard on the computer. The analysis is used to calculate the mole % of each component using the procedures of allocation and/or bridging [7].
3.3.2. Oil Stable Carbon Isotope
The ratio of 12C and 13C stable carbon isotopes in sediment and oil sample is primarily used as a correlation tool for oil-oil and source-oil studies. The carbon isotope ratio is generally determined on the C10+ saturated hydrocarbon fraction. Carbon isotopic compositions of gas components are done by conventional off-line methods consisting of chromatographic separation followed by combustion and dual-inlet isotope ratio mass spectrometry. These analyses can be done by compound specific analysis GC-C-IRMS [8]. The ratio of 12C and 13C is determined in parts per thousand (‰) and δΔ13C values can be determined for all C1 to C5 and CO2 as the equation: δΔ13C = 1000*[(13C/12Csample – 13C/12Creference)]/(13C/12Creference) [9]
3.4. Water Sampling and Testing
Physical properties and inorganic constituents are identified from the analytical results of formation water samples that taken from the flow line, wellhead, or at the unstable species. The samples are then tested at the laboratory following the ISO standards such as ISO/IEC 17025:2005 and ISO 9001:2008. The sample is firstly filtered through a standard glass fiber filter 0.45µm to eliminate the suspended solids and this step is repeated until obtaining clean sample that stored in PET bottle 500ml at the room temperature (20-25oC).
One water sample of the A-1X well was performed analyses such as specific conductivity and resistivity, specific gravity, viscosity, salinity, pH, cations and anions to provide solutions for production and reservoir management, i.e. evaluating the contamination and identifying source of the produce water to monitor and optimize production performance based on interaction between rock and water for predicting the connate and aquifer formation water, supporting for flow assurance, scale control and water injection, supporting for corrosion, monitoring environment [7].
4. Results and Discussion
A geochemical characterization of rock, gas and fluid samples of the A-1X well provides preliminary information for basin resources mapping, geological information on the source of any organic matter, geochemical changes within formations during CO2 migration. The analytical results were used for main purposes as follows:
- (i)
- Evaluating the composition of 01 gas and 01 oil samples that may be supplied for the small scale demonstration injection in the future;
- (ii)
- Evaluating the composition of 16 drilling mud samples. The chemistry of the samples will be used to understand degree of contamination by drilling mud of other fluid samples and related data;
- (iii)
- Basin resource management to determine if there is any evidence for in situ or migrated oil through the proposed CO2 storage reservoir or surrounding strata;
- (iv)
- Obtaining baseline and regionally significant geochemical data for integration with related current and future studies. This includes an evaluation of the composition of 01 formation water sample;
- (v)
- Evaluating the potential of the reservoir in contact with CO2 based on results from cutting samples in Oligocene and basement.
4.1. Characteristics of Source Rocks
According to wireline logging data of A-1X well, the lithofacies of the sedimentary rocks typically comprises interlayers of calcareous shales with sandstones, siltstones, and lenses in the Oligocene formation (950-1386 m). The basement (1386-1725 m) comprises alteration of lithologies from high brittle minerals of carbonate rock in the upper part and metamorphic rocks in the lower part. Seven Oligocene shales in the interval 1250-1386 m were selected for screening analyses such as Rock-Eval and vitrinite reflectivity, whereas nine shale samples in the shallow depths of 980-1175 m were conducted for detail analyses such as bitumen extraction and gas chromatography (980-1175 m), gas chromatography-mass spectrometry (1125-1145 m). Besides, some samples in the basement in the interval 1386-1725m were selected for additional Rock-Eval test, however, only three samples at the depths of 1450-1535 m contain minor total organic matter contents of less than 0.5%. Therefore, they were not considered as effective source rocks.
The calcareous shales contain poor to fair total organic carbon contents that mainly originated from type II and some type III kerogens with TOC ranging from 0.27-0.73 wt.% and HI varying between 275-436 mg HC/g TOC, respectively. Although Tmax values of these samples of lower than 400oC are not used for thermal maturity assessment, but this could be implied that some free hydrocarbons have probably been generated but not expelled yet. The very limited optical vitrinite reflectance values are due to the absence of vitrinite particles in these samples, However, vitrinite reflectivity values of shale samples in the interval 1125-1145 m were calculated from biomarker parameters in aromatic fraction ranging from 0.63-0.94 % indicate that these source rocks are within the mature and oil window phases. In addition, Productivity Index (PI) values varying between 0.08-0.42 indicate that the organic matters entered the mature stage and reached peak of hydrocarbon generation phase. Therefore, it is implied that oil and gas found in this well have been generated from deep Oligocene shale source rocks below 1125 m and within oil window or higher mature stage (Table 2, Figure 4).
Table 2.
Rock-Eval pyrolysis parameters.
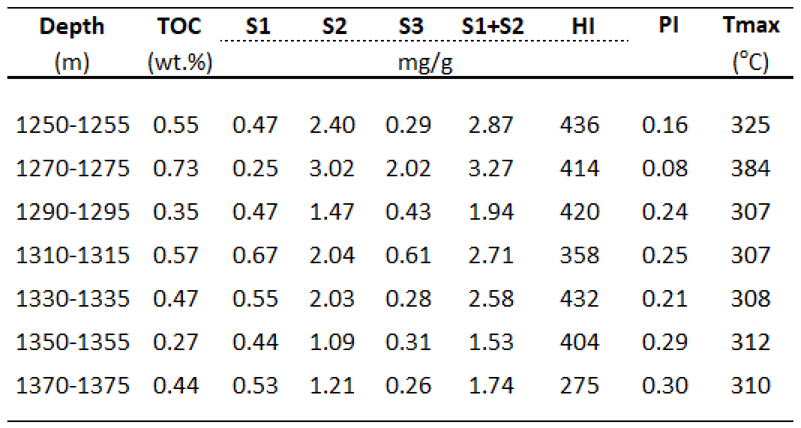 |
TOC=Total Organic Carbon; S1, S2, S3= Free HC, HC generation potential, CO2 content released from cracking kerogen; HI (Hydrogen Index) = S2/TOC; PI (Productivity Index) = S1/(S1+S2).
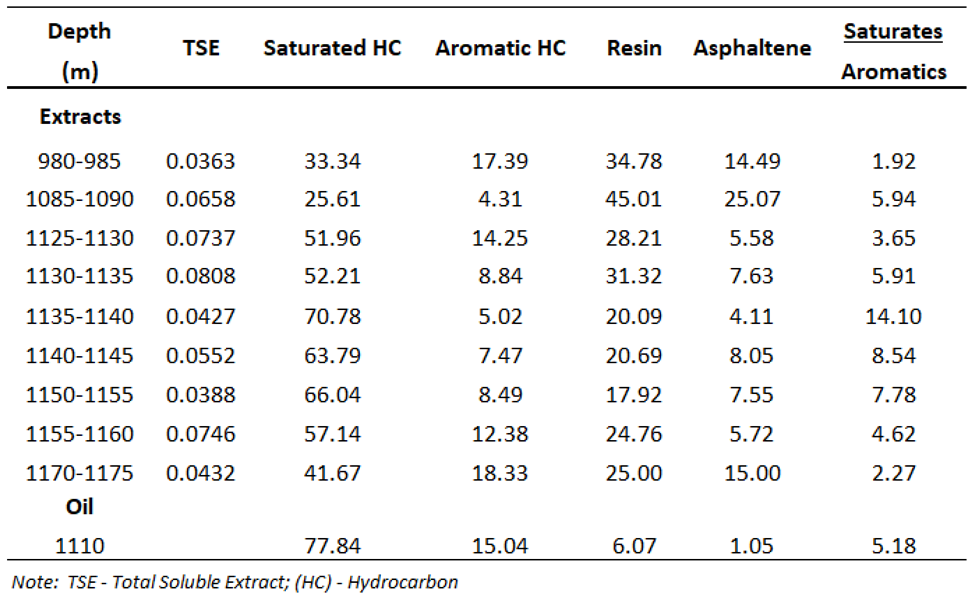
Chemical composition of extract yields in hydrocarbon-related zones (980-1175m) provides information on the presence of oil shows during drilling progress and estimating commercial quantities of hydrocarbons. The shale samples contain poor to moderate amounts of extract yields ranging from 363-808 ppm. The separation compositions of C15+ fraction from the extract yields show the predominance of saturated hydrocarbons (41.67-77.84%), following non hydrocarbon compounds (24.20-70.08 %) and aromatic hydrocarbons (4.31-18.33 %), with an exception of two samples at the shallow depths of 980-1090 m comprise low contents of saturated hydrocarbon (25.61-33.34 %) and high contents of non-hydrocarbons (49.27-70.08 %). Chemical composition of oil sample at 1110m is relatively similar to the extract yields, indicating the existence of active shale source rocks in the petroleum system. Although identifying sources of organic matter and thermal maturity may not benefit to an overview of A-1X for CCS purposes, but it benefits to define if these source rocks deposited in deep enough to becoming effective source rocks that aid in the understanding of the burial history, complement the vitrinite reflectance data and basin modeling later in this region.
Distribution of hydrocarbons on gas chromatograms of all cuttings in the interval 980-1175m shows the dominance of isoprenoids and n-alkanes from nC13 to nC35 with a hump between nC20 to nC25 and the highest peak at nC22 (Figure 4, Figure 5c and Figure 5d). This indicates the extract yields contain typical compounds of organic matters that could be derived from in-situ hydrocarbons of terrestrial entities. However, it is difficult to quantify this source due to the contamination of drilling fluid. The distribution of n-alkanes on gas chromatograms of the extracts and drilling fluids show the EOM contribution is not only from straight bond hydrocarbons such as n-alkanes but also from polar materials. This can be seen on the chromatograms of the drilling fluid extract from the mud filtrate in interval 1110-1140m where some materials coming from the unresolved complex mixture. This is recorded under the “hump” of the nC20 to nC25 alkanes that possibly impact on the amount of drilling fluid invasion. This is labeled on Figure 5b and more obvious in the drilling mud chromatograms on Figure 5c and Figure 5d. Moreover, the evaluation of EOM source is more difficult if the drilling mud sample has compounds that co-elutes with pristane, phytane and n-alkanes peaks in the range from nC16 to nC20. Thus, estimation of hydrocarbons or maturity levels cannot be calculated by standard methods for identifying in situ or migrated hydrocarbons. Distribution of carbon number in C15+ saturated fraction of all samples illustrated in Figure 5 and several gas chromatograms of the extracts from rock, drilling mud and oil samples presented in Figure 6.
Table 3.
Total soluble extracts and liquid chromatographic separation of chemical compositions of C15+ fraction (wt.%).
Table 3.
Total soluble extracts and liquid chromatographic separation of chemical compositions of C15+ fraction (wt.%).
4.3. Reservoir Properties
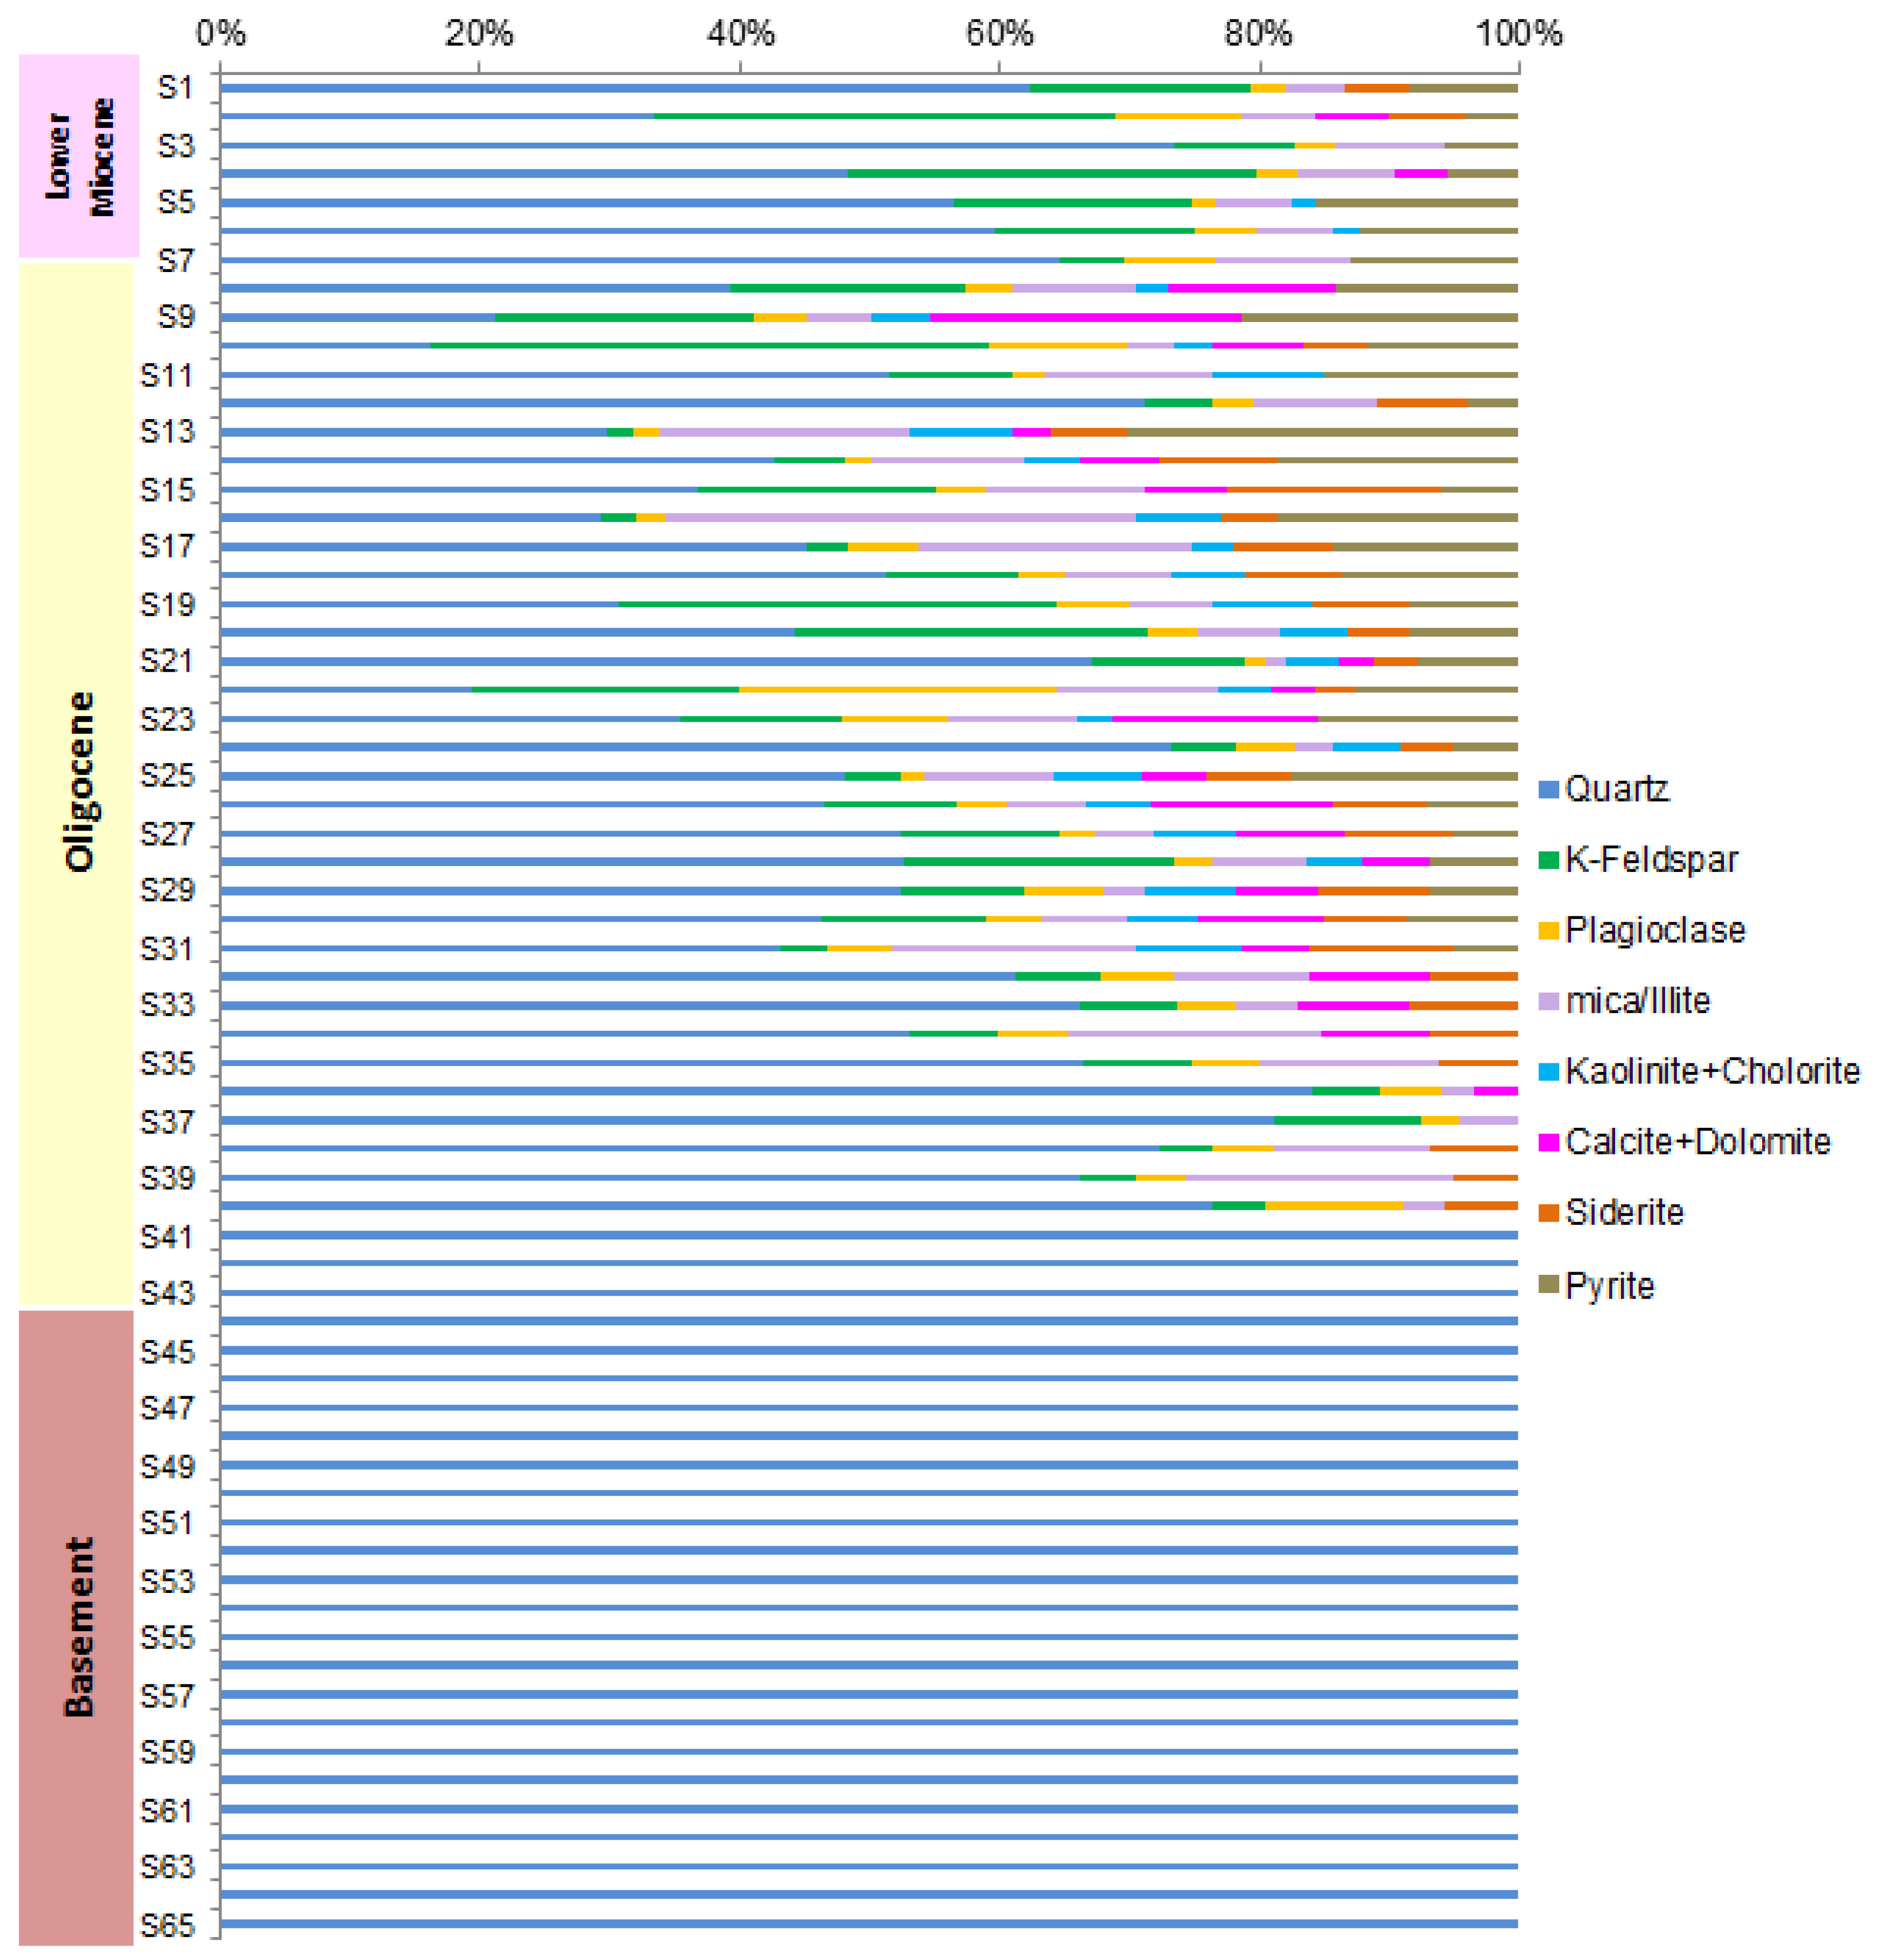
Cutting samples were selected for semi quantitative bulk mineralogical and clay compositions in the intervals 910-1724 m. High calcite contents in Lower Miocene (910-935 m) ranging from 22.9-41.0 % and upper part of Oligocene (940-1095 m) varying between 24.8-54.6 % indicate that the rock-forming minerals are highly replaced by calcite. In addition, high calcite contents (20.6 and 49.1 %) are also presented in below and above oil-water contact in the interval 1100-1115m. Subsurface pore space in the depth range where CO2 injection will be targeted contains microbial populations that accelerate the growth of carbonate minerals in oversaturated fluids [10]. Therefore, some organic molecules accelerate calcite growth [11,12]. Visual porosities of these samples estimated from petrographic data with additional well logging data highlighted four sand zones in Oligocene that are identified as excellent quality of sand reservoirs with high porosities ranging from 25 to 30 % and mineral compositions mainly consist of significant contents of brittle minerals such as quartz, feldspar, plagioclase and calcite (18.1-90.5 %), following ductile minerals (2-25 %) in almost samples (Figure 8). Clay minerals comprise highest illite mineral, following kaolinite and chlorite, so-called illite-type. The dominance of brittle minerals in these sands is a favorable condition for the migration pathway of hydrocarbons through pore space and fractures. In addition, high contents of quartz, plagioclase, feldspar and calcite (41.82.2 %) and clay minerals (15.7-56.5 %) in fracture basement show a favorable condition to become likely a high-quality reservoir (Figure 8). However, basement reservoir is not effectively developed below 1500 m because calcite composition dramatically increases in metamorphic rock, therefore, rock-forming minerals highly replaced by calcite (Figure 7).
Figure 7.
Basement of A-1X well [3].
Figure 7.
Basement of A-1X well [3].
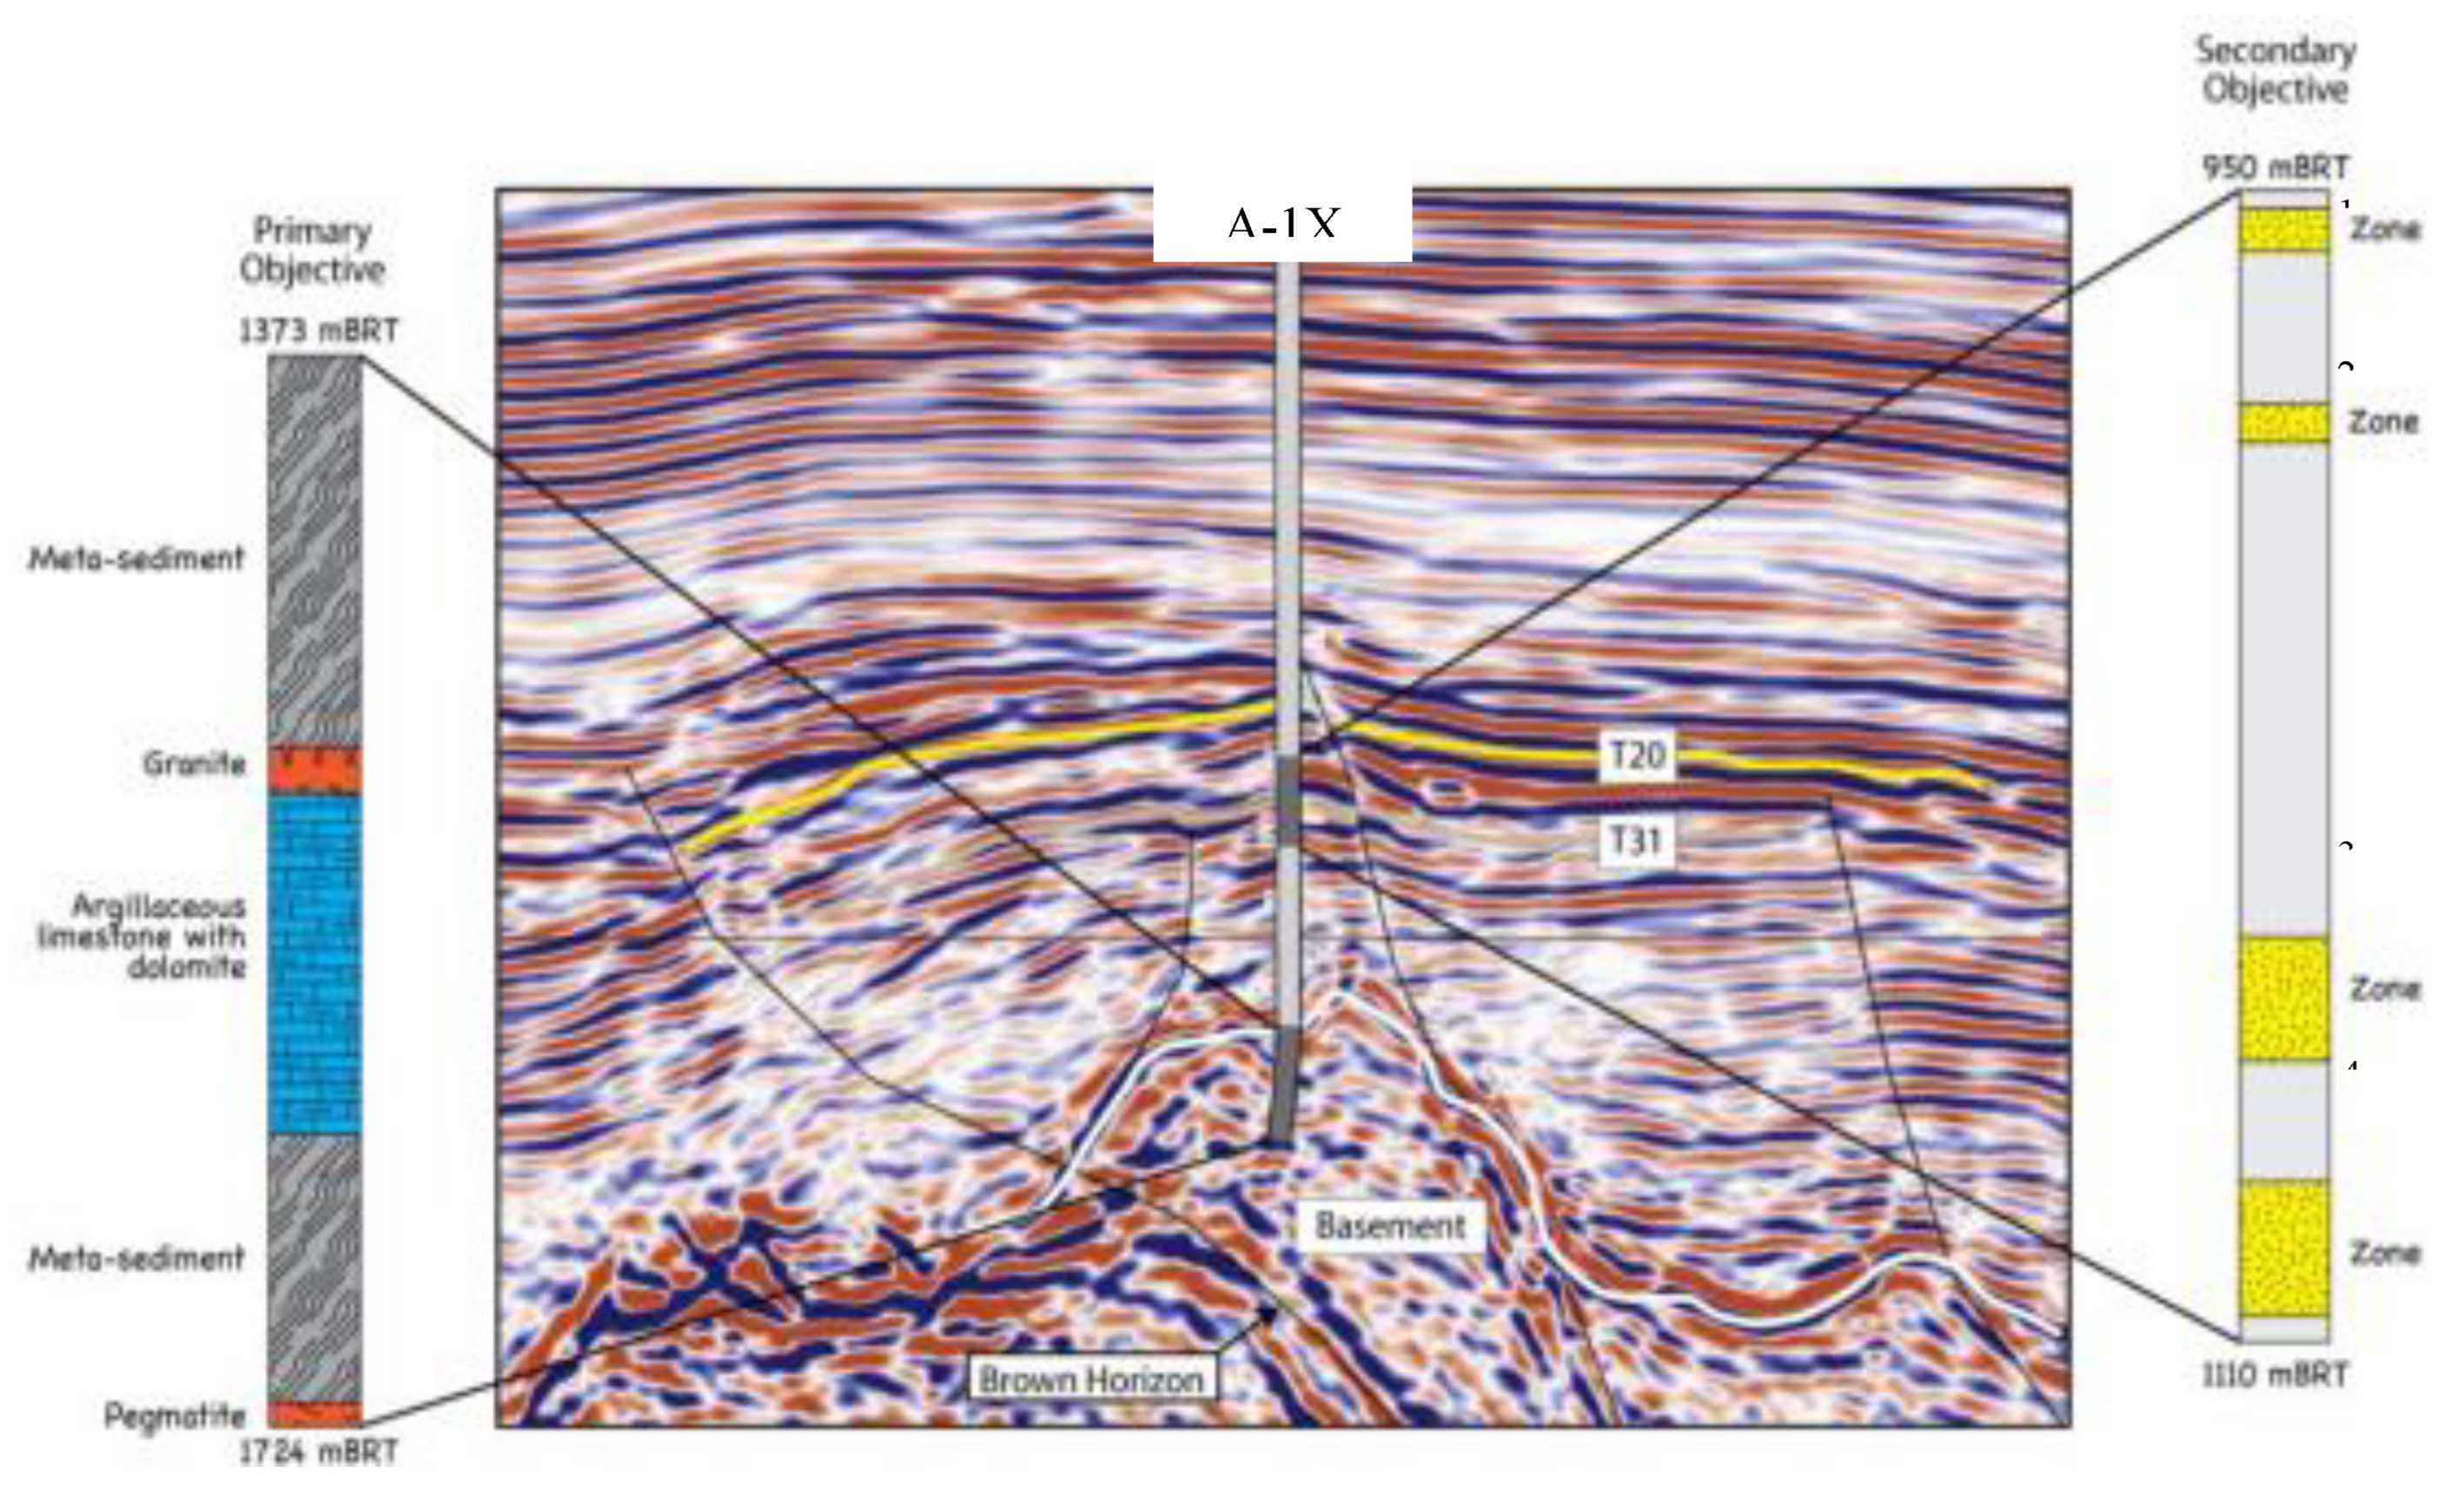
Figure 8.
Mineral compositions.
4.4. Fluid Characterization
4.4.1. Gas Compositions and Stable Carbon Isotope
Gas analysis provides chemical data that can be used to infer geological information about the sample taken or their provenance and the impact of that information on the northern SH basin project in the ongoing evaluation of the area as a potential carbon storage site. Besides, the benefit of obtaining the isotopic data for a typical CCS project would be to characterize any potential contaminants and their overall contribution that might impact on injectivity, reactivity with the storage interval, mobility of some of these components outside of the storage container.
The potential gas sources for the northern SH basin hub likely come from the high CO2 fields in the central and southern SH basin. Therefore, understanding the detailed chemistry of the gas supply is important for site characterization, as various incidental components, which may be regarded as contaminants, can impact in a number of ways, for example non-condensable versus condensable or reactive versus conservative species in terms of chemical reactivity. Therefore, the presence of certain contaminants may impact on storage capacity, injection and containment security such as: (i) non-condensable gas is less easily compressed, using more pore space. Measuring the amount of non-condensable gas in a gas stream to be sequestered can be used to model the expected storage capacity for a given location. The gas typically contains O2, Ar and N2; (ii) chemical reactions between the in situ rock, formation fluids and contaminants have the potential to result in scaling of the injector, may result in changes in pH and mineral reactions beyond the injector and mobilization of cations/anions [13]; (iii) well bore integrity may be impacted on changes in pH, remobilization, or reactions with contaminants and in situ materials.
According to well logging data, gas-bearing zones were recorded in sandstones at 1017 m, 1081.6 m and 1086 m. One mud gas sample was taken at the depth of 1086 m for testing possible gas in the sand reservoir. This sample was successfully completed in one run at the pressures of 1400-1550 psi. The gas mainly composes CH4 (84.36%), following C2H6 (6.24%), C3H8 (2.08%), little contents of C4-C6, minor contents of N2 (4.23%) and CO2 (0.23%) with no noticeable amount of H2S. Depending on the estimation of thermal maturity from biomarker parameter of aromatic hydrocarbon fraction, shale source rocks in the interval 1125-1145 m entered mature stage and reached oil window with calculated vitrinite reflectance values ranging from 0.65 to 0.94 %. In addition, high geothermal gradient of 3.3oC/100m in this area is a favorable condition for larger reservoir accumulations than those in low gradient areas because of the average porosity is greater [14].
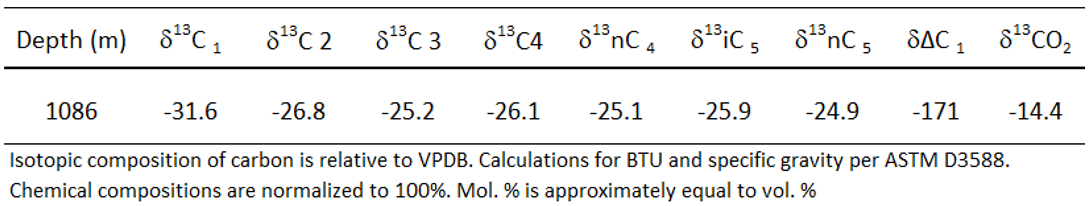
Carbon isotopic composition is a useful marker for monitoring and verification onwards as the measured value that is quite unique in comparison with the natural sources of CO2. Carbon isotopic composition of this gas sample comprise δ13C1=-31.6 ± 0.2 ‰ and δ13CCO2= -14.4‰ (Table 4 and Table 5). Therefore, this gas is formed from thermal chemical origin as a dry gas with no pollutant of CO2, H2S and a little N2 in trap, giving a good capacity for carbon storage. Highest concentration of δ13C in range from CH4 to C5 indicates this gas comes from continental source material and isotopically distinct from any CO2 derived from the maturation of organic matters (with a range of δ13C -12 to -15‰) as seen in the CO2 from the depleted natural gas field storage site [2]. This signature is also quite different from surface biological CO2 isotopic signatures which are approximately δ13C=-20‰.
Table 4.
Gas composition.
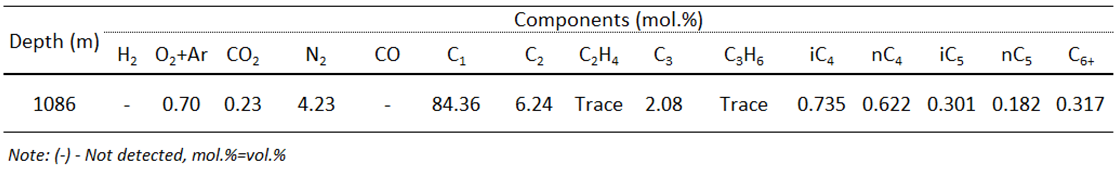
Table 5.
Isotopic compositions of CO2 and hydrocarbons in mud gas sample.
4.4.2. Oil Properties and Carbon Isotope
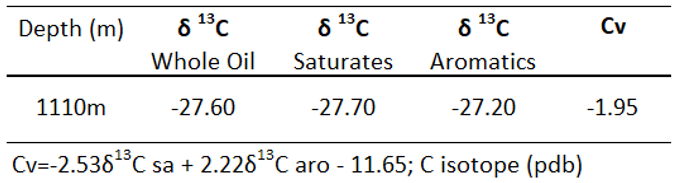
Chemical compositions of one oil that taken at 1110 m from mud sample comprise 77.84 % saturated HC, 15.04 % aromatic HC, 7.12 % resin and asphaltene. This oil is defined as a light oil with 40.73oAPI, low waxy content of 10.17 %, trace of asphaltene, and nearly no noticeable content of sulfur. The carbon isotopes from the whole oil, saturated and aromatic hydrocarbons ranging from 27.6-27.2 ‰ calculated canonical variable Cv=-1.95 that suggest non-marine algae contributing to sources of organic matters (Table 6).
Table 6.
Carbon isotopes of oil sample.
4.4.3. Chemical Composition of Formation Water
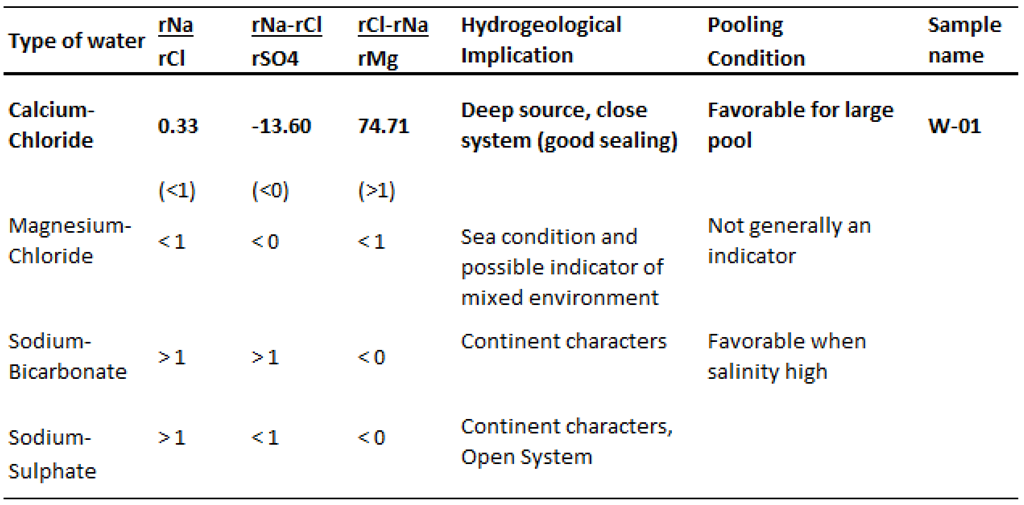
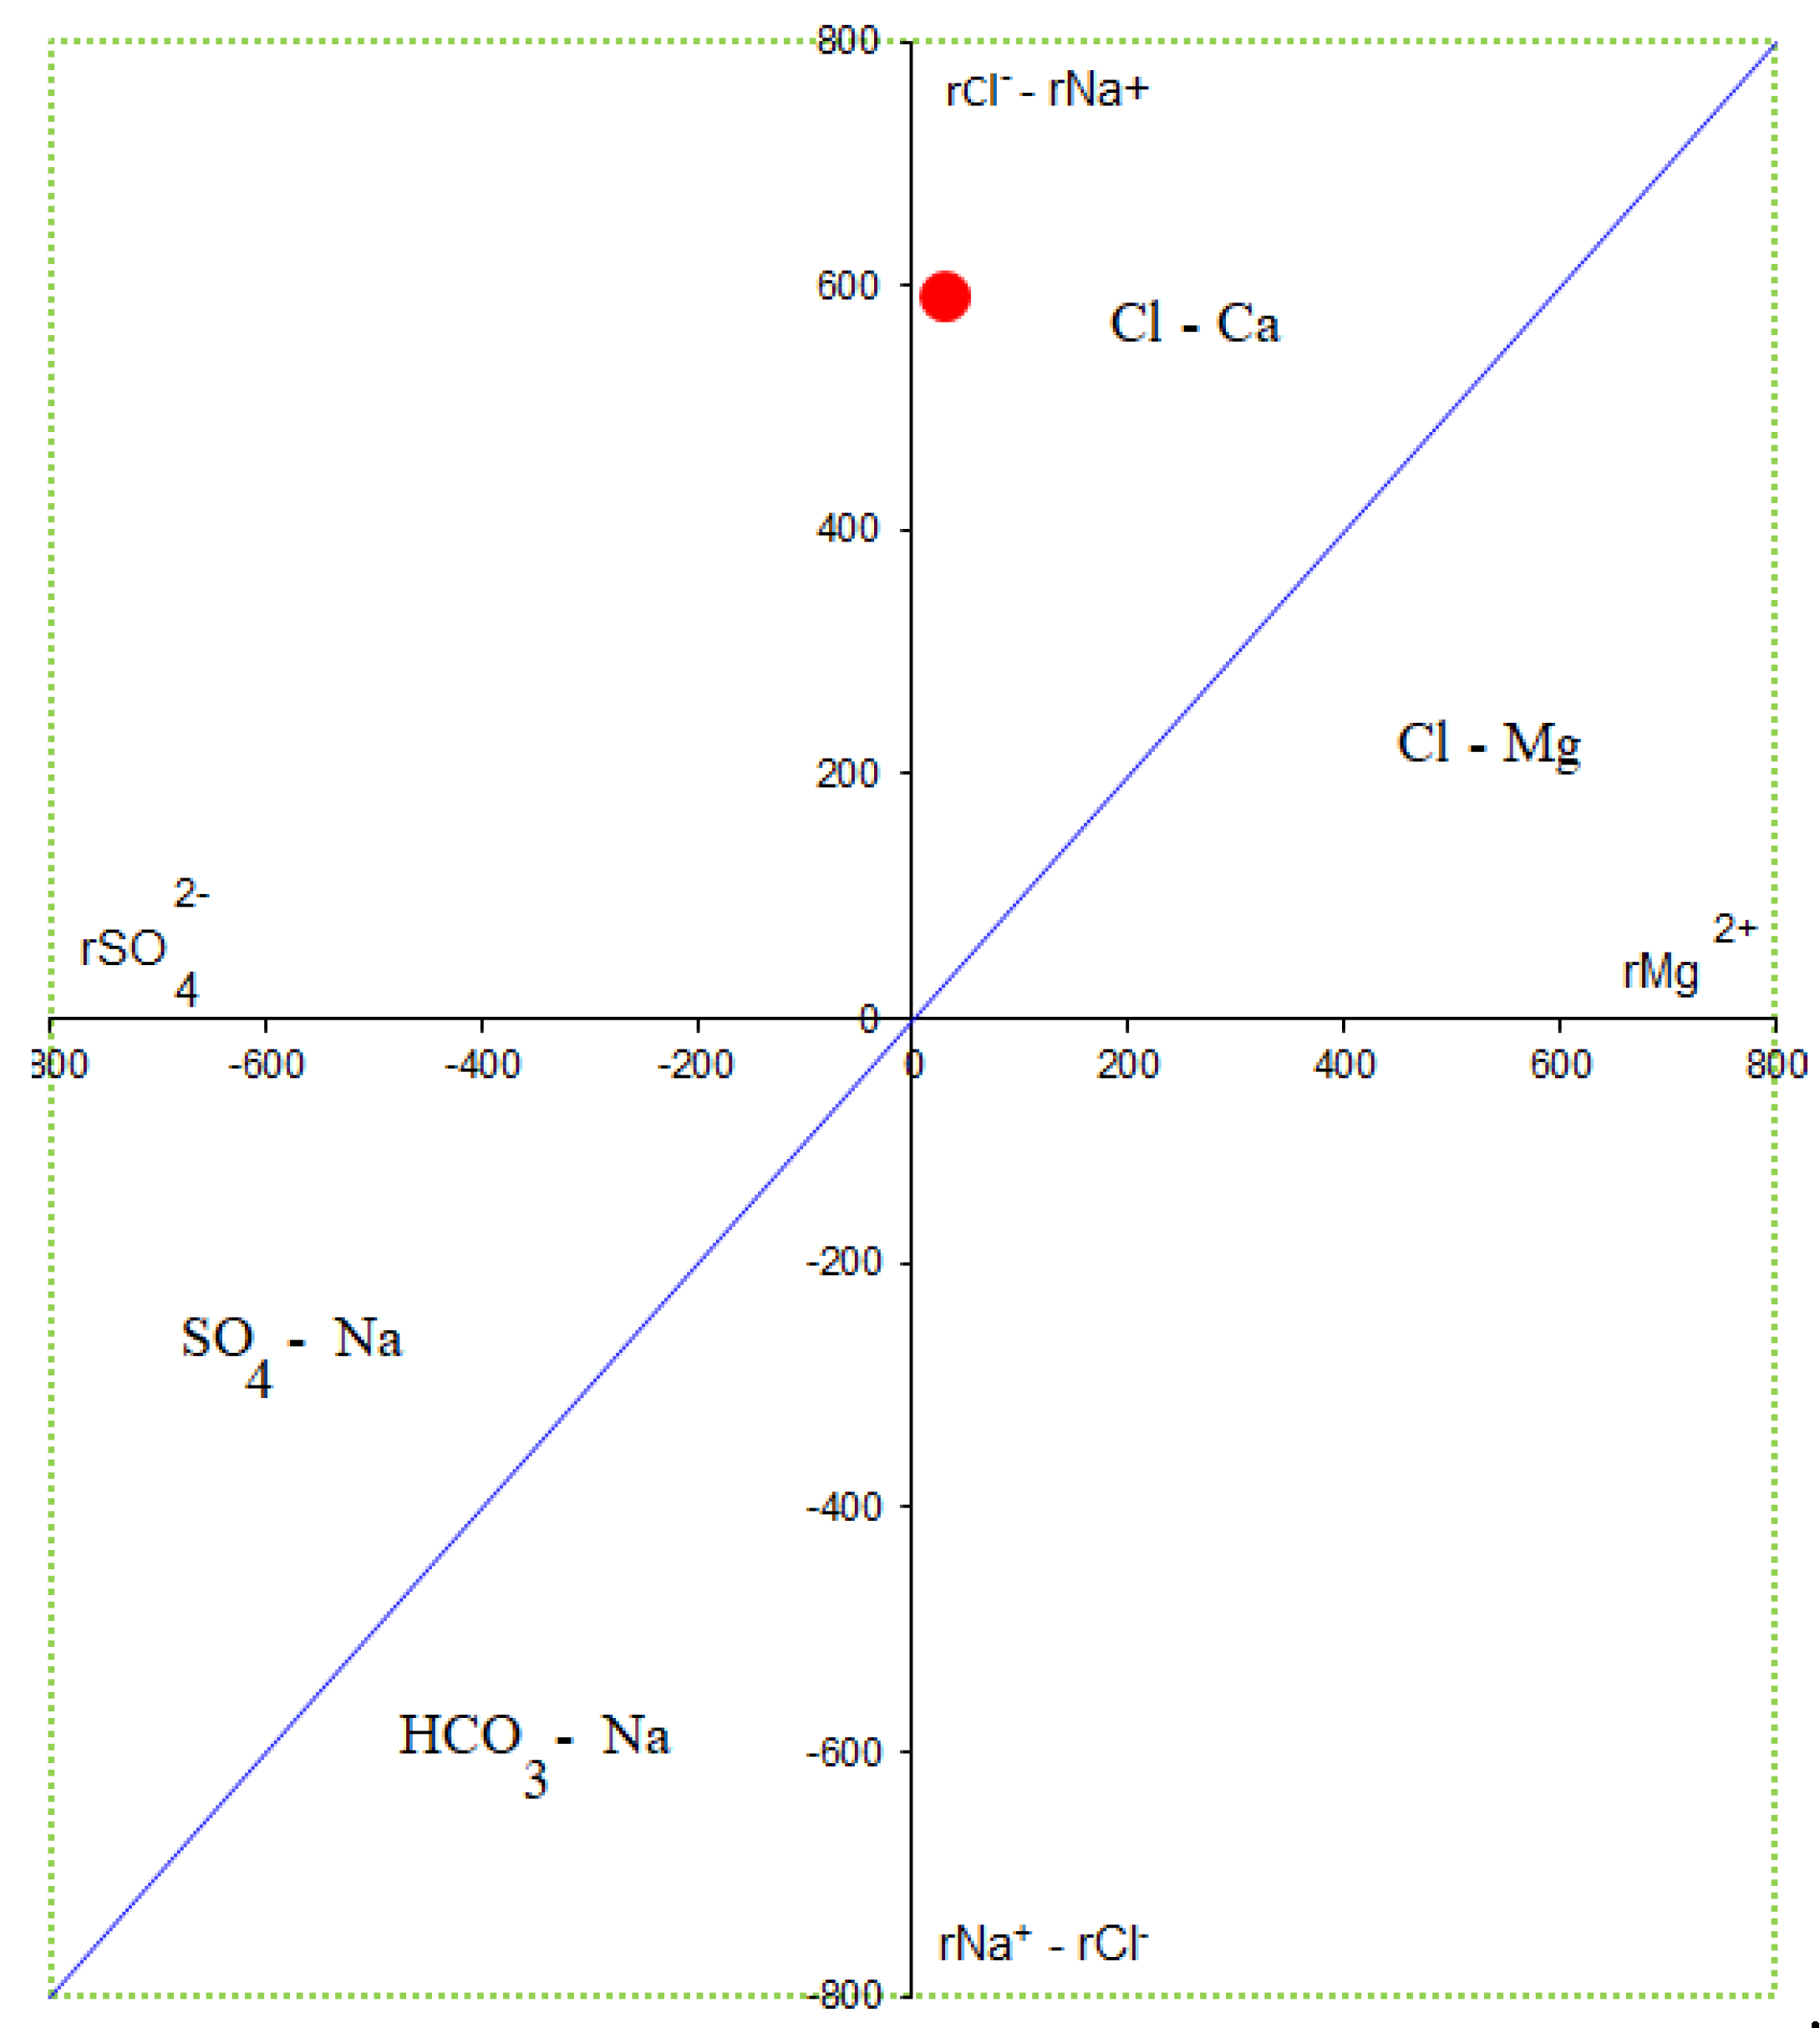
One water sample (W-01) was collected during drilling to provide information on water chemistry that could be used as an input data to geological modeling later. Formation water is in contact with oil and gas and reservoirs for a long time, so it can more actually reflect the nature of fluid inside of the reservoir under geological conditions. The water sample consists of high salinity content of 77.65 g/l that is so-called formation water because of salinity content of produced water greater than seawater of 10 g/l. This water has extremely high content of total dissolved solids of 83,604 mg/l with the dominance of cations K+, Na+ and anion Cl- concentrations of 20,470 mg/l, 14,315 mg/l and 43,003 mg/l, respectively, indicating this brine water sample taken in reducing environment with the presence of carbonate mineral. These contents are much higher than the others with the cation content bias K+>Na+>Ca2+>Mg2+>Fe and anion content towards Cl->SO42->HCO3->Br-. High contribution of Na+ and Cl- in this formation water shows that it is not affected by dissolution of the salt rock around. Alkaline solutions of calcite (1.360 mg/l), magnesium (384 mg/l) and carbonate (49.641 mg/l) ions are stable with pH of 8.49. If the sodium chloride coefficient is of less than 0.85, then the preservation conditions of oil and gas is good, if sodium chloride system is over 0.85, the formation is affected by infiltration water and oil and gas preservation condition is poor [15]. The formation water contains high Cl- concentration and Na/Cl ratio of less than 0.85, indicating a good preservation condition. In addition, high sulfate content of 2.109 mg/l forming from reduction of sulfate ion in formation of hydrogen sulfide diffuses into the surrounding rocks and reacts with oxide of iron forming pyrite and siderite that observed in mineral compositions of almost samples. According to the formation water classification standard of Sulin [16], this formation water is identified as Calcium-Chloride type with high-salinity and sulfate that are probably due to some reasons: (i) desulfurization effect; (ii) dissolution of carbonate; (iii) ion exchange reaction in clay minerals such as illite and kaolinite; (iv) hydrocarbon expulsion under overpressure. This type of water is characteristically found in the deep sources, close system, well-sealed formation of a large pool (Table 7 and Table 8 and Figure 9).
Table 7.
Analytical data of formation water.
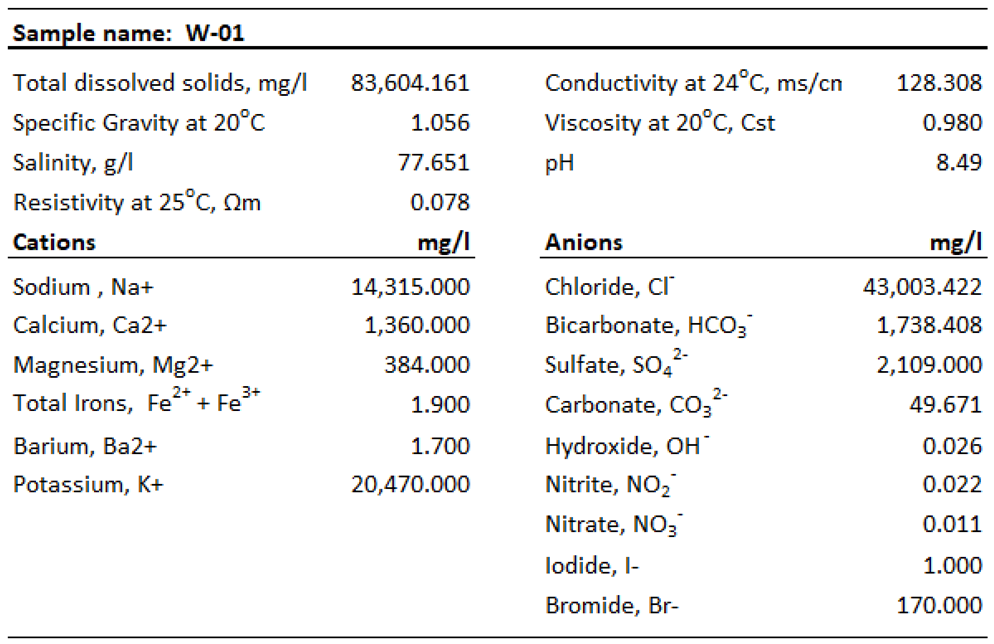
Table 8.
Type of water based on V.A. Sulin’s classification [16].
Table 8.
Type of water based on V.A. Sulin’s classification [16].
5. Conclusions
Geochemical techniques in this study provide significant information on the existence of active source rocks in this area, fluid characteristics and interactions between reservoir rocks with fluids in the production zones. Some of the above information are totally not support for the CCS purposes, but may aid in the better understanding of burial history and complement the vitrinite reflectance data and basin modeling with respect to basin resource management although it was not relevant to an economic petroleum system in the vicinity of this well. The moderate yields in extractable organic matter from Oligocene shales and an amount of gas and oil were detected in sand reservoirs indicate the presence of active and high mature source rocks in the Oligocene formation that possibly mobilize the migration of CO2. Therefore, these data will become parts of the future studies with a combination of the standard and novel geochemical techniques for evaluation of the A-1X well. The above data show that the geology in this area appears suitable for geological storage of CO2 with some main points as follows:
(i) Present Source rocks
Shale source rocks in the lower part of Oligocene contain poor to fair contents of total organic carbon, giving poor to fair hydrocarbon generation potential of type II/III kerogen that entered the mature stage and within peak of oil generation phase, whereas shales in the upper part of Oligocene contain moderate amounts of extractable organic matter indicate the presence of in-situ hydrocarbons from active source rocks currently existing in this well. Chemical compositions of the extractable shales and oil are generally similar with mostly comprising high contents of saturated hydrocarbons, following non hydrocarbons and aromatic hydrocarbons. The dominance of isoprenoids and n-alkanes from nC13 to nC35 and low to moderate ratios of Pr./Phy. in C15+ saturated hydrocarbon fraction indicate that the presence of in-situ hydrocarbons that sourced from terrestrial materials and deposited in lacustrine and fluvial-deltaic environments. However, it is difficult to quantify these sources due to the contamination of drilling fluid.
(ii) Reservoir quality
Several sandstone zones are considered as isolated hydrocarbon regimes in Oligocene formation that are extremely good sandstone reservoirs producing dry gas and oil with a common water legs. The sandstones mostly comprise very high visual porosities with high quartz, feldspar and carbonate minerals that are sufficient conditions for subsurface pore space and CO2 injection in over saturated fluids. Moreover, high contents of brittle minerals in fracture basement show an effective condition to become likely a good potential reservoir. However, the basement below 1500 m is not effectively developed to become a reservoir because calcite composition dramatically increases in the metamorphic rock, therefore, rock-forming minerals highly replaced by calcite.
(iv) Fluid properties
Fluids recorded in this well include both mud gas and oil samples. CH4 is the main composition, following C2 to C6, N2, very small concentration of CO2 and no noticeable of H2S. Stable carbon isotope reveals that the organic matters mainly derived from sapropelic and humic sources that are in thermal maturity to oil window phases. This gas is identified as dry gas and having no pollutant of CO2 in trap. One water sample containing high total dissolved solid and salinity concentrations together with high cations K+, Na+ and Cl- indicate the evidences of formation water that are not affected by dissolution of the salt rock around. This formation water is defined as Calcium-Chloride type that recorded in the deep source, close system, favorablFe condition for a large pool with good sealing capacity.
Geochemical and petrological data of the A-1X well could be used as a case study for finding CO2 storage capacity from the porous rocks. High-salinity water in the sandstone reservoir is an indication of reducing environment that oil and gas accumulated in deep formations and having good sealing capacities from local shales, although they were not expected for commercial accumulations but they show suitable candidates for storing CO2. For better understanding of site selection and site characterization, the data need to be integrated with other data, i.e. geological structure, well logging, seismic reprocessing, well integrity, etc. for calculating capacity of storage and predicting leakage risks from faults or the existence of shallow gas indications above the candidate reservoirs.
References
- Stalker, L.; Noble, R.; Gray, D.; Trefry, C.; Varma, S.; Ross, A.; Sestak, S.; Armand, S.; Gong, S. Geochemical characterisation of gases, fluids and rocks in the Harvey-1 data well, 2013, final report of project 7-1111-200, EP135208, CSIRO Earth Sciences and Resource Engineering.
- Boreham, C.; Underschultz, J.; Stalker, L.; Kirste, D.; Freifeld, B.; Jenkins, C.; Ennis-King, J. Monitoring of CO2 storage in a depleted natural gas reservoir: gas geochemistry from the CO2CRC Otway Project, Australia. Int. J. Greenhouse Gas Control 2011, 5(4), 1039–1054. [Google Scholar] [CrossRef]
- PVEP. Drilling well location and design. 2022; Technical workshop. [Google Scholar]
- Nielsen, L.H.; Mathiesen, A.; Bidstrup, T.; Vejbñk, O.V.; Dien, P.T.; Tiem, P.V. Modelling of hydrocarbon generation in the Cenozoic Song Hong Basin, Vietnam; a highly prospective basin. Journal of Asian Earth Sciences 1999, 17, 269–294. [Google Scholar] [CrossRef]
- PVN. The petroleum geology and resources of Vietnam (2nd ed.), 2019, Science and Technology publication No. 409-2006.
- Kevin, M. K. R.; Martin, N.; Daniel, P.; Kenneth, P.; Artur, S. Basic petroleum geochemistry for source rock evaluation. Oilfield Review 2011, 23(2), 32–43. [Google Scholar]
- VPI-Labs’ procedures; Vietnam Petroleum Institute, 2020; unpublished works.
- Isotech Laboratories, Carbon isotope analysis, USA. Available online: https://isotechlabs.com/analytical.
- Craig, H. Isotopic standards for carbon and oxygen and correction factors for mass-spectrometric analysis of CO2. Geochim, Cosmochim, Acta 1957, 12, 133–149. [Google Scholar] [CrossRef]
- Cappuccio, J.A.; Pillar, V.D.; Xiao, C.; Ajo-Franklin, C.M. Bacterial acceleration of CaCO3 mineralization. Biophys J 2011, 100(3), 487a. [Google Scholar] [CrossRef]
- Chen, C-L.; Qi, J.; Zuckermann, R.N.; De Yoreo, J.J. Engineered biomimetic polymers as tunable agents for controlling CaCO3 minerization. J. Am ChemSoc 2011, 133, 5214–5217. [Google Scholar] [CrossRef] [PubMed]
- Hamm, L.M.; Bourg, I.C.; Wallace, A.F.; Rotenberg, B. Molecular simulation of CO2 and CO3-brine-mineral systems. Rev Mineral Geochem 2013, 77, 189–228. [Google Scholar] [CrossRef]
- Stalker, L.; Noble, R.; Pejcic, B.; Leybourne, M.; Hortle, A.; Michael, K.; Dixon, T.; Basava-Reddi, L. Feasibility of monitoring techniques for substances mobilised by CO2 storage in geological Formation. SciVerse Science Direct, Elsevier, 2012; vol. 23, pp. 439–448. [Google Scholar] [CrossRef]
- Klemme, H. D. Heat influences size of oil giants-geothermal gradients. The oil and gas journal 1972, vol. 17, 136–144. [Google Scholar]
- Wang, Z. H.; Hao, C. G.; Li, J. M.; Feng, Z. Z.; Huang, C. W. Distribution and Genetic Mechanism of Overpressure in Western Sichuan Foreland basin. Lithologic Reservoirs 2019b, 31, 36–43. [Google Scholar] [CrossRef]
- Zeng, J. H.; Wu, Q.; Yang, H. J.; Qian, S. Y.; Kong, X.; Ma, Z. L. Chemical Characteristicsof Formation Water in Tazhong Area of the Tarim Basin and Their Petroleum Geologic Significance. Oil & Gas Geology 2008, Vol.29, 223–229. [Google Scholar] [CrossRef]
- Sulin, V.A. Oil field waters of the USSR Moscow-Leningrad G. 1935. [Google Scholar]
Figure 1.
Location of the study area [4].
Figure 1.
Location of the study area [4].
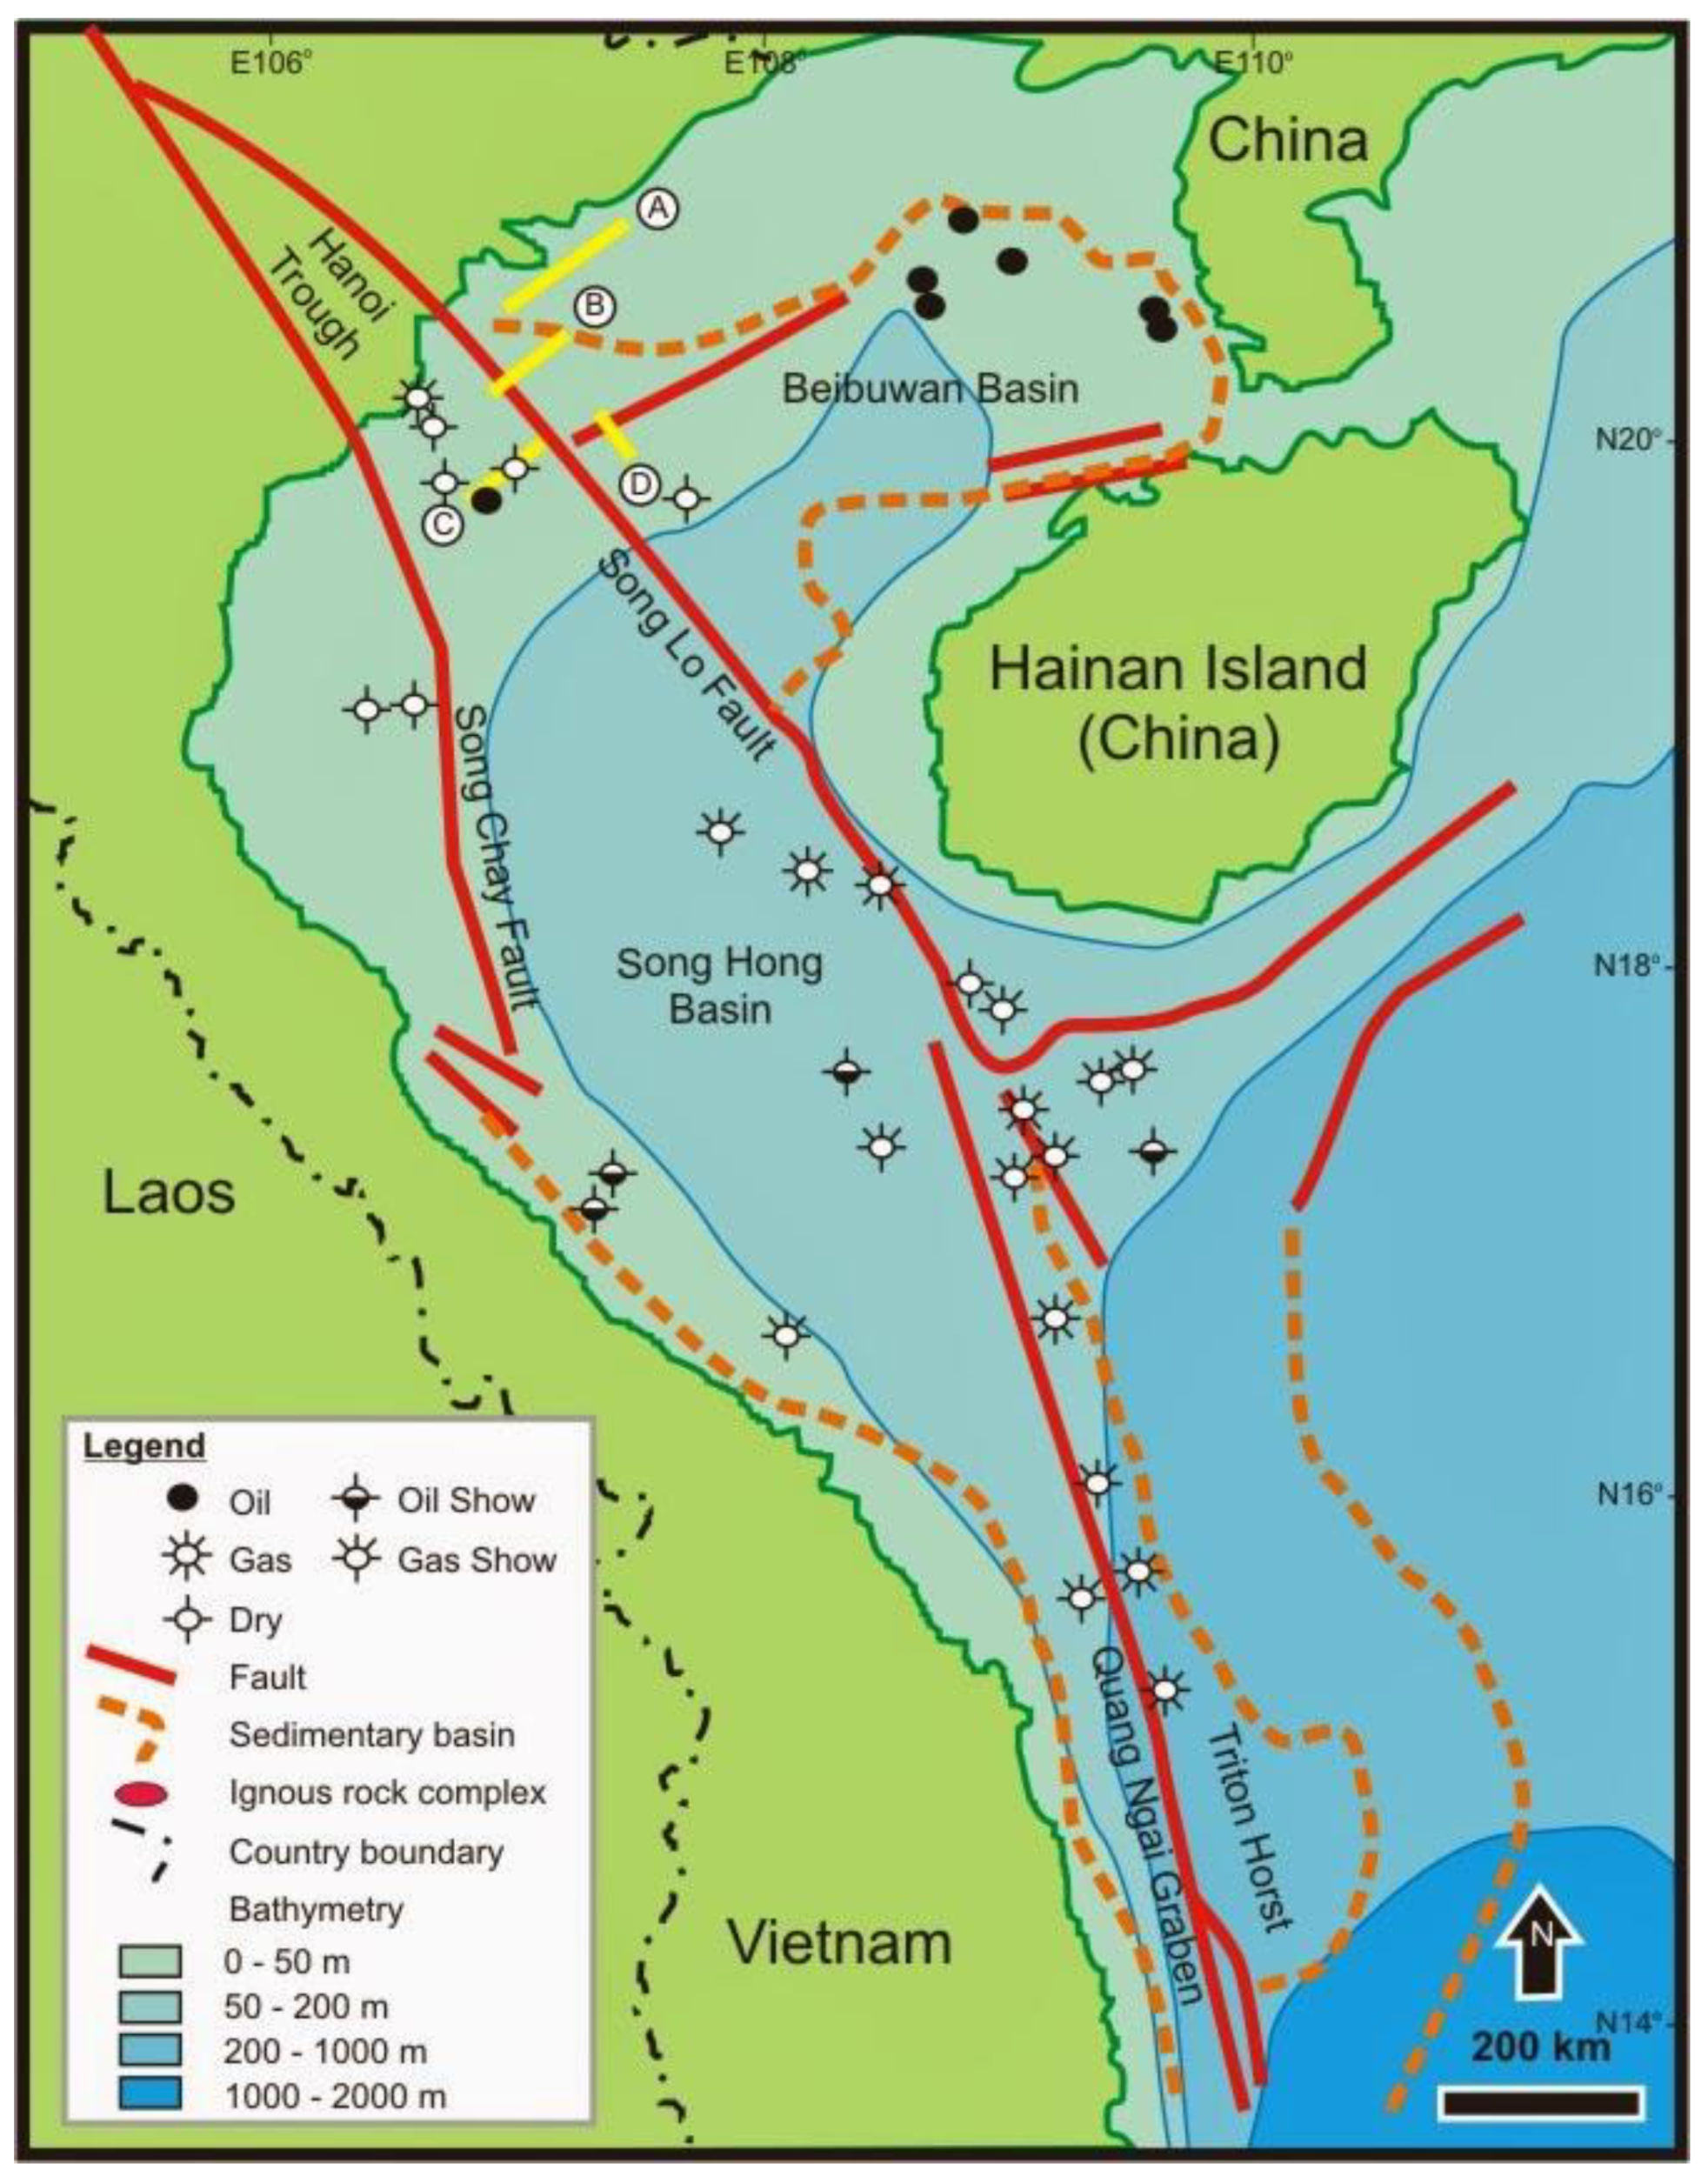
Figure 2.
Seismic section of A-1X well [3].
Figure 2.
Seismic section of A-1X well [3].
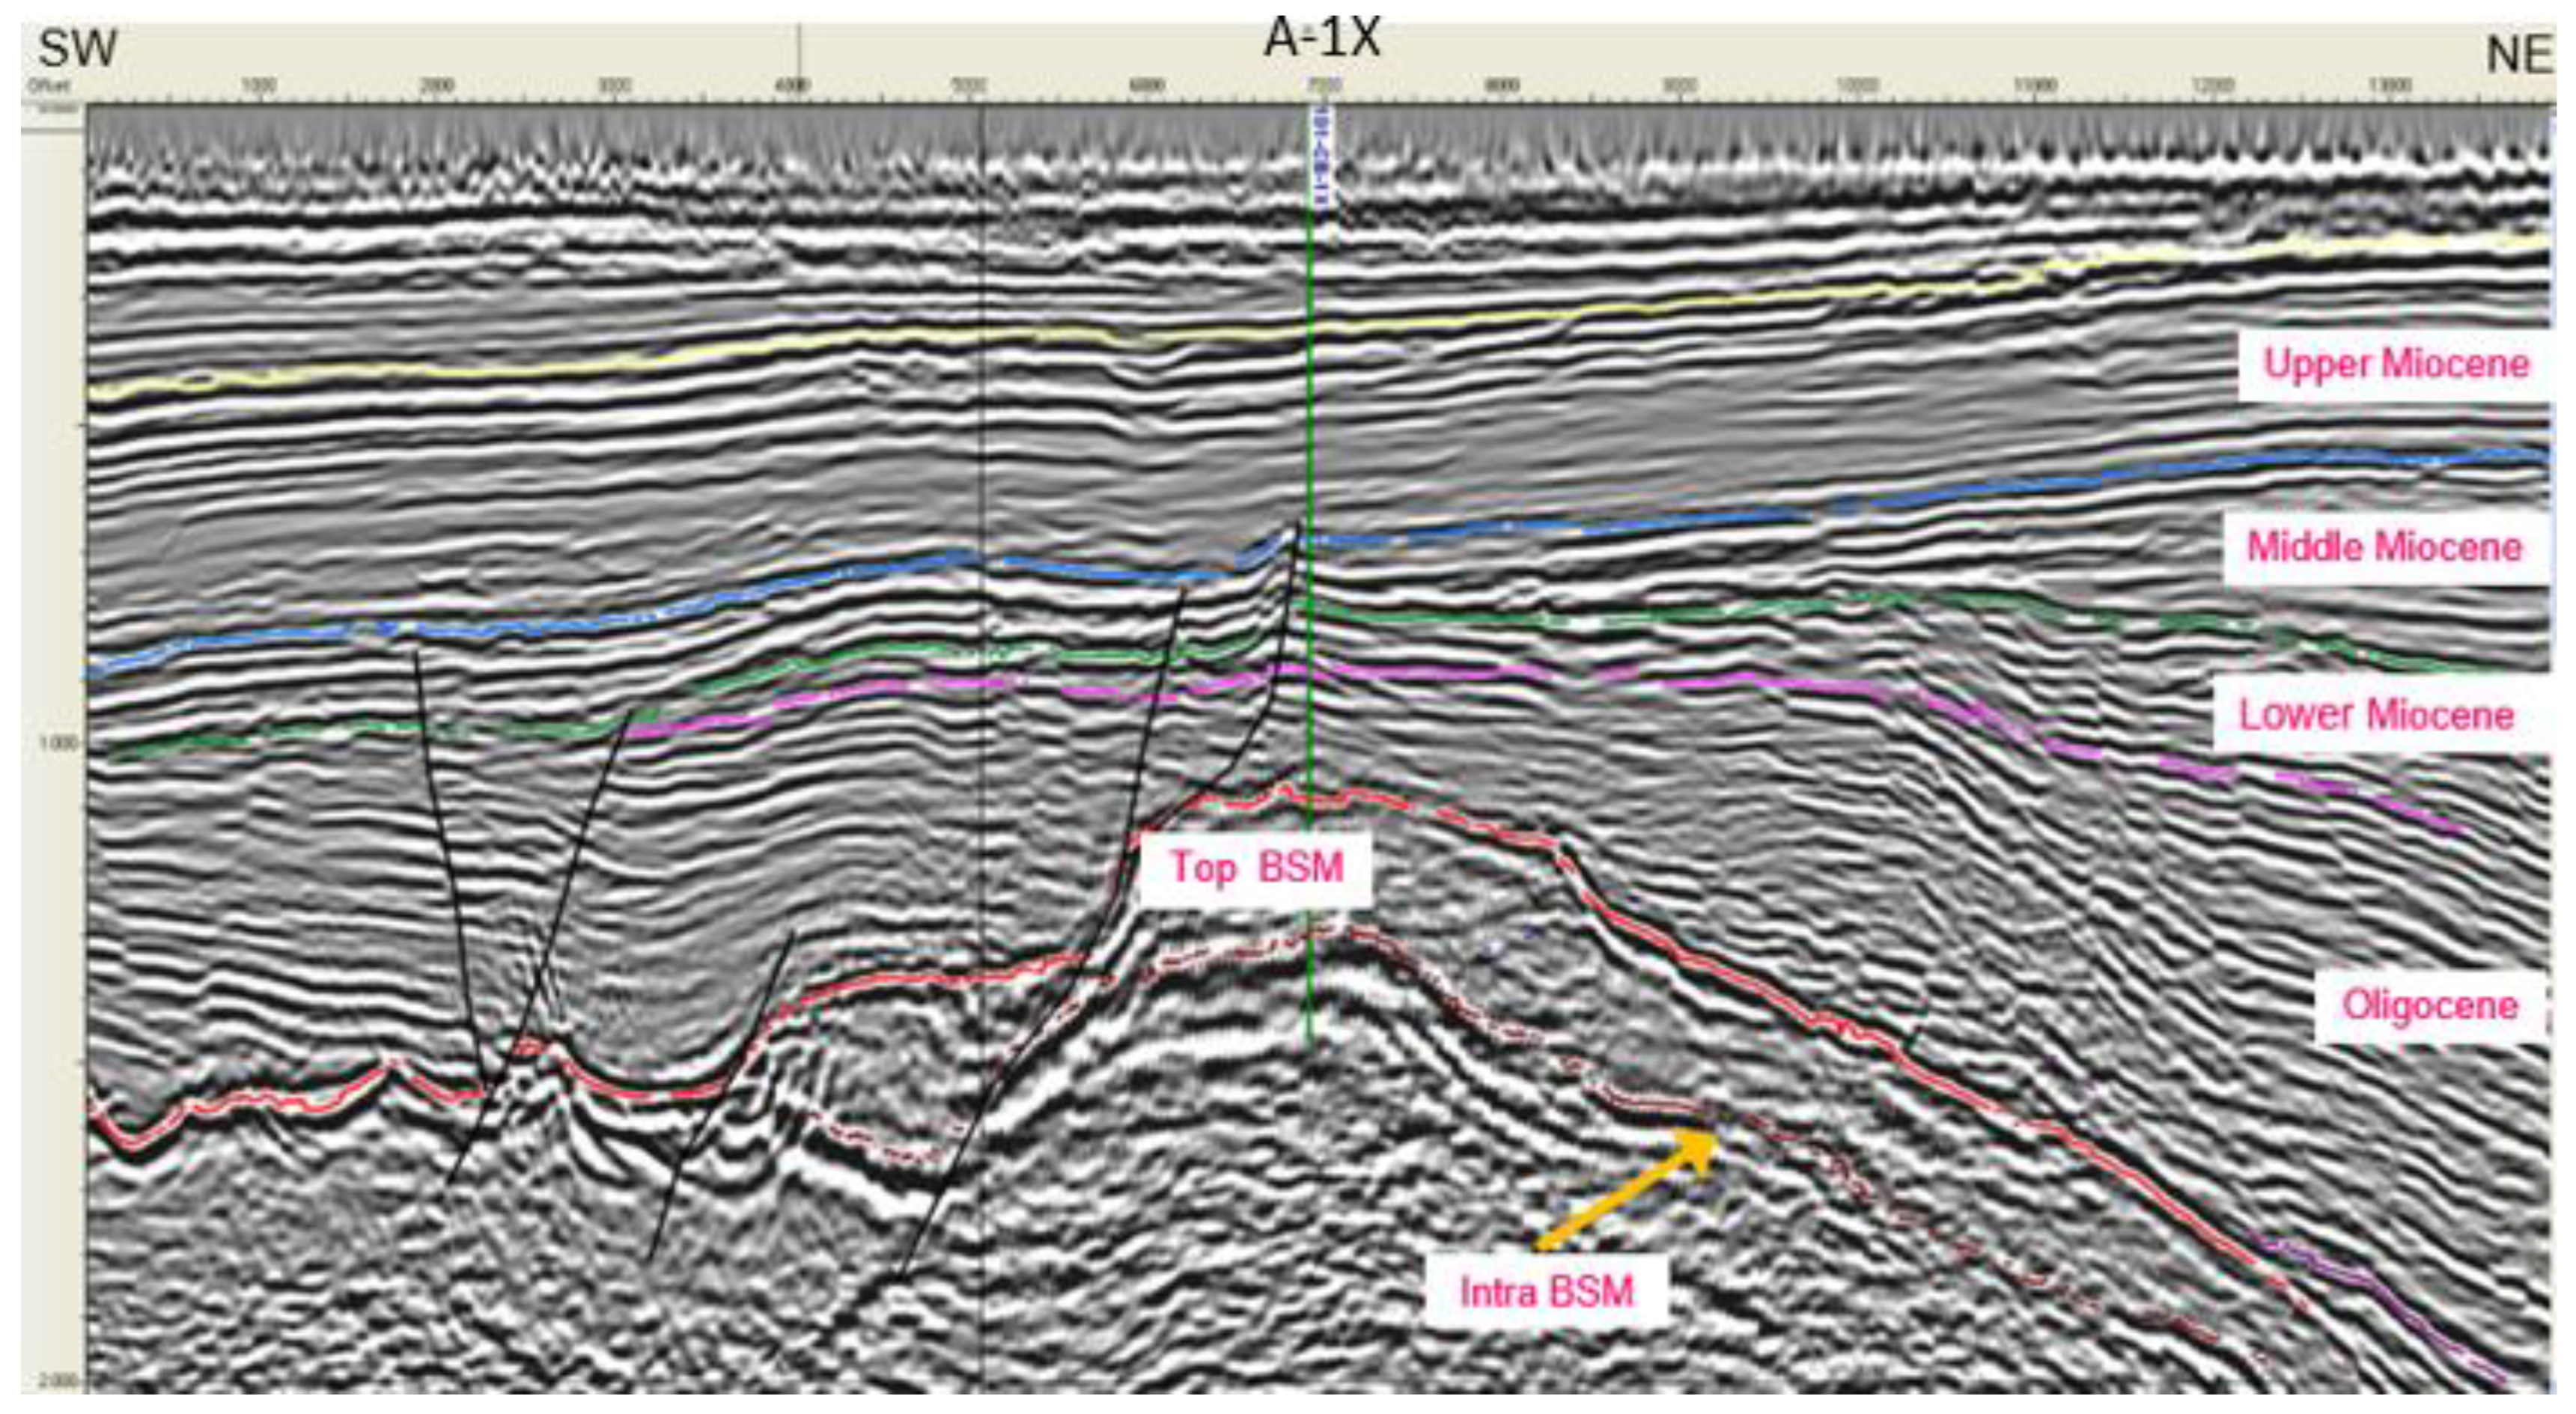
Figure 3.
Stratigraphic column of A-1X well [3].
Figure 3.
Stratigraphic column of A-1X well [3].
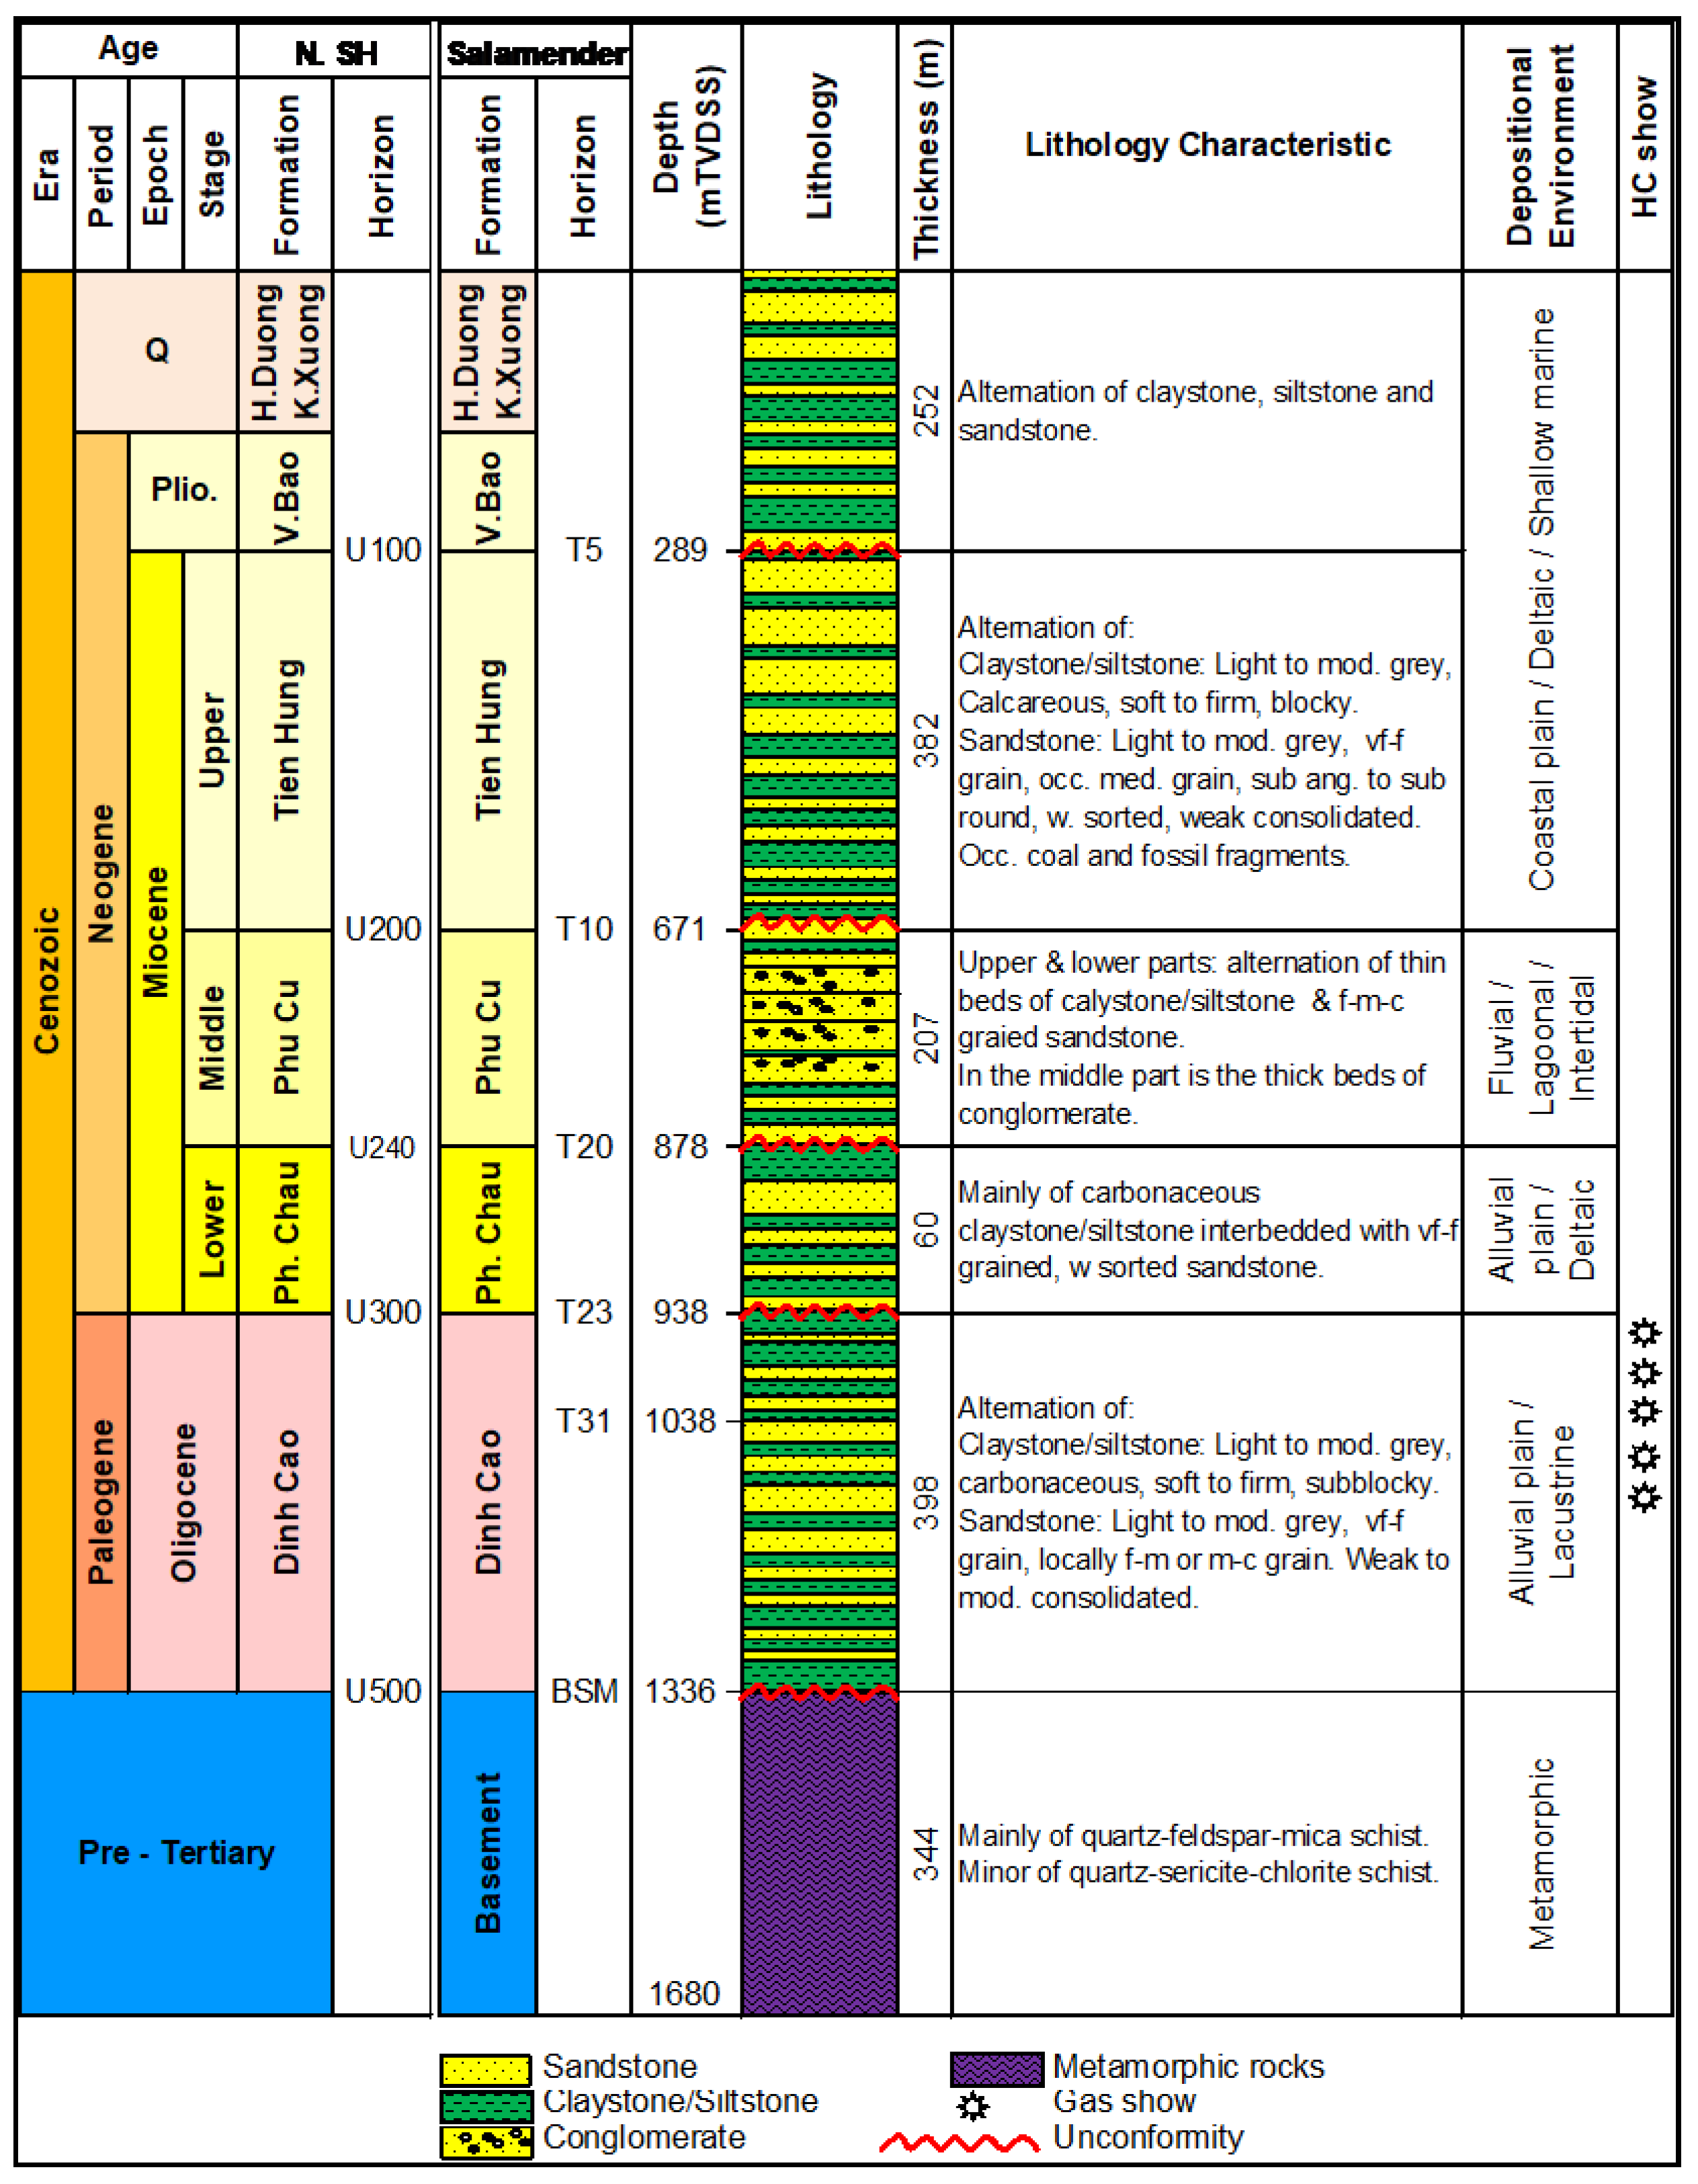
Figure 4.
Changes of Rock-Eval parameters with depth.
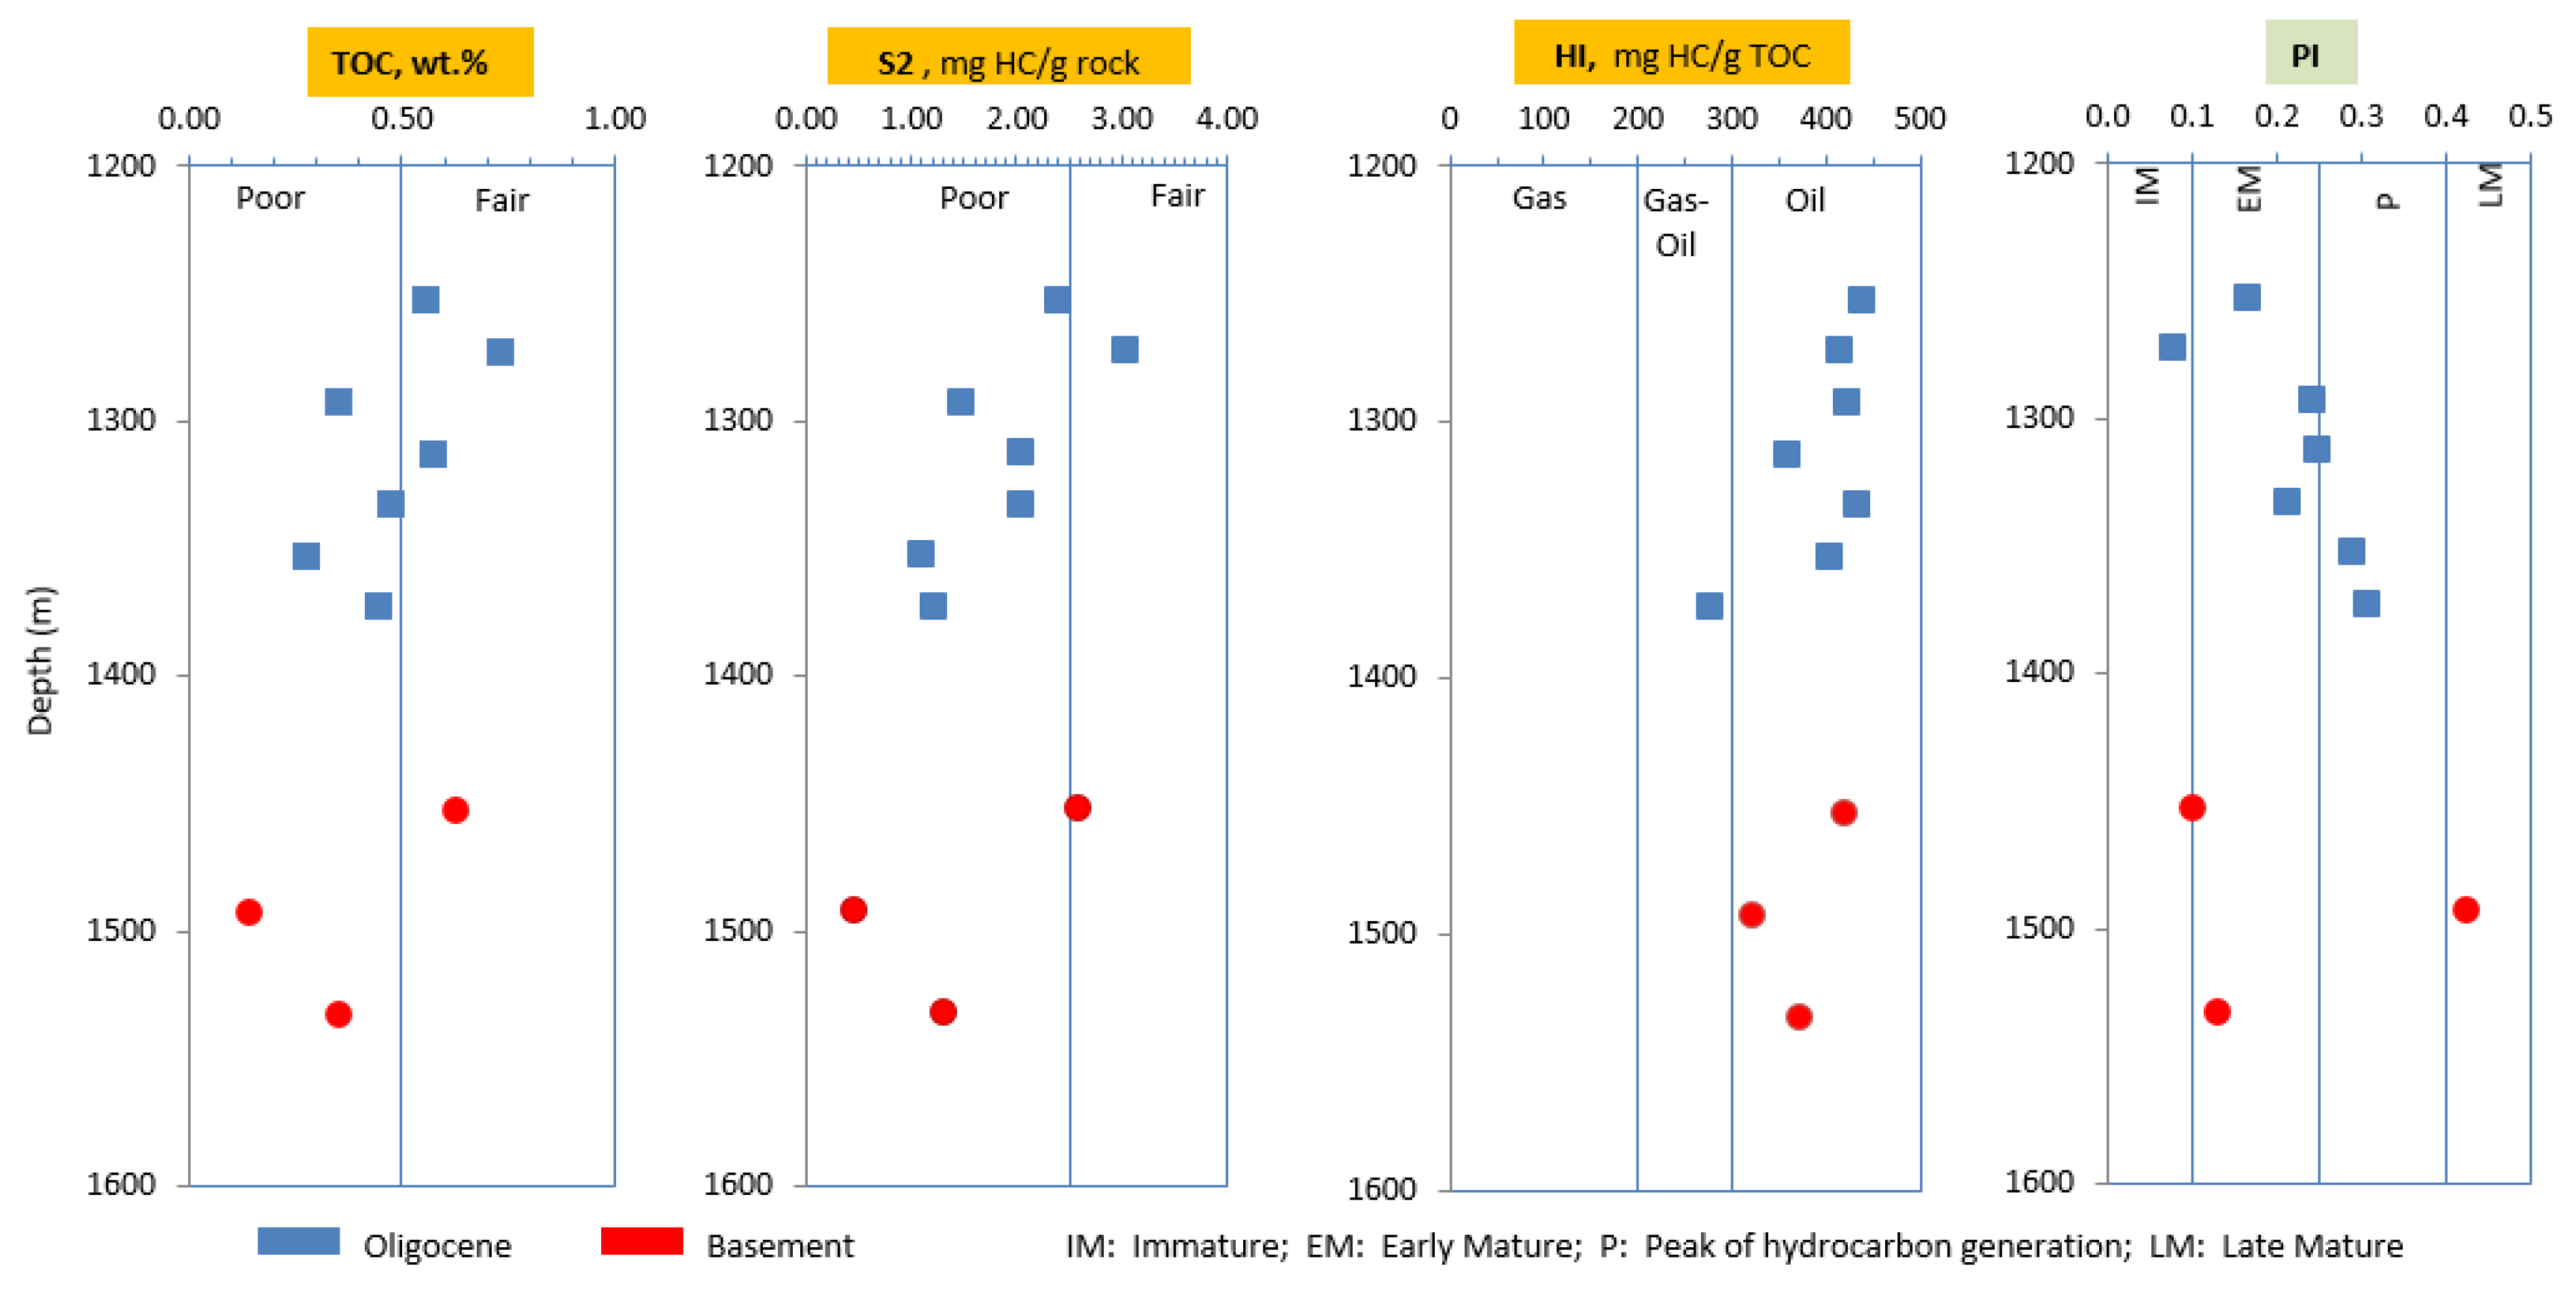
Figure 5.
Distribution of hydrocarbons in C15+ saturated fraction.
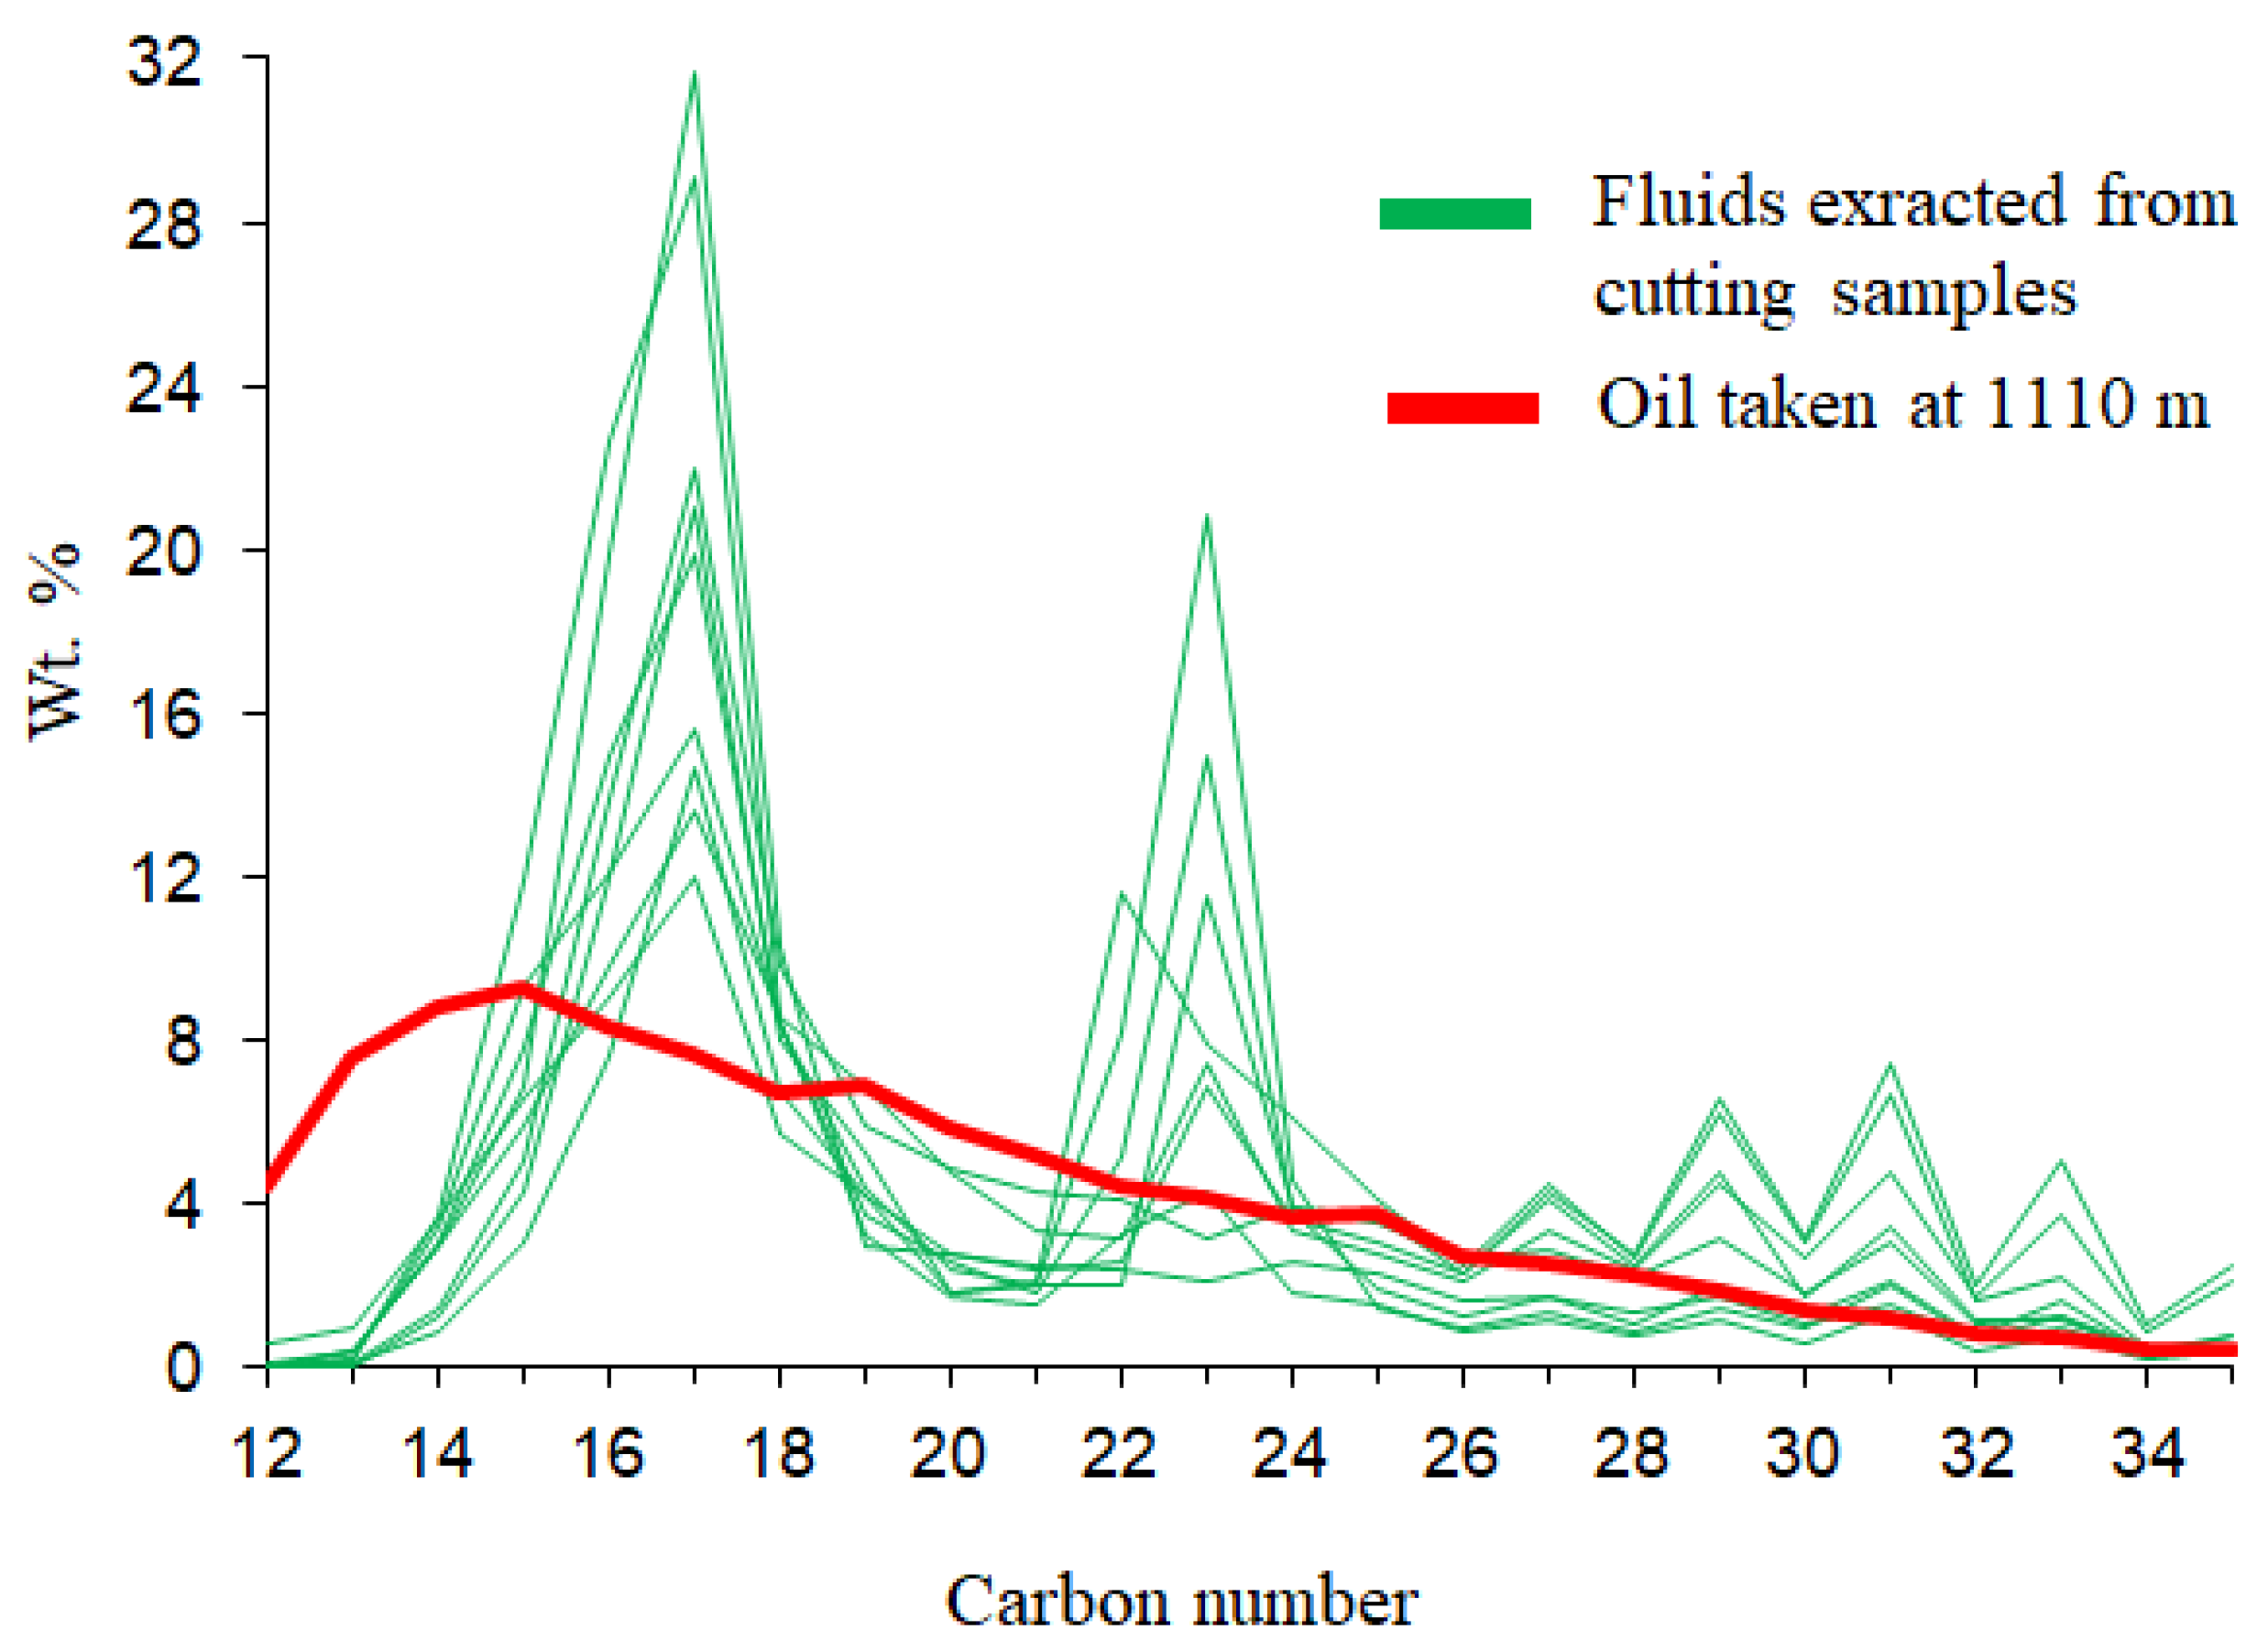
Figure 6.
Gas chromatograms: (a) Oil taken at 1110 m, (b) Oil extracted from mud filtrate, (c) Fluid extracted from cutting at 1085-1090 m, (d) Fluid extracted from cutting at 1125-1130 m .
Figure 6.
Gas chromatograms: (a) Oil taken at 1110 m, (b) Oil extracted from mud filtrate, (c) Fluid extracted from cutting at 1085-1090 m, (d) Fluid extracted from cutting at 1125-1130 m .
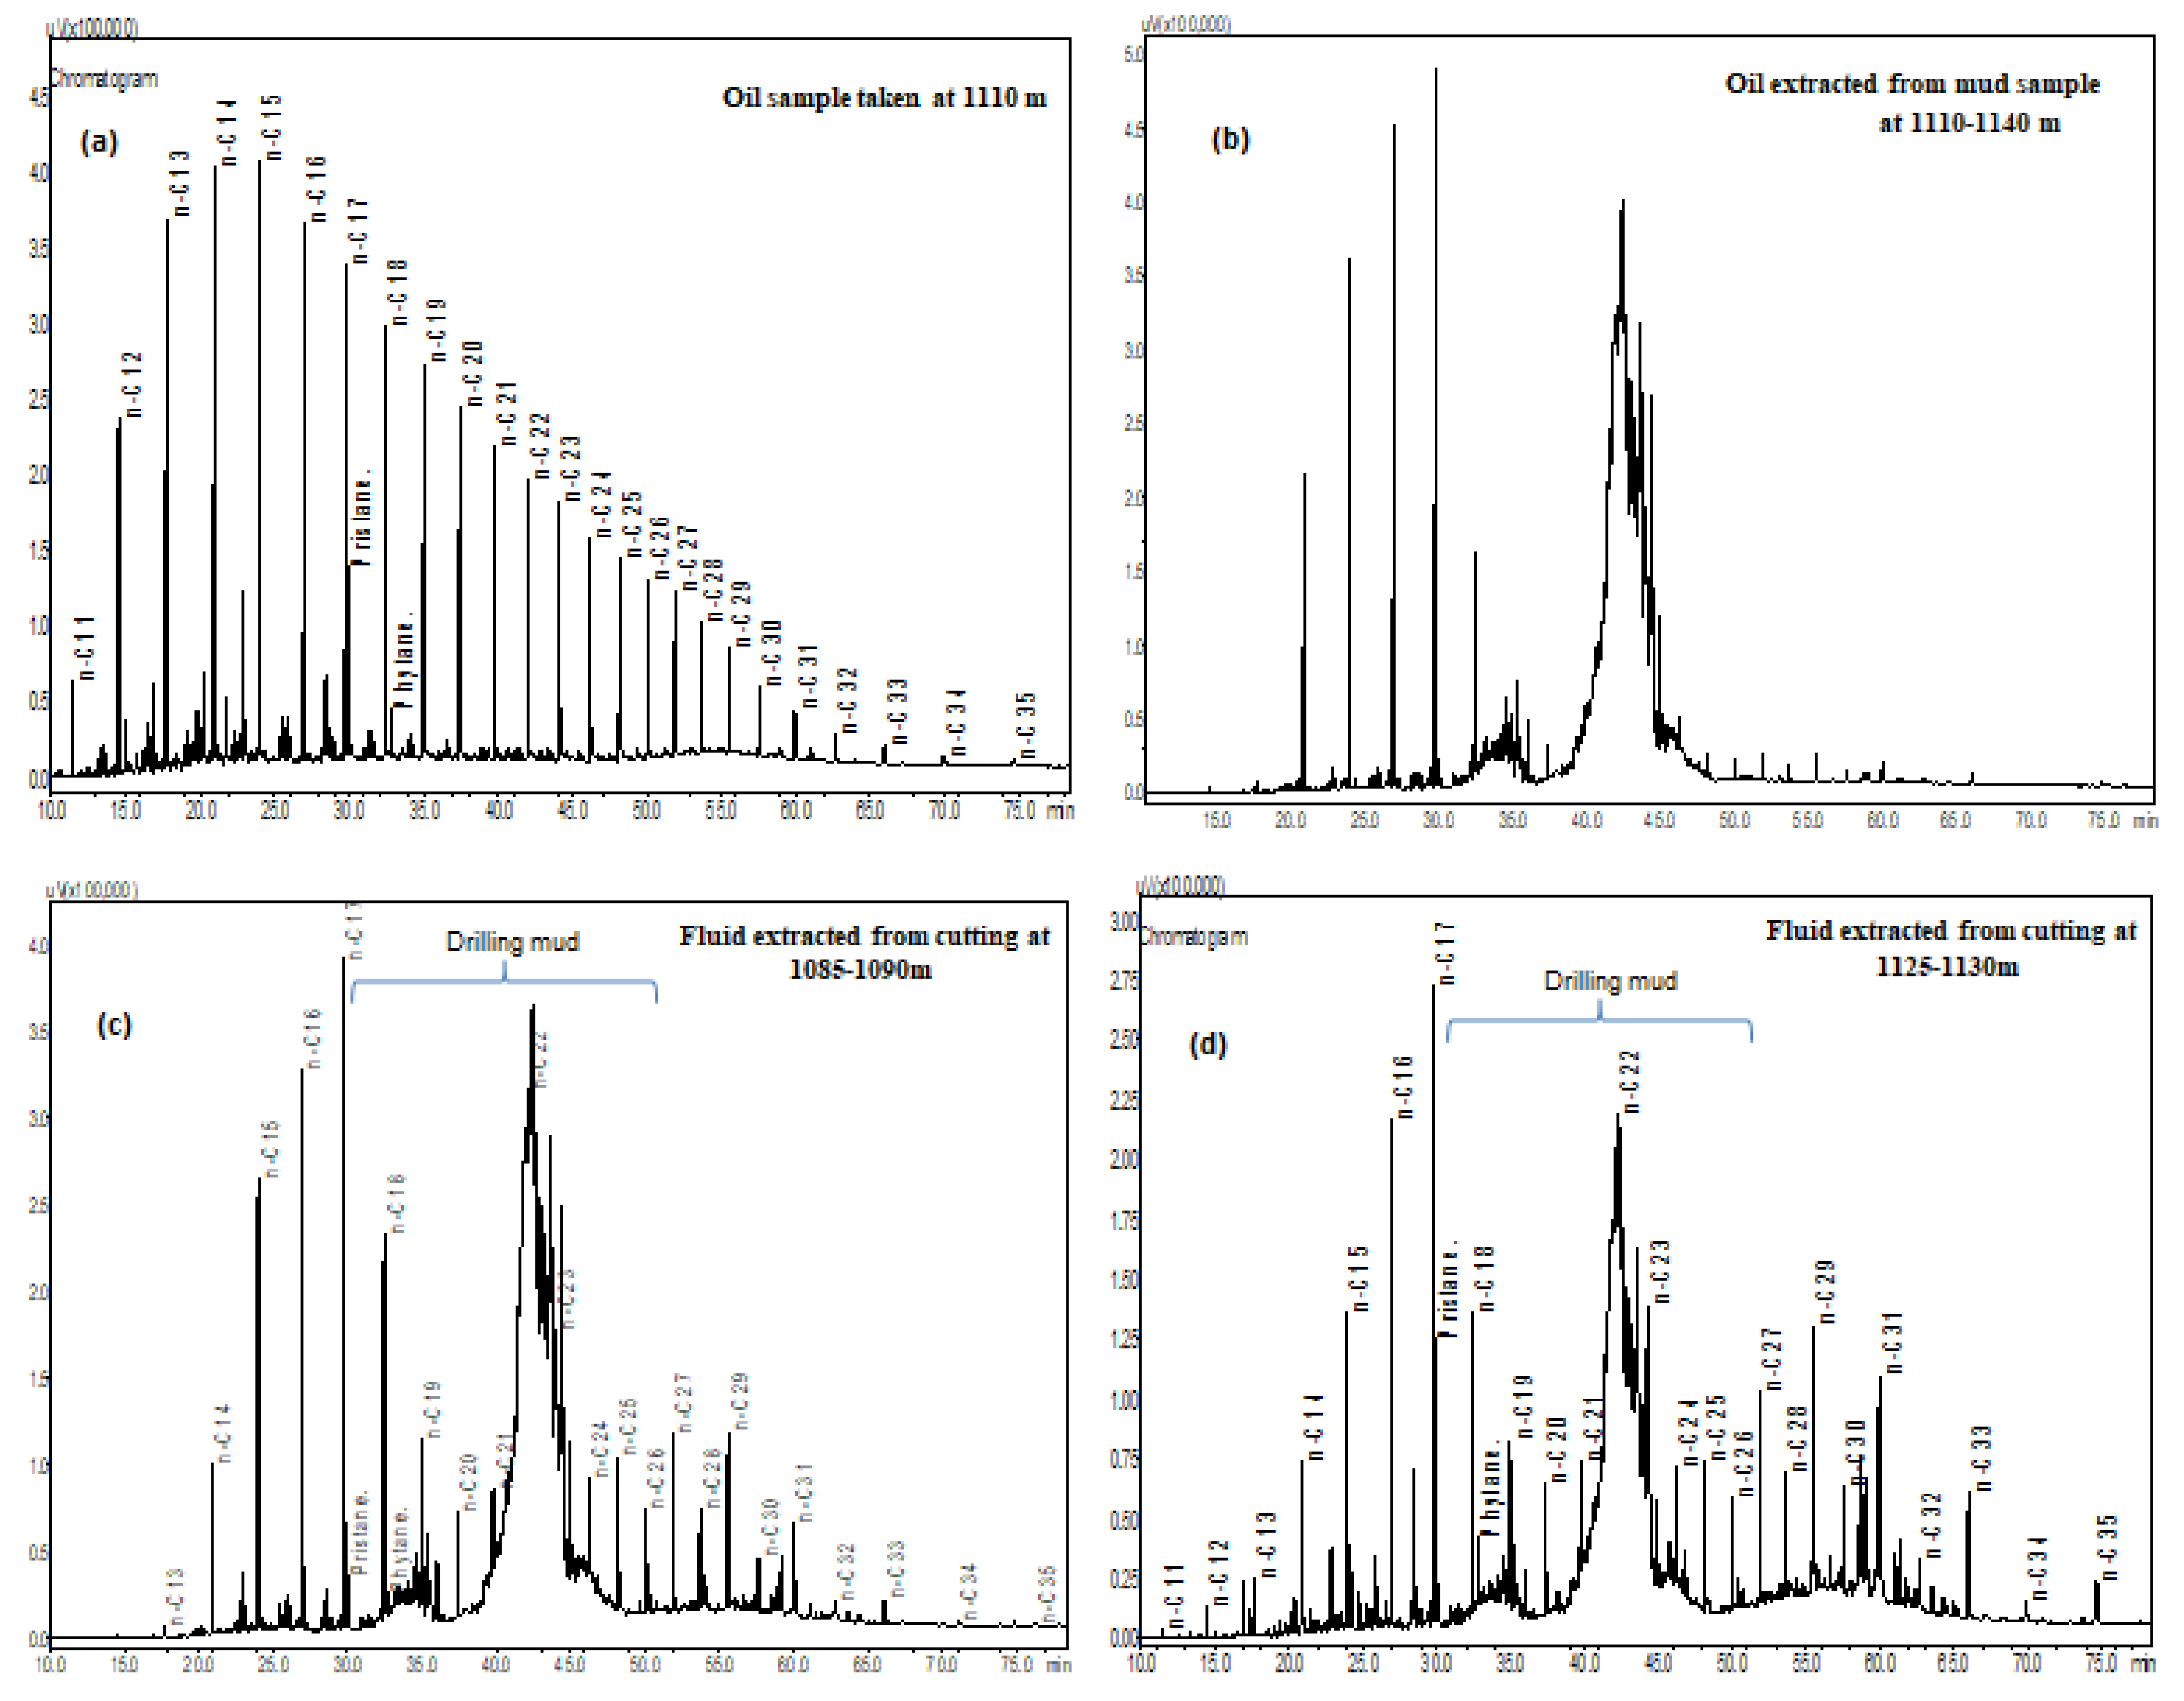
Figure 9.
Piper diagram of water classification .
Disclaimer/Publisher’s Note: The statements, opinions and data contained in all publications are solely those of the individual author(s) and contributor(s) and not of MDPI and/or the editor(s). MDPI and/or the editor(s) disclaim responsibility for any injury to people or property resulting from any ideas, methods, instructions or products referred to in the content. |
© 2026 by the authors. Licensee MDPI, Basel, Switzerland. This article is an open access article distributed under the terms and conditions of the Creative Commons Attribution (CC BY) license (http://creativecommons.org/licenses/by/4.0/).
Copyright: This open access article is published under a Creative Commons CC BY 4.0 license, which permit the free download, distribution, and reuse, provided that the author and preprint are cited in any reuse.


