Submitted:
04 January 2026
Posted:
05 January 2026
You are already at the latest version
Abstract
Regenerative rehabilitation can enhance skeletal muscle mass, function, and size following traumatic injuries such as volumetric muscle loss (VML). We previously optimized fibrin-laminin hydrogels for muscle regeneration and an electrically stimulated eccentric contraction training (EST) for muscle rehabilitation. The goal of this study was to examine the combined effect of these two therapies in maximizing tissue recovery. A VML defect was created by removing ~20% of muscle mass from the tibialis anterior (TA) muscle in adult male Lewis rats. The injured TA muscles were treated with fibrin-laminin (FBN450) hydrogel. EST was implemented 2 weeks post-injury at both 100 Hz and 150 Hz frequencies and was continued for 4 weeks. The results showed no improvement in muscle mass or function with combined FBN450 and EST application. Histological analysis revealed reduced type 2B myofiber size and percentage in the combined hydrogel and EST treatment group. Gene expression studies showed increased inflammatory and fibrotic signaling with no concomitant increase in myogenic markers. Collectively, these results indicate that the FBN450 hydrogel therapy did not synergize with EST to improve outcomes following VML.
Keywords:
skeletal muscle
; hydrogels
; rehabilitation
1. Introduction
Orthopedic trauma typically involves volumetric muscle loss (VML), defined as the surgical or traumatic loss of muscle tissue (>20%) resulting in functional impairment [1]. Skeletal muscles commonly sustain mild or moderate injury and have remarkable regenerative capabilities; however, in VML, the tissue architecture is disrupted, impairing regenerative capacity. The etiology of VML is the loss of muscle fibers and native elements such as satellite cells and extracellular matrix components (ECM), resulting in the permanent loss of contractile tissue. Consequently, due to the characteristics of VML, such as prolonged inflammation and persistent strength deficits, patients often experience disfigurement and/or chronic disability [1,2,3]. Clinical options for reconstructing or repairing muscle tissue following VML are extremely limited. As a result, VML contributes to permanent disability in civilian and military patients [4].
In a previous studies, fibrin-laminin hydrogels were developed for VML treatment [5,6,7]. Implantation of LM-111 (450 μg/mL) enriched fibrin (FBN450) hydrogels supported myogenic protein expression, increased the ratio of contractile tissue to fibrotic tissue, increased the quantity of neuromuscular junctions, and resulted in a higher quantity of small to medium sized myofibers (500 – 2000 μm2). Overall, the FBN450 hydrogel enhanced functional muscle regeneration, improving muscle force by ~60% compared to the untreated VML group at 28 days post-injury. Collectively, these results showed that an acellular therapy, such as the FBN450 hydrogels, can provide a promising therapeutic treatment for VML.
To improve regeneration and function following trauma, the synergistic application of both regenerative and rehabilitation strategies is being explored [8,9,10,11,12,13,14]. In a previous study, we optimized an electrical-stimulation eccentric-contraction training (EST) program by implementing the regimen 14 days post-VML injury for 4 weeks. Briefly, the training program consisted of altering the mechanical load on VML-injured muscles by modulating the stimulation frequency (50 Hz, 100 Hz, & 150 Hz) for a total of 20 eccentric contractions per bout. Our results show that the implementation of the electrical stimulation protocol at a high frequency (150 Hz) improves muscle mass (~39%) and muscle function (~34%) compared to a non-trained VML sham group [15].
We hypothesized that the regenerative therapy (FBN450 hydrogel) would support myofiber hyperplasia, while the rehabilitation technique (EST) would concurrently drive hypertrophy of these regenerated fibers. This combinatorial approach was expected to yield superior muscle mass and strength. Therefore, the objective of this study was to determine the extent of functional repair and regeneration following the combined application of FBN450 and EST in a rodent VML model.
2. Materials and Methods
2.1. Hydrogel Synthesis
Murine Laminin-111 (LM-111, 6mg/mL, Trevigen, Gaithersburg, MD), fibrinogen from bovine plasma (20 mg/mL, MilliporeSigma, St. Louis, MO), thrombin from bovine plasma (20 U/mL, MilliporeSigma), a protease inhibitor (PI) cocktail (1:1000, MilliporeSigma), and calcium chloride (20 mM, MilliporeSigma) were combined to create LM-111-enriched fibrin hydrogels with a final concentration of 450 μm/mL LM-111 (FBN450), as previously described [5,6,7]. Briefly, fibrinogen and a PI cocktail were added to a warmed isotonic sodium chloride solution. LM-111 was added to the fibrinogen solution. In a 6-well plate, the fibrinogen solution was added, followed by the addition of calcium chloride, and lastly, thrombin. Once all components were added, the plate was placed into an incubator to allow for gelation.
2.2. Rodent Model of VML
All animal work was carried out in strict accordance with the Animal Welfare Act, the Animal Welfare Regulations, and the principles of the Guide for the Care and Use of Laboratory Animals. All animal experiments were reviewed and approved by the Institutional Animal Care and Use Committee at Saint Louis University (IACUC protocol# 2645). Adult (10 – 12 weeks old) male Lewis rats (Charles River Laboratories, Wilmington, MA) were housed in a vivarium accredited by the Association for Assessment and Accreditation of Laboratory Animal Care International and provided with food and water ad libitum. All animals were in good health prior to procedures and were provided one week of acclimation period prior to experiments.
All surgical procedures were carried out under anesthesia with a continuous inhalation of isoflurane (1.5 – 3.5%) while on a heating pad, as described previously [5,16]. A unilateral model was used. Briefly, from the TA muscle of the right hind limb, ~20% of the muscle mass was removed from the center using a 6-mm biopsy punch to create a full-thickness VML defect, which was left untreated. The removed muscle mass was weighed for consistency. Fibrin hydrogels with a LM-111 concentration of 450 μm/mL (FBN450) were implanted to completely fill the defect site (~10 mm x 0.5 mm). The fascia was closed using coated Vicryl (5-0, Ethicon, Somerville, NJ) sutures in a simple interrupted manner to secure the implanted hydrogel, followed by closing the wound with skin staples and Prolene (5-0, Ethicon) sutures in a simple interrupted manner. Sustained-release buprenorphine (1 mg/kg) was administered subcutaneously (s.c.) in the nape of the neck for pain management at the time of surgery. A total of 16 animals were randomly divided into three experimental groups. The FBN450 sham group (control group) received no electrical stimulated eccentric training (EST) while the FBN450 + 100 Hz and the FBN450 + 150 Hz groups received EST at 100 Hz and 150 Hz, respectively.
Body weights were recorded daily for 72 hours post-surgery; animals lost ~5 – 10% of their body weight and slowly recovered over time. Animals recovered for 42 days and were euthanized via exsanguination and thoracotomy under anesthesia. TA muscles (n=5-6/group) were collected, weighed, and processed appropriately for histological and biomolecular analyses. All animals were included in the analysis. Investigators were blinded to group allocation and the animals were identified by an alphanumerical code.
2.3. Electrical Stimulation Protocol
In this work, we tetanically activated myofibers in vivo through the stimulation of the peroneal nerve while applying eccentric contractions because fibers must be actively contracting to experience injury, since inactive fibers are not damaged by lengthening that does not surpass the thick and thin filament overlap [17]. Electrical stimulation of the injured leg began 2 weeks post-injury and continued for 4 weeks, as shown in the experimental design (Figure 1). Briefly, rats were placed on a heated platform with their right foot secured to the foot pedal located on the shaft of the servomotor (Model 305b, Aurora Scientific, Aurora, Ontario, Canada). Two platinum electrodes were inserted subcutaneously on either side of the peroneal branch of the sciatic nerve. Optimal current (30 – 35 mA) was set to elicit maximal isometric twitch contractions (train frequency 1 Hz, pulse width 0.2 ms, duration 0.3 s). Twenty eccentric contractions were performed by stretching the anterior crural muscles from 19° of ankle dorsiflexion to 19° of ankle plantarflexion, while simultaneously stimulating the peroneal nerve with the optimal voltage at 100 or 150 Hz [15]. Each rat performed 4 sets of 5 eccentric contractions twice weekly for a total of 8 sessions. Ten seconds of rest were given between contractions, and 2 minutes of rest were given between sets. A sham group, with a unilateral VML injury treated with an FBN450 hydrogel, was used to determine the effects of anesthesia and electrode placement. For the sham group, the knee was clamped, and the electrodes were placed. However, the sham group neither received isometric twitch contractions nor underwent the electrical stimulation protocol.
2.4. In Vivo Functional Testing
Peak isometric torque was measured to assess functional recovery of the anterior crural muscles 42 days post-injury, as previously described [5,18]. Briefly, rats were placed on a heated platform with their right foot secured to the foot pedal on the servomotor shaft (Model 305b, Aurora Scientific). Two platinum electrodes were inserted subcutaneously on either side of the peroneal branch of the sciatic nerve. Optimal current (30 – 35 mA) was set to elicit maximal isometric twitch contractions (train frequency 1 Hz, pulse width 0.2 ms, duration 0.3 s). A force-frequency curve was generated by eliciting isometric contractions at 20, 60, 100, 150, and 200 Hz, with 1-minute rest intervals.
2.5. Histological and Immunohistochemistry Analysis
The TA muscle was cut axially at the defect site, and the top portion was frozen in 2-methylbutane (Fisher Scientific, Hampton, NH), which was super-cooled in a liquid nitrogen bath. Muscle cross-sections (15 µm) were stained with hematoxylin and eosin (H&E) as previously described [19,20,21]. Histology images were either captured at 10X magnification using a Zeiss Axiocam fluorescent microscope, or the slides were scanned to obtain composite images of the entire muscle section using Olympus BX614S (Saint Louis University, St. Louis, MO) or NanoZoomer 2.0 HT (Washington University in Saint Louis, St. Louis, MO).
TA muscles (n=5/group) were cryosectioned and stained with Picrosirius Red (PSR) Stain kit (Polysciences, Catalog no. 24901). The muscle samples were fixed in 10% formalin, rinsed with DI water, and stained with PSR for 60 minutes. Then, the samples were rinsed in HCl solution, rinsed again with DI water, and dehydrated in 70% ethanol for 30 seconds. A glass cover slip was secured over the samples with Cryoseal™. The samples were then imaged using polarized light microscopy with TerziCam Pro software, and the area fraction of total collagen, as well as collagen fractions stained red, yellow, and green, were determined using a custom MATLAB code.
Fiber typing of muscle sections was performed by staining muscle cross-sections using antibodies from the Developmental Studies Hybridoma Bank (DSHB, Iowa City, IA). Muscle sections were stained for fiber types 1 (1:20; BA.D5), 2A (1:50; SC.71), and 2B (1:20; BF.F3). Unstained fibers were identified as type 2X, and a laminin counterstain (1:100; ab11575) served as the fiber outline. Slides were scanned to obtain composite images of the entire muscle section using Olympus BX614S. The MyoQuant MATLAB program [22] for image analysis was used to quantify myofiber cross-sectional area (CSA) and fiber-type distribution (n = 5–6 muscles/group). In the FBN450 sham group, 5623 ± 435.3 (mean ± standard error of mean) fibers were detected and analyzed in the MyoQuant MATLAB program . In the FBN450 + 100 Hz and FBN450 + 150 Hz groups, 3628 ± 327.2 fibers and 5713±804.5 fibers were detected and analyzed, respectively.
2.6. Gene Expression Analysis
TA muscle (n=5-6/group), which contained the defect area and remaining muscle mass (~50 mg), was homogenized in 750 µL of Trizol LS reagent using a VWR 200 homogenizer, followed by RNA isolation and purification using the RNAeasy mini kit (Qiagen, Hilden, Germany). The yield of RNA was quantified using the NanoDrop 2000c Spectrophotometer (Thermo Scientific) and optical density 260/280 and 230/260 ratios were used to verify purity. RNA was reverse transcribed using iScript Reverse Transcriptase Supermix (Bio-Rad). Primer sets were synthesized by Millipore Sigma oligos design tool (Table 1). Aliquots (2 μl) of cDNA were amplified in triplicate with 300 nM forward/reverse primers using SYBR GreenER (Invitrogen) on a Bio-Rad CFX96 thermal cycler (Bio-Rad). Gene expression was normalized to 18S (reference gene) to determine the ΔCT value. Expression levels for each mRNA transcript were determined by the 2-ΔΔCT method by normalizing each group to uninjured contralateral control muscles.
2.7. Statistical Analysis
GraphPad Prism 9 was used for all statistical analyses and sample-sizes were decided based on previous studies [5,15]. Data are presented as a mean ± standard error of the mean (SEM). An unpaired t-test, ordinary one-way analysis of variance (ANOVA, or two-way ANOVA (treatment x time) was used when appropriate to determine if there was a significant interaction or main effect between variables. The treatment groups included FBN450 sham, FBN450+100 Hz, and FBN450+150 Hz. A Fisher’s least significant difference post hoc comparison was performed to identify significance with p < 0.05.
3. Results
3.1. Muscle Mass
Muscle sections stained with H&E (Figure 2A) show increased cellular infiltration into the VML defect in the EST groups relative to the hydrogel alone group. Qualitatively, upon removal of the muscles during the time of sacrifice, muscles in the FBN450 + 100 Hz group and FBN450 + 150 Hz group appeared to have an indented groove at the site of the VML injury. TA muscle mass (Figure 2B) normalized to body weight 42 days post-injury (ANOVA, p = 0.3141) shows no differences between treatment groups following implantation of a FBN450 hydrogel with or without implementation of the electrical stimulation program at 100 Hz or 150 Hz for four weeks.
3.2. Eccentric Torque and Muscle Strength
Eccentric torque of the muscle was recorded during each exercise session or bout (Figure 3A). A progressive increase in eccentric torque was observed with the implementation of the 100 Hz and 150 Hz EST programs following FBN450 hydrogel implantation. The change in average eccentric torque (Figure 3B; Unpaired t-test, p = 0.4332) between bout eight and bout one was 8.462 Hz and 12.24 Hz for the 100 Hz and 150 Hz training programs, respectively.
Functional recovery of the muscle was assessed by measuring peak isometric torque production at 6 weeks post-injury, after implantation of an FBN450 hydrogel and implementation of EST for four weeks. Torque frequency curves (Figure 3C) were generated using peak isometric torque measured between 20 and 200 Hz. The peak isometric torque at each frequency was normalized to the animal's body weight. The results showed that all VML-injured muscles (irrespective of treatment) produced significantly lower torque when stimulated between 60-200 Hz compared to the uninjured (control) muscles (Interaction, p = 0.1949, stimulation factor, p<0.0001, Treatment factor, p<0.0001). At 200 Hz stimulation frequency, the FBN450 sham group produced significantly higher torque relative to the VML untreated group (p=0.0419).
3.3. Myofiber Cross-Sectional Area
Muscle sections stained for specific myofiber types and outlined with laminin were used to quantify the myofiber count, cross-sectional area (CSA), and to determine the number of slow-twitch versus fast-twitch myofibers (Figure 4). The mean myofiber CSA was statistically similar (One-way ANOVA, p =0.1967) between treatment groups (Figure 5A). The myofiber CSA distribution analysis (Figure 5B; Interaction, p = 0.0112) revealed a smaller percentage of myofibers in the FBN450 sham group in the <500 µm2 size when compared to both the FBN450 + 100 Hz (p < 0.0001) and FBN450 + 150 Hz (p = 0.0007). The FBN450 + 100 Hz also had a greater percentage of myofibers in <500 mm2 size range when compared to the FBN450 + 150 Hz (p = 0.0227) group.
Fiber type-specific CSA analysis revealed a decrease in the percentage of fast-twitch glycolytic type 2B myofibers in the FBN450 + 150 Hz group (Figure 6A; Interaction, p = 0.0140) when compared to the FBN450 sham group (p = 0.0024) and FBN450 + 100 Hz group (p = 0.0447). The CSA analysis revealed no changes in the percentage of either type 1, type 2A, or type 2X myofibers, irrespective of treatment. The mean CSA (Interaction, p = 0.0401) of type 2B myofibers was also significantly lower in the electrically stimulated muscles, FBN450 + 100 Hz (p = 0.0015) and FBN450 + 150 Hz (p = 0.0235), compared to the FBN450 sham group (Figure 6B). Fiber type distribution analysis showed no differences in type 1 myofibers (Figure 7A). However, FBN450 + 100 Hz group had a greater percentage of both small diameter (<500 µm2) slow-twitch oxidative type 2A myofibers (Interaction, p=0.0028; Figure 7B) and fast-twitch glycolytic type 2X myofibers (Interaction, p=0.0030; Figure 7C) compared to the FBN450 sham group and FBN450 + 150 Hz group. The FBN450 sham group had significantly higher percentage of large-sized (>2000 µm2) myofibers compared to both FBN450 + 100 Hz and FBN450 + 150 Hz groups (Figure 7D).
3.4. Collagen Deposition and Gene Expression Analysis
Muscle cross-sections stained with PSR and visualized under polarized light (Figure 8A) revealed that total collagen remained similar between groups (Figure 8B; One-way ANOVA, p =0.2956). A significant reduction in densely packed collagen fibers (red) [23] within the FBN450+100 Hz group compared to both the FBN450 sham and FBN450+150 Hz groups (Figure 8C; Interaction p=0.0082, packing p<0.0001). However, no significant differences were observed in the deposition of intermediate (yellow) or immature/loosely packed (green) collagen fibers across any treatment groups (p>0.9999).
Gene expression analysis was performed to investigate the biomolecular response of FBN450-treated skeletal muscle to EST at 150 Hz. Results showed significantly increased expression of CCR7 (Figure 9A), which is an M1 macrophage phenotype-associated marker in both the FBN450 hydrogel-treated sham group as well as the combined FBN450+150 Hz EST group. The application of EST further increased CCR7 expression (One-way ANOVA, p =<0.0001). The gene expression of CD163 (Figure 9B; One-way ANOVA, p =0.0033), an M2 macrophage-associated marker, was only elevated in the FBN450+150 Hz EST group. Although the expression was 16-fold and 9-fold higher in the FBN450 hydrogel-treated sham group and the FBN450+150Hz-treated EST group, statistically significant differences were not observed in the gene expression of TNF-α (Figure 9C; One-way ANOVA, p =0.0545). Both an early-stage myogenic marker, MyoD (Figure 9D; One-way ANOVA, p =0.1000), and late-stage myogenic marker, eMHC (Figure 9E; One-way ANOVA, p =0.1031) showed no differences between groups. The gene expression of collagen 1 (Figure 9F; One-way ANOVA, p <0.0001) was found to be significantly elevated in both FBN450 (~24 fold) and FBN450+150 Hz EST (~32 fold) groups.
4. Discussion
The objective of this study is to investigate the efficacy of combining a regenerative therapy, FBN450 hydrogel, with a rehabilitation program, EST, for functional repair of VML in a rodent model. Although FBN450 [5] and EST [15] have previously demonstrated improved regeneration and function when used individually, the combined application of these therapies in this study unexpectedly hindered muscle recovery.
The lack of synergistic improvement in the hydrogel plus EST group, despite the well-documented benefits of EST in untreated [15] and biosponge-treated [8] VML models, suggests a fundamental breakdown in the regenerative rehabilitation paradigm. In previous studies, we have observed a lack of integration between the hydrogel and the surrounding muscle tissue [5]. Therefore, by remaining physically separated from the surrounding musculature, the hydrogel likely created a structural discontinuity that might have prevented the seamless transfer of mechanical cues. This is most clearly evidenced by the significant decrease in the percentage of Type 2B myofibers and in cross-sectional area (CSA). Type 2B fibers are highly glycolytic and the most sensitive to mechanical unloading [24]. Therefore, their atrophy following the combined application of hydrogel and EST suggests that the hydrogel shielded the surrounding musculature from mechanical stress. Rather than the muscle experiencing the mechanical loading of eccentric exercise, the hydrogel may have absorbed or dampened these forces, effectively keeping the surrounding musculature in a state of functional disuse.
This mechanical shielding appears to have fundamentally altered the cellular response to rehabilitation. While hydrogel and EST can separately and individually drive myogenesis [5,15], their combined application led to a significant elevation in Collagen 1 gene expression without increased myogenic gene expression. Interestingly, while Collagen 1 gene expression was upregulated, total collagen protein levels remained similar across groups. This suggests a state of high-turnover remodeling where fibrotic signaling is accelerated, but potentially coupled with an equal rate of degradation, resulting in a disorganized extracellular matrix rather than functional tissue bridging.
The immunological profile of the hydrogel + EST group further explains this regenerative failure. The simultaneous elevation of M1-like (i.e., CCR7) and M2-like (i.e., CD163) macrophage markers suggests both a heightened and stalled inflammatory response. In a healthy healing trajectory, a clear transition from a pro-inflammatory M1 phase to a pro-regenerative M2 phase is required [25,26]. The persistent presence of both markers indicates a chronic foreign-body response, likely exacerbated by the hydrogel's mechanical motion during EST. We speculate that interfacial micromotion between the non-integrated hydrogel and the host tissue led to recurrent micro-trauma, which further drove pro-inflammatory signaling. This persistent inflammatory signaling is known to be antagonistic to myogenesis and can actively drive myofiber atrophy.
Ultimately, these results reveal a selective synergy between biomaterials and eccentric exercise. While the biosponge scaffolds used in previous studies likely allowed for better load-sharing and cellular infiltration [8], the FBN450 hydrogel lacked the mechanical and structural features necessary for a synergistic effect with EST. Our findings demonstrate that synergy is not an inherent or guaranteed property of combining a scaffold with exercise. Instead, it is an emergent outcome dependent on the biomaterial’s mechanical and physical properties with the rehabilitative stimulus. If the biomaterial fails to integrate or share the mechanical load, as seen with the FBN450 hydrogel, the relationship between the scaffold and exercise can become antagonistic, leading to activation of inflammatory and fibrotic pathways. This highlights a critical need to engineer biomaterials that are specifically tuned to synchronize with rehabilitation. In fact, many studies have successfully combined biomaterials with various rehabilitation approaches in both humans and animal models [13].
Furthermore, we speculate that the timing of the intervention likely turned the eccentric training regimen into a secondary insult. At 14 days post-injury, the hydrogel was only partially present at the defect site [5]. We posit that the intense EST program may have accelerated the remodeling and degradation of the biomaterial before functional tissue bridging could occur. Consequently, the defect site became a void, leaving the injured muscle vulnerable to an intense training regimen that aggravated an already traumatic and chronic injury. In contrast, the FBN450 sham group, undisturbed by premature mechanical loading via EST, had ample time to elicit its regenerative capabilities, ultimately resulting in improved function. These findings highlight the necessity of a synchronized approach to recovery, where the intensity and timing of rehabilitation are calibrated to the structural integrity and biological stage of the implanted scaffold.
The current study is not without limitations, particularly regarding the intervention's fixed temporal window. While we hypothesized that the 14-day post-injury time point would represent a viable therapeutic window, the lack of real-time monitoring of the hydrogel’s structural integrity remains a constraint. Future research should use non-invasive imaging modalities (such as ultrasound) to track the hydrogel's degradation kinetics and host-tissue integration longitudinally [27]. This would allow for a more objective determination of when the scaffold has successfully transitioned from a passive filler to an integrated, load-bearing conduit capable of withstanding the mechanical stresses of EST.
Building upon the findings of this study, several future directions are warranted to optimize the selective synergy between the FBN450 hydrogel and EST. A critical next step is to investigate whether the electrical stimulation protocol should be delayed, perhaps beginning at 21 days post-injury rather than 14 days. This extended undisturbed period might provide the regenerative therapy ample opportunity to fully integrate with the remaining musculature and establish a robust cellular niche before being subjected to mechanical strain due to EST. By allowing the hydrogel to elicit its full regenerative capacity and stabilize the defect site, a later introduction of EST may yield the functional improvements that were absent in the current study.
Conversely, while an earlier introduction of the training protocol could, in theory, provide more exercise sessions and lead to greater strength gains, previous studies suggest that this approach should be handled with caution [28,29]. Starting EST too soon after injury may inadvertently accelerate remodeling and premature hydrogel degradation, thereby creating a void at the defect site during a critical phase of myogenesis. This highlights a complex trade-off in regenerative rehabilitation, where the muscle requires early mechanical stimulus to prevent atrophy, but the biomaterial requires stability to facilitate repair. Future studies should therefore focus on identifying the goldilocks zone, an optimal time window in which the mechanical properties of the scaffold are sufficient to support load and the biological state of the muscle is primed to receive a hypertrophic stimulus provided by exercise.
Collectively, our findings reveal that synergy in regenerative rehabilitation is a conditional phenomenon, dependent on a match between the biomaterial’s properties and the intensity and timing of the rehabilitative stimulus. Successful recovery requires a synchronized approach to activate myogenesis rather than fibrotic and inflammatory cascades.
Author Contributions
KG conceived the study. NZ, JA, HC, PS, MV, and KG performed experiments and collected data. NZ, JA, and PS performed statistical analysis and prepared figures. NZ generated the first draft of the manuscript. KG revised and edited the manuscript. All authors reviewed the manuscript and approved the final version for publication.
Funding
This work was supported by a grant from the Department of Defense (Applied Research Award– PRORP) W81XWH-18-1-0251 awarded to K.G.
Institutional Review Board Statement
All animal experiments were reviewed and approved by the Institutional Animal Care and Use Committee at Saint Louis University (IACUC protocol# 2645, approved date: 04/05/2018).
Informed Consent Statement
Not Applicable.
Data Availability Statement
The original contributions presented in the study are included in the article, further inquiries can be directed to the corresponding author.
Conflicts of Interest
The authors declare no conflict of interest.
References
- B.F. Grogan, J.R. Hsu, Volumetric muscle loss, J Am Acad Orthop Surg 19 Suppl 1 (2011) S35-7.
- B.T. Corona, J.C. Rivera, J.C. Owens, J.C. Wenke, C.R. Rathbone, Volumetric Muscle Loss Leads To Permanent Disability Following Extremity Trauma J Rehabil Res Dev In Press (2015).
- Greising, S.M.; Rivera, J.C.; Goldman, S.M.; Watts, A.; Aguilar, C.A.; Corona, B.T. Unwavering Pathobiology of Volumetric Muscle Loss Injury. Sci. Rep. 2017, 7, 13179. [CrossRef]
- Corona, B.T.; Rivera, J.C.; Owens, J.G.; Wenke, J.C.; Rathbone, C.R. Volumetric muscle loss leads to permanent disability following extremity trauma. J. Rehabil. Res. Dev. 2015, 52, 785–792. [CrossRef]
- Ziemkiewicz, N.; Hilliard, G.M.; Dunn, A.J.; Madsen, J.; Haas, G.; Au, J.; Genovese, P.C.; Chauvin, H.M.; West, C.; Paoli, A.; et al. Laminin-111-Enriched Fibrin Hydrogels Enhance Functional Muscle Regeneration Following Trauma. Tissue Eng. Part A 2022, 28, 297–311. [CrossRef]
- Marcinczyk, M.; Dunn, A.; Haas, G.; Madsen, J.; Scheidt, R.; Patel, K.; Talovic, M.; Garg, K. The Effect of Laminin-111 Hydrogels on Muscle Regeneration in a Murine Model of Injury. Tissue Eng. Part A 2019, 25, 1001–1012. [CrossRef]
- Marcinczyk, M.; Elmashhady, H.; Talovic, M.; Dunn, A.; Bugis, F.; Garg, K. Laminin-111 enriched fibrin hydrogels for skeletal muscle regeneration. Biomaterials 2017, 141, 233–242. [CrossRef]
- Johnson, D.; Tobo, C.; Au, J.; Nagarapu, A.; Ziemkiewicz, N.; Chauvin, H.; Robinson, J.; Shringarpure, S.; Tadiwala, J.; Brockhouse, J.; et al. Combined regenerative rehabilitation improves recovery following volumetric muscle loss injury in a rat model. J. Biomed. Mater. Res. Part B: Appl. Biomater. 2024, 112, e35438–e35438. [CrossRef]
- Ambrosio, F.; Wolf, S.L.; Delitto, A.; Fitzgerald, G.K.; Badylak, S.F.; Boninger, M.L.; Russell, A.J. The Emerging Relationship Between Regenerative Medicine and Physical Therapeutics. Phys. Ther. 2010, 90, 1807–1814. [CrossRef]
- Ambrosio, F.; Russell, A. Regenerative rehabilitation: A call to action. J. Rehabilitation Res. Dev. 2010, 47. [CrossRef]
- C. Perez-Terzic, M.K. Childers, Regenerative rehabilitation: a new future?, Am J Phys Med Rehabil 93(11 Suppl 3) (2014) S73-8.
- Rando, T.A.; Ambrosio, F. Regenerative Rehabilitation: Applied Biophysics Meets Stem Cell Therapeutics. Cell Stem Cell 2018, 22, 306–309. [CrossRef]
- Garg, K.; Brockhouse, J.; McAndrew, C.M.; Reiter, A.J.; Owens, J.G.; Mueller, R.J.; Pena, G.; Ridolfo, A.; Johnson, D.L. Regenerative rehabilitation: Navigating the gap between preclinical promises and clinical realities for treating trauma-induced volumetric muscle loss. J. Physiol. 2025, 603, 7421–7439. [CrossRef]
- Greising, S.M.; Dearth, C.L.; Corona, B.T. Regenerative and Rehabilitative Medicine: A Necessary Synergy for Functional Recovery from Volumetric Muscle Loss Injury. Cells Tissues Organs 2016, 202, 237–249. [CrossRef]
- Ziemkiewicz, N.; Au, J.; Chauvin, H.M.; Garg, K. Electrically stimulated eccentric contraction training enhances muscle mass, function, and size following volumetric muscle loss. J. Orthop. Res. 2023, 41, 2588–2598. [CrossRef]
- A Standardized Rat Model of Volumetric Muscle Loss Injury for the Development of Tissue Engineering Therapies, BioResearch Open Access 1(6) (2012) 280-290.
- Vijayan, K.; Thompson, J.L.; Norenberg, K.M.; Fitts, R.H.; Riley, D.A. Fiber-type susceptibility to eccentric contraction-induced damage of hindlimb-unloaded rat AL muscles. J. Appl. Physiol. 2001, 90, 770–776. [CrossRef]
- Hurtgen, B.J.; Henderson, B.E.P.; Ward, C.L.; Goldman, S.M.; Garg, K.; McKinley, T.O.; Greising, S.M.; Wenke, J.C.; Corona, B.T. Impairment of early fracture healing by skeletal muscle trauma is restored by FK506. BMC Musculoskelet. Disord. 2017, 18, 253. [CrossRef]
- Garg, K.; Ward, C.L.; Rathbone, C.R.; Corona, B.T. Transplantation of devitalized muscle scaffolds is insufficient for appreciable de novo muscle fiber regeneration after volumetric muscle loss injury. Cell Tissue Res. 2014, 358, 857–873. [CrossRef]
- Garg, K.; Corona, B.T.; Walters, T.J. Losartan administration reduces fibrosis but hinders functional recovery after volumetric muscle loss injury. J. Appl. Physiol. 2014, 117, 1120–1131. [CrossRef]
- Hurtgen, B.J.; Ward, C.L.; Leopold Wager, C.M.; Garg, K.; Goldman, S.M.; Henderson, B.E.P.; McKinley, T.O.; Greising, S.M.; Wenke, J.C.; Corona, B.T. Autologous minced muscle grafts improve endogenous fracture healing and muscle strength after musculoskeletal trauma. Physiol. Rep. 2017, 5, e13362. [CrossRef]
- Madsen, J.; Haas, G.; Dunn, A.; Ziemkiewicz, N.; Johnson, D.; Garg, K. MyoQuant: An optimized image analysis algorithm for quantitative analysis of skeletal muscle fibers. MethodsX 2025, 15, 103645. [CrossRef]
- Smith, L.R.; Barton, E.R. Collagen content does not alter the passive mechanical properties of fibrotic skeletal muscle in mdx mice. Am. J. Physiol. Physiol. 2014, 306, C889–C898. [CrossRef]
- Schiaffino, S.; Reggiani, C. Fiber Types in Mammalian Skeletal Muscles. Physiol. Rev. 2011, 91, 1447–1531. [CrossRef]
- Badylak, S.F.; Valentin, J.E.; Ravindra, A.K.; McCabe, G.P.; Stewart-Akers, A.M. Macrophage Phenotype as a Determinant of Biologic Scaffold Remodeling. Tissue Eng. Part A 2008, 14, 1835–1842. [CrossRef]
- Tidball, J.G.; Villalta, S.A. Regulatory interactions between muscle and the immune system during muscle regeneration. Am. J. Physiol. Regul. Integr. Comp. Physiol. 2010, 298, R1173–R1187. [CrossRef]
- Dziki, J.; Badylak, S.; Yabroudi, M.; Sicari, B.; Ambrosio, F.; Stearns, K.; Turner, N.; Wyse, A.; Boninger, M.L.; Brown, E.H.P.; et al. An acellular biologic scaffold treatment for volumetric muscle loss: results of a 13-patient cohort study. npj Regen. Med. 2016, 1, 16008. [CrossRef]
- Aurora, A.; Roe, J.L.; Corona, B.T.; Walters, T.J. An acellular biologic scaffold does not regenerate appreciable de novo muscle tissue in rat models of volumetric muscle loss injury. Biomaterials 2015, 67, 393–407. [CrossRef]
- Quarta, M.; Cromie, M.; Chacon, R.; Blonigan, J.; Garcia, V.; Akimenko, I.; Hamer, M.; Paine, P.; Stok, M.; Shrager, J.B.; et al. Bioengineered constructs combined with exercise enhance stem cell-mediated treatment of volumetric muscle loss. Nat. Commun. 2017, 8, 15613. [CrossRef]
Figure 1.
Schematic representaction of the experimental design.
Figure 2.
(A) Muscle sections were stained with H&E at 42-days post-injury. The defect region is shown in the magnified images. (B) The muscle mass of the VML injured TA muscles was measured on 42-days post-injury (n=5 – 6 muscles/group). No significant differences were observed between the different groups. Data Analysis was performed using two-way ANOVA.
Figure 3.
Eccentric torque increases with each bout. (A) The Δ eccentric torque between bout 8 and bout 1 is reported, showing no differences between the 100 Hz and 150 Hz program when a hydrogel is introduced. The blue and green dotted lines represent the Δ eccentric torque for untreated VML injured muscles following EST training for 4 weeks. Data analysis was performed using an impaired t-test. (B) Average eccentric torque reported at each bout. Data analysis was performed using two-way ANOVA. (C) Peak isometric torque production was measured, and raw data was collected and normalized to body weight. The FBN450 Sham group resulted in the highest recovery in torque production compared to the FBN450 + 100 Hz and FBN450 + 150 Hz. Data analysis was performed using two-way ANOVA. Significance between FBN450 Sham group and FBN450 + 150 Hz is indicated by * (p<0.05). The symbol (#) indicates difference from all other groups.
Figure 4.
Muscle sections were stained for various fiber types and laminin (n = 5 – 6 muscles/group) at day 42 post-injury.
Figure 4.
Muscle sections were stained for various fiber types and laminin (n = 5 – 6 muscles/group) at day 42 post-injury.
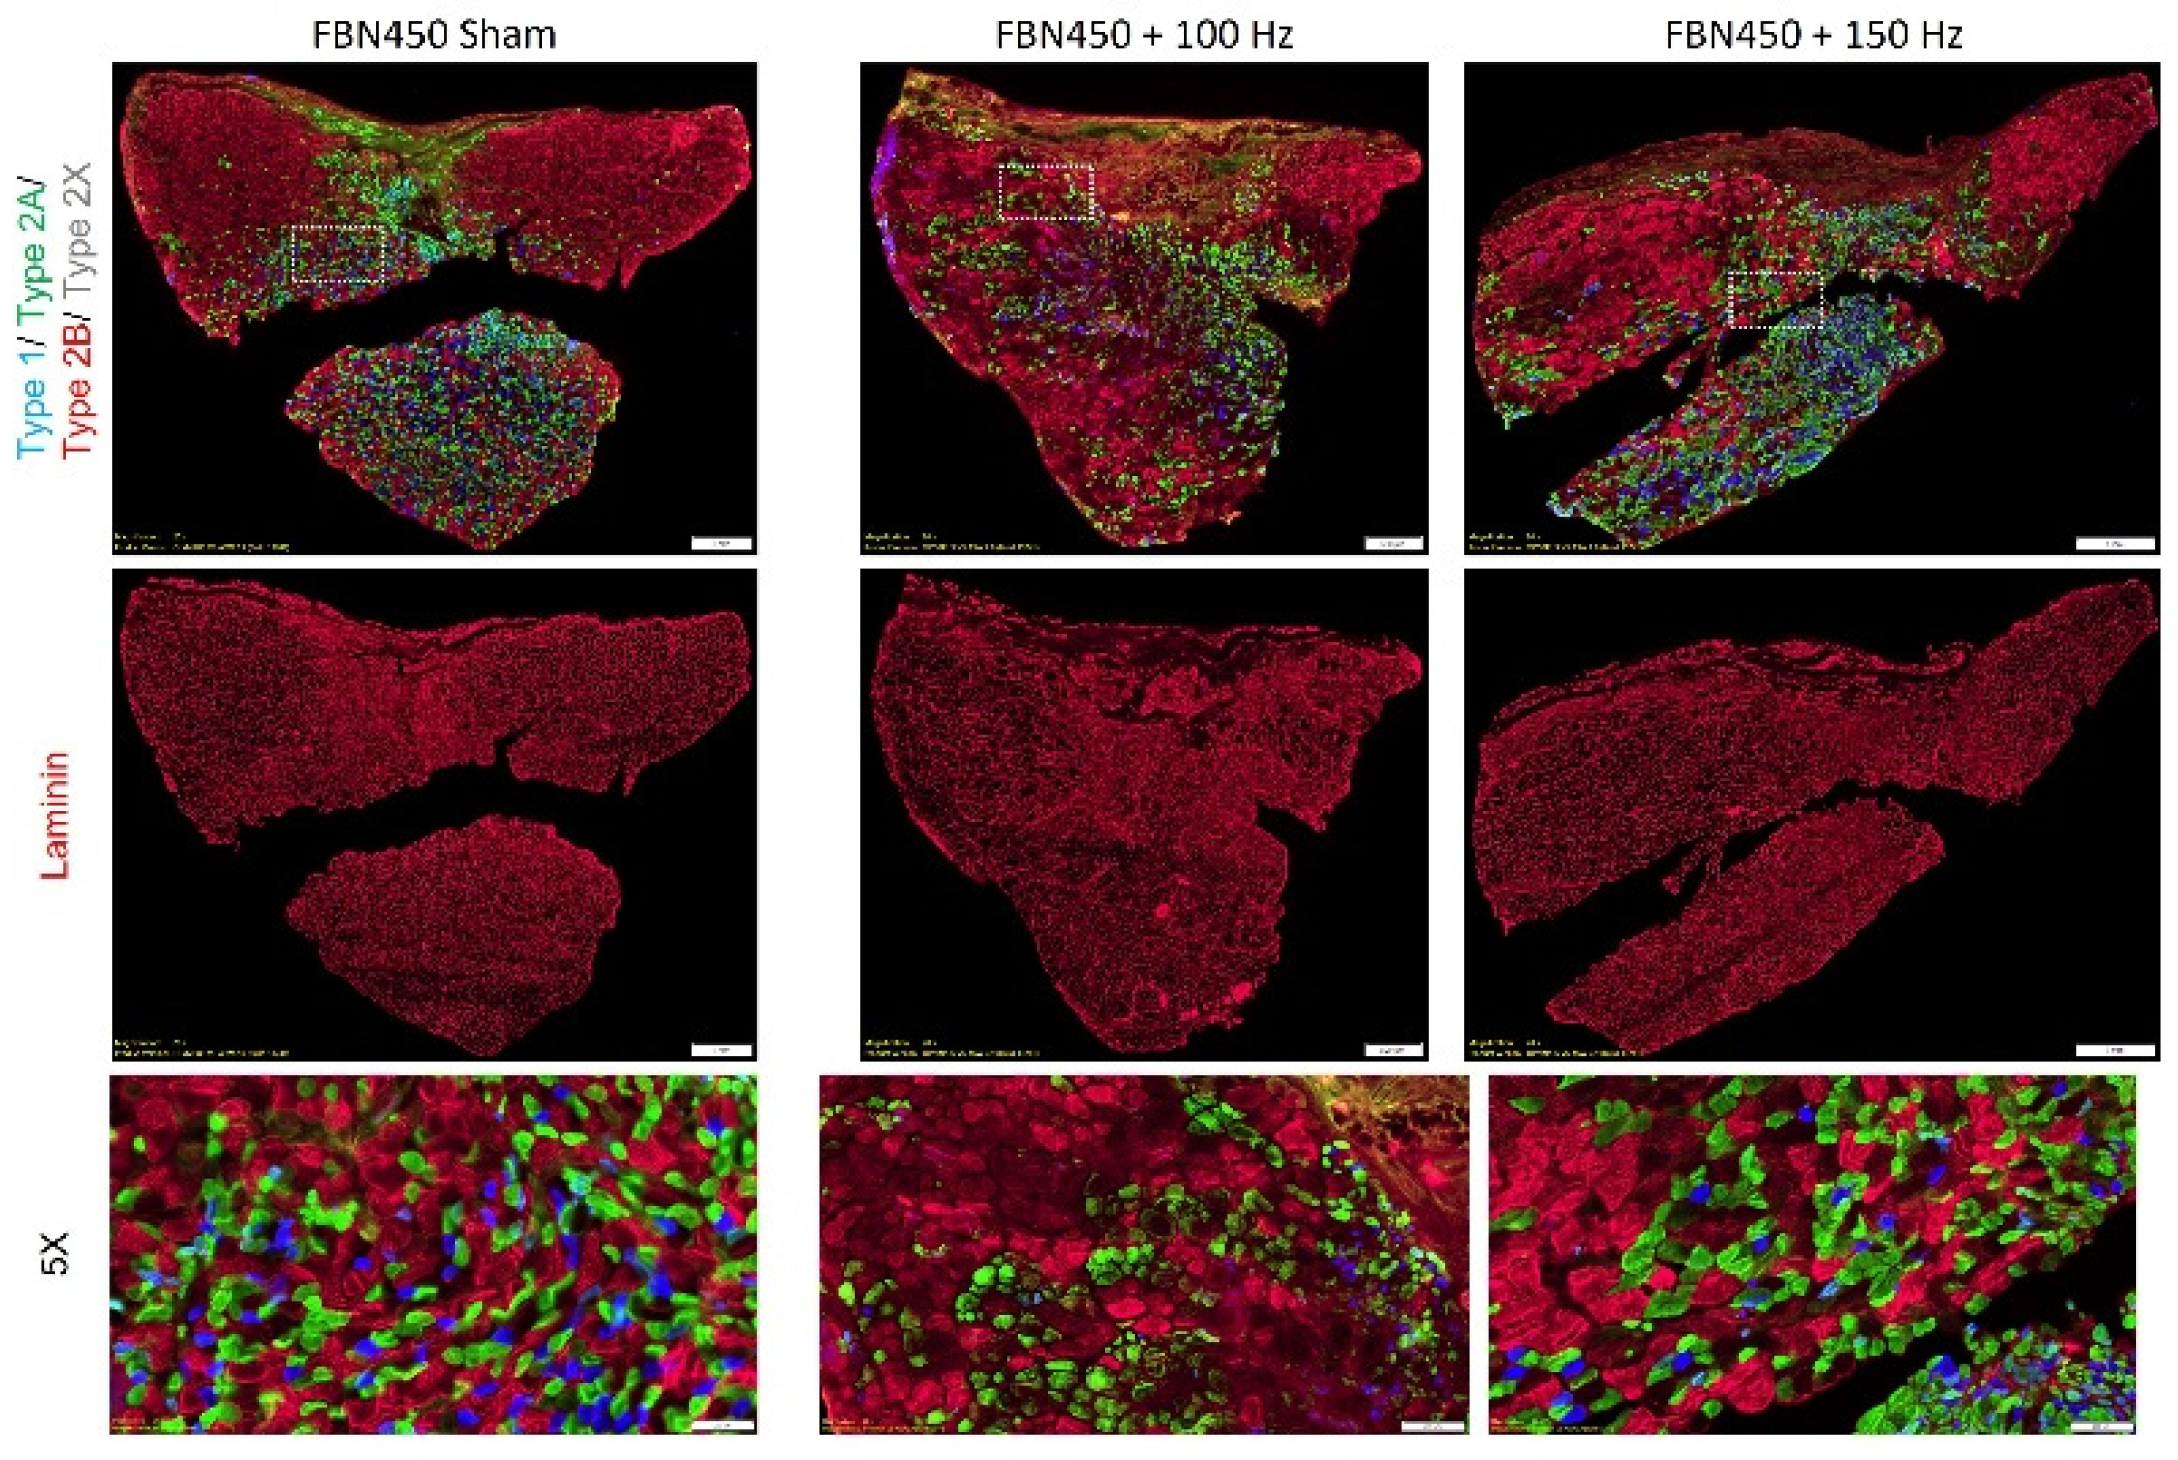
Figure 5.
The mean fiber cross-sectional area (CSA) (A) and global fiber size distribution (B) were quantified using a custom designed image analysis MATLAB program. The CSA distribution analysis showed that myofibers in the size range <500 μm2 were increased in the FBN450 treated muscles following electrical stimulation training at 100 Hz and 150 Hz compared to the FBN450 Sham muscles. Data analysis for the mean fiber CSA was performed by an ordinary one-way ANOVA. Data analysis for the fiber size distribution was performed using a two-way ANOVA. Significance between groups is indicated by * (p<0.05).
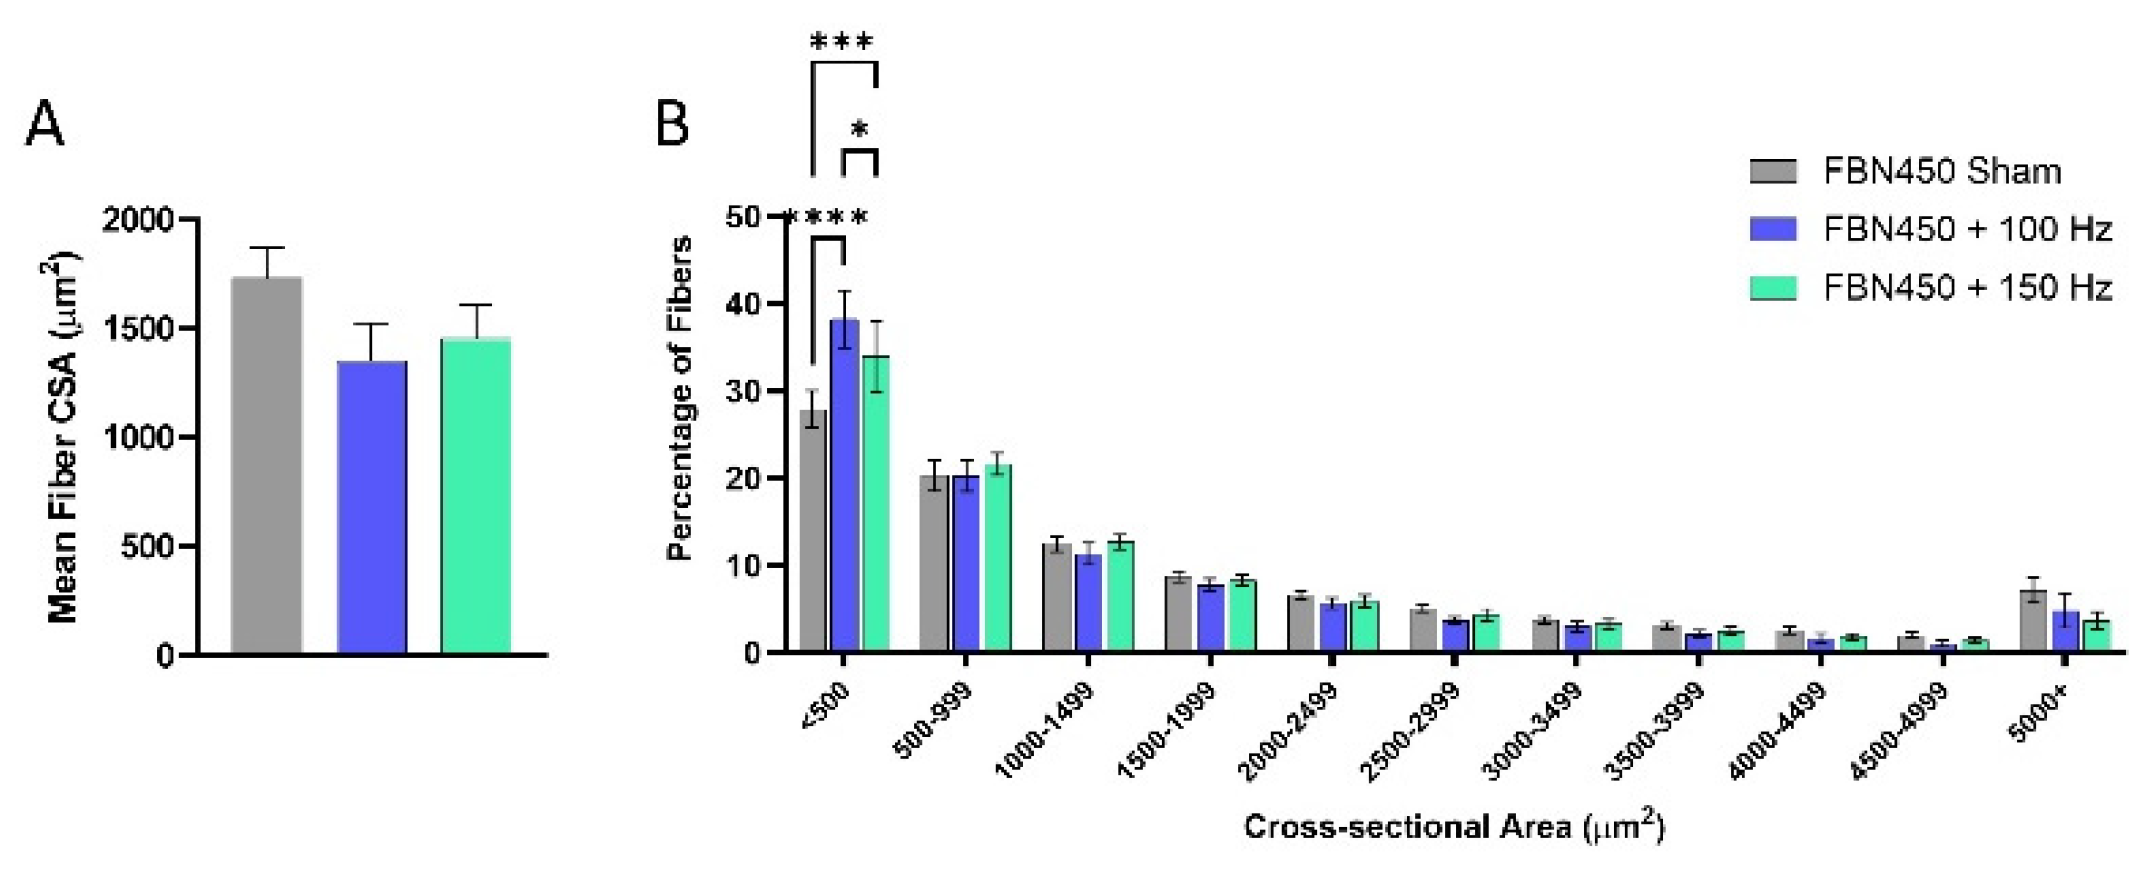
Figure 6.
The percentage and mean fiber CSA of 2B fibers increased in the FBN450 Sham group. (A) The percentage of fiber type specific fibers in each treatment group and the (B) fiber type specific mean fiber CSA was determined using a custom-designed image analysis MATLAB program. Data analysis was performed using a two-way ANOVA. Significance between groups is indicated by * (p<0.05).
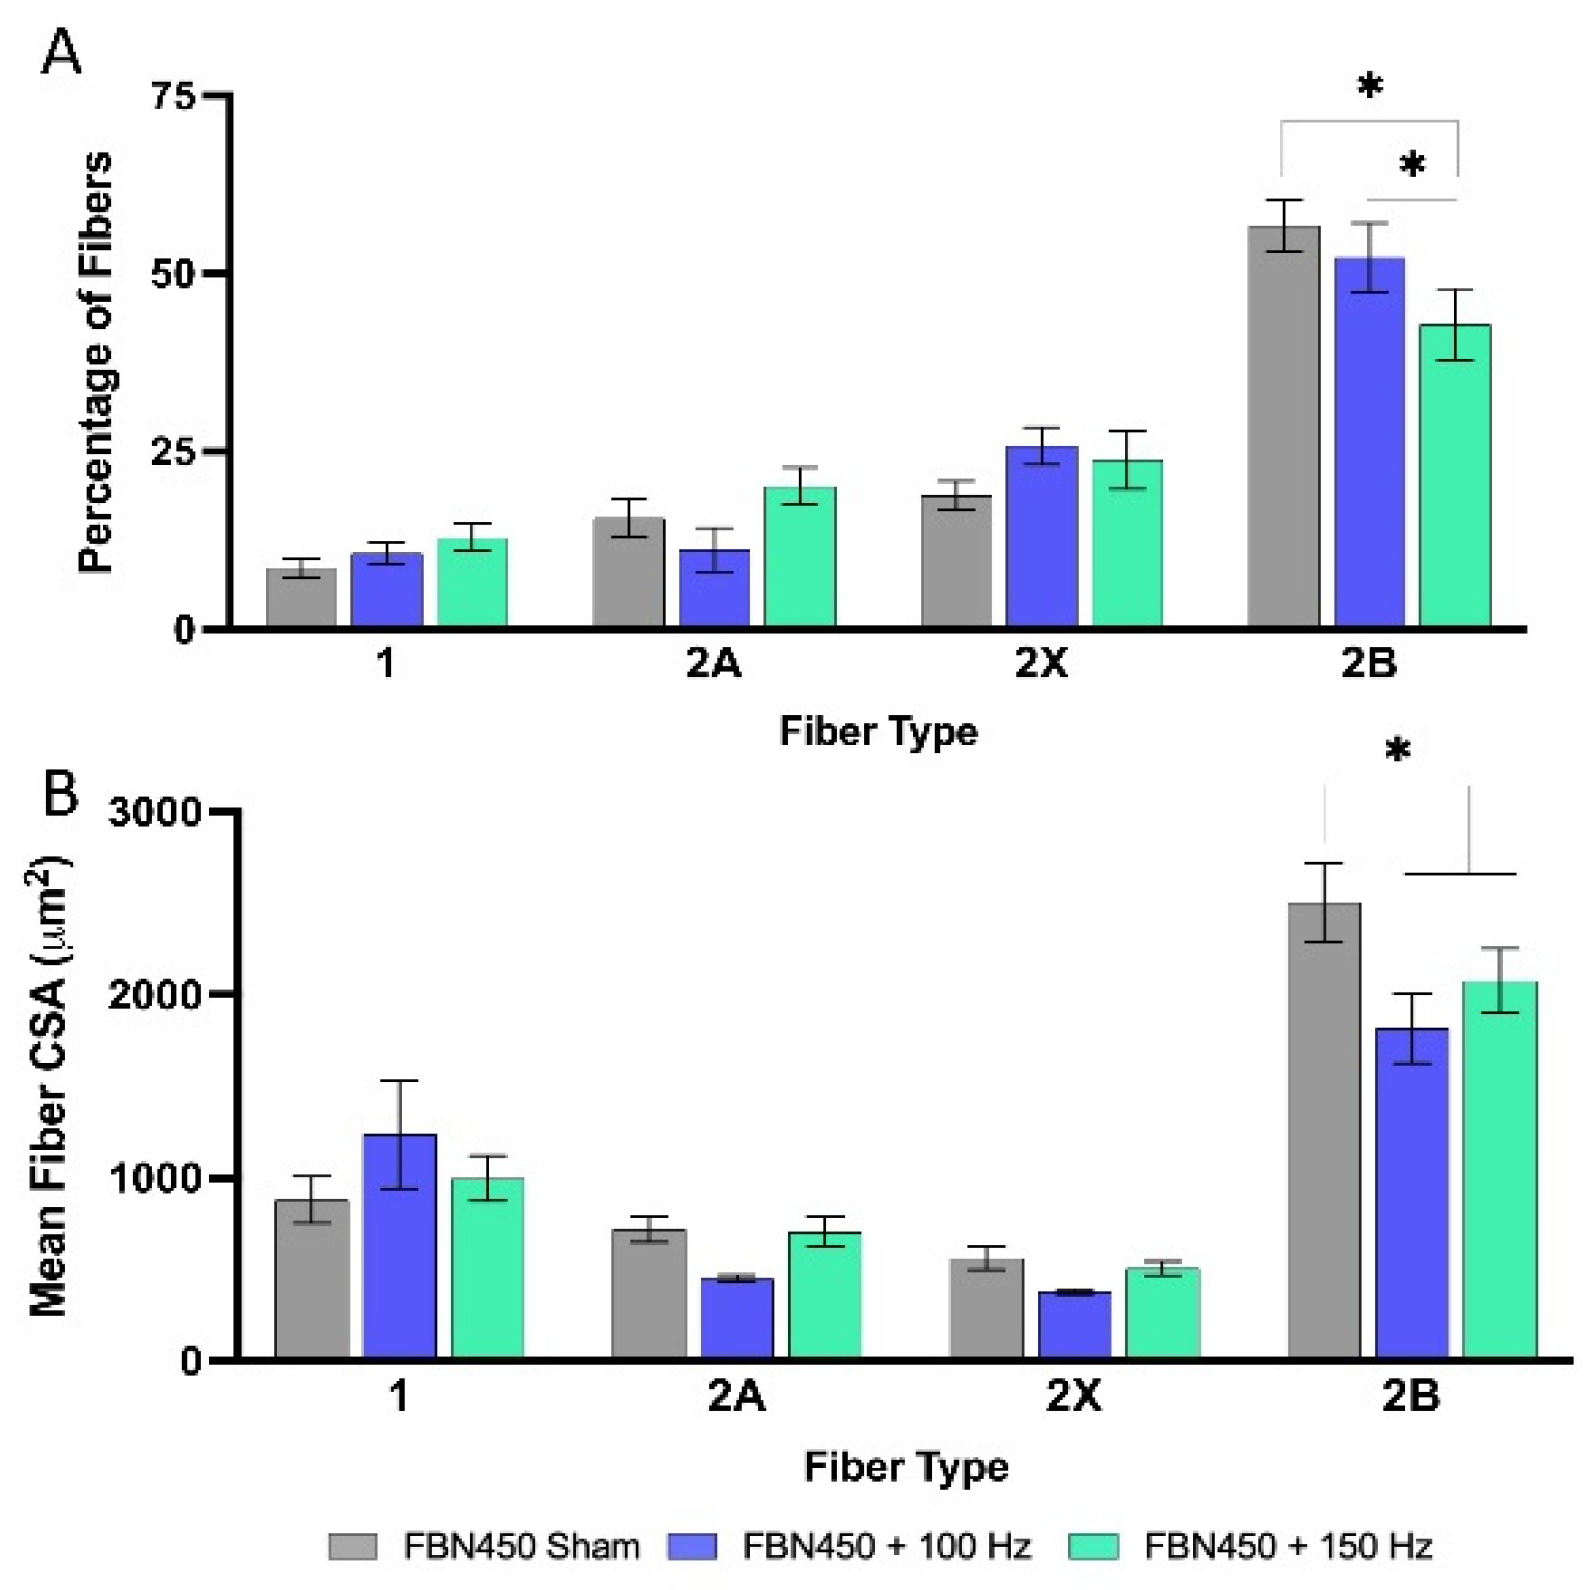
Figure 7.
Fiber size distributions for (A) type 1, (B) type 2A, (C) type 2B, and (D) type 2X were quantified using MyoQuant MATLAB program. Data analysis was performed using a two-way ANOVA. Significance between groups is indicated by * (p<0.05).
Figure 7.
Fiber size distributions for (A) type 1, (B) type 2A, (C) type 2B, and (D) type 2X were quantified using MyoQuant MATLAB program. Data analysis was performed using a two-way ANOVA. Significance between groups is indicated by * (p<0.05).
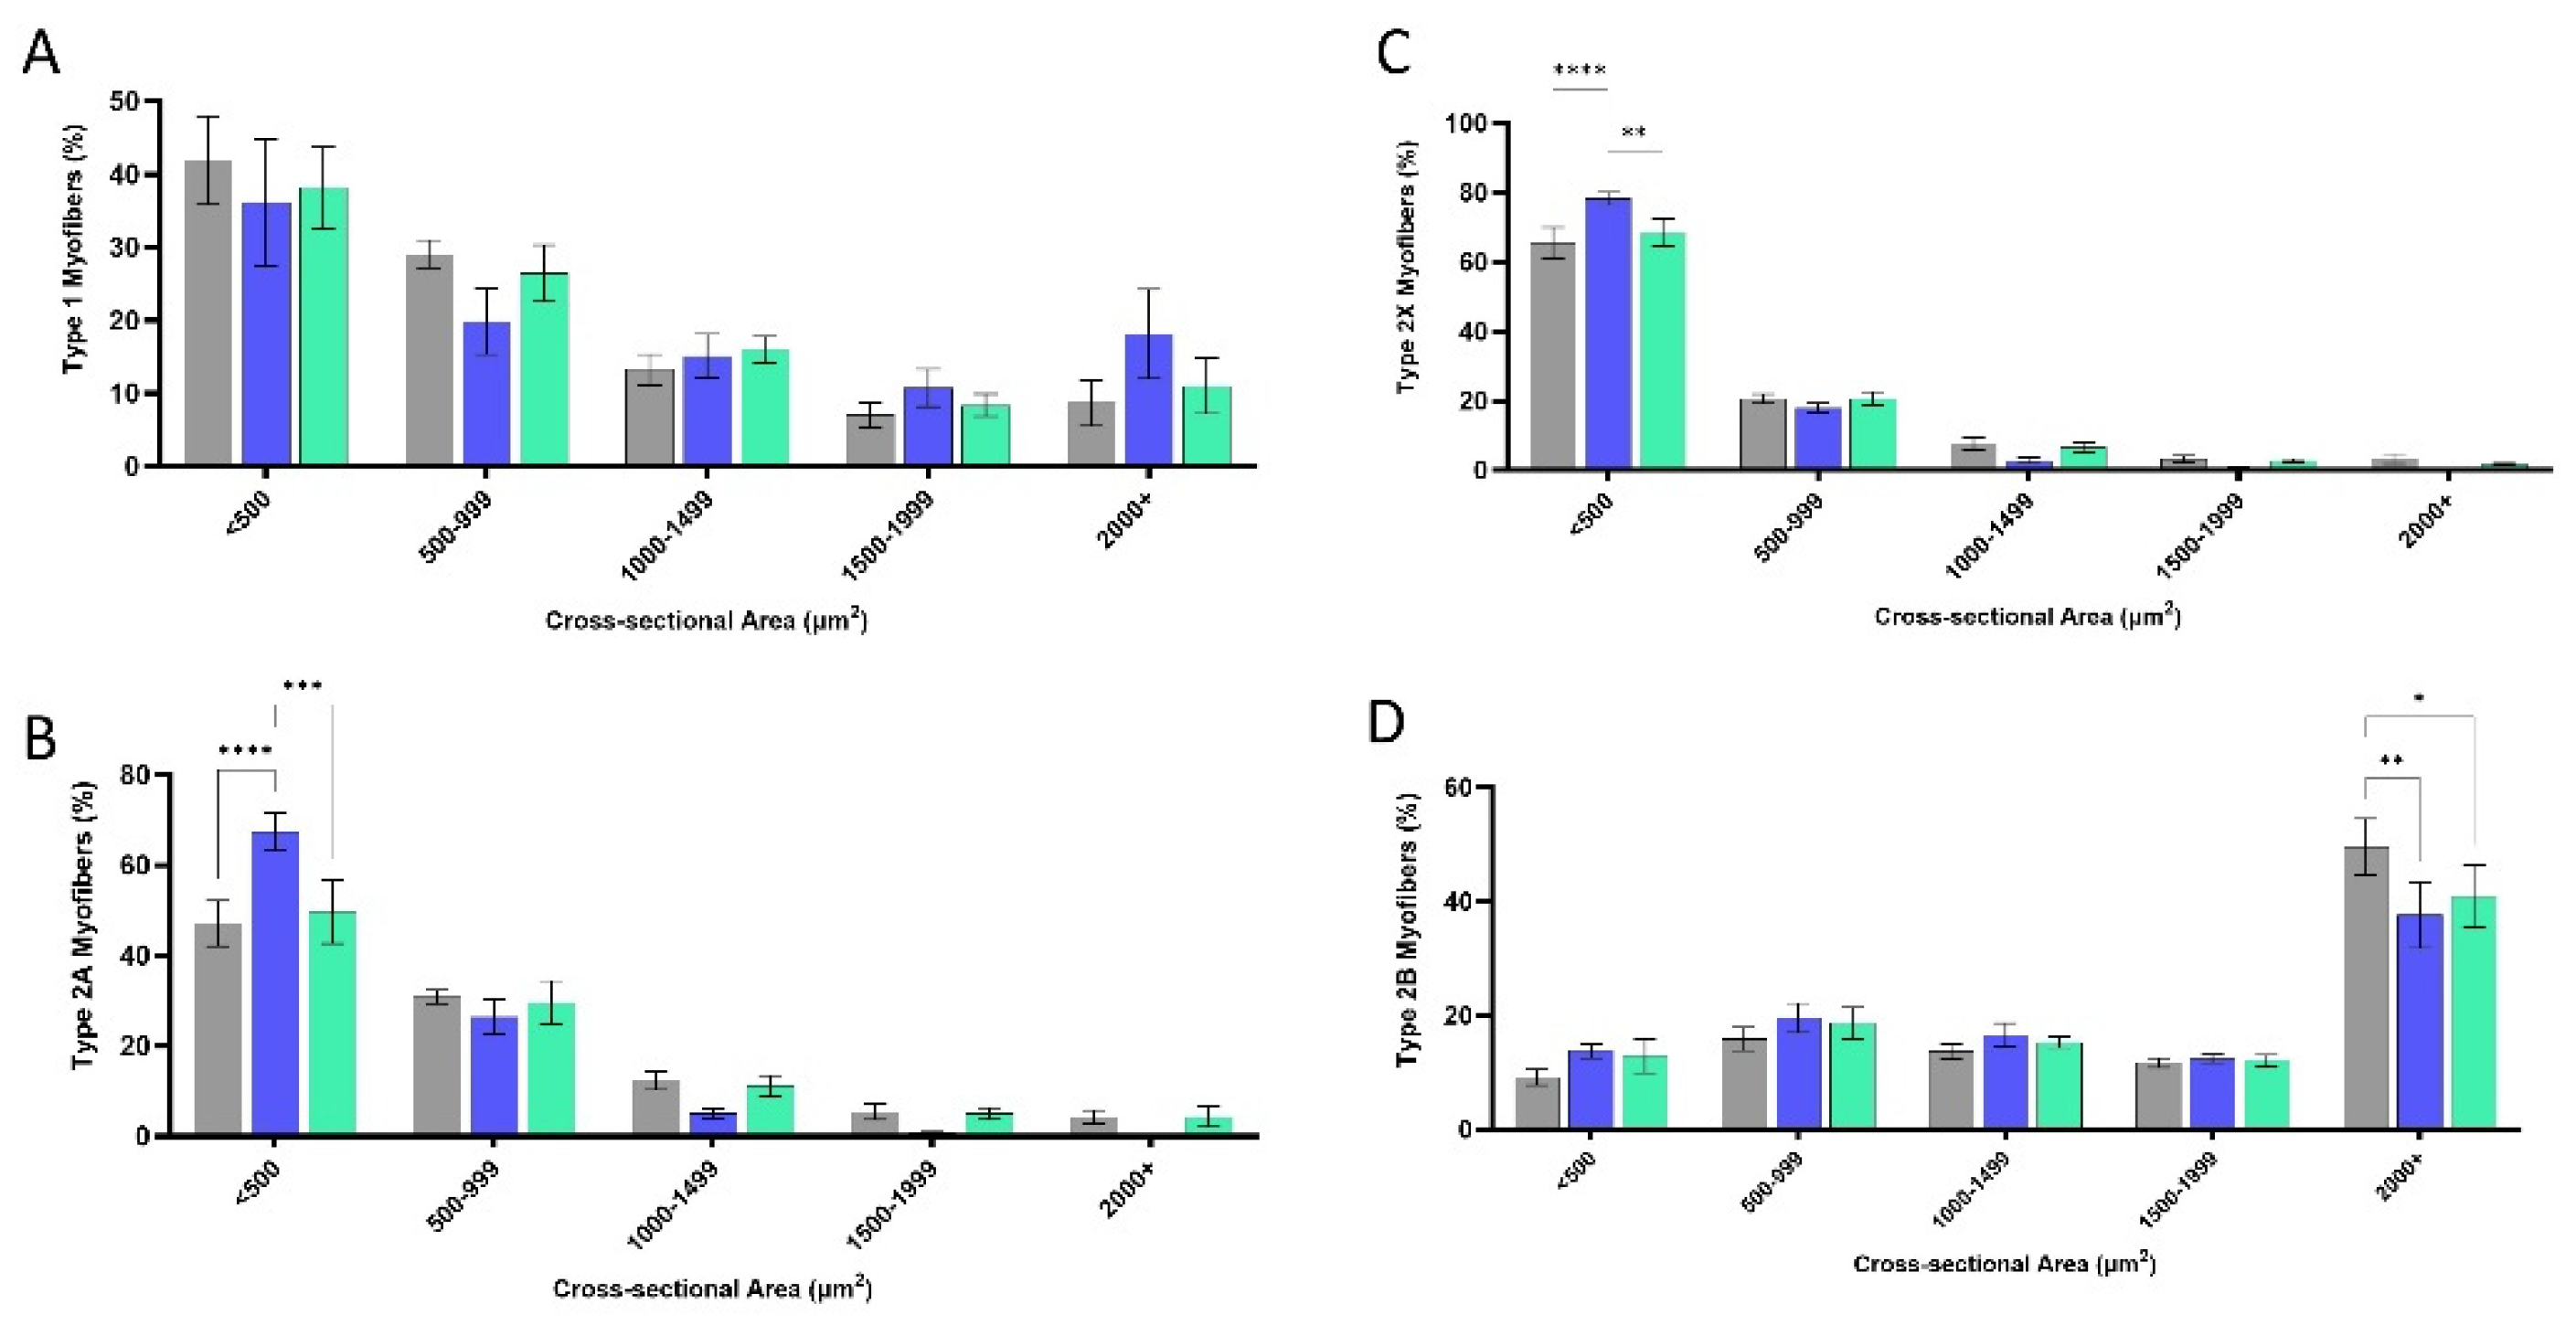
Figure 8.
Muscle cross-sections were stained with (A) Picrosirius Red (PSR) and imaged using polarized microscopy. (B) Total collagen area fraction was determined using thresholding by a custom MATLAB program. (C) Total area fraction of collagen separated into red, yellow, and green regions are quantified.
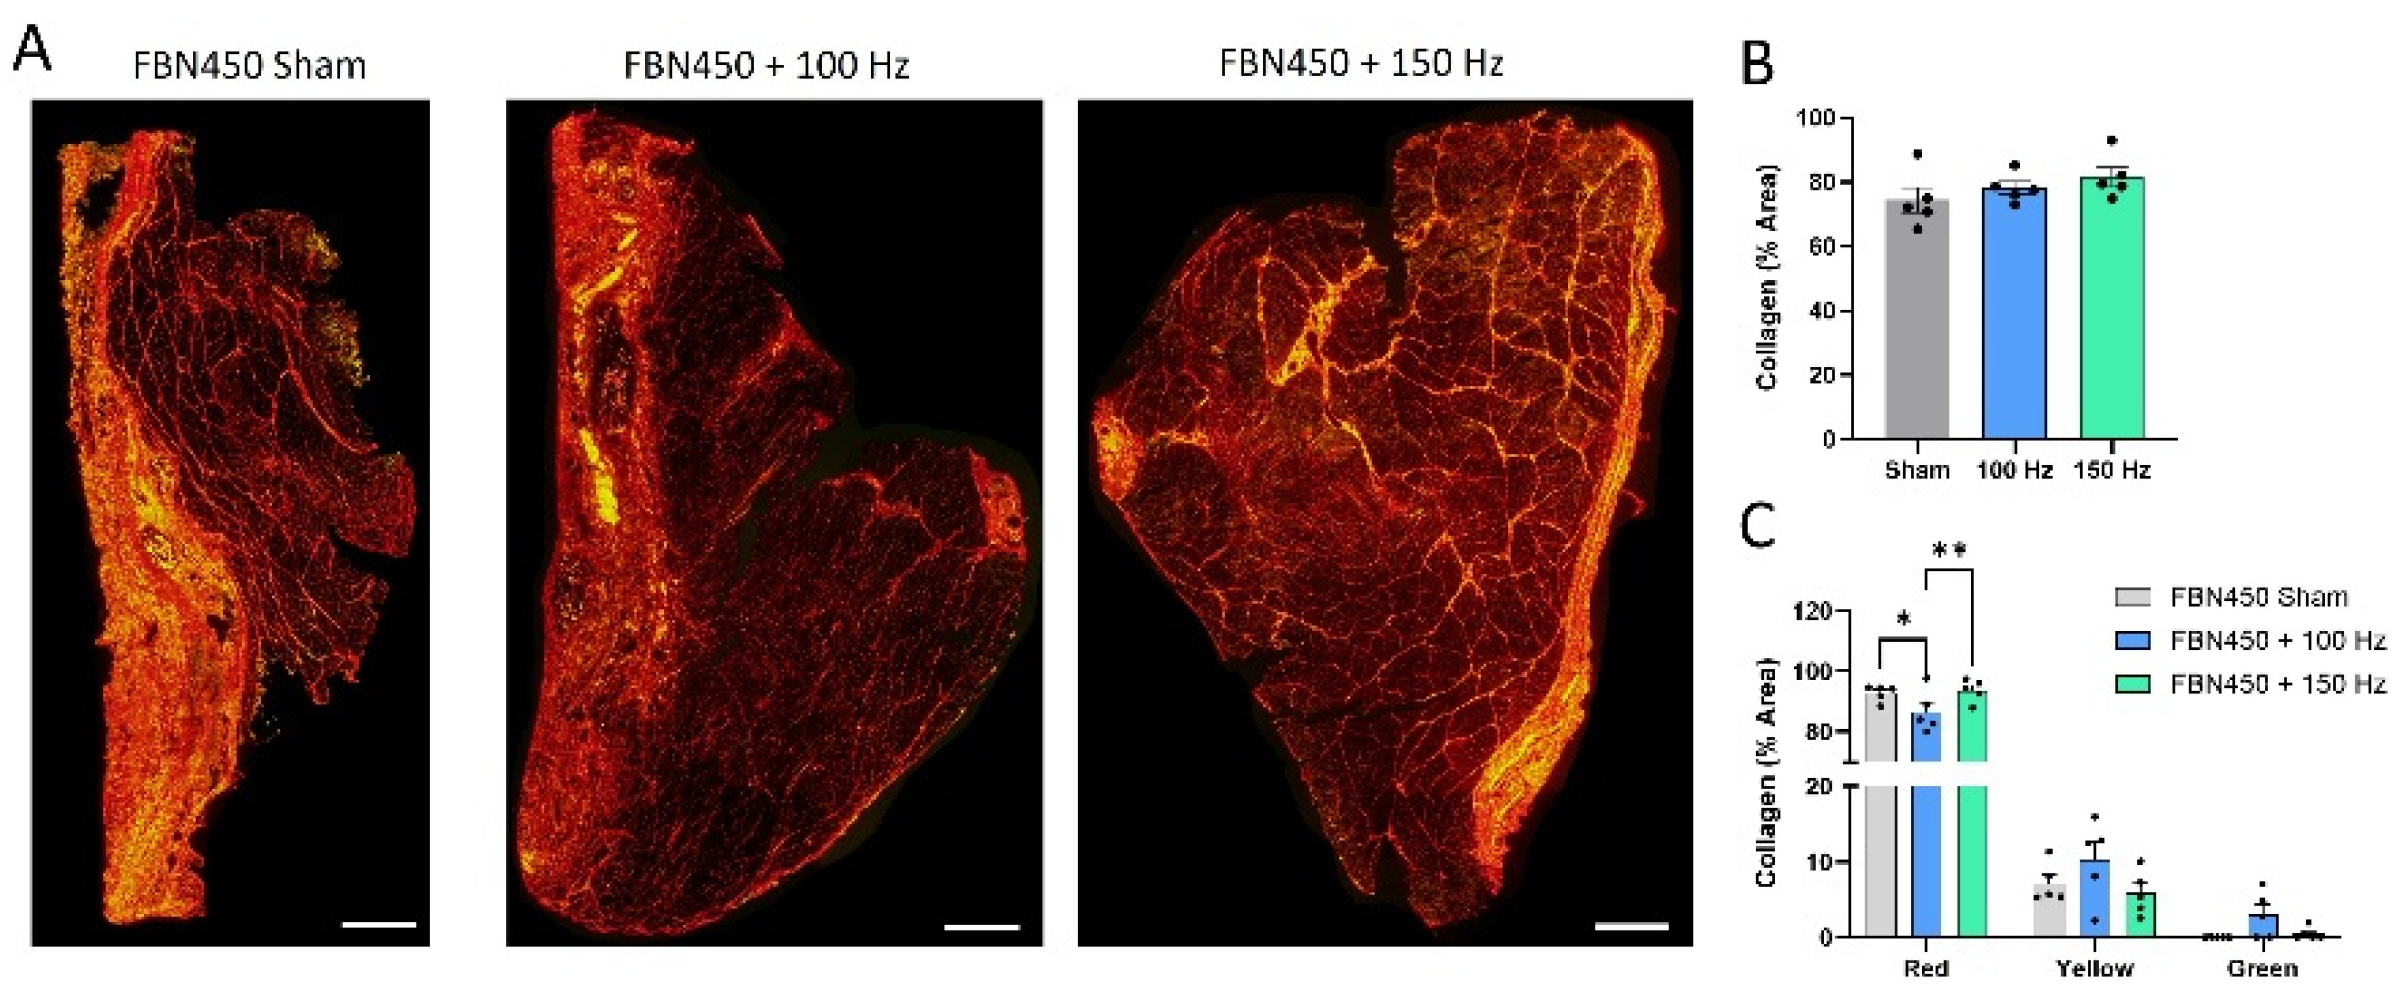
Figure 9.
Gene expression analysis of (A) proinflammatory marker CCR7, (B) anti-inflammatory marker CD163, (C) inflammatory cytokine TNF-α, (D) myoblast marker MyoD, (E) embryonic myosin heavy chain (eMHC), and (F) collagen type 1 (COL1) was performed 6 weeks post-injury. Data analysis was performed using a two-way analysis of variance (ANOVA). Significance between groups is indicated by * (p<0.05).
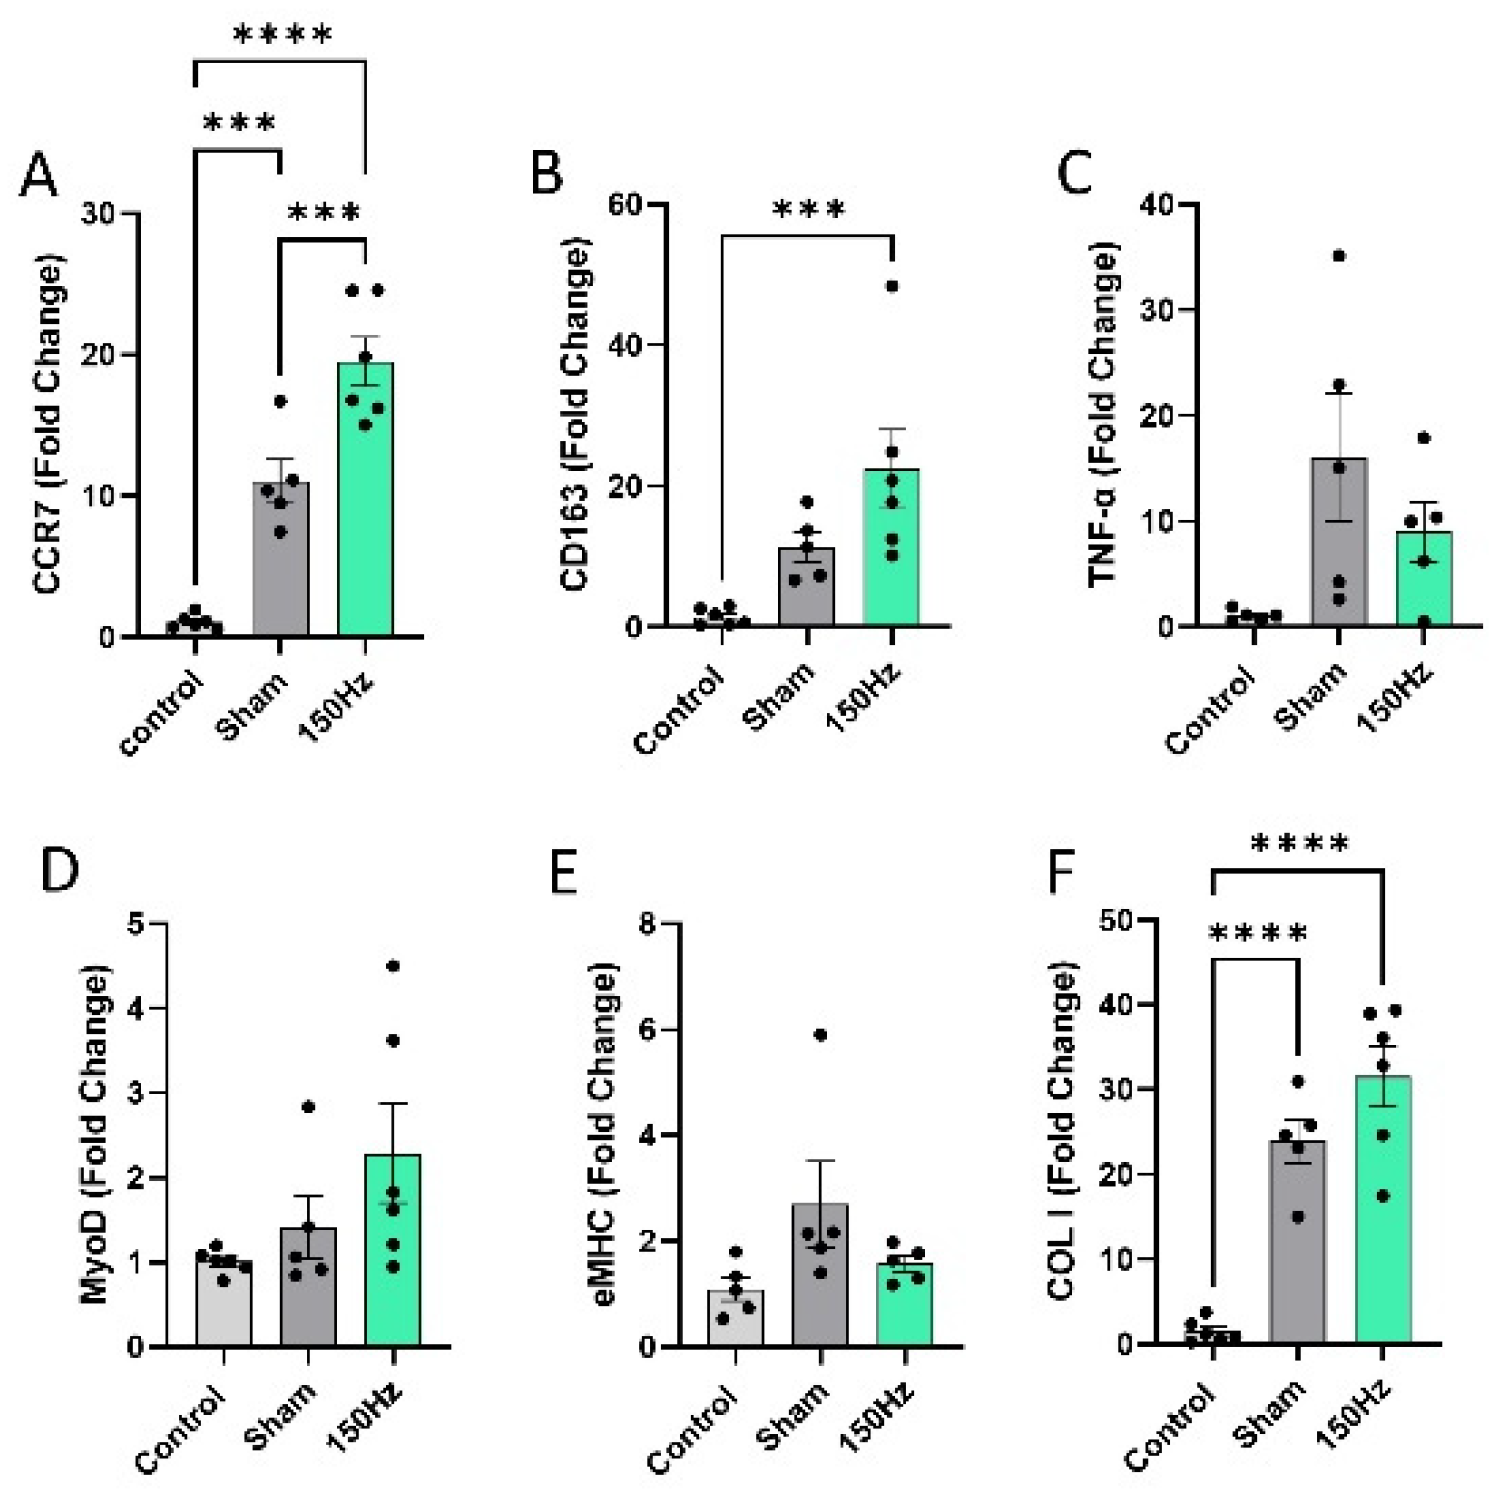

Table 1.
Nucleotide sequence for primers used for qRT-PCR.
| Gene | Forward sequence (5’-3’) | Reverse sequence (3’-5’) | Amplicon length (bp) |
| 18s | GGCCCGAAGCGTTTACTT | ACCTCTAGCGGCGCAATAC | 173 |
| CCR7 | GCTCTCCTGGTCATTTTCCA | AAGCACACCGACTCATACAGG | 107 |
| CD163 | TCATTTCGAAGAAGCCCAAG | CTCCGTGTTTCACTTCCACA | 101 |
| TNF-α | ACTCGAGTGACAAGCCCGTA | CCTTGTCCCTTGAAGAGAACC | 184 |
| MyoD | CGTGGCAGTGAGCACTACAG | TGTAGTAGGCGGCGTCGTA | 133 |
| eMHC | TGGAGGACCAAATATGAGACG | CACCATCAAGTCCTCCACCT | 180 |
| COL1 | CTGGTGAACGTGGTGCAG | GACCAATGGGACCAGTCAGA | 123 |
Disclaimer/Publisher’s Note: The statements, opinions and data contained in all publications are solely those of the individual author(s) and contributor(s) and not of MDPI and/or the editor(s). MDPI and/or the editor(s) disclaim responsibility for any injury to people or property resulting from any ideas, methods, instructions or products referred to in the content. |
© 2026 by the authors. Licensee MDPI, Basel, Switzerland. This article is an open access article distributed under the terms and conditions of the Creative Commons Attribution (CC BY) license.
Copyright: This open access article is published under a Creative Commons CC BY 4.0 license, which permit the free download, distribution, and reuse, provided that the author and preprint are cited in any reuse.


