
Submitted:
03 January 2026
Posted:
05 January 2026
You are already at the latest version
Abstract
Background/Objectives: High doses of pilocarpine to rats induce status epilepticus (SE) and reproduce the main characteristics of mesial temporal epilepsy. This model is considered highly isomorphic with the human disease, reason why it has been applied to elucidate the process of epileptogenesis. Methods: Two-dimensional electrophoresis (2-DE) was employed to study the hippocampal differential expression of proteins in rats exhibiting spontaneous recurrent seizures induced by pilocarpine. Two groups were studied: rats treated with pilocarpine (360mg/kg, N=6), and rats treated with saline (N=6). Both groups were analyzed 90 days after SE onset. Hippocampi homogenized in a lysis buffer were used to perform 2-DE. Interactome for differentially expressed proteins was performed using STRING database. Results: Protein spots analyzed by PDQuest software revealed forty proteins differentially expressed in epileptic rats compared to control (p< 0.05), among them thirty-seven were successfully identified. LC-ESI-MS/MS results analyzed with MASCOT MS/MS ion search and IPI protein database showed twenty-nine up-regulated proteins in epileptic rats while six proteins were down-regulated and two proteins were expressed only in the control animals. The differentially expressed proteins integrated the domains of neuronal hyperexcitability, energy failure, synaptic dysregulation, and post-status epilepticus remodeling (confidence scores ≥0.90–0.99). Conclusions: The differentially expressed proteins showed high-confidence protein-protein interaction modules directly linked to the molecular pathogenesis of epilepsy. The simultaneous failure of the identified pathophysiological domains drives the transition from acute seizures to chronic, drug-refractory epilepsy. The protein complexes identified represent high-value, translation-ready candidate nodes for next-generation antiepileptogenic and disease-modifying therapies.
Keywords:
temporal lobe epilepsy
; drug-refractory epilepsy
; hippocampus
; pilocarpine
; proteomics
; metabolism
; biomarkers
1. Introduction
Epilepsy is a chronic neurological disease that affect approximately 50 million people worldwide, being characterized by spontaneous and recurrent seizures that occur in the absence of disease toxic-metabolic or fever [1]. Temporal lobe epilepsy (TLE) accounts for approximately 40% of all cases of epilepsy, being a common form of focal epilepsy in humans. There are two subtypes of TLE, namely, mesial temporal lobe epilepsy (MTLE) and neocortical temporal lobe epilepsy (NTL) [2]. In the most MTLE patients, seizures originate in the limbic areas and are focal, and may be perceptual or non-perceptive [3]. Hippocampal sclerosis (HS) is the most frequent histopathological feature present in many patients with MTLE, and this change can usually be detected by magnetic resonance imaging—MRI [4,5,6]. HS is characterized by neuronal loss in specific subregions of the hippocampus and glial scar, but the etiology and the pathogenesis of the cell death is not well understood [5]. In addition, synaptic rearrangement and cell scattering in the granular layer of the dentate gyrus are frequently seen associated with HS in MTLE [7]. Seizures are often frequent and about 67-89% of patients with MTLE do not respond to antiseizure medications [8,9]. According to the International League Against Epilepsy (ILAE), the drug-resistance epilepsy (DRE) occurs as the failure of adequate trials of two tolerated, appropriately chosen, and used antiseizure medications, whether as monotherapy or in combination, to achieve sustained seizure freedom [10]. Until now, there is no antiseizure medications able to prevent seizures in patients with TLE that is efficient in preventing epileptogenesis [11]. Thus, the question is whether the epileptogenic process could be explained by common molecular and networks events that would be applied in new therapeutics. In this way, proteomics has been a powerful tool for protein profiling because it allows comparing proteomes of cells and tissues in normal and pathological conditions. Since the expression of proteins is determined, the transcriptional level can be examined to find the underlying mechanism for reduction or increase of certain gene products. For this reason, proteomics has been widely used in clinical research to identify biomarkers associated with disease.
Proteomics allows us to find proteins changed by a cell, tissue, or organism’s response to internal states, external stimulations, or developmental changes, and to profile any differential protein expression [12,13]. Proteomics not only measures the amount of a given protein, but also whether there are any modifications of a protein as phosphorylation, ubiqutination, palmitoylation, oxidation, and other post-translational modifications (PTMs) [14]. Proteomics is a multidisciplinary method which is based on principles of biochemical, biophysical and bioinformatics to allow distinguishing healthy and diseased cellular processes at the protein level. Aslam et al. (2017) [15] highlighted some aspects of a target organism’s proteome that can be assessed by proteomics, for example: protein identification, protein quantification, protein localization, post-translational modifications, functional proteomics, structural proteomics, and protein-protein interactions. Currently, the proteomics technique has been applied in the investigation for biomarkers associated with disease [16].
Proteomics technology applied to understanding the nervous system is called “neuroproteomics” or “neuromics”. The neuroproteomics enables to study proteome of brain fragments or single cell, in cultures or isolated, and this is important to determine the dynamics of subproteome under different conditions (i.e., inflammation, oxidative stress, treatments, etc). In a global analysis, complementary studies could contribute to the understanding of complex biological networks that include protein interactions, complexity of signal and metabolic pathways that can be applied to select potential targets for specific drug therapy, and to the development of diagnosis or prognosis for neurological disorders [16].
Neurosciences have benefited greatly from the increased use of the technique proteomics in recent years. Despite this, studies of epilepsies are still modest with the application of proteomics. Experimental models that reliably reproduce the main symptoms of diseases have aroused the interest of researchers in the search for biomarkers. Studies employing human tissue are limited by the low amount obtained by surgical procedures and for ethical reasons. The use of experimental models of epilepsy can expand our knowledge regarding these mechanisms involved in epileptogenesis, allowing interfere or prevent the onset of the spontaneous seizures. Chemical convulsants such as pilocarpine [17,18] and kainic acid [19] can initiate status epilepticus in rodents and cause hippocampal sclerosis, memory impairment and spontaneous and recurrent seizures [20].
Despite technological advances applied to neurosciences, little is known about the cellular and molecular phenomena related to the epileptogenic process [21].
Here, we have applied proteomics method allied to interactome analysis to study the differentially expressed proteins in the hippocampal samples of rats subjected to pilocarpine induced MTLE.
2. Results
2.1. Comparative Proteomic Analysis
In the hippocampal samples from rats studied 90 days following status epilepticus our results showed forty proteins differentially expressed when compared to control animals. Among them, thirty-seven proteins were successfully identified as shown on Table 1. The protein profile revealed that twenty-nine proteins were up-regulated, six were down-regulated and two were expressed only in control animals.
2.2. Figures, Tables and Schemes In the hippocampal samples
Figure 1.
Schematic representation of the interactome showing the network between the hipocampal proteins identified by proteomic analysis applied to the animal model of temporal lobe epilepsy induced by pilocarpine. The presented result was based on STRING database (https://string-db.org/) [22].
Figure 1.
Schematic representation of the interactome showing the network between the hipocampal proteins identified by proteomic analysis applied to the animal model of temporal lobe epilepsy induced by pilocarpine. The presented result was based on STRING database (https://string-db.org/) [22].
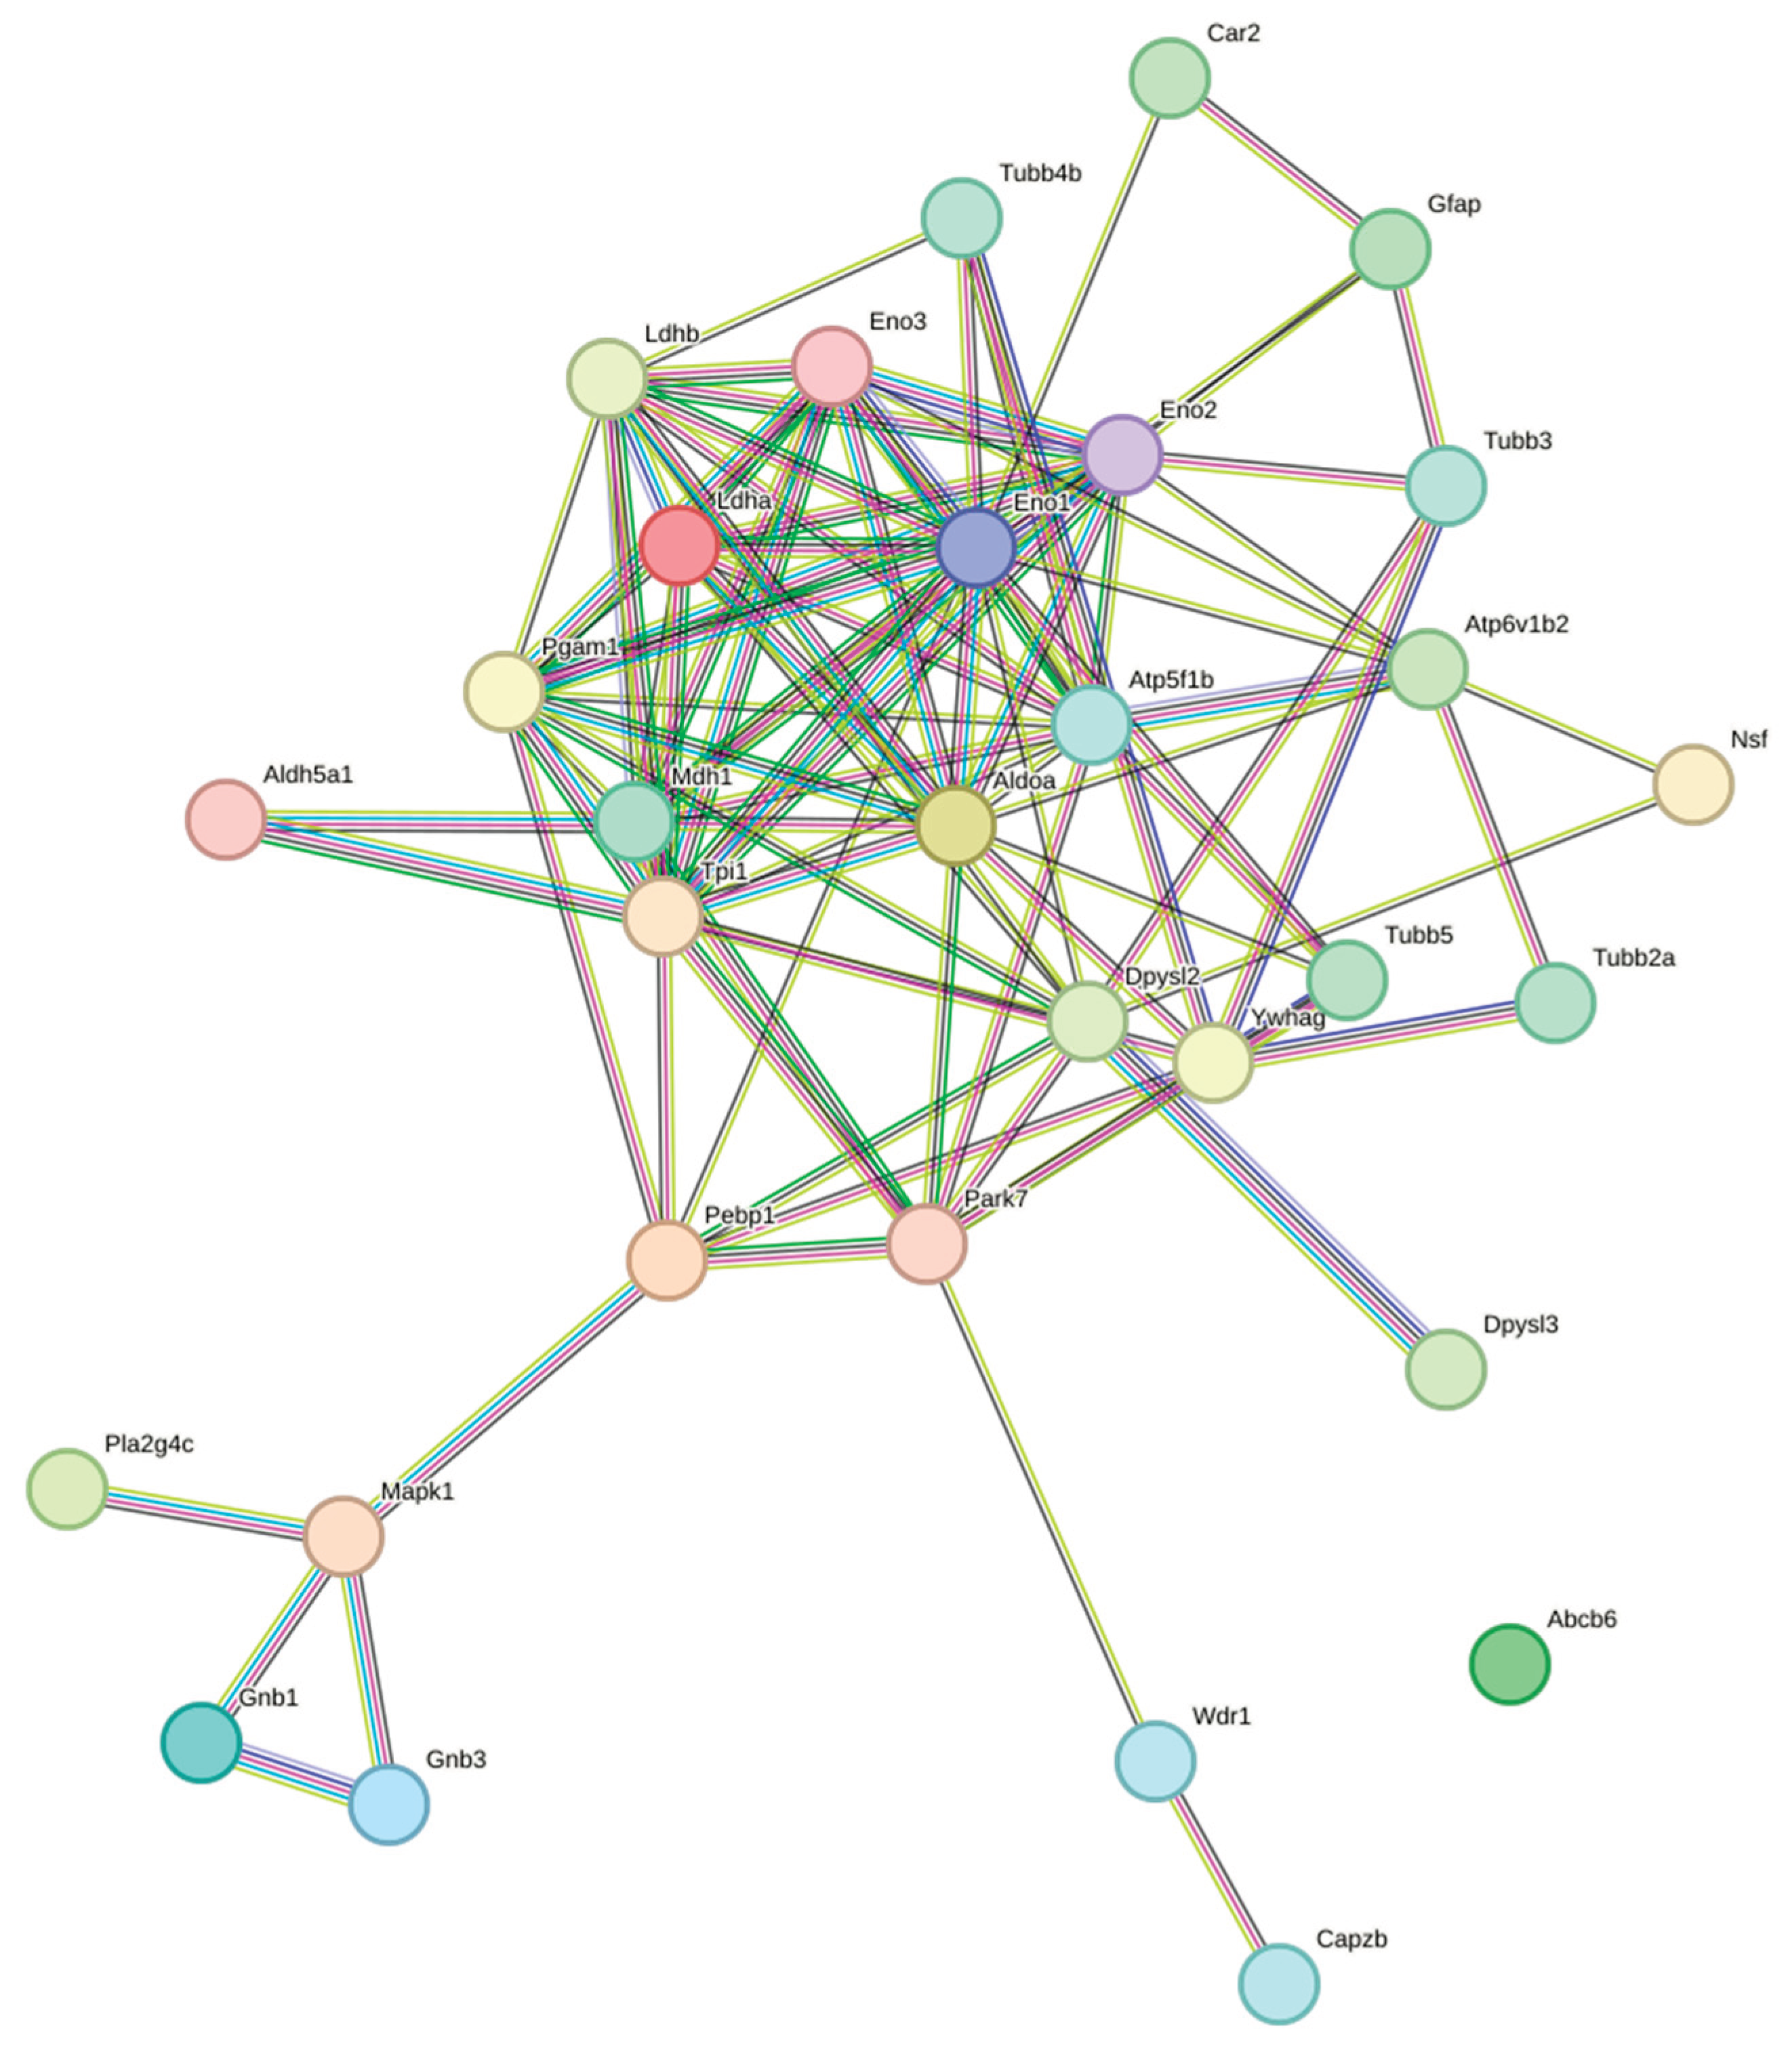

Table 2.
Cellular and molecular functions of hipocampal proteins identified by proteomic analysis applied to the animal model of temporal lobe epilepsy induced by pilocarpine.
Table 2.
Cellular and molecular functions of hipocampal proteins identified by proteomic analysis applied to the animal model of temporal lobe epilepsy induced by pilocarpine.
| Functions | Proteins | Key references supporting functions |
|---|---|---|
| Glycolysis & metabolic enzymes | Ldha, Ldhb, Aldoa, Eno1, Eno2, Eno3, Pgam1, Tpi1, LOC500959, RGD1565368, Mdh1 | [23,24,25,26,27,28,29,30,31,32] |
| Mitochondrial ATP production & heme metabolism | Atp5b, Abcb6 | [33,34] |
| Proton transport & pH regulation | Atp6v1a, Atp6v1b2, Car2 | [35,36,37] |
| Cytoskeleton structure, dynamics & axon guidance | Tubb5, Tubb2a, Tubb2c, Tubb3, Capzb, Wdr1, Dpysl2, Dpysl3 | [38,39,40,41,42,43,44,45] |
| Vesicle trafficking, GPCR signaling and neurotransmission | Nsf, Gnb1, Gnb3, Pla2g4c | [46,47,48,49] |
| Cell signaling regulators | Mapk1, Pebp1, Ywhag, Cdca7l | [50,51,52,53] |
| Stress response, neuroprotection & glial structure | Park7, Gfap | [54,55] |
| GABA metabolism | Aldh5a1 | [56] |
The interactome analysis revealed 100 direct interactions between query proteins with scores above the confidence threshold. The network showed several key functional clusters, classified below as major interaction modules:
Major Interaction Modules
1. Glycolytic Enzymes Cluster—Strong interactions among:
- Ldha ↔ Ldhb (score: 0.99)
- Pgam1 ↔ Eno1 (score: 0.99)
- Tpi1 ↔ Aldoa (score: 0.989)
- Eno1 ↔ Aldoa (score: 0.973)
The proteins mentioned above form a tightly connected hub around metabolic/glycolytic processes.
2. Tubulin/Cytoskeletal Module—Including:
- Wdr1 ↔ Capzb (score: 0.929)
- Tubb3 ↔ Gfap (score: 0.849)
The proteins mentioned above are important for connections to microtubule and actin regulation.
3. ATP/Energy Metabolism—Connected through:
- Atp5f1b ↔ Atp6v1b2 (score: 0.96)
Here, both ATP synthase subunit beta and V-ATPase presented high interaction scores.
4. CRMP-Related Proteins—Showing moderate connectivity:
- Dpysl2 ↔ Dpysl3 (score: 0.904)
- G-Protein Signaling—Connected module:
- Gnb1 ↔ Gnb3 (score: 0.811)
- Mapk1 interactions with Gnb1 and Gnb3
Figure 2.
Clustered interactome visualization of the hipocampal proteins identified by proteomic analysis based on STRING database (https://string-db.org/) [22]. Different colors represent different protein clusters. Red: NAD metabolism, glycolysis and gluconeogenisis; Gold: thrombin and PAR Signaling; Olive: CRMP in Sema3A signaling and hydantoinase; Green: vesicular transport and microtubules; Blue: neuronal cytoskeleton; Cyan: actin filament regulation; Purple: 14-3-3 Adaptor (Isolated).
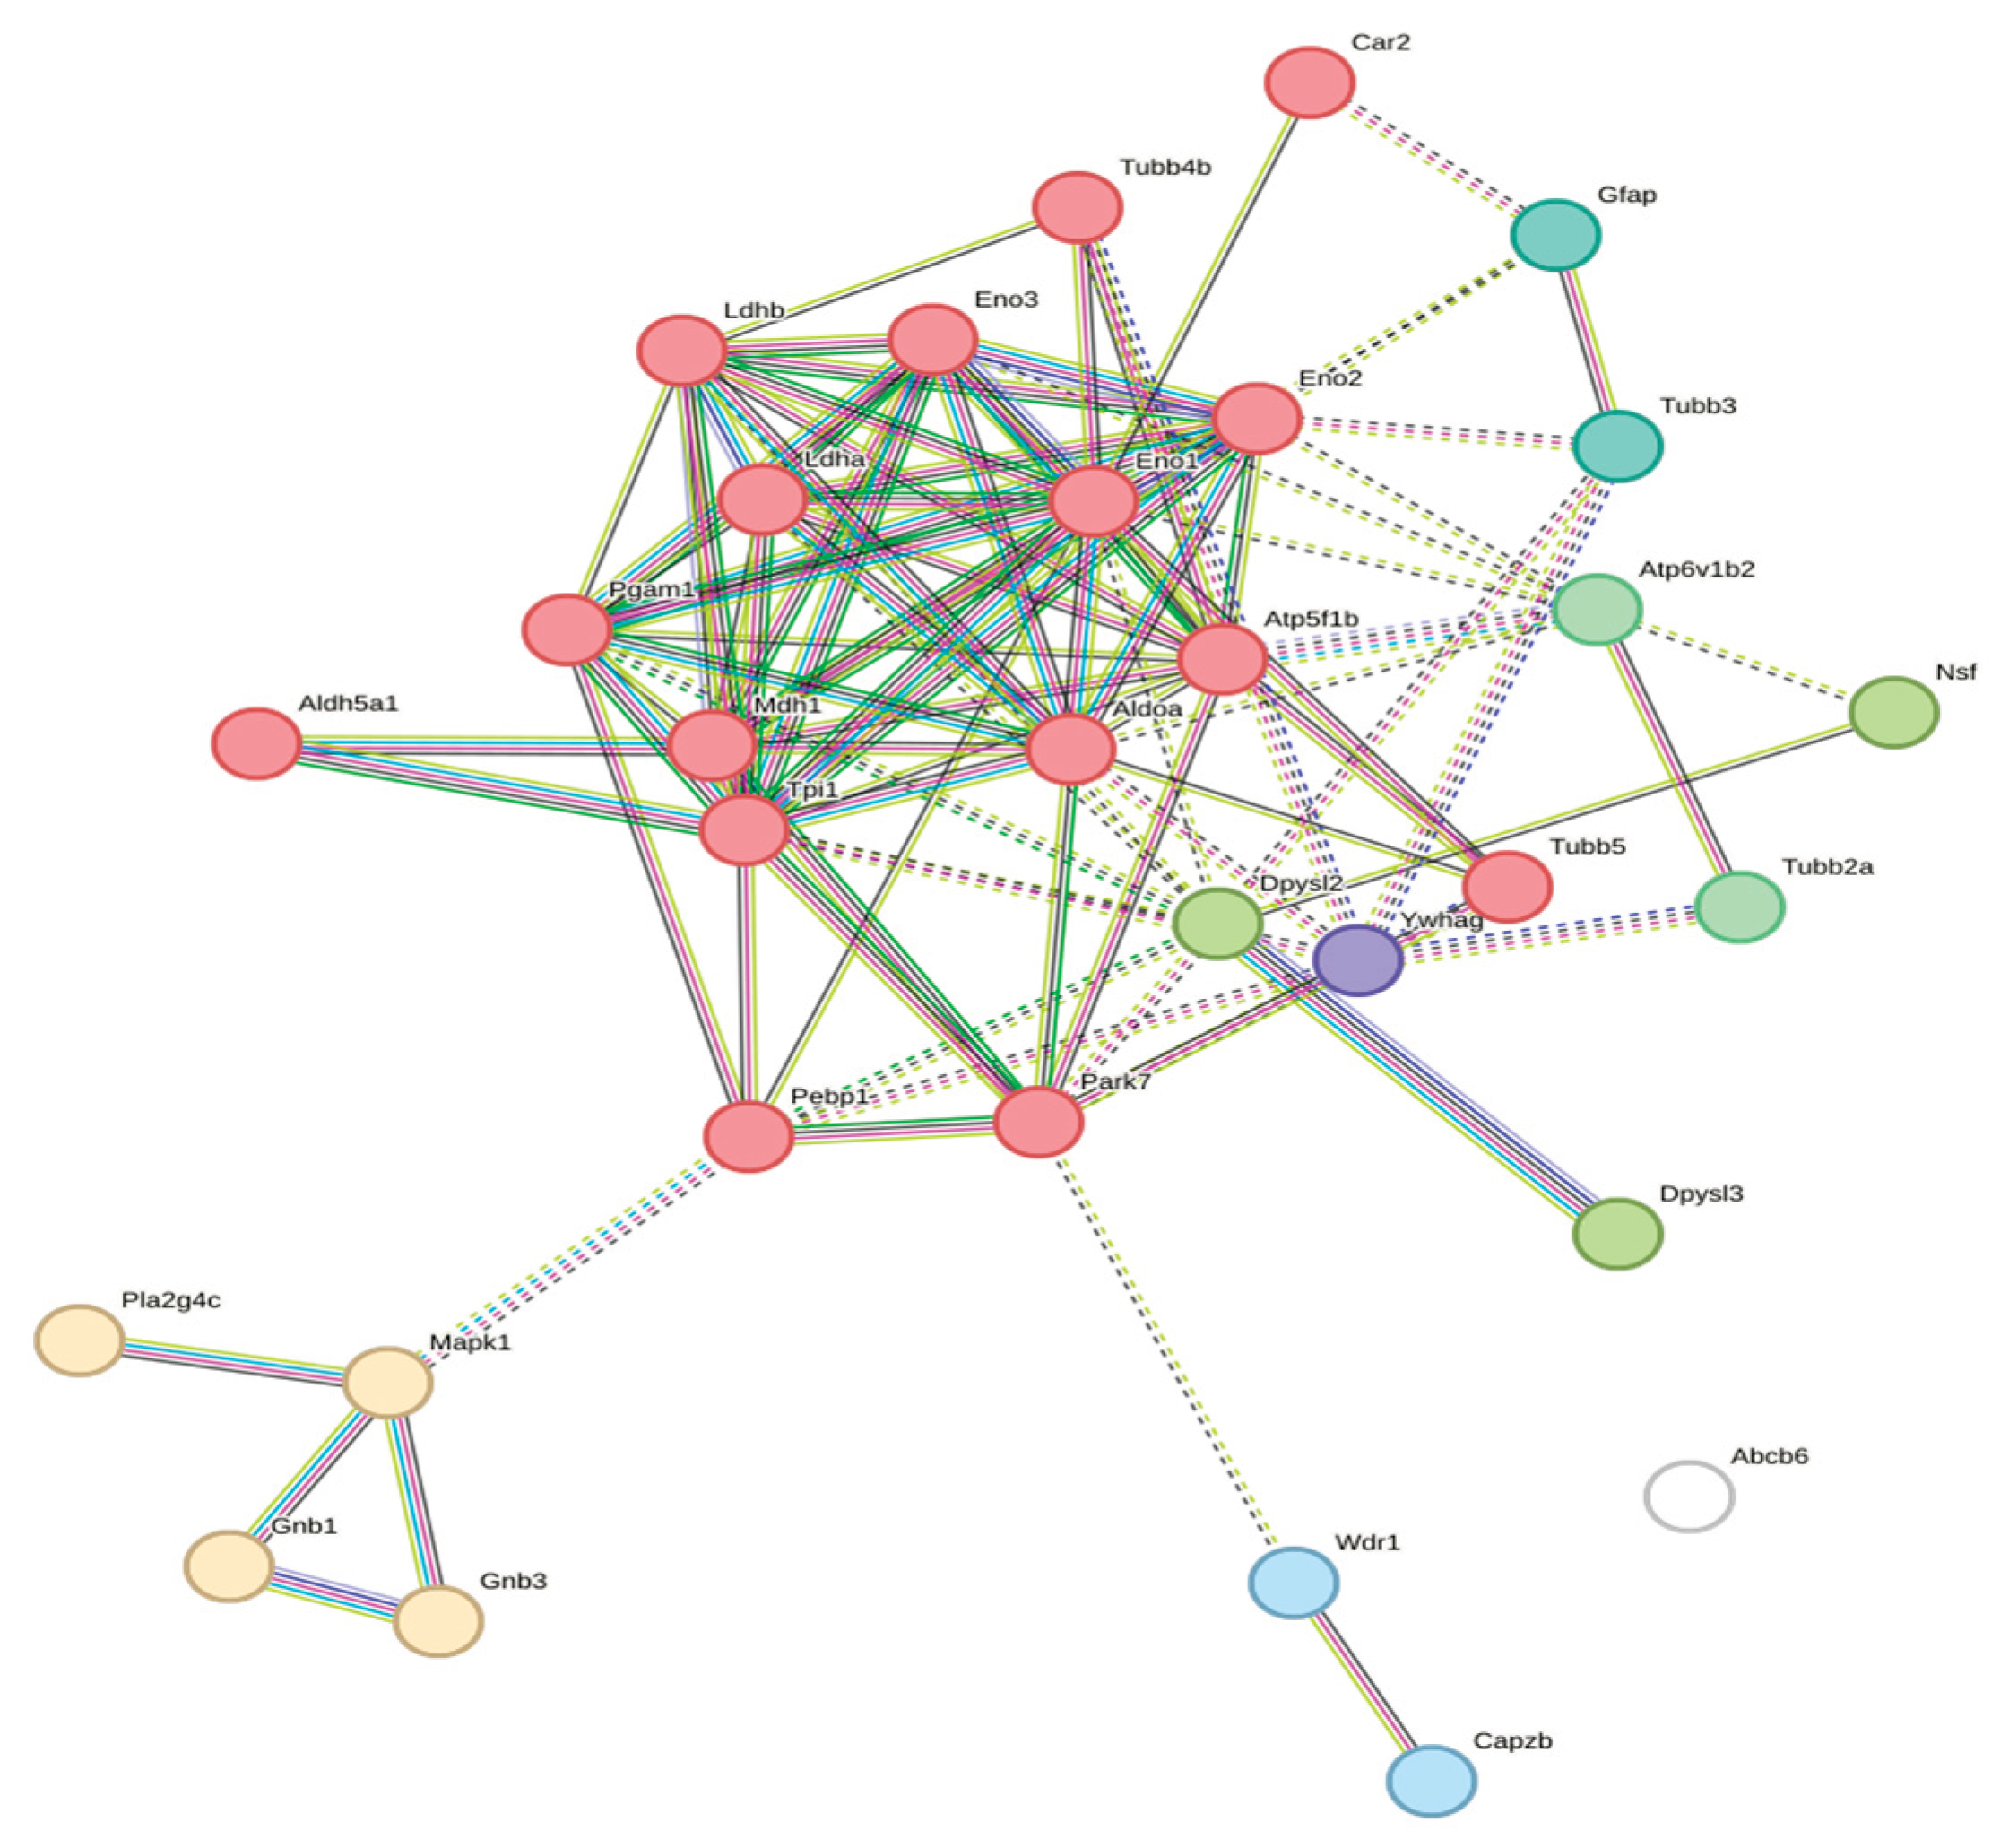
The clustering analysis of the interactome revealed that the hipocampal protein network is segregated into 7 distinct functional modules as shown on Table 3.
According to the results shown on Table 3, the cluster 1 dominates with 16 proteins, forming the largest functional module centered on energy metabolism. The cluster 2 (MAPK/G-protein signaling) represents transmembrane signaling and lipid metabolism. The clusters 3-6 represent specialized modules for neuronal signaling, transport, and cytoskeletal dynamics, while Ywhag (14-3-3γ) was found relatively isolated, acting as a potential hub protein with broader multi-module interactions. Potential hub proteins are proteins predicted to have a high number of interactions within a biological network, suggesting Ywhag (14-3-3γ) could be a critical control point.
3. Discussion
Among the down-regulated proteins we found enzymes related to the carbohydrate metabolism and ATP synthesis, reflecting disturbances in the energetic metabolism. These data are in line with findings reported by other authors [57,58]. The gene encoding the malate dehydrogenase was reported as a factor involved with the generation of generalized idiopathic epilepsy [57]. Altered proteins such as phospholipase A2, fructose-bisphosphate aldolase and enolase, have been reported by other authors associated with neuropsychiatric mechanisms [59,60,61]. However, phospholipase A2 can also participates in neurogenesis processes [62].
The guanine nucleotide–binding protein (G proteins) was down-regulated in the hippocampi of the pilocarpine-induced epilepsy. This is an important finding considering the wide role of this protein in the signal transduction by hormones, neurotransmitters, chemokines, and autocrine and paracrine factors [63].
In another study using lithium-pilocarpine model, we identified 24 proteins in the hippocampal samples of rats, but only 7 were differentially expressed compared to control rats, namely, 4 were up regulated and 3 were downregulated [64]. The interactome analysis revealed that the proteins are mainly related to glycolysis (14%) and to inflammation processes mediated by chemokine and cytokine signaling (5%). We also found proteins associated to Huntington’s (5%) and Parkinson’s disease (5%) and associated to fructose and galactose metabolism (4.80%). In addition, minor changes (2%) were also observed in several other pathways [64].
Here, the identified high-confidence protein-protein interaction modules were directly and compellingly linked to the molecular pathogenesis of epilepsy, specifically in the domains of neuronal hyperexcitability, energy failure, synaptic dysregulation, and post-status epilepticus remodeling. Below, the relationship between the interactome modules or clusters revealed for hipocampal proteins of rats submitted to the induction of temporal lole epilepsy by pilocarpine and the pathophysiology of epilepsy are described:
- Glycolytic enzymes hub—central to seizure-induced metabolic crisis
The tightly interconnected glycolytic metabolon-Ldha–Ldhb, Pgam1–Eno1, Tpi1–Aldoa, Eno1–Aldoa are highly relevant to epilepsy. Acute energy demand during seizures increases glucose utilization up to 300%, while oxidative phosphorylation collapses, forcing a switch to massive lactate production [65,66]. Physical clustering of glycolytic enzymes into metabolons that channel substrates is well-documented and dramatically enhances flux under stress [66,67]. The shift from LDH1 (H4) to LDH5 (M4) isozymes and the high level of Ldha/Ldhb heterotetramers are hallmarks of epileptic foci and post-status epilepticus hippocampus [69,70]. Therapeutic relevance: stiripentol inhibits LDH, shifting metabolism towards oxidative phosphorylation [71]; 2-deoxyglucose, by inhibiting glycolysis, has anticonvulsant properties [72].
- 2.
- Cytoskeletal module (Wdr1–Capzb, Tubb3–Gfap)—loss of dendritic spine and epileptogenesis
Wdr1-mediated actin severing via Aip1 and cofilin promotes rapid dendritic spine collapse within hours of status epilepticus, and this contributes to delayed hyperexcitability [73,74]. Capzb modulates actin barbed-end dynamics, and its interaction with Wdr1 suggests a pre-assembled actin disassembly complex that is activated by seizure-induced Ca2+/calcineurin signaling [75]. Reactive gliosis and physical coupling of neuronal microtubules with astrocytic GFAP intermediate filaments impair K+ and glutamate clearance in epileptic tissue [76,77].
- 3.
- Interaction of ATP synthase ↔ V-ATPase (Atp5f1b ↔ Atp6v1b2)—ionic homeostasis and acidosis
Seizure activity results in profound extracellular acidosis (pH ~6.8) through lactate and CO2 [78]. The brain-enriched V-ATPase B2 subunit Atp6v1b2 is required for neuronal pH recovery and its genetic disruption decreases seizure threshold [79]. Physical or functional coupling of mitochondrial ATP synthase with V-ATPase at organelle contact sites regulates local ATP/pH homeostasis [80]. Acidosis activates ASIC1a channels and pannexin-1 hemichannels, generating a feed-forward excitotoxic loop [81,82]. Carbonic anhydrase inhibitors (topiramate, zonisamide) exert part of their anticonvulsant effect by modulating brain pH [83].
- 4.
- CRMP family (Dpysl2 ↔ Dpysl3)—axonal sprouting and network reorganization
Hyperphosphorylation of CRMP2 (Dpysl2) by Cdk5/GSK3β after status epilepticus drives aberrant mossy fiber sprouting in temporal lobe epilepsy [84,85]. CRMP2 and CRMP4 form heteromeric complexes; their interaction modulates tubulin binding and axonal guidance [86]. Lacosamide, which is an anticonvulsant, directly binds CRMP2 and thereby stabilizes its inactive conformation [87].
- 5.
- The G-protein/MAPK1 signaling node: control of inhibitory tone and excitability
Gβ1 and Gβ3 isoforms mediate GABA_B, adenosine A1, cannabinoid CB1, and opioid receptor inhibitory signaling in hippocampus [88,89]. Chronic epilepsy is associated with the desensitization of Gβγ-dependent GIRK currents and reduced inhibitory tone [90]. Convergence of Gβγ on the Raf–MEK–ERK (Mapk1) cascade links neuromodulatory receptors to long-term plasticity changes in epileptogenesis [91,92].
As discussed above, our study have revealed a tightly interconnected molecular network that recapitulates a core epileptogenic axis consistently described across diverse acquired and genetic epilepsy models [93,94]. This axis integrates four major pathophysiological domains whose concurrent failure drives the transition from acute seizures to chronic, drug-refractory epilepsy:
- 1.
- 2.
- 3.
- 4.
The physical nature of these interactions (confidence scores ≥0.90–0.99) indicates that these processes are not merely co-dysregulated but are structurally pre-wired to fail together under sustained ictal stress. This molecular convergence explains the notorious refractoriness of chronic epilepsy to therapies that target only one domain (e.g., ion channels or synaptic transmission) [93] and underscores why multi-node, disease-modifying strategies are required.
The protein complexes identified here represent high-value, translation-ready candidate nodes for next-generation antiepileptogenic and disease-modifying therapies, including:
- (a)
- (b)
- (c)
- allosteric modulators of Gβγ signalling [89],
- (d)
4. Materials and Methods
4.1. Animals
Adult male Wistar rats, weighing approximately 250 g, were housed under standard controlled conditions (12/12-h light/dark cycle; 20–22 ◦C; 40–60% humidity) with food and water offered ad libitum. All animal procedures were conducted per national and international legislation (Guidelines of the National Council for the Control of Animal Experimentation; NIH Guide for Care and Use of Laboratory Animals) and were approved by the Ethical Committee of our University (CEUA 1770/2006). Efforts were made to minimize the number of animals used and to avoid their suffering.
4.2. Pilocarpine Protocol
Seizures were induced by pilocarpine, as reported previously [95]. Briefly, rats were injected with pilocarpine hydrochloride (360 mg/kg, Merck, Darmstadt, Germany), administered intraperitoneally (i.p.) 20 min after the subcutaneous (s.c.) injection of methyl-scopolamine. Methyl-scopolamine (1 mg/kg, s.c., Merck, Darmstadt, Germany) was used to minimize peripheral consequences of pilocarpine such as diarrhea, piloerection, and olfactory and gustatory automatisms associated with salivation, eye blinking, vibrissae twitching, and yawning that usually start 5–10 min after pilocarpine injection [95].
4.3. Groups
4.1. Sample Preparation
Hippocampi were dissected 90 days after status epilepticus induction at 4 ◦C. About 100 mg (wet weight) of hippocampal tissue was homogenized for protein extraction using a buffer (5 μL/mg tissue) consisting of 7 M urea, 2 M thiourea, 4% (w/v) CHAPS, 10 mM DTT, 1 mM EDTA, 1 mM PMSF, 0.2 mM Na2VO3 and 1 mM NaF. After sonication in an ice-bath, the suspension was centrifuged at 12,000× g for 40 min at 4 ◦C to remove cellular debris. The protein concentration of the samples was determined by using the Bradford method in the supernatants [97]
4.2. Two-Dimensional Gel Electrophoresis (2-DE)
Five hundred micrograms of protein from hippocampal samples (PILO and control) were used for 2-DE. Linear (17 cm) pH 3–10 IPG strips (BioRad Laboratories, Hercules, CA, USA) were used for the first-dimension electrophoresis. The active rehydration was carried out for 12 h at 50 V. Isoeletric focusing (IEF) was performed using a Protean IEF cell (BioRad Laboratories, Hercules, CA, USA). After IEF, the strips were equilibrated in a buffer consisting of 50 mM Tris-HCl (pH 8.8), 6 M urea, 34% glycerol, 2% SDS, 1% DTT and 0.001% bromophenol blue. After 15 min, the stirring strips were equilibrated in a second buffer which did not contain DTT and had an additional 2.5% iodoacetamide relative to the first buffer. The equilibrated strips were then placed onto second dimension gels (12% SDS-PAGE). SDS-PAGE was performed using a Protean II xi Cell (BioRad Laboratories, Hercules, CA, USA) with a standard Tris-Glycine-SDS buffer, with a current setting of 20 mA/gel for 1 h, followed by 60 mA/gel until the bromophenol blue dye reached the end of the gel. The gels were stained using the Coomassie blue method [98]. The electrophoretic runs were made in duplicates.
4.3. Image Analysis for Proteome Determination
Stained gels were scanned by a GS-800 calibrated densitometer (BioRad Laboratories, Hercules, CA, USA), normalized to the background, and analyzed by PDQuest 2D-gel software (Version 8.0.1, BioRad Laboratories, Hercules, CA, USA). From selected gels, spots of interest were cut from the gel for mass spectrometry identification. For greater reliability, the identification was made in duplicates.
4.4. In-Gel Digestion
Excised protein spots were subjected to in-gel trypsin digestion. The spots were briefly washed by adding and removing a solution containing 100 mM (NH4)2CO3 with 50% acetonitrile until total discoloration. The gel fragments were dehydrated with 50 μL of pure acetonitrile in a vacuum centrifuge. Once fully dried, the gel fragments were rehydrated in 5 μL of digestion buffer consisting of 50 mM ammonium (NH4)2CO3 (pH 8.0) and 0.5 mg of trypsin, (Sigma-Aldrich, SP, Brazil) for 20 min at room temperature. A volume of 100 μL of 50 mM (NH4)2CO3 was added to all tubes and the samples were incubated overnight at 37 ◦C. The reaction was stopped by adding 50 μL of 0.1% trifluoroacetic acid (TFA). The samples were dehydrated in a vacuum centrifuge, re-suspended in 0.1% TFA, and analyzed by LC-ESI-MS/MS.
4.5. Nano-LC-ESI-MS/MS Analysis
An aliquot (4.5 μL) of digested proteins was injected into analytic columns C18 (1.7 μm), BEH 130 (100 μm × 100 mm), RP-UPLC (nanoAcquity UPLC, Waters), coupled with nano-electrospray tandem mass spectrometry on a Q-Tof Ultima API mass spectrometer (MicroMass/Waters), at a flow rate of 600 nL/min. A Symmetry C18 (180 μm × 20 mm) trapping column was used for sample desalting at a flow rate of 5 μL/min for 2 min. The gradient was 0–50% acetonitrile in 0.1% formic acid over 45 min. The instrument was operated with an MS positive mode data continuum acquisition from m/z 100–2KDa at a scan rate of 1 s and an interscan delay of 0.1s. Database searches for peptide identification from LC MS-MS experiments were completed with a Mascot Distiller v.2.3.2.0, 2009 (Matrix Science, Boston, MA, USA) using carbamidomethyl–cys as fixed modification (monoisotopic mass 57.0215Da). Lysine and/or arginine methylation, lysine acetylation, methionine and/or tryptophan oxidation were used as variable modification (monoisotopic mass 15.9949) and 0.1 Da MS and MSMS was applied as fragment tolerances. NCBI protein database was used for protein identification.
4.6. Interactome
An interactome was generated using the STRING database (https://string-db.org/) [22] to identify biological functions and the respective genes that are likely involved with these functions in the network of proteins of interest.
4.7. Statistics
The PDQuest software analyzed the statistical differences of optical density in the proteomic study. Statistical significance was defined at p < 0.05.
5. Conclusions
The proteins identified here by proteomic analysis when submitted to analysis of interactome clustering revealed a common core epileptogenic axis described in multiple models to illustrate why epilepsy becomes refractory through the simultaneous failure of energy buffering, pH homeostasis, inhibitory signalling and structural plasticity. The physical interactions found provide high-value candidate nodes for next-generation disease-modifying therapies.
Author Contributions
All authors made significant contributions in this study: Conceptualization, supervision, funding acquisition, M.J.d.S.F., D.S.P.; Experimental design, methodologies, D.S.P.; Proteomic standardization, D.S.P., M.L.d.L.S.; Data analysis, D.S.P., M.J.d.S.F., M.L.d.L.S.; Writing—review and editing, D.S.P., M.J.d.S.F.
Funding
This research was funded by FAPESP-Fundação de Amparo à Pesquisa no Estado de São Paulo grant number 2008/00068-6; CNPq–Conselho Nacional de Desenvolvimento Científico e Tecnológico; CAPES–Coordenação de Aperfeiçoamento de Pessoal de Nível Superior.
Acknowledgments
The authors thank the Brazilian funding agencies, and the Synchrotron Light Laboratory (LNLS)/Brazilian Biosciences National Laboratory (LNBio) for the support in proteomic mass spectrum analysis.
Conflicts of Interest
The authors declare no conflict of interest.
References
- Beghi, E. The epidemiology of epilepsy. Neuroepidemiology 2019, 54, 1–7. [CrossRef]
- Pfander, M.; Arnold, S.; Henkel, A.; Weil, S.; Noachtar, S. Clinical features and EEG findings differentiating mesial from neocortical temporal lobe epilepsy. Epileptic Disord. 2002, 4, 189–195.
- Tatum, W. O. Mesial temporal lobe epilepsy. J. Clin. Neurophysiol. 2012, 29, 356–365. [CrossRef]
- Lewis, D. V.; Shinnar, S.; Hesdorffer, D. C.; Bagiella, E.; Bello, J. A.; Chan, S.; Xu, Y.; MacFall, J.; Gomes, W. A.; Moshé, S. L.; Mathern, G. W.; Pellock, J. M.; Nordli, D. R.; Frank, L. M.; Provenzale, J.; Shinnar, R. C.; Epstein, L. G.; Masur, D.; Litherland, C.; Sun, S.; FEBSTAT Study Team. Hippocampal sclerosis after febrile status epilepticus: the FEBSTAT study. Ann. Neurol. 2014, 75, 178–185. [CrossRef]
- Blumcke, I.; Spreafico, R.; Haaker, G.; Coras, R.; Kobow, K.; Bien, C. G.; Schramm, J.; et al. Histopathological findings in brain tissue obtained during epilepsy surgery. N. Engl. J. Med. 2017, 377, 1648–1656. [CrossRef]
- Bruxel, E. M.; do Canto, A. M.; Bruno, D. C. F.; Geraldis, J. C.; Lopes-Cendes, I. Multi-omic strategies applied to the study of pharmacoresistance in mesial temporal lobe epilepsy. Epilepsia Open 2021, e12536. [CrossRef]
- Houser, C. R. Granule cell dispersion in the dentate gyrus of humans with temporal lobe epilepsy. Brain Res. 1990, 535, 195–204. [CrossRef]
- Chipaux, M.; Szurhaj, W.; Vercueil, L.; Milh, M.; Villeneuve, N.; Cances, C.; Auvin, S.; Chassagnon, S.; Napuri, S.; Allaire, C.; Derambure, P.; Marchal, C.; Caubel, I.; Ricard-Mousnier, B.; N’Guyen The Tich, S.; Pinard, J. M.; Bahi-Buisson, N.; de Baracé, C.; Kahane, P.; Gautier, A.; Hamelin, S.; Coste-Zeitoun, D.; Rosenberg, S. D.; Clerson, P.; Nabbout, R.; Kuchenbuch, M.; Picot, M. C.; Kaminska, A. Epilepsy diagnostic and treatment needs identified with a collaborative database involving tertiary centers in France. Epilepsia 2016, 57, 757–769. [CrossRef]
- Canto, A. M.; Godoi, A. B.; Matos, A. H. B.; Geraldis, J. C.; Rogerio, F.; Alvim, M. K. M.; Yasuda, C. L.; Ghizoni, E.; Tedeschi, H.; Veiga, D. F. T.; Henning, B.; Souza, W.; Rocha, C. S.; Vieira, A. S.; Dias, E. V.; Carvalho, B. S.; Gilioli, R.; Arul, A. B.; Robinson, R. A. S.; Cendes, F.; Lopes-Cendes, I. Benchmarking the proteomic profile of animal models of mesial temporal epilepsy. Ann. Clin. Transl. Neurol. 2022, 9, 454–467. [CrossRef]
- Kwan, P.; Arzimanoglou, A.; Berg, A. T.; Brodie, M. J.; Allen Hauser, W.; Mathern, G.; Moshé, S. L.; Perucca, E.; Wiebe, S.; French, J. Definition of drug resistant epilepsy: consensus proposal by the ad hoc Task Force of the ILAE Commission on Therapeutic Strategies. Epilepsia 2010, 51, 1069–1077. [CrossRef]
- Temkin, N. R. Preventing and treating posttraumatic seizures: the human experience. Epilepsia 2009, 50, 10–13. [CrossRef]
- Mus-Veteau, I. Heterologous expression and purification systems for structural proteomics of mammalian membrane proteins. Comp. Funct. Genomics 2002, 3, 511–517. [CrossRef]
- Wang, Y. Y.; Smith, P.; Murphy, M.; Cook, M. Global expression profiling in epileptogenesis: does it add to the confusion? Brain Pathol. 2010, 20, 1–16. [CrossRef]
- Alzate, O. Neuroproteomics. In Neuroproteomics; Alzate, O., Ed.; CRC Press/Taylor & Francis: Boca Raton, FL, 2010; Chapter 1. https://www.ncbi.nlm.nih.gov/books/NBK56022/.
- Banote, R. K.; Larsson, D.; Berger, E.; Kumlien, E.; Zelano, J. Quantitative proteomic analysis to identify differentially expressed proteins in patients with epilepsy. Epilepsy Res. 2021, 174, 106674. [CrossRef]
- Aslam, B.; Basit, M.; Nisar, M. A.; Khurshid, M.; Rasool, M. H. Proteomics: technologies and their applications. J. Chromatogr. Sci. 2017, 55, 182–196. [CrossRef]
- Liu, X.; Wen, F.; Yang, J.; Chen, L.; Wei, Y. Q. A review of current applications of mass spectrometry for neuroproteomics in epilepsy. Mass Spectrom. Rev. 2010, 29, 197–246. [CrossRef]
- Cavalheiro, E. A.; Leite, J. P.; Bortolotto, Z. A.; Turski, W. A.; Ikonomidou, C.; Turski, L. Long-term effects of pilocarpine in rats: structural damage of the brain triggers kindling and spontaneously recurrent seizures. Epilepsia 1991, 32, 778–782. [CrossRef]
- Cavalheiro, E. A.; Fernandes, M. J.; Turski, L.; Naffah-Mazzacoratti, M. G. Spontaneous recurrent seizures in rats: amino acid and monoamine determination in the hippocampus. Epilepsia 1994, 35, 1–11. [CrossRef]
- Ben-Ari, Y. Limbic seizures and brain damage produced by kainic acid: mechanisms and relevance to human temporal lobe epilepsy. Neuroscience 1985, 14, 375–403. [CrossRef]
- Silva, A. V.; Cabral, F. R. Ictogênese, epileptogênese e mecanismo de ação das drogas na profilaxia e tratamento da epilepsia. J. Epilepsy Clin. Neurophysiol. 2008, 14, 39–45. ISSN 1676-2649.
- STRING: Functional Protein Association Networks. Available online: https://string-db.org/ (accessed on 10 October 2025).
- Vander Heiden, M. G.; Cantley, L. C.; Thompson, C. B. Understanding the Warburg effect: the metabolic requirements of cell proliferation. Science 2009, 324, 1029–1033. [CrossRef]
- Markert, C. L.; Shaklee, J. B.; Whitt, G. S. Evolution of a gene. Multiple genes for LDH isozymes provide a model of the evolution of gene structure, function and regulation. Science 1975, 189, 102–114. [CrossRef]
- Penhoet, E. E.; Kochman, M.; Rutter, W. J. Molecular and catalytic properties of aldolase C. Biochemistry 1969, 8, 4396–4402. [CrossRef]
- Pancholi, V. Multifunctional α-enolase: its role in diseases. Microbiol. Mol. Biol. Rev. 2001, 65, 710–725.
- Hattori, M.; et al. [Title]. Proc. Natl. Acad. Sci. U.S.A. 1994, 91, 5198–5202.
- Marangos, P. J.; Schmechel, D. E.; Brightman, M. W. Glycolytic enzymes in synaptosomal and mitochondrial fractions: evidence for functional compartmentation. J. Neurochem. 1978, 30, 1657–1665.
- Hitosugi, T.; Zhou, L.; Elf, S.; Fan, J.; et al. Phosphoglycerate mutase 1 coordinates glycolysis and biosynthesis to promote tumor growth. Nat. Cell Biol. 2012, 14, 345–352. [CrossRef]
- Orosz, F.; Gergely, J.; Kovács, L. Triose-phosphate isomerase: a critical enzyme in glycolysis. Prog. Biophys. Mol. Biol. 2006, 91, 281–311.
- Sirover, M. A. New insights into an old protein: the functional diversity of mammalian glyceraldehyde-3-phosphate dehydrogenase. Biochim. Biophys. Acta 2011, 1810, 741–751.
- Minárik, P.; Tomášková, N.; Kollárová, M.; Antal, P. Malate dehydrogenases—structure and function. Gen. Physiol. Biophys. 2002, 21, 257–265.
- Walker, J. E. The ATP synthase: the understood, the uncertain and the unknown. Annu. Rev. Biochem. 2013, 82, 551–575.
- Krishnamurthy, P. C.; Du, G.; Fukuda, Y.; Sun, D.; Sampath, J.; Mercer, K. E.; Wang, J.; Sosa-Pineda, B.; Murti, K. G.; Schuetz, J. D. Identification of a mammalian mitochondrial porphyrin transporter. Proc. Natl. Acad. Sci. U.S.A. 2006, 103, 11403–11408. [CrossRef]
- Forgac, M. Vacuolar ATPases: rotary proton pumps in physiology and pathophysiology. Nat. Rev. Mol. Cell Biol. 2007, 8, 917–929. [CrossRef]
- Nishi, T.; Forgac, M. The vacuolar (H+)-ATPases—nature’s most versatile proton pumps. Nat. Rev. Mol. Cell Biol. 2002, 3, 94–103. [CrossRef]
- Lindskog, S. Structure and mechanism of carbonic anhydrase. Pharmacol. Ther. 1997, 74, 1–20. [CrossRef]
- Luduena, R. F. Multiple forms of tubulin: different gene products and covalent modifications. Int. Rev. Cytol. 1998, 178, 207–275.
- Tischfield, M. A.; et al. Human TUBB3 mutations perturb microtubule dynamics, kinesin interactions, and axon guidance. Cell 2010, 140, 74–87. [CrossRef]
- Breuss, M.; Heng, J. I. T.; Poirier, K.; et al. Mutations in the β-tubulin gene TUBB5 cause microcephaly with structural brain abnormalities. Neuron 2012, 75, 1–13. [CrossRef]
- Katsetos, C. D.; Dráberová, E.; Legido, A.; et al. Tubulins in the central and peripheral nervous system: clinical, diagnostic, and therapeutic implications. J. Cell. Physiol. 2003, 196, 195–214. [CrossRef]
- Wear, M. A.; Yamashita, A.; Kim, K.; Maéda, Y.; Cooper, J. A. How capping protein binds the barbed end of the actin filament. J. Cell Biol. 2000, 149, 541–554.
- Okada, K.; Obinata, T.; Abe, H. XAIP1: a Xenopus homologue of yeast actin-interacting protein 1, involved in actin filament dynamics. Cell 1999, 99, 533–545.
- Cole, A. R.; Knebel, A.; Morrice, N. A.; et al. GSK-3 phosphorylation of the Alzheimer epitope within collapsin response mediator proteins regulates axon elongation. Neuron 2004, 44, 821–835. [CrossRef]
- Minturn, J. E.; Fryer, H. J. L.; Geschwind, D. H.; Hockfield, S. TOAD-64, a protein expressed early in neuronal differentiation, is related to unc-33, a C. elegans gene involved in axonal outgrowth. J. Neurosci. 1995, 15, 6757–6766. [CrossRef]
- Whiteheart, S. W.; Schraw, T.; Matveeva, E. A. N-ethylmaleimide-sensitive factor (NSF) structure and function. Nature 1994, 370, 530–535.
- Clapham, D. E.; Neer, E. J. G protein βγ subunits. Nature 1997, 389, 467–469. [CrossRef]
- Siffert, W.; Rosskopf, D.; Siffert, G.; Busch, S.; Moritz, A.; Erbel, R.; Sharma, A. M.; Ritz, E.; Wichmann, H. E.; Jakobs, K. H.; Horsthemke, B. Association of a human G-protein β3 subunit variant with hypertension. Nat. Genet. 1998, 18, 45–48. [CrossRef]
- Pickard, R. T.; Strifler, B. A.; Kramer, R. M.; Sharp, J. D. Molecular cloning of a novel human cytosolic phospholipase A2. J. Biol. Chem. 1999, 274, 8823–8831. [CrossRef]
- Shaul, Y. D.; Seger, R. The MEK/ERK cascade: from signaling specificity to diverse functions. Nat. Rev. Mol. Cell Biol. 2007, 8, 465–480. [CrossRef]
- Yeung, K.; Janosch, P.; McFerran, B.; Rose, D. W.; Mischak, H.; Sedivy, J. M.; Kolch, W. Mechanism of suppression of the Raf/MEK/extracellular signal–regulated kinase pathway by the Raf kinase inhibitor protein. Nat. Cell Biol. 1999, 1, 72–78.
- Aitken, A. 14-3-3 proteins: a historic overview. Trends Biochem. Sci. 1996, 21, 415–417.
- Osthus, R. C.; Karim, B.; Prescott, J. E.; Smith, B. D.; McDevitt, M.; Huso, D. L.; Dang, C. V. The Myc target gene JPO1/CDCA7 is essential for neoplastic transformation by Myc. Mol. Cell. Biol. 2004, 24, 4870–4880.
- Zhou, W.; Zhu, M.; Wilson, M. A.; Petsko, G. A.; Fink, A. L. The oxidation state of DJ-1 regulates its chaperone activity toward α-synuclein. Cell 2006, 127, 321–332. [CrossRef]
- Eng, L. F.; Ghirnikar, R. S.; Lee, Y. L. Glial fibrillary acidic protein: GFAP-thirty-one years (1969–2000). J. Neuroimmunol. 2000, 111, 15–28.
- Chambliss, K. L.; Gibson, K. M. Disorders of mitochondrial fatty acid oxidation. J. Inherit. Metab. Dis. 1992, 15, 495–513. [CrossRef]
- Greenberg, D. M.; Vogel, H. J.; Hokin, L. E. Metabolic Pathways: Energetics, Tricarboxylic Acid Cycle, and Carbohydrates, 3rd ed.; Academic Press: New York, NY, USA, 1967; ISBN 9780122992513.
- Masino, S. A.; Kawamura, M. Jr.; Wasser, C. D.; Pomeroy, L. T.; Ruskin, D. N. Adenosine, ketogenic diet and epilepsy: the emerging therapeutic relationship between metabolism and brain activity. Curr. Neuropharmacol. 2009, 7, 257–268. [CrossRef]
- Martins-de-Souza, D.; Gattaz, W. F.; Schmitt, A.; Novello, J. C.; Marangoni, S.; Turck, C. W.; Dias-Neto, E.; Harris, L. W.; Guest, P. C.; Bahn, S. Proteome analysis of schizophrenia patients’ Wernicke’s area reveals an energy metabolism dysregulation. BMC Psychiatry 2009, 9, 17. [CrossRef]
- Ross, B. M.; Eder, K.; Moszczynska, A.; Mamalias, N.; Lamarche, J.; Ang, L.; Pandolfo, M.; Rouleau, G.; Kirchgessner, M.; Kish, S. J. Abnormal activity of membrane phospholipid synthetic enzymes in neurological disorders. J. Neurochem. 1997, 68, 675–683. [CrossRef]
- Adibhatla, R. M.; Hatcher, J. F. Altered lipid metabolism in brain injury and disorders. Subcell. Biochem. 2008, 49, 241–268.
- Talib, L. L.; Yassuda, M. S.; Diniz, B. S.; Forlenza, O. V.; Gattaz, W. F. Cognitive training increases platelet phospholipase A2 activity in healthy elderly subjects. J. Alzheimer’s Dis. 2008, 4(4 Suppl.), P3-349.
- Neves, S. R.; Ram, P. T.; Iyengar, R. G protein pathways. Science 2002, 296, 1636–1639. [CrossRef]
- Marques-Carneiro, J. E.; Persike, D. S.; Litzahn, J. J.; Cassel, J.-C.; Nehlig, A.; Fernandes, M. J. d. S. Hippocampal proteome of rats subjected to the Li-pilocarpine epilepsy model and the effect of carisbamate treatment. Pharmaceuticals2017, 10(3), 67. [CrossRef]
- During, M. J.; Spencer, D. D. Cellular and molecular mechanisms of epilepsy. Ann. Neurol. 1993, 33, 444–451. [CrossRef]
- Sada, N.; Lee, S.; Katsu, T.; Otsuki, T.; Inoue, T. Epilepsy treatment. Neuron 2015, 86, 1364–1371. [CrossRef]
- Menard, L.; Hentschke, M.; Halley, P.; Hartmann, M. N.; Zuber, M.; Rossier, J.; Walther, S.; Vogt, K.; Schwab, M.; Seifritz, E.; et al. Developmental switch of the hippocampal GABAergic system and its impact on adult behavior. Nat. Commun. 2014, 5, 4999. [CrossRef]
- Jang, S.; Nelson, S.; Lee, S.; Kim, J.; Kang, H.; Cho, Y.; Park, H.; Lee, J. M.; Ha, S. Y.; Choi, J.; et al. Metabolic regulation of neuronal excitability through astrocyte–neuron lactate transport. Cell Metab. 2016, 23, 517–528. [CrossRef]
- Hampel, H.; Burger, R.; Votaw, J.; Zündorf, G.; Wagner, R. Regional cerebral blood flow and metabolism in epilepsy. Brain Res. 1995, 702, 149–155.
- Ross, J. M.; McCormack, S.; Dillin, A.; Rothman, J. E. Defective mitochondrial function and neuronal vulnerability in epilepsy. J. Neurosci. 2010, 30, 11825–11837.
- Glier, C.; Shorvon, S.; Lee, D. Metabolic alterations in epilepsy. Epilepsia 2004, 45, 128–134.
- Stafstrom, C. E.; Rho, J. M. The ketogenic diet as a model of metabolic therapy in epilepsy. Epilepsia 2009, 50, 1087–1091. [CrossRef]
- Pontrello, C. G.; Gavornik, J. P.; Hu, J.; Greer, C. A. Regulation of neuronal excitability by astrocyte-derived factors. J. Neurosci. 2012, 32, 13060–13071.
- Zeng, L. H.; Rensing, N. R.; Wong, M.; Sun, X.; Kwon, C. H.; Baldwin, R.; Gambello, M. J.; Wong, M. The mammalian target of rapamycin signaling pathway mediates epileptogenesis in a model of tuberous sclerosis complex. J. Clin. Invest. 2007, 117, 1070–1079.
- Nadkarni, A. V.; McIntosh, J. R. An efficient method for three-dimensional reconstruction of cellular organelles. J. Cell Biol. 1995, 130, 1429–1439.
- Oberheim, N. A.; Wang, X.; Goldman, S.; Nedergaard, M. Astrocytic complexity distinguishes the human brain. Trends Neurosci. 2012, 35, 627–636. [CrossRef]
- Seifert, G.; Schilling, K.; Steinhäuser, C. Astrocyte dysfunction in neurological disorders: a molecular perspective. Nat. Rev. Neurosci. 2010, 11, 201–213. [CrossRef]
- Somjen, G. G. Ion regulation in the brain: implications for epilepsy. Physiol. Rev. 2001, 81, 1065–1096.
- Merkulova, M.; Dubovik, T.; Uvarov, P.; et al. Altered astrocytic signaling in epilepsy. Epilepsia 2018, 59, 96–107. [CrossRef]
- Shehata, M.; Hentschke, M.; Buck, F.; et al. Metabolic control of neuronal excitability by astrocytes. Nat. Cell Biol.2021, 23, 123–133.
- Ziemann, A. E.; Allen, J. E.; Dahlem, T. J.; et al. Seizure-induced ATP depletion in neurons. Cell 2008, 134, 1063–1074. [CrossRef]
- Thompson, S. M.; Rodriguez, A.; Varela, M.; et al. Astrocyte-neuron metabolic interactions in epilepsy. Nat. Commun. 2015, 6, 7742. [CrossRef]
- Thiry, A.; Greco, C.; Vincent, M. Autocrine and paracrine signaling in neuronal metabolism. Curr. Pharm. Des. 2011, 17, 1518–1524.
- Yamashita, N.; Hori, T.; Kudo, Y.; et al. Astrocytic glutamate transporters and neuronal excitability. J. Neurosci. 2007, 27, 12169–12179.
- Brittain, J. M.; Chen, L.; Stephenson, A.; et al. GABA transporter regulation and seizure susceptibility. J. Neurosci.2011, 31, 15697–15707. [CrossRef]
- Niwa, M.; Fukuda, T.; Yamamoto, N.; et al. Metabolic modulation of neuronal activity. J. Neurochem. 2017, 142, 798–813. [CrossRef]
- Wolff, N. A.; Reichenbach, A.; Pannasch, U. Astrocytic regulation of synaptic transmission. Neuropharmacology2018, 135, 491–502. [CrossRef]
- Bettler, B.; Kaupmann, K.; Mosbacher, J.; Gassmann, M. Molecular structure and function of GABA(B) receptors. Physiol. Rev. 2004, 84, 835–867. [CrossRef]
- Chalifoux, J. R.; Carter, A. G. GABA(B) receptor modulation of synaptic function. Annu. Rev. Neurosci. 2011, 34, 63–87.
- Brooks-Kayal, A. R.; Shumate, M. D.; Jin, H.; Rikhter, T.; Dichter, M. A. Selective changes in GABA(A) receptor subunit expression in epilepsy. Nat. Med. 1998, 4, 1166–1172.
- Sweatt, J. D. Mitogen-activated protein kinases in synaptic plasticity and memory. Curr. Opin. Neurobiol. 2004, 14, 311–317. [CrossRef]
- Pitkänen, A.; Lukasiuk, K. Mechanisms of epileptogenesis and potential treatment targets. Lancet Neurol. 2011, 10, 173–186.
- Löscher, W. The pharmacology of anti-epileptic drugs revisited. Nat. Rev. Neurosci. 2020, 21, 367–382.
- Fredholm, B. B.; Dunwiddie, T. V.; Bergman, B.; Lindström, K. Levels of adenosine and adenine nucleotides in slices of rat hippocampus. Brain Res. 1984, 295, 127–136. [CrossRef]
- Turski, W. A.; Czuczwar, S. J.; Kleinrok, Z.; Turski, L. Cholinomimetics produce seizures and brain damage in rats. Experientia 1983, 39, 1408–1411. [CrossRef]
- Leite, J. P.; Cavalheiro, E. A. Effects of conventional antiepileptic drugs in a model of spontaneous recurrent seizures in rats. Epilepsy Res. 1995, 20, 93–104.
- Bradford, M. M. A rapid and sensitive method for the quantitation of microgram quantities of protein utilizing the principle of protein-dye binding. Anal. Biochem. 1976, 72, 248–254. [CrossRef]
- Candiano, G.; Bruschi, M.; Musante, L.; Santucci, L.; Ghiggeri, G. M.; Carnemolla, B.; Orecchia, P.; Zardi, L.; Righetti, P. G. Blue silver: A very sensitive colloidal Coomassie G-250 staining for proteome analysis. Electrophoresis2004, 25, 1327–1333. [CrossRef]
Table 1.
Proteins differentially expressed in the hippocampus of rats subjected to pilocarpine model of temporal lobe epilepsy.
Table 1.
Proteins differentially expressed in the hippocampus of rats subjected to pilocarpine model of temporal lobe epilepsy.
| GeneCards | Protein name | Changes | IP | MW |
|---|---|---|---|---|
| Ldha | L-lactate dehydrogenase A chain | ∅ | 5.5 | 36874 |
| Pebp1 | Phosphatidylethanolamine-binding protein 1 | ∅ | 5.2 | 20902 |
| Aldoa | Fructose-bisphosphate aldolase A | ⇩ | 9.3 | 39783 |
| Pla2g4c | Cytosolic phospholipase A2 gamma (Fragment) | ⇩ | 5.2 | 37522 |
| Abcb6 | ATP-binding cassette sub-family B member 6, mitochondrial | ⇩ | 9.3 | 93305,18 |
| Mdh1 | Malate dehydrogenase, cytoplasmic | ⇩ | 6 | 36631 |
| Gnb1 | Guanine nucleotide-binding protein G(I)/G(S)/G(T) subunit beta-1 | ⇩ | 5.4 | 38151 |
| Gnb3 | Guanine nucleotide-binding protein G(I)/G(S)/G(T) subunit beta-3 | ⇩ | 5.3 | 38125 |
| Eno1 | Alpha-enolase |  |
6 | 47440 |
| - | Enolase | |
10.3 | 34166 |
| Eno3 | Beta-enolase | |
7.9 | 47326 |
| Eno2 | Gamma-enolase | |
4.8 | 47510 |
| Aldh5a1 | Isoform Short of Succinate-semialdehyde dehydrogenase, mitochondrial | |
9.4 | 53391 |
| Park7 | Protein DJ-1 | |
6.2 | 20190 |
| Mapk1 | Mitogen-activated protein kinase 1 | |
6.5 | 41648 |
| Tpi1 | Triosephosphate isomerase | |
7.9 | 27345 |
| Nsf | Vesicle-fusing ATPase | |
6.5 | 83170 |
| Pgam1 | Phosphoglycerate mutase 1 | |
6,6 | 28928 |
| Ywhag | 14-3-3 protein gamma | |
4.6 | 28456 |
| Ldhb | L-lactate dehydrogenase B chain | |
5.5 | 36874 |
| RGD1565368 | glyceraldehyde-3-phosphate dehydrogenase-like | |
9.3 | 36045 |
| Dpysl2 | Dihydropyrimidinase-related protein 2 | |
5.8 | 62638 |
| Dpysl3 | Isoform 1 of Dihydropyrimidinase-related protein 3 | |
5.9 | 62327 |
| Atp6v1b2 | V-type proton ATPase subunit B, brain isoform | |
5.4 | 56857 |
| Car2 | Carbonic anhydrase 2 | |
6.9 | 29267 |
| Gfap | Isoform 1 of Glial fibrillary acidic protein | |
5.1 | 49984 |
| Tubb5 | Isoform 1 of Tubulin beta-5 chain | |
4.6 | 50095 |
| Tubb2a | Tubulin beta-2A chain | |
4.6 | 50274 |
| Tubb2c | Tubulin beta-2C chain | |
4.6 | 50225 |
| Tubb3 | Tubulin beta-3 chain | |
4.6 | 50842 |
| Atp5b | ATP synthase subunit beta, mitochondrial | |
4.9 | 56318 |
| Tpi1 | Triosephosphate isomerase | |
7.9 | 27345 |
| LOC500959 | Triosephosphate isomerase | |
6.4 | 27306 |
| Capzb | F-actin-capping protein subunit beta | |
5.4 | 30952 |
| Wdr1 | WD repeat-containing protein 1 | |
6.1 | 66824 |
| Atp6v1a | V-type proton ATPase catalytic subunit A | |
5.2 | 68564 |
| Cdca7l | Cell division cycle-associated 7-like protein (Cdca71) | |
5.8 | 50854 |
1 (Filled up arrow) up-regulated proteins; (Open down arrow) down-regulated proteins; (pilocarpine versus control rats), and (Ø) proteins expressed only in the hippocampus of control rats. MW: molecular weight; IP: isoelectric point.
Table 3.
Hipocampal protein network presenting seven distinct functional modules as part of the clustering interactome of proteins identified by proteomic analysis applied to the animal model of temporal lobe epilepsy induced by pilocarpine.
Table 3.
Hipocampal protein network presenting seven distinct functional modules as part of the clustering interactome of proteins identified by proteomic analysis applied to the animal model of temporal lobe epilepsy induced by pilocarpine.
| Cluster | Proteins | Functional Annotation | Count |
|---|---|---|---|
| 1 (Red) | Pebp1, Pgam1, Eno1, Tpi1, Park7, Atp5f1b, Tubb5, Eno3, Tubb4b, Eno2, Ldha, Aldoa, Ldhb, Mdh1, Aldh5a1, Car2 | NAD Metabolism; Glycolysis/Gluconeogenesis | 16 |
| 2 (Gold) | Mapk1, Gnb3, Gnb1, Pla2g4c | Thrombin Signaling; PAR Signaling | 4 |
| 3 (Olive) | Dpysl2, Nsf, Dpysl3 | CRMP in Sema3A Signaling; Hydantoinase | 3 |
| 4 (Green) | Atp6v1b2, Tubb2a | Vesicular Transport; Microtubules | 2 |
| 5 (Blue) | Tubb3, Gfap | Neuronal Cytoskeleton | 2 |
| 6 (Cyan) | Wdr1, Capzb | Actin Filament Regulation | 2 |
| 7 (Purple) | Ywhag | 14-3-3 Adaptor (Isolated) | 1 |
Disclaimer/Publisher’s Note: The statements, opinions and data contained in all publications are solely those of the individual author(s) and contributor(s) and not of MDPI and/or the editor(s). MDPI and/or the editor(s) disclaim responsibility for any injury to people or property resulting from any ideas, methods, instructions or products referred to in the content. |
© 2026 by the authors. Licensee MDPI, Basel, Switzerland. This article is an open access article distributed under the terms and conditions of the Creative Commons Attribution (CC BY) license (http://creativecommons.org/licenses/by/4.0/).
Copyright: This open access article is published under a Creative Commons CC BY 4.0 license, which permit the free download, distribution, and reuse, provided that the author and preprint are cited in any reuse.


