
Submitted:
01 January 2026
Posted:
04 January 2026
You are already at the latest version
Abstract
Purpose: Chronic Obstructive Pulmonary Disease (COPD) is a progressive respiratory condition often accompanied by various comorbidities that significantly affect patient outcomes. High resolution computed tomography has emerged as a valuable tool for diagnosing and managing COPD-related comorbidities. This study aims to explore the impact of chest CT imaging in identifying and characterizing comorbidities in COPD patients. Methods: The study was conducted on 99 patients with COPD, with an average age of 67,8 (37-88), 86% were men (85), and 14% were women (14). The patients underwent chest HRCT to identify the presence of comorbidities. Results: According to the GOLD classification, ABE type, 3% were type A, 27% were type B, and 69% were type E. The prevalence of comorbidities identified on chest HRCT was reported as 66% for coronary artery calcification (CAC), 83% for osteoporosis, 36% for pulmonary artery enlargement (PAE), 31% for emphysema, 19% for bronchiectasis, 17% for hiatal hernia, 14% for lung cancer, 12% pulmonary infections and 3% for interstitial abnormalities. In 4% there were no comorbidities, one comorbidity was found in 11%, two comorbidities in 17%, and three comorbidities and more in 68% of cases. Conclusion: Chest HRCT imaging serves as a valuable tool for identifying and assessing comorbidities in patients with COPD. Incorporating chest CT imaging into the routine evaluation of COPD patients can contribute to a more comprehensive understanding of their condition and lead to better clinical outcomes.
Keywords:
COPD
; comorbidities
; chest HRCT
; chest computed tomography
1. Introduction
Chronic Obstructive Pulmonary Disease (COPD), is now one of the top three causes of death worldwide. [1] COPD represents an important public health challenge that is preventable and treatable. [2] COPD is a leading cause of morbidity and mortality globally with a huge social and an economic burden. [3] The prevalence of COPD is often directly related to the prevalence of tobacco smoking. [4] occupational, outdoor and household air pollution, they are important COPD risk factors. [1] COPD is a complex disease with pulmonary and extra pulmonary manifestations, [5,6] due to pulmonary and systemic inflammation. [7] As shown in Figure 1, COPD progression involves a complex interplay between airflow limitation, systemic inflammation, and multi-organ comorbidities.
COPD frequently coexists with other conditions known as comorbidities. [8,9,10] Some of these are identifiable using validated chest computed tomography techniques (CT chest). These include coronary artery calcification, osteoporosis, pulmonary artery enlargement, bronchiectasis, hiatal hernia, lung cancer, pulmonary infections and interstitial abnormalities. [11] In patients with COPD, chest CT is frequently used to evaluate lung parenchyma and airways. [12] Also annual low-dose CT scan is recommended for lung cancer screening in heavy smokers with COPD [1], CT is a noninvasive imaging modality that provides additional insight into structural and pathophysiologic pulmonary parameters, leading to a better understanding of disease variability and further characterization of COPD phenotypes, for lung cancer screening, evaluation of pulmonary nodules detected on chest X-ray [13], assessment of concurrent interstitial lung disease, pulmonary artery enlargement, cardiovascular disease, or infection. CT clearly has the potential to become a powerful tool in the quest of personalized medicine in COPD. This study was carried out in a cohort of COPD patients attending pulmonary clinics with the aim to: assess the prevalence of comorbidities identified through CT imaging.
2. Materials and Methods
2.1. Participants
This was a retrospective, observational study involving COPD inpatients who were prospectively enrolled between 2022 and 2023. All participants had mild to severe airway obstruction. COPD was diagnosed based on the GOLD 2024 criteria. Spirometric lung function data included forced expiratory volume in 1 s (FEV1) and forced vital capacity (FVC). GOLD grades 1–4 were defined as follows: post-bronchodilator FEV1/FVC < 0.7, with GOLD grade 1 (mild) defined as FEV1 ≥ 80% predicted, GOLD grade 2 (moderate) as 50% ≤ FEV1 < 80% predicted, GOLD grade 3 (severe) as 30% ≤ FEV1 < 50% predicted, and GOLD grade 4 (very severe) as FEV1 < 30% predicted. GOLD groups A, B, and E, were based on the modified Medical Research Council (mMRC) dyspnea scale, in combination with the exacerbation risk, which was determined based on a 12-month history of exacerbations of all severities, including hospitalizations. Smoking status was classified as active smokers compared to non-smokers or ex-smokers. Exclusion criteria included uncontrolled comorbidities, such as pulmonary tuberculosis. At baseline, the following data were collected: age, gender, smoking status, and the occurrence of exacerbations in the previous year. The presence of comorbidities was recorded based on patients’ reports of physician-diagnosed conditions.
CT-diagnosed comorbidities were compared with those previously recorded in the patients’ medical files.
The research protocol was reviewed and approved by the Research Ethics Committee of the Nicolae Testemitanu State University of Medicine and Pharmacy, Chisinau, Republic of Moldova, on May 18, 2022 (Approval No. 4), in accordance with the ethical standards of the institution and international research guidelines.
2.2. Chest CT Protocol and CT-Assessed Comorbidities
The study subjects underwent imaging with 128-detector row CT scanners (SOMATOM Perspective; Siemens, Germany). Images were obtained during breath hold at full inspiration in the supine position. Acquisition parameters were as follows: tube voltage, 120–140 kVp; tube current, 30–100 mAs; and collimation, 0.6–1 mm. Reconstruction parameters were as follows: kernel, medium/high resolution (B50f); slice thickness, 0,75 mm; and slice interval, 1 mm. The images were reviewed by using a post processing workstation Phillips, IntelliSpace Portal, with window level -600 HU and window with 1,600 HU.
The L1 vertebra is most commonly measured because it is generally included in CT examinations of the thoracolumbar spine, chest, and abdomen. Osteoporosis is typically indicated by an attenuation of 90 HU or less (specificity > 90%). Conversely, an attenuation greater than 160 HU essentially rules out osteoporosis, with a negative predictive value of 95%14. For coronary artery calcification, the most commonly used method is the Agatston score, which employs a threshold of >130 Hounsfield units and an area of three or more pixels to identify calcified plaque within the track of the epicardial vessels on non-contrast CT. The calcium score can be categorized as minimal (0–10), mild (11–100), moderate (101–400), or severe (>400). PAE was defined as a PAD ≥29 mm in men and ≥27 mm in women.
Over the last two decades, chest CT has been the gold standard for the in vivo diagnosis of bronchiectasis. Bronchiectasis is diagnosed when an abnormally wide and often thickened airway is observed, which typically also shows a lack of tapering. Based on appearance and severity, bronchiectasis can be classified as cylindrical, varicose, or cystic.
A hiatal hernia (HH) is the herniation of abdominal organs and structures through the esophageal hiatus of the diaphragm into the thoracic cavity. There are four types of HH: sliding (type 1), paraesophageal (rolling) (type 2), mixed (type 3), and mixed type with herniation of visceral organs (type 4).
Chest CT remains the standard imaging test for the initial assessment of suspected lung cancer. The use of thin-section multi-detector CT often detects numerous pulmonary nodules. Nodule characterization on CT relies on morphological criteria, such as irregular or spiculated margins for malignancy and calcifications for benignity. Hilar tumors are those with the center of mass within or proximal to the bronchial lumen, while peripheral tumors are distal to a segmental bronchus. Lymph nodes are considered enlarged if their short-axis diameter is ≥10 mm.
The typical appearance of acute community-acquired pneumonia (CAP) is a single subpleural area of alveolar consolidation with blurred margins, restricted to the region next to the fissures. It progresses to a systematized segmental opacity affecting one or several contiguous segments or a lobe, with or without the air bronchogram sign. Ground-glass opacities may also be present adjacent to the alveolar consolidation due to partial alveolar filling [15].
ILA is defined as incidental CT findings of nondependent abnormalities affecting more than 5% of any lung zone (upper, middle, and lower lung zones are demarcated by the levels of the inferior aortic arch and right inferior pulmonary vein). These findings include ground-glass or reticular abnormalities, lung distortion, traction bronchiectasis or bronchiolectasis, honeycombing, and nonemphysematous cysts.
Chest computed tomography (CT) is a non-invasive imaging modality that offers valuable insight into structural and pathophysiological pulmonary parameters, enhancing the understanding of disease variability and further characterizing COPD phenotypes, such as emphysema, airway disease, and/or air trapping.16 Quantitative CT evaluation can effectively identify emphysema. The visual classification system from the Fleischner Society grades the severity of parenchymal (nonparaseptal) emphysema as trace, mild, moderate, confluent, and advanced destructive emphysema, as well as paraseptal and panlobular emphysema. Quantitative CT evaluation can affectively identify emphysema and visualize different morphological patterns, as shown in Figure 2.
2.3. Statistical Analysis
Categorical data are presented as frequency, percentage (%) and were compared using the Chi square test or Fisher’s exact test as appropriate. Means were compared using the independent sample t-test and medians using the Mann-Whitney U test. In these analyses, age and gender were always included as predictors. Other predictors were included according to the specific study question (see results). All analyses were performed with the software SPSS Statistics V22.0 (IBM Corp., NY, USA).
3. Results
The study was conducted on 99 patients with COPD, with an average age of 67.8 years (ranging from 37 to 88). Of the participants, 86% were men and 14% were women. Baseline demographic and functional characteristics of the study cohort are summarized in Table 1.
As illustrated in Figure 3, the predominance of GOLD type E among the study participants followed by type B and a minority of type A.
The prevalence of HRCT- detected comorbidities among COPD patients is summarized in Table 2.
According to Figure 4, the majority of patients exhibited multimorbidity, emphasizing the systemic nature of COPD.
Detailed HRCT examples of emphysema morphology and bronchial stenosis are presented in Figure 5.
As depicted in Figure 6, chest CT further revealed a wide spectrum of comorbidities, including bronchiectasis, pulmonary artery enlargement, osteoporosis, and interstitial lung disease.
Further CT examples of infectious and vascular comorbidities are presented in Figure 7.
As demonstrated in Figure 8, HRCT also revealed extrapulmonary changes, including hiatal gernia and hepatic steatosis, further supporting the systemic nature of COPD.
Advanced pulmonary vascular changes and cardiovascular calcifications were observed on CT, as illustrated in Figure 9.
4. Discussion
In this study, we can observe that patients with COPD, based on the analyzed variables and the data obtained from computed tomography, show a higher prevalence of imaging-based comorbidities compared to the comorbidities established through clinical criteria.
Osteoporosis is a significant comorbidity in COPD patients. The World Health Organization (WHO) defined osteoporosis as ‘‘a disease characterized by low bone mass and micro-architectural deterioration of bone tissue, leading to enhanced bone fragility and a consequent increase in fracture risk’’.[17] We found that 83% of the pacients with COPD had CT-defined osteoporosis, a higher prevalence similar to other studies.[18,19,20,21] Osteoporosis affects a significant proportion of patients with COPD. Studies have reported prevalence rates ranging from 35% to over 70%, depending on disease severity, population characteristics, and diagnostic modalities used. [22,23] In the ECLIPSE study, which included a large international COPD cohort, osteoporosis was present in approximately 69% of participants when evaluated with DXA and CT indicators.[23] The identification of osteoporosis via chest computed tomography (CT), routinely performed in COPD management, has garnered attention for its ability to uncover subclinical bone loss not otherwise captured by traditional methods such as dual-energy X-ray absorptiometry (DXA). Graat-Verboom et al. demonstrated that thoracic CT could predict osteoporosis in 80% of COPD outpatients, supporting its role in comorbidity screening [23]. The gold standard for diagnosing osteoporosis is dual-energy X-ray absorptiometry (DXA) and DXA of the lumbar spine and hip being the most common method.[24]
COPD and coronary artery calcification were found in 66% of cases. Multiple studies have demonstrated a higher prevalence of CAC in COPD patients compared to age- and smoking-matched controls. In the ECLIPSE study, which included over 2,000 subjects, CAC was observed in up to 67% of COPD patients, significantly higher than in matched controls without airflow limitation. [25] Similarly, in the MESA-Lung Study, the prevalence of CAC (Agatston score >0) among COPD patients reached 70%, and the severity of calcification was associated with worse lung function.[26] Coronary artery calcification can be identified by CT and is pathognomonic of coronary atherosclerosis. When considering CT for COPD phenotyping, coronary vessel wall calcification could be a potential marker of cardiac disease.[27] Both diseases have a high worldwide prevalence and frequently coexist.[27] Coronary vessel wall calcifications are an independent risk factor for mortality in patients with and without COPD. Therefore, it is considered to be clinically valuable to quantify this finding and estimate the individual risk for cardiac ischemia in COPD patients presenting with calcification on CT.[28] A population-based study by Chiles et al. showed that CAC detected incidentally on lung cancer screening CT scans was independently associated with cardiovascular mortality, emphasizing the prognostic value of this finding in smokers, many of whom also have COPD [29].
Pulmonary artery enlargement (PAE) was established in 36%. The incidence of pulmonary hypertension (PH) varies in patients with COPD. It is usually associated with a severe degree of airway obstruction and is prevalent in 25–35% of the severely affected COPD population, but it has also been described as frequent in 5–7% of patients with only mild to moderate degree. A landmark study by Wells et al. reported a prevalence of PAE (defined as a pulmonary artery to ascending aorta diameter ratio [PA/Ao] >1) in 50% of patients hospitalized with COPD exacerbations, and in 20% of stable COPD patients. [30] Other studies report prevalence rates ranging between 25–45%, depending on disease severity and imaging modality used.[31] In the ECLIPSE study, PAE was also found to correlate with increasing GOLD stages and was associated with a higher frequency of exacerbations and hospitalizations.[32] Right-sided heart catheterization (RHC) is considered the gold standard for diagnosing pulmonary hypertension (PH), but it is rarely performed in patients with COPD due to its invasive nature and the lack of effective treatment options. Instead, echocardiography, which estimates pulmonary artery systolic pressure (PASP), is the most commonly used noninvasive screening method for PH. However, this technique is not sufficiently accurate, particularly in COPD patients, as factors such as lung hyperinflation and adipose tissue can interfere with the quality of the echocardiographic examination.[33,34]
COPD and bronchiectasis were identified in 19% cases. Both are very prevalent in the general population, and they may both coexist. Several studies have documented the presence of bronchiectasis in 15–45% of patients with COPD, with the highest prevalence observed in individuals with frequent exacerbations and moderate-to-severe airflow limitation.[35] A multicenter study by Martínez-García et al. identified bronchiectasis in 29% of COPD patients undergoing HRCT, and its presence was independently associated with a history of more than two exacerbations per year. [36] High-resolution computed tomography (HRCT) is essential in diagnosing bronchiectasis, which often remains under-recognized in patients with chronic respiratory symptoms. There is a strong possibility of misdiagnosis in favor of COPD, because spirometry is more widely available than CT scans and physicians usually think primarily about COPD when confronted with a smoker with cough, sputum production, and airflow obstruction. Furthermore, in COPD patients with pulmonary hypertension, the diagnostic criterion for bronchiectasis (based on the demonstration of a bronchial lumen diameter greater than the diameter of the adjacent vessel) may be misleading.[37]
17% of COPD patients were identified with hiatal hernia (HH). Several observational studies have reported a higher prevalence of HH in COPD patients than in the general population. In one study using chest CT in stable COPD patients, the prevalence of radiologically detected HH was approximately 17–21%, depending on the severity of disease and criteria used.[38,39] HHs are easily identified on non-contrast CT of the chest as a proximal displacement of the esophagogastric junction through the esophageal hiatus of the diaphragm into the mediastinum.[40] Since COPD patients routinely undergo CT scans of the thorax, our aim was to 1) formally define hiatal hernia seen on CT and 2) determine if these findings can be used as a visual marker to identify patients who may be frequent exacerbators, especially given the relationship between GERD and increased COPD exacerbations.[41]
Lung cancer is the second most common malignancy worldwide, resulting in one-quarter of all cancer-related deaths. Patients with COPD have a 2- to 6-fold increased risk of developing lung cancer compared to smokers without airflow limitation. [42] In this study, lung cancer (pulmonary nodules or pulmonary masses) was found in 14% of cases. In a prospective cohort study involving over 2,000 participants with COPD, the 10-year cumulative incidence of lung cancer was approximately 16–20%, particularly in those with emphysema-dominant phenotypes and GOLD stage III/IV airflow limitation. [43] CT with virtual bronchoscopy (VB) has been found to be very helpful in defining the location, extent, and nature of these lesions, and is increasingly being used even in patients with contraindications for fiberoptic bronchoscopy and laryngoscopy. VB is one of the most recently developed interactive 3D techniques applicable to the tracheobronchial tree. [44] The presence of emphysema, interstitial abnormalities, or both are significant risk factors for future lung cancer development in COPD patients.[45]
Infections are among the most frequent and impactful comorbidities in chronic obstructive pulmonary disease (COPD), contributing significantly to disease progression, acute exacerbations, and mortality. Both acute and chronic infections shape the clinical course of COPD, and modern imaging, especially computed tomography (CT), plays a central role in detecting infection-related structural lung changes. Respiratory infections are the leading cause of exacerbations in COPD, accounting for 50–80% of acute events. Infection as an associated condition of COPD was observed in 12% in this study. Bacterial infections are implicated in approximately 55% of exacerbations, while viral infections are found in 30–40%, often coexisting with bacterial pathogens. [46,47] In large COPD cohorts (e.g., ECLIPSE, SPIROMICS), annual exacerbation rates range from 0.85 to 1.3 per patient, with higher rates in patients with prior exacerbations or advanced disease. [48] Since these infections significantly affect the clinical progression of the patient with COPD, they represent a notable comorbidity in COPD. Infection and COPD seem to have a reciprocal and causative relationship, thus recognizing infection as an associated condition in COPD. [49]
Interstitial lung abnormalities (ILA) refer to specific, subtle patterns of increased lung density on chest computed tomography (CT) that are not diagnostic of interstitial lung disease (ILD) but may reflect early fibrotic changes. In patients with chronic obstructive pulmonary disease (COPD), the coexistence of ILA may define a distinct clinical and radiological phenotype with unique prognostic implications. Interstitial abnormalities in COPD were identified only in 3% of cases. The reported prevalence of ILA in COPD patients varies between 2% and 10%, depending on age, smoking status, and imaging resolution. In the COPDGene study, ILA were identified in approximately 8% of COPD patients, while a lower prevalence (~3%) was observed in general imaging-based screening studies. [50]
5. Conclusions
Comorbidities are common in COPD patients, and their assessment should be done routinely. The identification of comorbidities through chest CT in patients with COPD holds significant clinical value. Numerous studies have demonstrated that comorbidities such as cardiovascular diseases, lung cancer, osteoporosis, bronchiectasis, and pulmonary hypertension are prevalent in COPD patients, often contributing to worsened outcomes and increasing the burden of disease. Chest CT, with its ability to non-invasively detect a wide range of abnormalities, is an essential tool in the early identification and management of these comorbid conditions. For instance, the detection of coronary artery calcification and pulmonary artery enlargement via CT can provide early indications of cardiovascular disease, a common comorbidity that exacerbates the prognosis of COPD patients. Additionally, the visualization of bronchiectasis and emphysema on CT scans aids in more accurate phenotyping of COPD, allowing for personalized treatment strategies. Furthermore, CT’s role in diagnosing other significant comorbidities such as lung cancer and osteoporosis emphasizes the need for comprehensive assessment in COPD patients, as these conditions are often underdiagnosed without imaging techniques. In light of these findings, it is evident that routine chest CT screening in COPD patients not only aids in the management of respiratory symptoms but also enhances the detection of comorbidities that may otherwise be overlooked. This integrated approach to diagnosis is crucial for optimizing patient outcomes, reducing complications, and improving the overall management of COPD.
Author Contributions
AC—research coordinator, conceived the research idea, and supervised data interpretation. EI—performed data collection, analysis, and manuscript drafting. DC—developed the chest CT protocol, reviewed and interpreted CT images. AC, PS, NS critically reviewed and approved the final manuscript.
Funding
No external funding.
Institutional Review Board Statement
The study was conducted as part of a doctoral research project approved by the Research Ethics Committee of the Nicolae Testemițanu State University of Medicine and Pharmacy (Minutes No. 30 dated 31.03.2022).
Informed Consent Statement
All participants in the study provided informed consent.
Data Availability Statement
The original contributions presented in the study are included in the article. Further inquiries can be directed to the corresponding author.
Acknowledgments
The authors express their gratitude to the medical and technical staff involved in patient evaluation and CT imaging, whose contribution was essential for the completion of this study.
Conflicts of Interest
The authors declare that they have no competing interests in this work.
Abbreviations
The following abbreviations are used in this manuscript:
COPD—Chronic Obstructive Pulmonary Disease; CT—Computed Tomography; DXA—Dual-Energy X-ray Absorptiometry; FEV1—Forced Expiratory Volume in 1 Second; FVC—Forced Vital Capacity; GOLD—Global Initiative for Chronic Obstructive Lung Disease; HH—Hiatal Hernia; HRCT—High-Resolution Computed Tomography; HU—Hounsfield Units; IBM—International Business Machines; ILA—Interstitial Lung Abnormalities; ILD—Interstitial Lung Disease; kVp—Kilovolt Peak; mAs—Milliampere-seconds; mMRC—modified Medical Research Council (dyspnea scale); PA/Ao—Pulmonary Artery to Ascending Aorta Diameter Ratio; PAD—Pulmonary Artery Diameter; PAE—Pulmonary Artery Enlargement; PASP—Pulmonary Artery Systolic Pressure; PH—Pulmonary Hypertension; RHC—Right Heart Catheterization; SPSS—Statistical Package for the Social Sciences; VB—Virtual Bronchoscopy; WHO—World Health Organization.
References
- GOLD Report 2025. Global Strategy for Prevention, Diagnosis and management of chronic pulmonary disease. Published online 2025:4-5. https://goldcopd.org/2025-gold-report-2/.
- Cosío BG, Pascual-Guardia S, Borras-Santos A, et al. Phenotypic characterisation of early COPD: a prospective case–control study. ERJ Open Res. 2020;6(4):00047-02020. [CrossRef]
- Divo M, Cote C, De Torres JP, et al. Comorbidities and risk of mortality in patients with chronic obstructive pulmonary disease. Am J Respir Crit Care Med. 2012;186(2):155-161. [CrossRef]
- Corlăţeanu A, Odajiu I, Botnaru V, Cemirtan S. From smoking to COPD--current approaches. Pneumologia. 2016;65(1):20-23.
- Agusti AGN. COPD, a multicomponent disease: Implications for management. Respir Med. 2005;99(6):670-682. [CrossRef]
- Covanțev S, Eugenia S, Rusu D, et al. COPD and comorbidities in the Republic of Moldova. Artic Eurasian J Pulmonol. Published online 2022. [CrossRef]
- Agustí A. Systemic effects of chronic obstructive pulmonary disease: What we know and what we don’t know (but should). Proc Am Thorac Soc. 2007;4(7):522-525. [CrossRef]
- Mariniello DF, D’Agnano V, Cennamo D, et al. Comorbidities in COPD: Current and Future Treatment Challenges. J Clin Med. 2024;13(3). [CrossRef]
- Corlateanu A, Covantev S, Mathioudakis AG, Botnaru V, Siafakas N. Prevalence and burden of comorbidities in Chronic Obstructive Pulmonary Disease. Respir Investig. 2016;54(6):387-396. [CrossRef]
- Ecaterina, S., et al., Comorbidităţiile în bronhopneumopatia cronică obstructivă (revista literaturii). Becтник Aкaдeмии Hayк Moлдoвы. Meдицинa, 2021. 69(1): p. 165-169. [CrossRef]
- Ezponda A, Casanova C, Divo M, et al. Chest CT-assessed comorbidities and all-cause mortality risk in COPD patients in the BODE cohort. Respirology. 2022;27(4):286-293. [CrossRef]
- Hersh CP, Washko GR, Estépar RSJ, et al. Paired inspiratory-expiratory chest CT scans to assess for small airways disease in COPD. Respir Res. 2013;14(1):1-11. [CrossRef]
- Labaki WW, Martinez CH, Martinez FJ, et al. The role of chest computed tomography in the evaluation and management of the patient with chronic obstructive pulmonary disease. Am J Respir Crit Care Med. 2017;196(11):1372-1379. [CrossRef]
- Lenchik L. Value-Added Opportunistic CT: Insights Into Osteoporosis and Sarcopenia. 2020;(September):582-594. [CrossRef]
- Beigelman-aubry C, Godet C, Caumes E. Lung infections : The radiologist ’ s perspective. Diagn Interv Imaging. 2012;93(6):431-440. [CrossRef]
- Society F, Austin JHM, Hogg JC, et al. Chronic Obstructive Pulmonary Disease : A Statement of the. 2015;277(1).
- Sarkar M, Bhardwaj R, Madabhavi I, Khatana J. Osteoporosis in chronic obstructive pulmonary disease. Clin Med Insights Circ Respir Pulm Med. 2015;2015(9):5-21. [CrossRef]
- Graat-verboom L, Spruit MA, Borne BEEM Van Den, et al. Correlates of osteoporosis in chronic obstructive pulmonary disease : An underestimated systemic component. Published online 2009. [CrossRef]
- Hattiholi J, Gaude GS. Prevalence and correlates of osteoporosis in chronic obstructive pulmonary disease patients in India. 2014;31(3):221-227. [CrossRef]
- Lunde R, Spruit MA. Current status of research on osteoporosis in COPD: a systematic review. 2009;34(1):209-218. [CrossRef]
- Kjensli A, Falch JA, Ryg M, et al. High prevalence of vertebral deformities in. 2009;33(5):1018-1024. [CrossRef]
- Watanabe R, Tanaka T, Akiyama Y et al. Osteoporosis is highly prevalent in Japanese men with chronic obstructive pulmonary disease and is associated with deteriorated pulmonary function. Watanabe R, Tanaka T, Akiyama Y, al Osteoporos is highly prevalent Japanese men with chronic Obstr Pulm Dis is Assoc with Deterior Pulm Funct J Bone Min Metab 2015;33(4)392–397. [CrossRef]
- Romme EAPM, Geusens P, Lems WF, et al. Fracture prevention in COPD patients; a clinical 5-step approach. Respir Res. 2015;16(1):1-8. [CrossRef]
- Hwang HJ, Lee SM, Seo JB, et al. Quantitative vertebral bone density seen on chest CT in chronic obstructive pulmonary disease patients: Association with mortality in the korean obstructive lung disease cohort. Korean J Radiol. 2020;21(7):880-890. [CrossRef]
- Williams MC, Murchison JT, Edwards LD, et al. Coronary artery calcification is increased in patients with COPD and associated with increased morbidity and mortality. Thorax. 2014;69(8):718-723. [CrossRef]
- Aaron CP, Hoffmann U, Yang Q et al. COPD is associated with increased risk of coronary artery disease and coronary artery calcium. The MESA-Lung Study Chest. Published online 2017. [CrossRef]
- Kahnert K, Jörres RA, Jobst B, et al. Association of coronary artery calcification with clinical and physiological characteristics in patients with COPD: Results from COSYCONET. Respir Med. 2022;204. [CrossRef]
- Raggi P, Gongora MC, Gopal A, Callister TQ, Budoff M, Shaw LJ. Coronary Artery Calcium to Predict All-Cause Mortality in Elderly Men and Women. 2008;52(1). [CrossRef]
- Chiles C, Duan F, Gladish GW, Ravenel JG. Association of Coronary Artery Calcification and Mortality in the National Lung Screening Trial. 2016;276(1):82-90. [CrossRef]
- Wells JM, Washko GR, Han MK, et al. Pulmonary Arterial Enlargement and Acute Exacerbations of COPD. N Engl J Med. 2012;367(10):913-921. [CrossRef]
- Iyer AS, Wells JM, Vishin S, Bhatt SP, Wille KM, Dransfield MT. CT scan-measured pulmonary artery to aorta ratio and echocardiography for detecting pulmonary hypertension in severe COPD. Chest. 2014;145(4):824-832. [CrossRef]
- Matsuoka, Shin; Washko, George R.; Dransfield, Mark T.; Yamashiro, Tsuneo; San Jose Estepar, Raul; Diaz, Alejandro; Silverman, Edwin K.; Patz, Samuel; Hatabu, Hiroto. (2010). Quantitative CT Measurement of Cross-sectional Area of Small Pulmonary Vessel in COPD. , 17(1), 93 99. [CrossRef]
- Chen H. Pulmonary artery enlargement predicts poor survival in patients with COPD : A meta—analysis. Published online 2022:1-14. [CrossRef]
- Chung KS, Kim YS, Kim SK, et al. Functional and Prognostic Implications of the Main Pulmonary Artery Diameter to Aorta Diameter Ratio from Chest Computed Tomography in Korean COPD Patients. Published online 2016:1-13. [CrossRef]
- Sijapati MJ, Thapa NB, Rijal R, KC SR, Karki P. Bronchiectasis in patients with chronic obstructive pulmonary disease. J Pathol Nepal. 2018;8(2):1346-1349. [CrossRef]
- Martínez-García MA, Soler-Cataluña JJ, Donat Sanz Y et al. Factors associated with bronchiectasis in patients with COPD. Chest. 2011;140(5):113. [CrossRef]
- Martinez-Garcia MA, Miravitlles M. Bronchiectasis in COPD patients: More than a comorbidity? Int J COPD. 2017;12:1401-1411. [CrossRef]
- Lee AL, Goldstein RS. Gastroesophageal reflux disease in COPD: Links and risks. Int J COPD. 2015;10(1):1935-1949. [CrossRef]
- Ozol D, Akinci O GH. Gastroesophageal reflux disease in patients with stable COPD. Respir Med. 2004;98(1):((1):):61–66.
- Pickhardt PJ, Boyce CJ, Kim DH, et al. Should Small Sliding Hiatal Hernias. 2011;(April):400-404. [CrossRef]
- Kim C, Ouyang W, Dass C, Zhao H, Criner GJ. Hiatal Hernia on Chest High-Resolution Computed Tomography and Exacerbation Rates in COPD Individuals. Chronic Obstr Pulm Dis J COPD Found. 2016;3(2):570-579. [CrossRef]
- Young RP, Hopkins RJ, Christmas T et al. COPD prevalence is increased in lung cancer, independent of age, sex and smoking history. Eur Respir J. 2009;34:((2):):380–386.
- De Torres JP, Marín JM, Casanova C, et al. Lung cancer in patients with chronic obstructive pulmonary disease: Incidence and predicting factors. Am J Respir Crit Care Med. 2011;184(8):913-919. [CrossRef]
- Ferguson, J. S.. (2005). Virtual Bronchoscopy. Proceedings of the American Thoracic Society, 2(6), 488–491. [CrossRef]
- Chubachi S, Takahashi S, Tsutsumi A, et al. Radiologic features of precancerous areas of the lungs in chronic obstructive pulmonary disease. Int J COPD. 2017;12:1613-1624. [CrossRef]
- Sethi S, Murphy TF. Infection in the Pathogenesis and Course of Chronic Obstructive Pulmonary Disease. N Engl J Med. 2008;359(22):2355-2365. [CrossRef]
- Seemungal T, Harper-Owen R, Bhowmik A, et al. Respiratory viruses, symptoms, and inflammatory markers in acute exacerbations and stable chronic obstructive pulmonary disease. Am J Respir Crit Care Med. 2001;164(9):1618-1623. [CrossRef]
- Hurst JR, Vestbo J, Anzueto A, et al. Susceptibility to Exacerbation in Chronic Obstructive Pulmonary Disease. N Engl J Med. 2010;363(12):1128-1138. [CrossRef]
- Sethi S. Infection as a comorbidity of COPD. Eur Respir J. 2010;35(6):1209-1215. [CrossRef]
- Putman RK, Hatabu H, Araki T et al. Association between interstitial lung abnormalities and all-cause mortality. JAMA. 315((7):):672–681. [CrossRef]
Figure 1.
Pathophysiological continuum and clinical consequences of COPD progression, ECOPD exacerbation of COPD; HRQL health-related quality of life.
Figure 1.
Pathophysiological continuum and clinical consequences of COPD progression, ECOPD exacerbation of COPD; HRQL health-related quality of life.
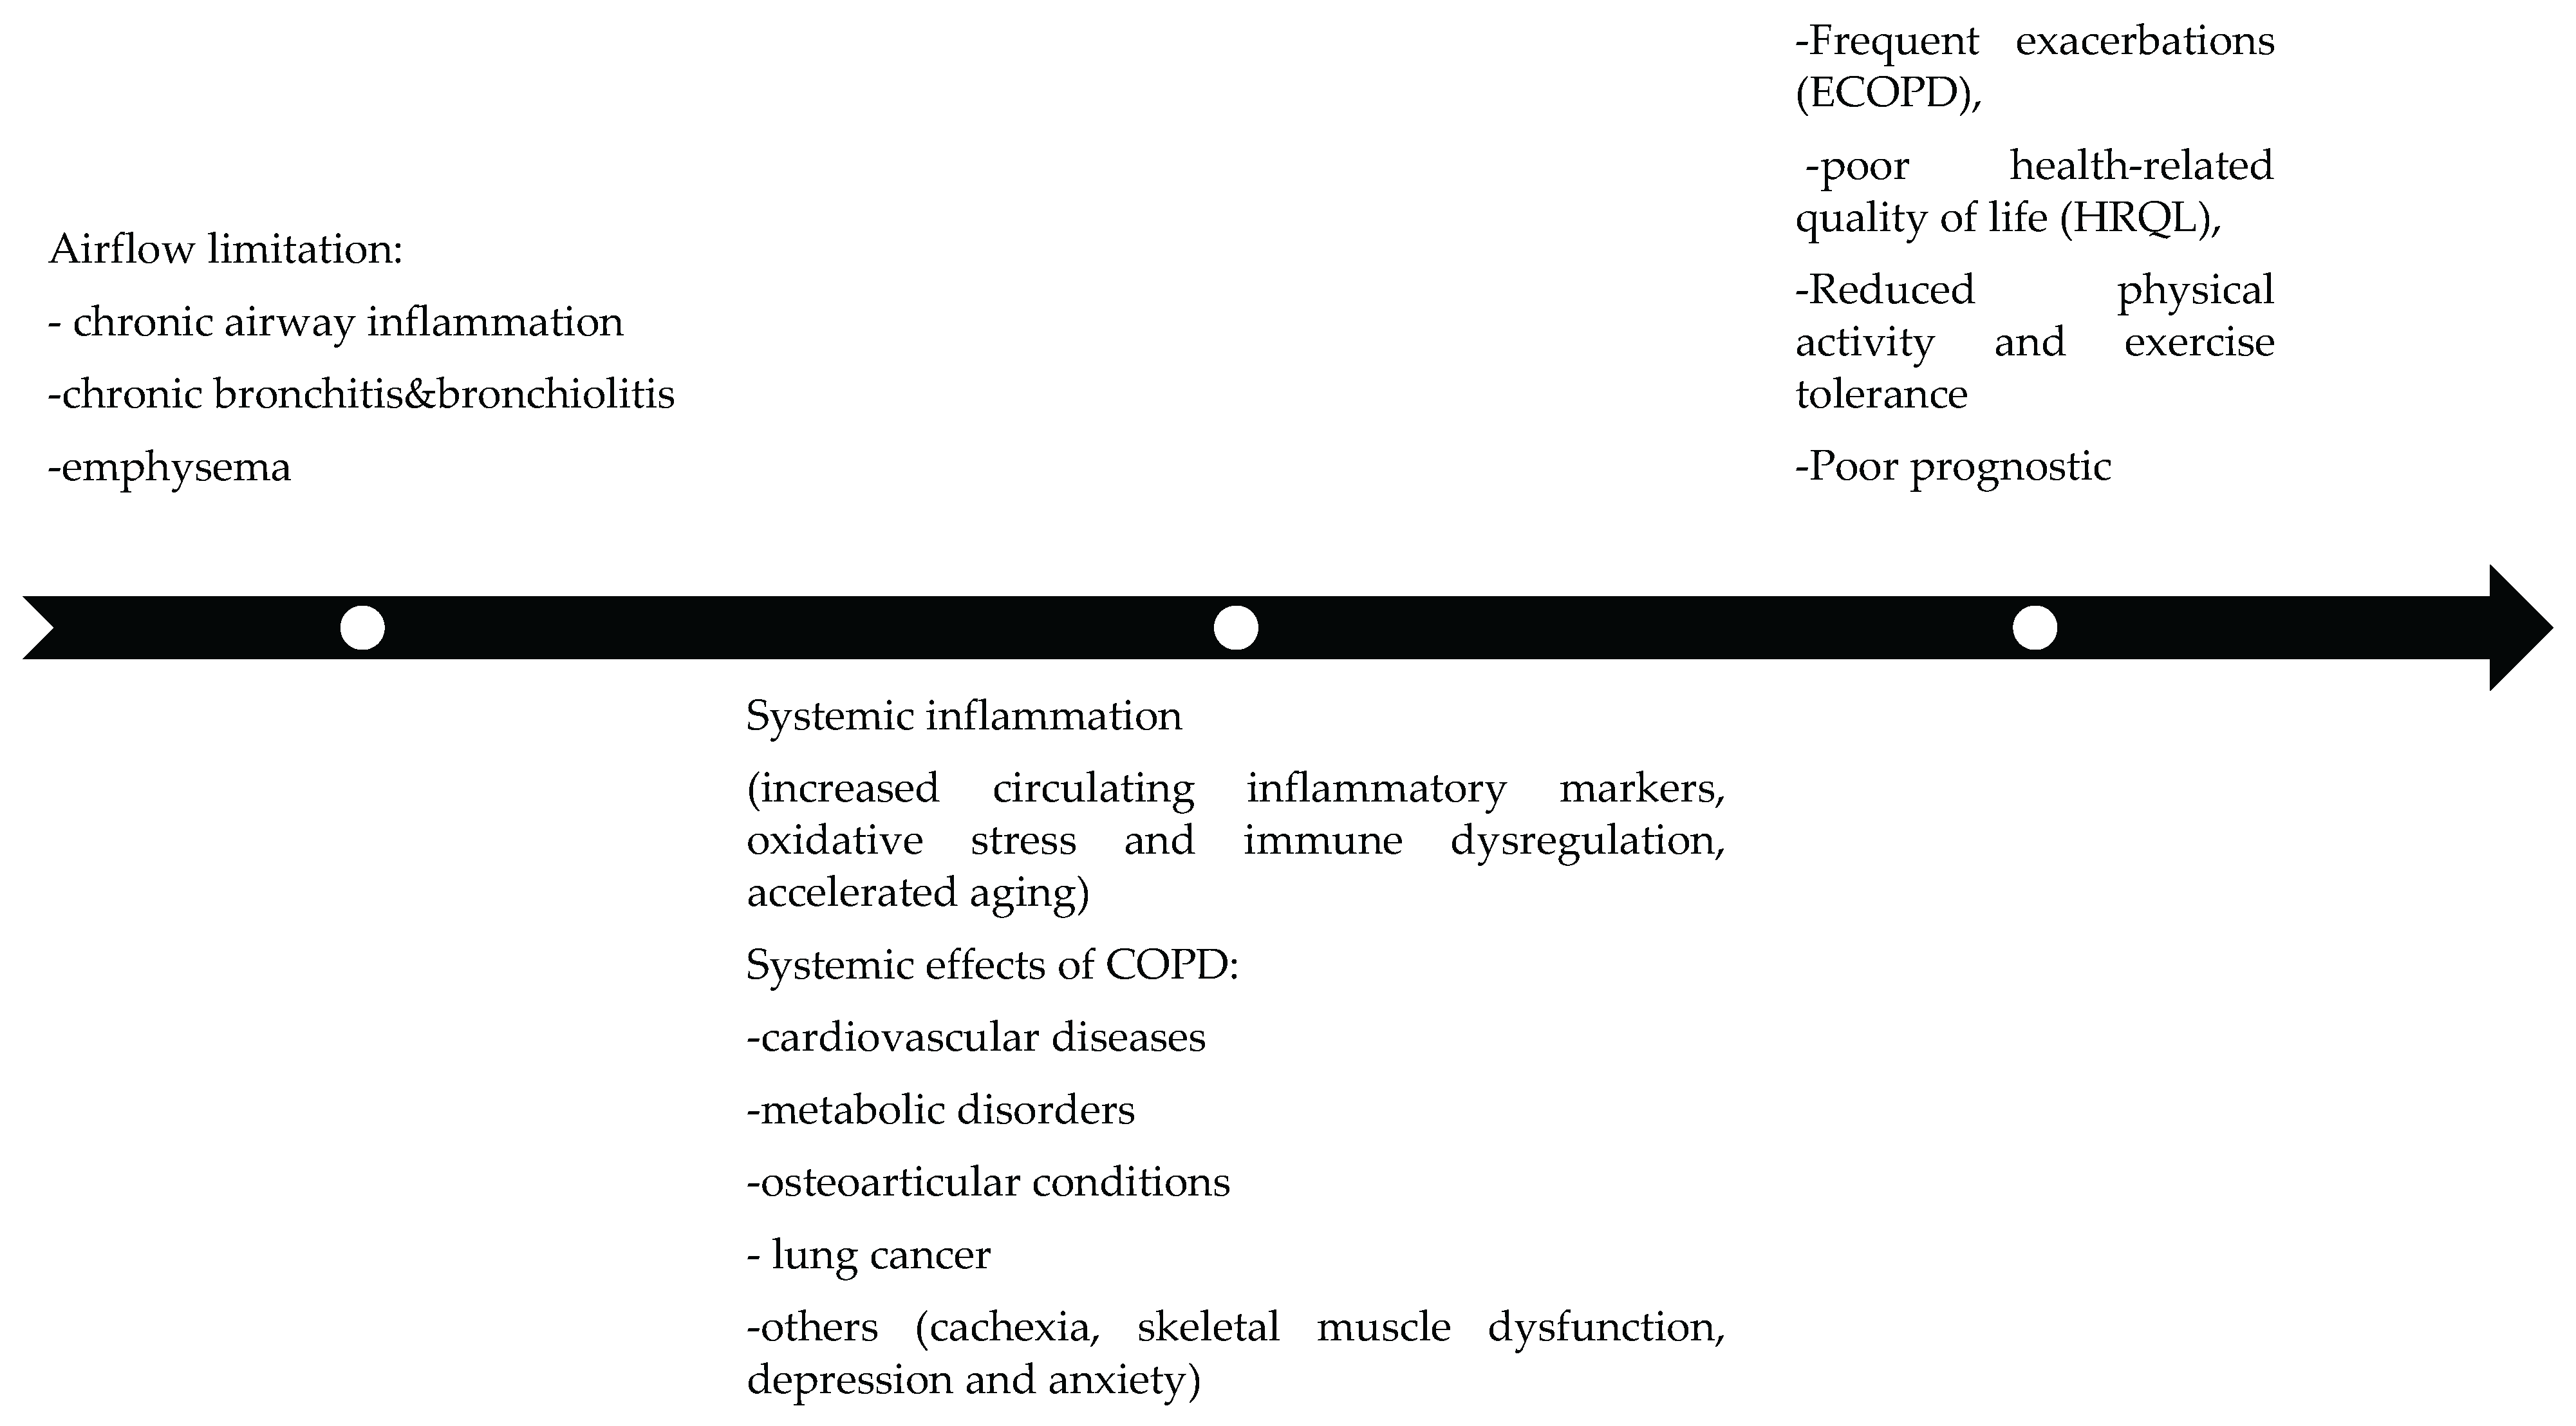
Figure 2.
Quantitative and volumetric HRCT assessment of emphysema. (A-C) Axial CT scans demonstrating paraseptal and centrilobular emphysema. (D-F) Three-dimensional segmentation and lobar volumetry for emphysema quantification. Computed tomography (CT) provides detailed evaluation of emphysema distribution and burden in patient with COPD. (G-H) Voxels with attenuation values below a predefined threshold (typically set at -950 HU) are classified as emphysematous. This threshold facilitates the segmentation of lung tissue into emphysematous and non-emphysematous regions, thereby enabling a quantitative assessment of the proportion of lung volume affected by emphysema.
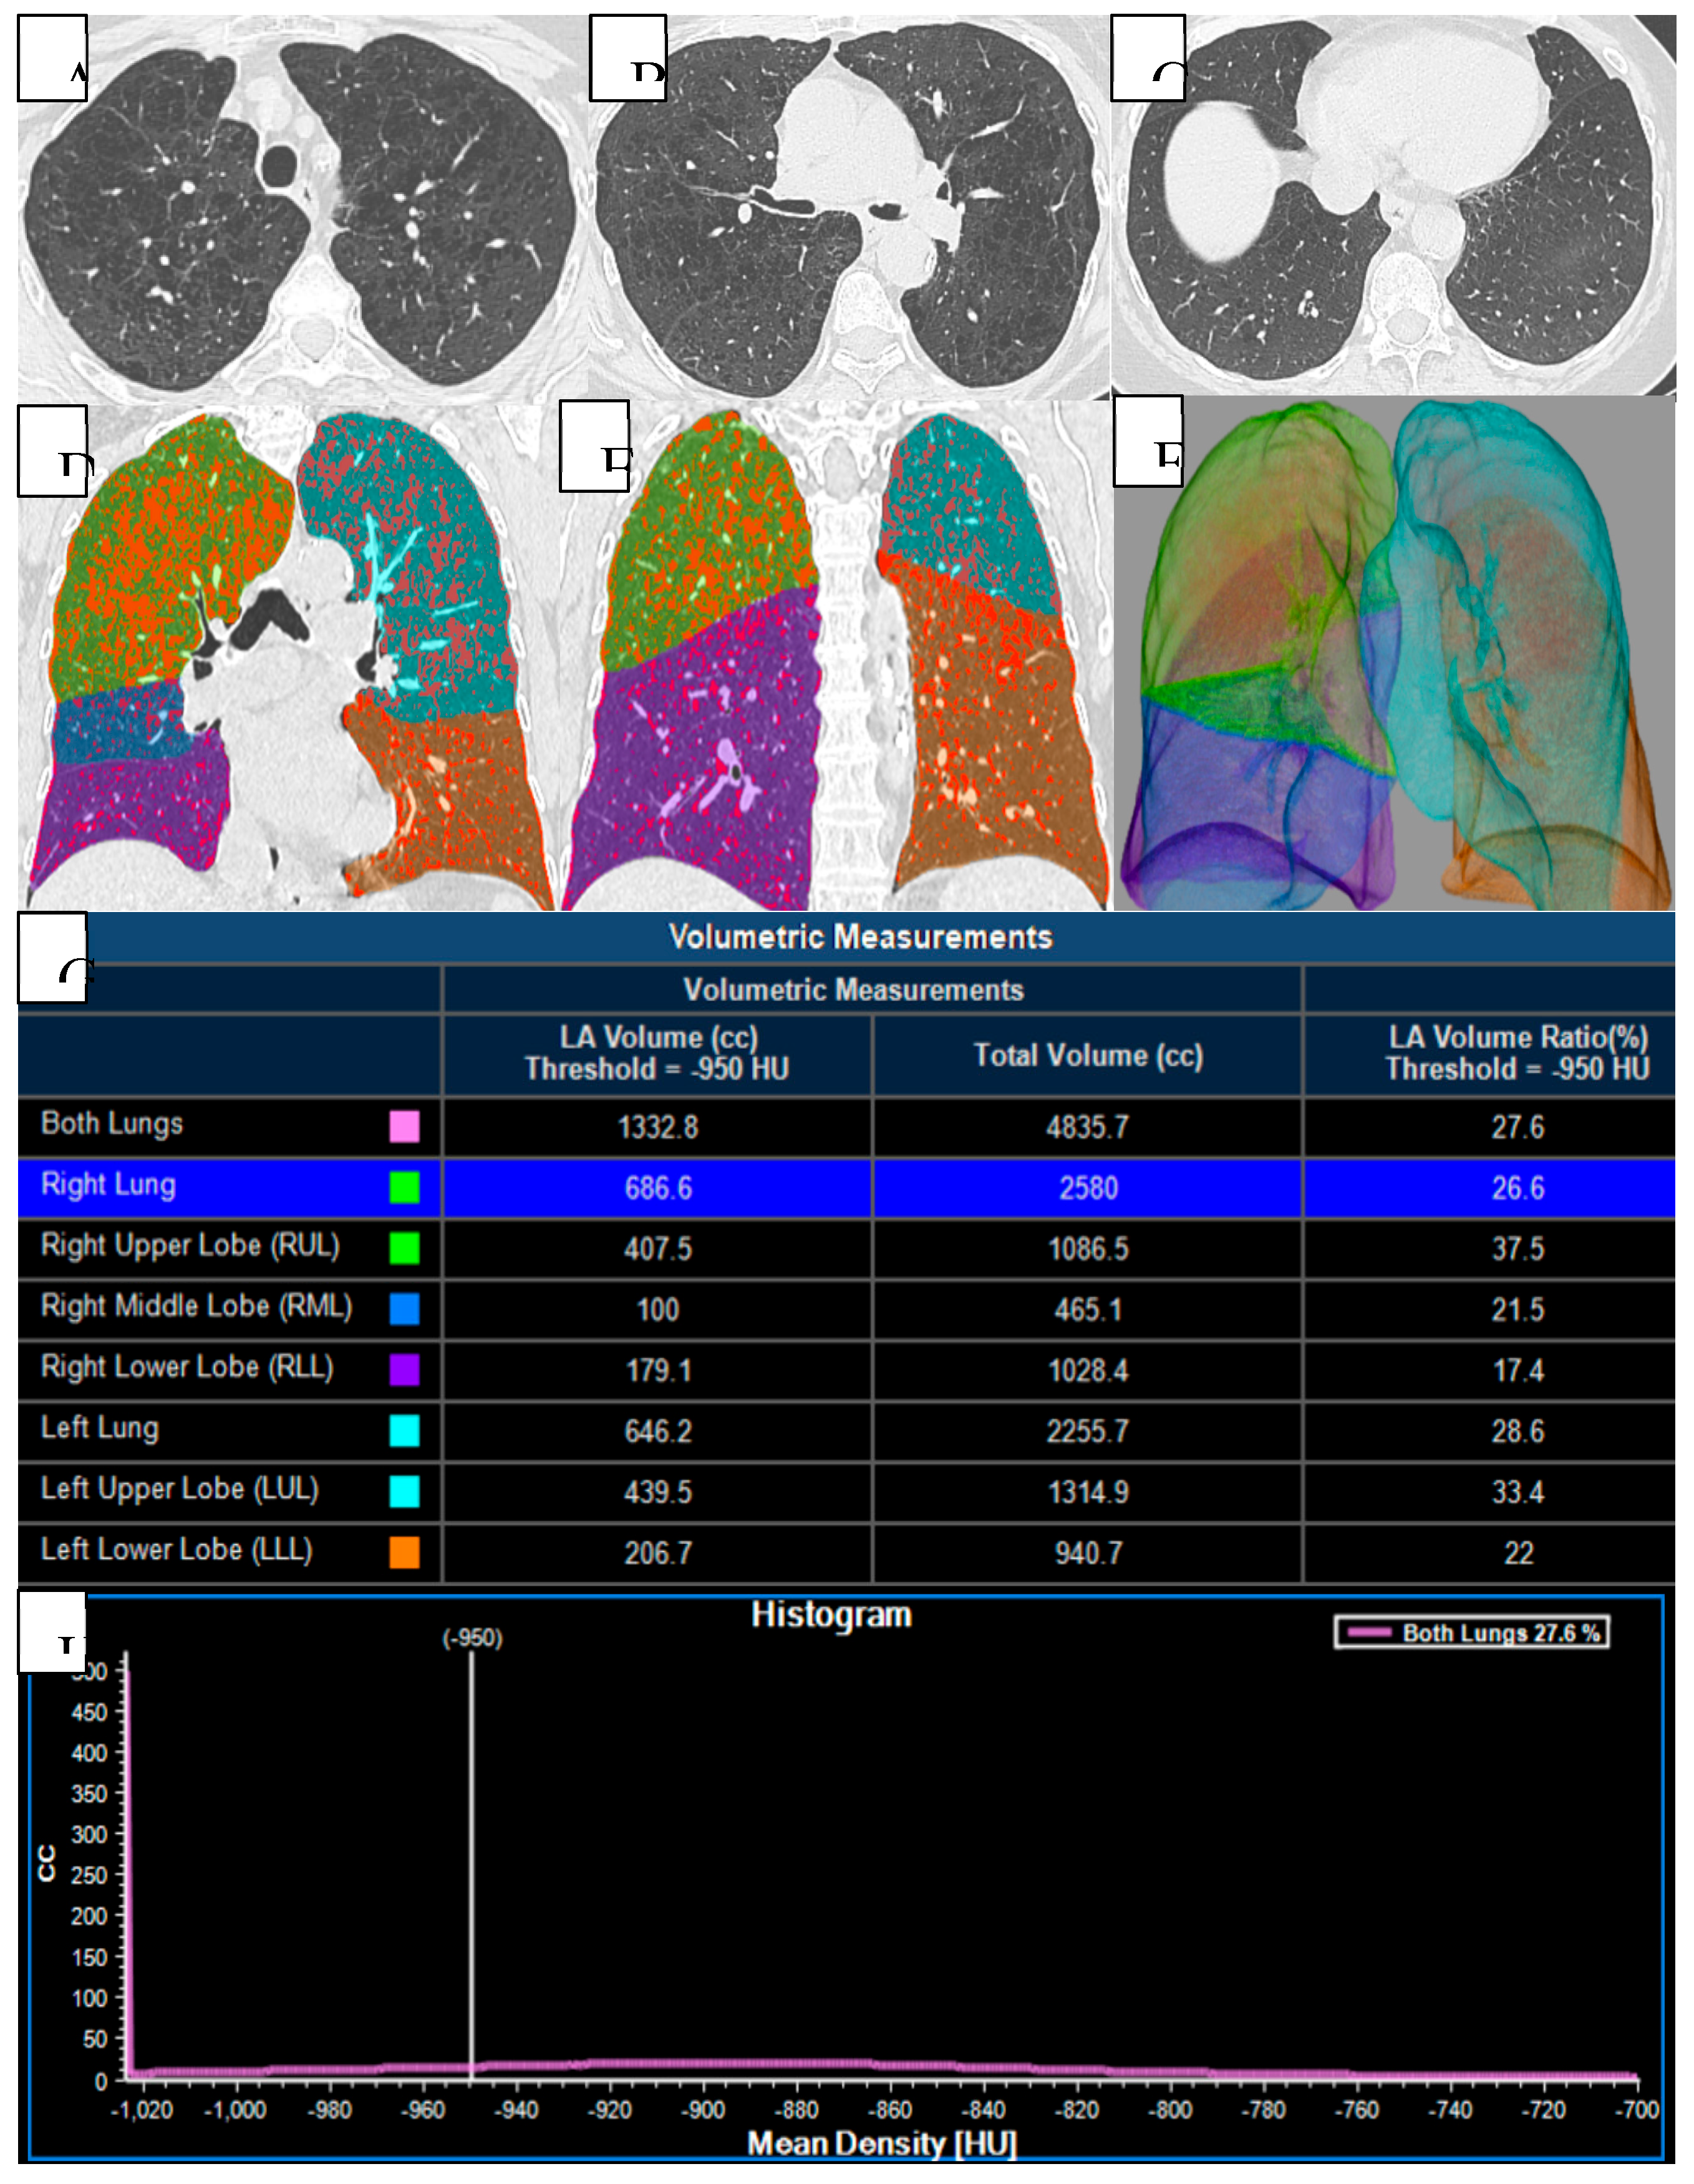
Figure 3.
According to the GOLD classification, ABE type.
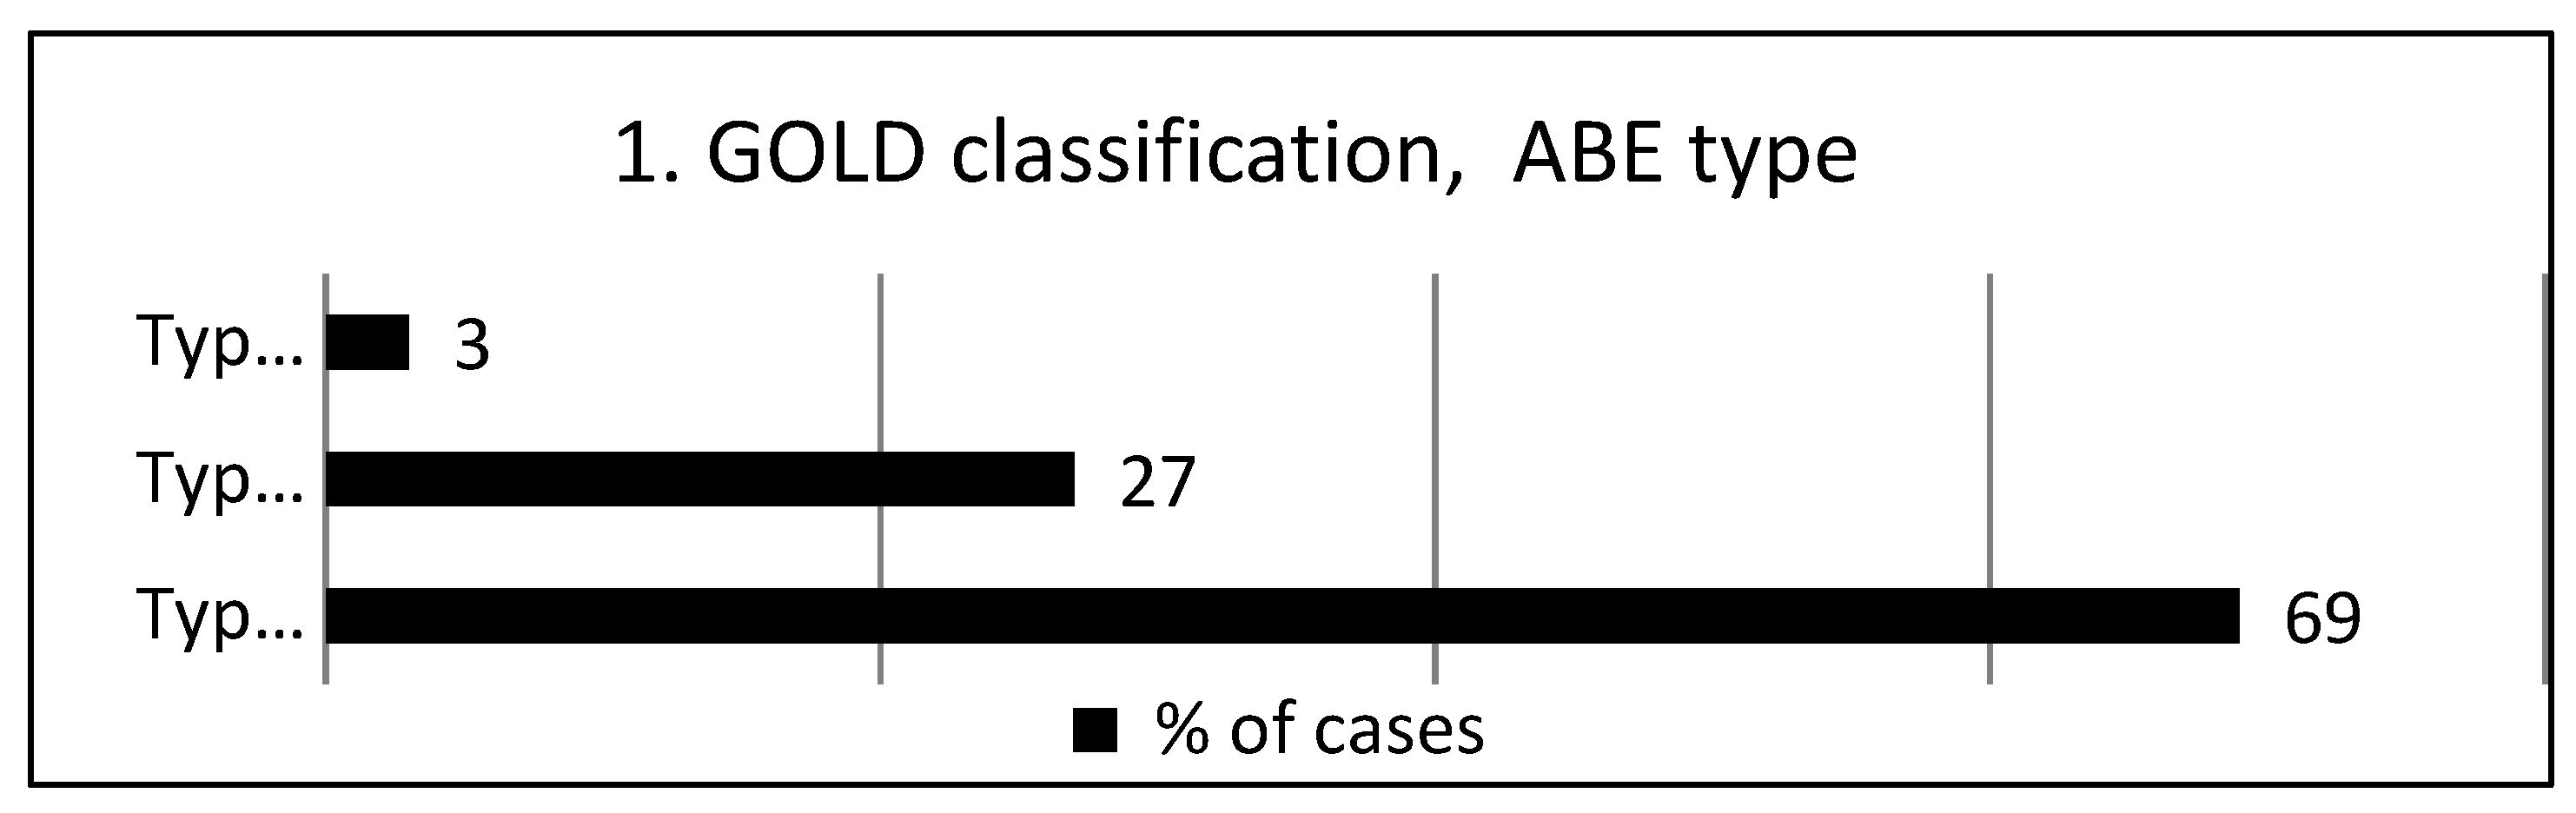
Figure 4.
Frequency of comorbidities.
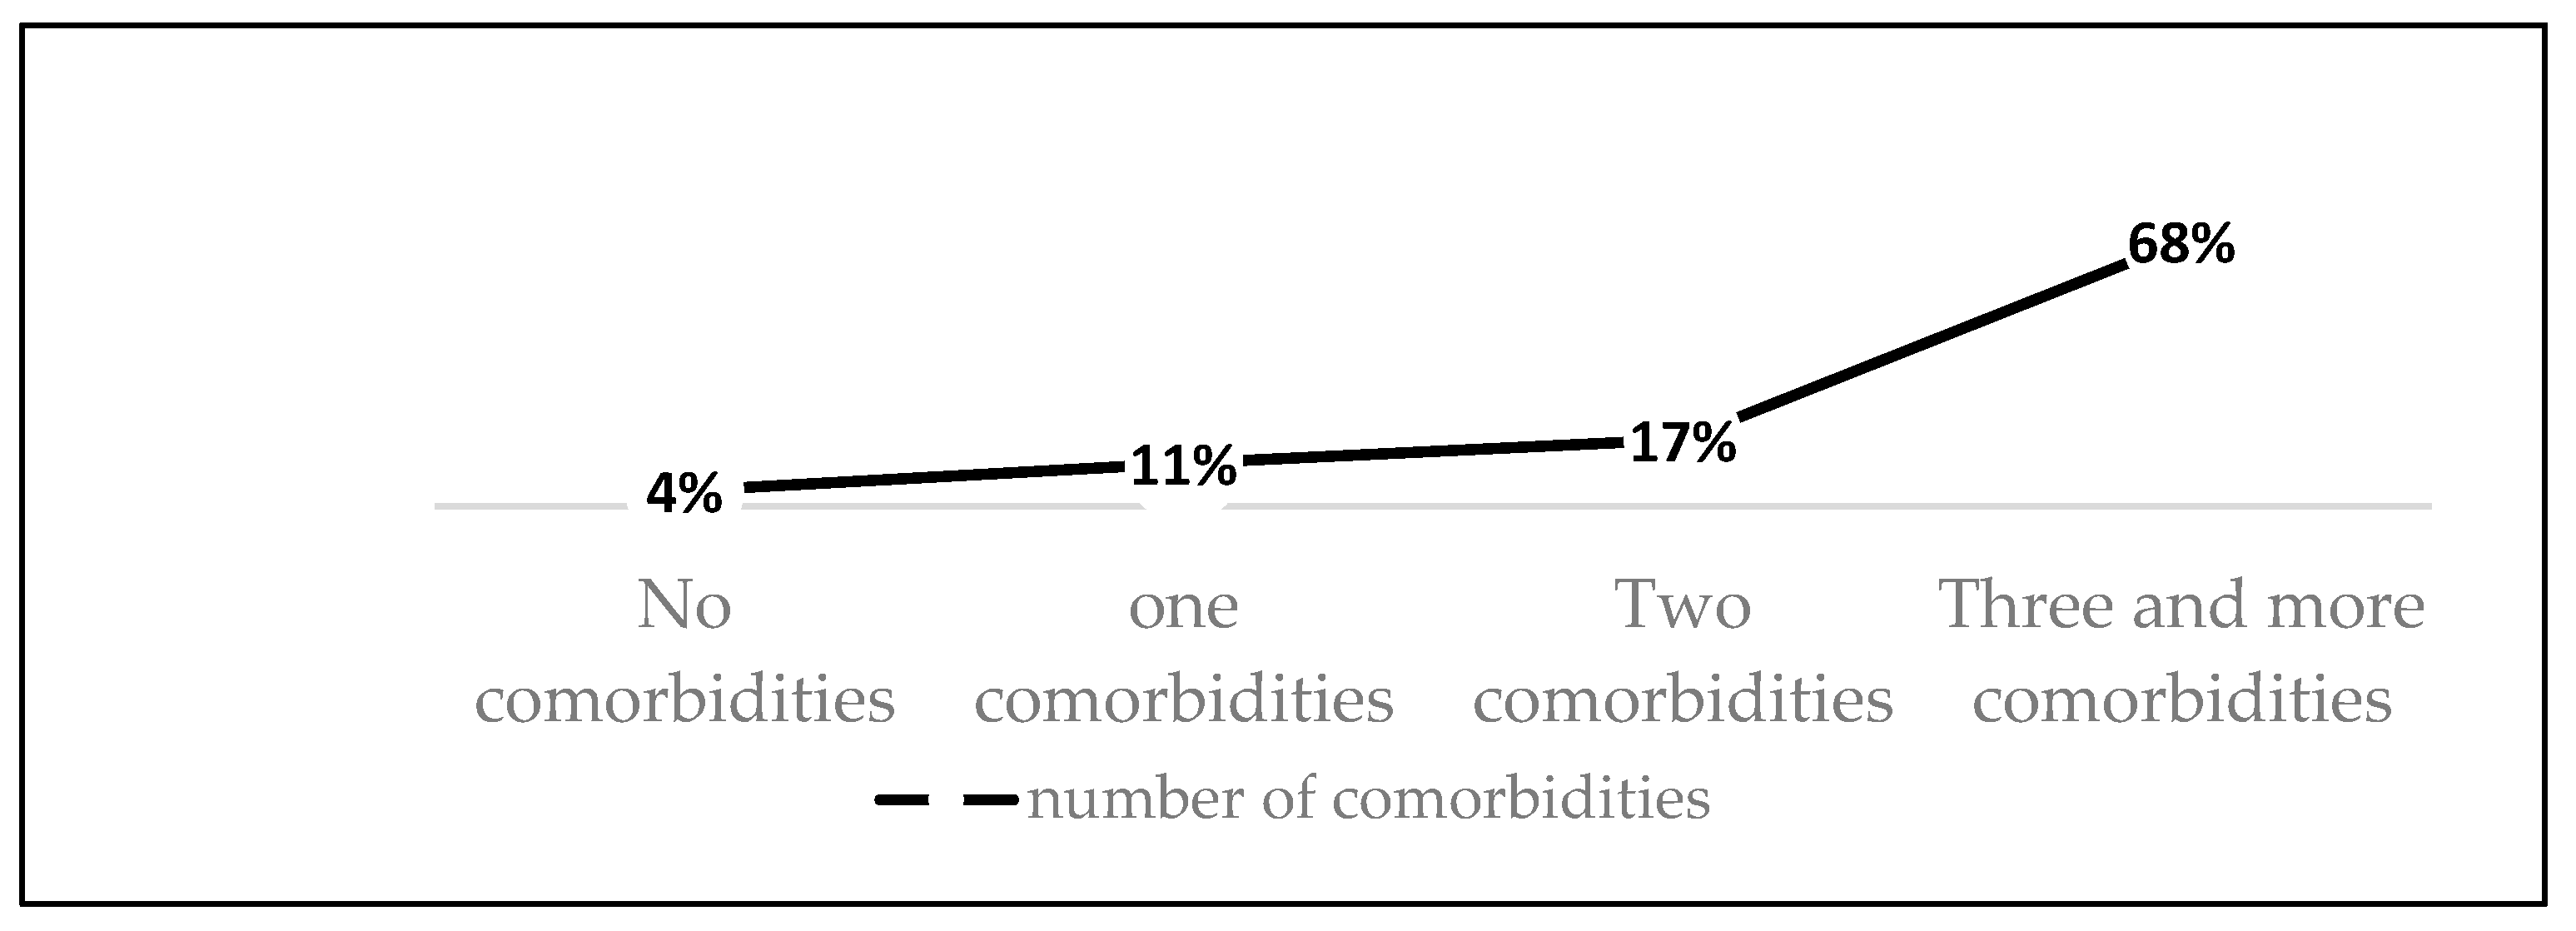
Figure 5.
(A) Mixed bilateral pulmonary emphysema (paraseptal and centrilobular emphysematous bullae). (B) Peripheral nodular formation in the lower lobe of the right lung. Mixed bilateral pulmonary emphysema. (C) Central tumoral mass of the right lung with invasion of the main bronchi bilaterally and lobar branches B4, B5 on the right. (D,E) Virtual bronchoscopy, presence of extrinsic stenosis of the main bronchi bilaterally.
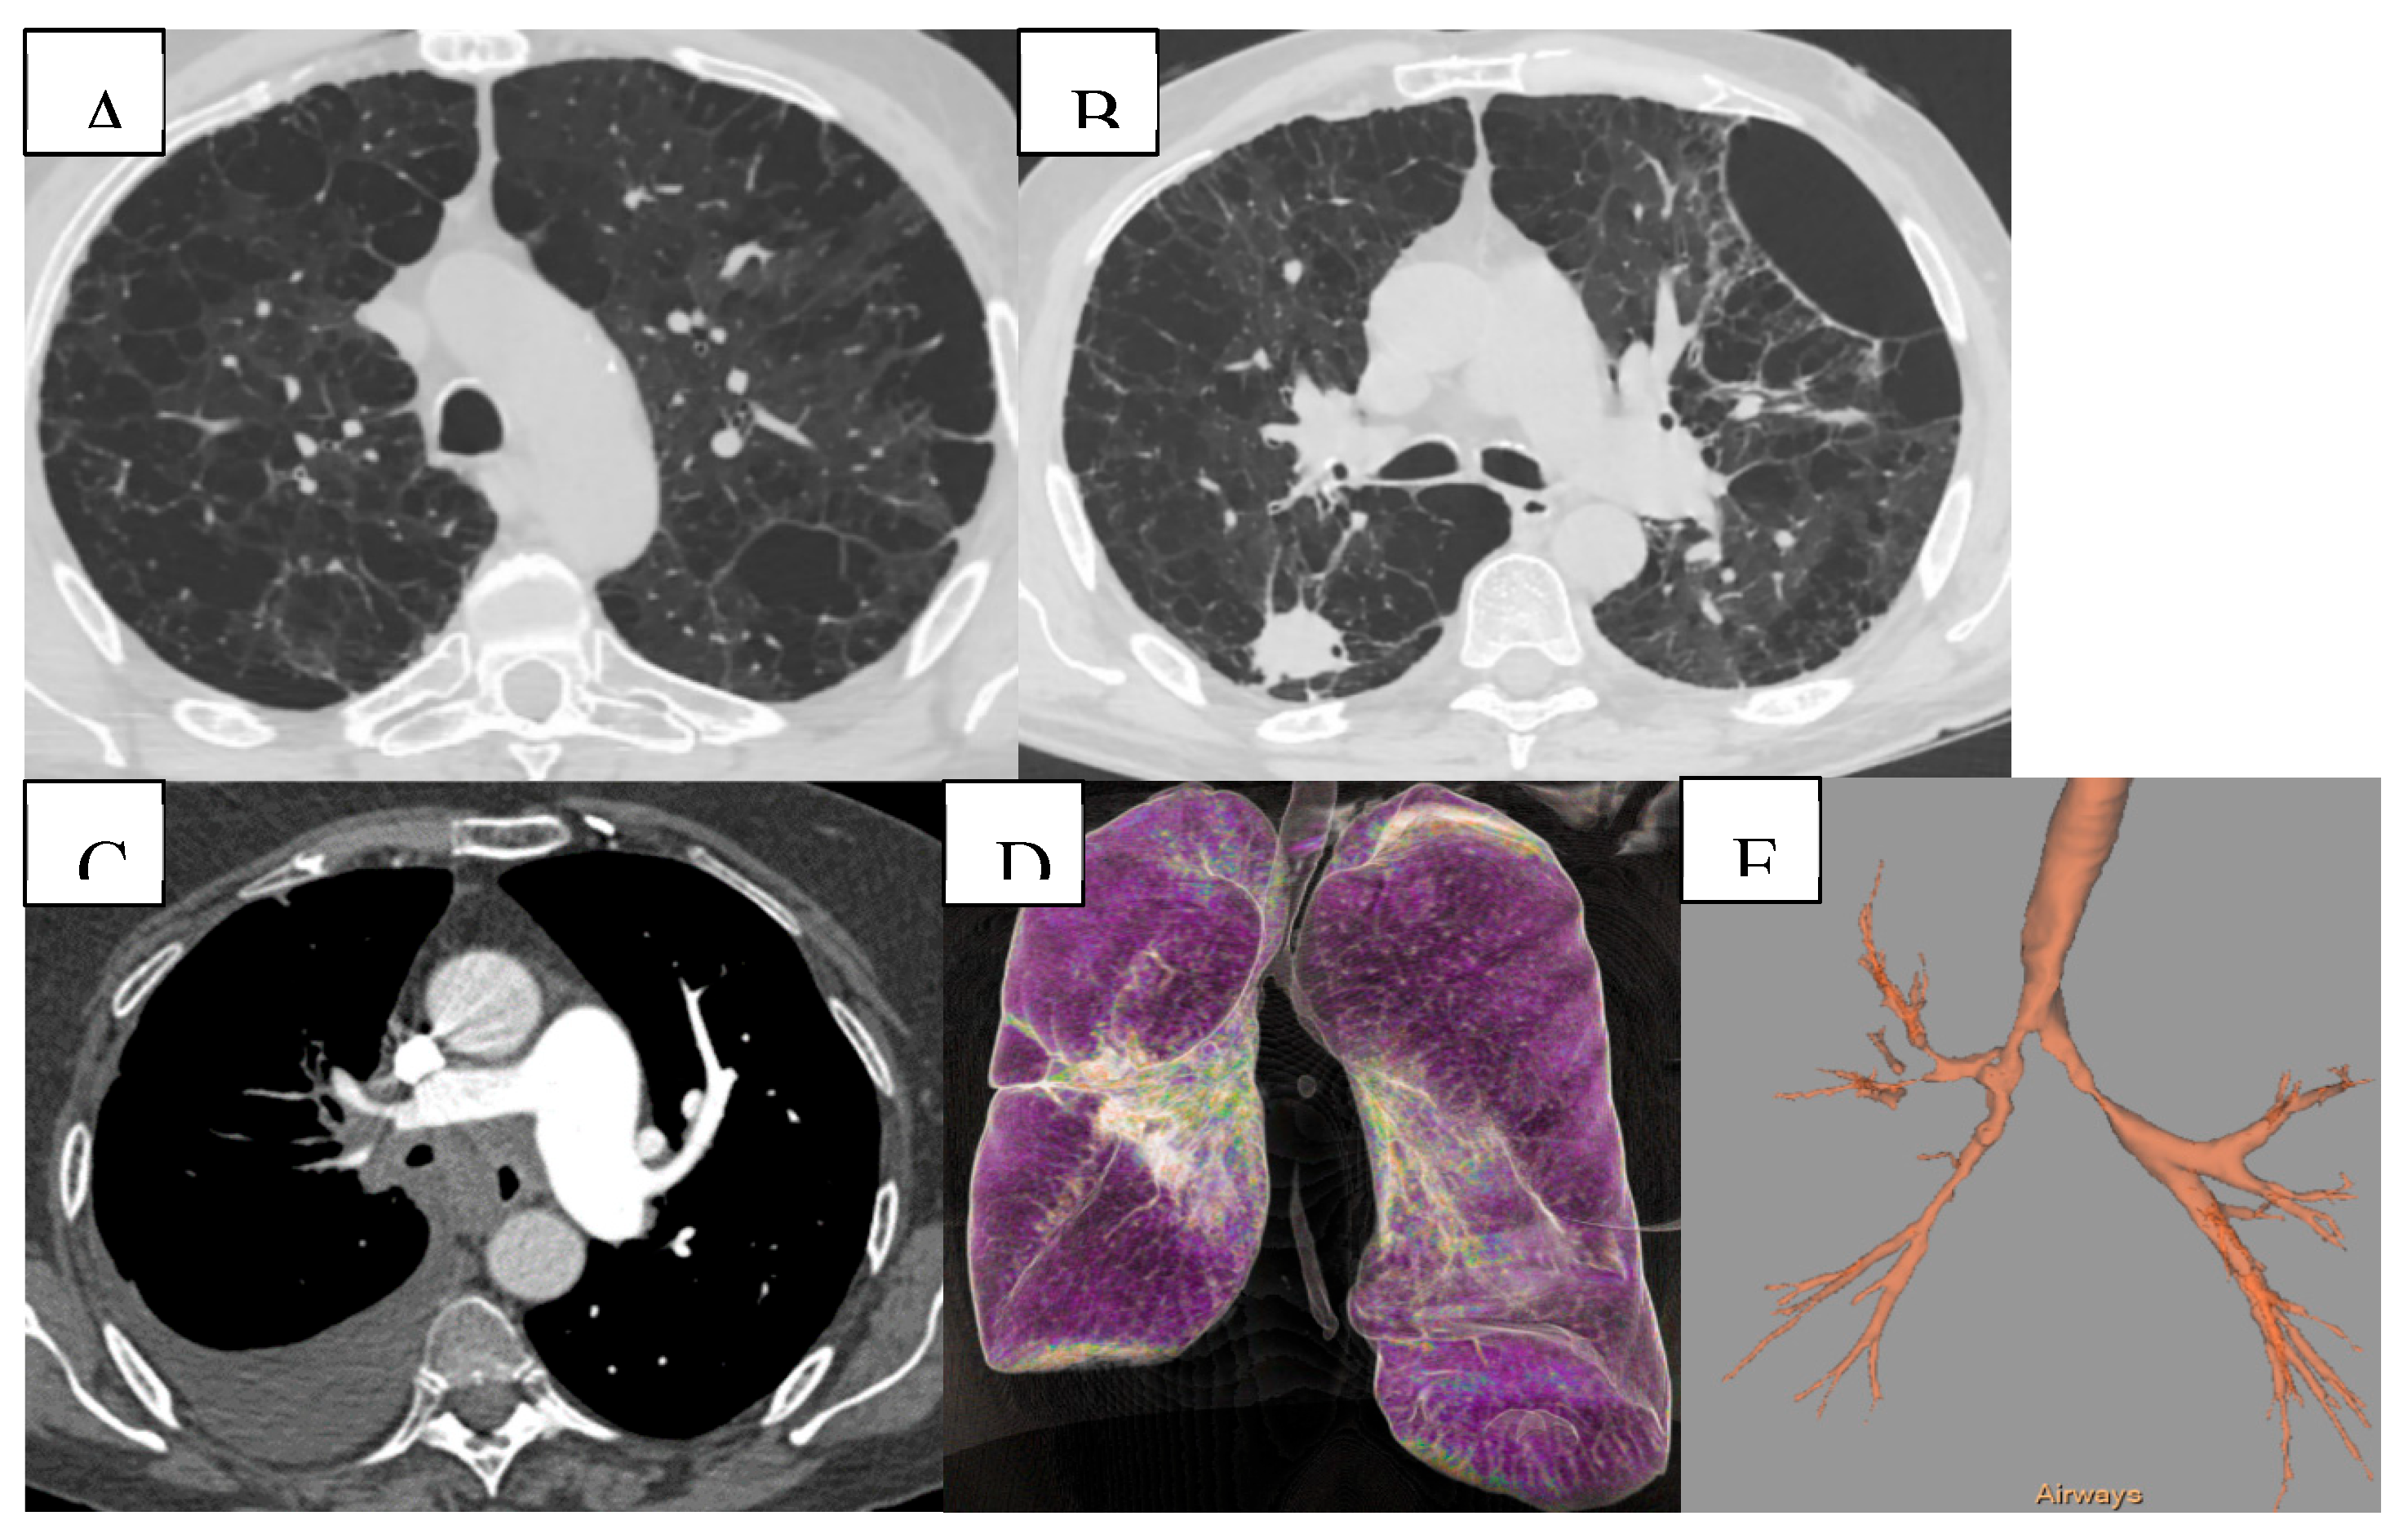
Figure 6.
(A) Bronchiectasis (multiple types of bronchiectasis in the lower lobe of the right lung, some with mucoid impaction). (B) CT signs of pulmonary hypertension (diameter of the pulmonary trunck 3.8 cm (normal < 2.9cm). (C) Osteoporosis, bone density measurement at the level of L3 (86.96 HU). (D) ILD (Interstitial Lung Disease), subpleural honeycombing formed by clustered cysts stacke together in several layers. Reticular pattern. Left pleural effusion.
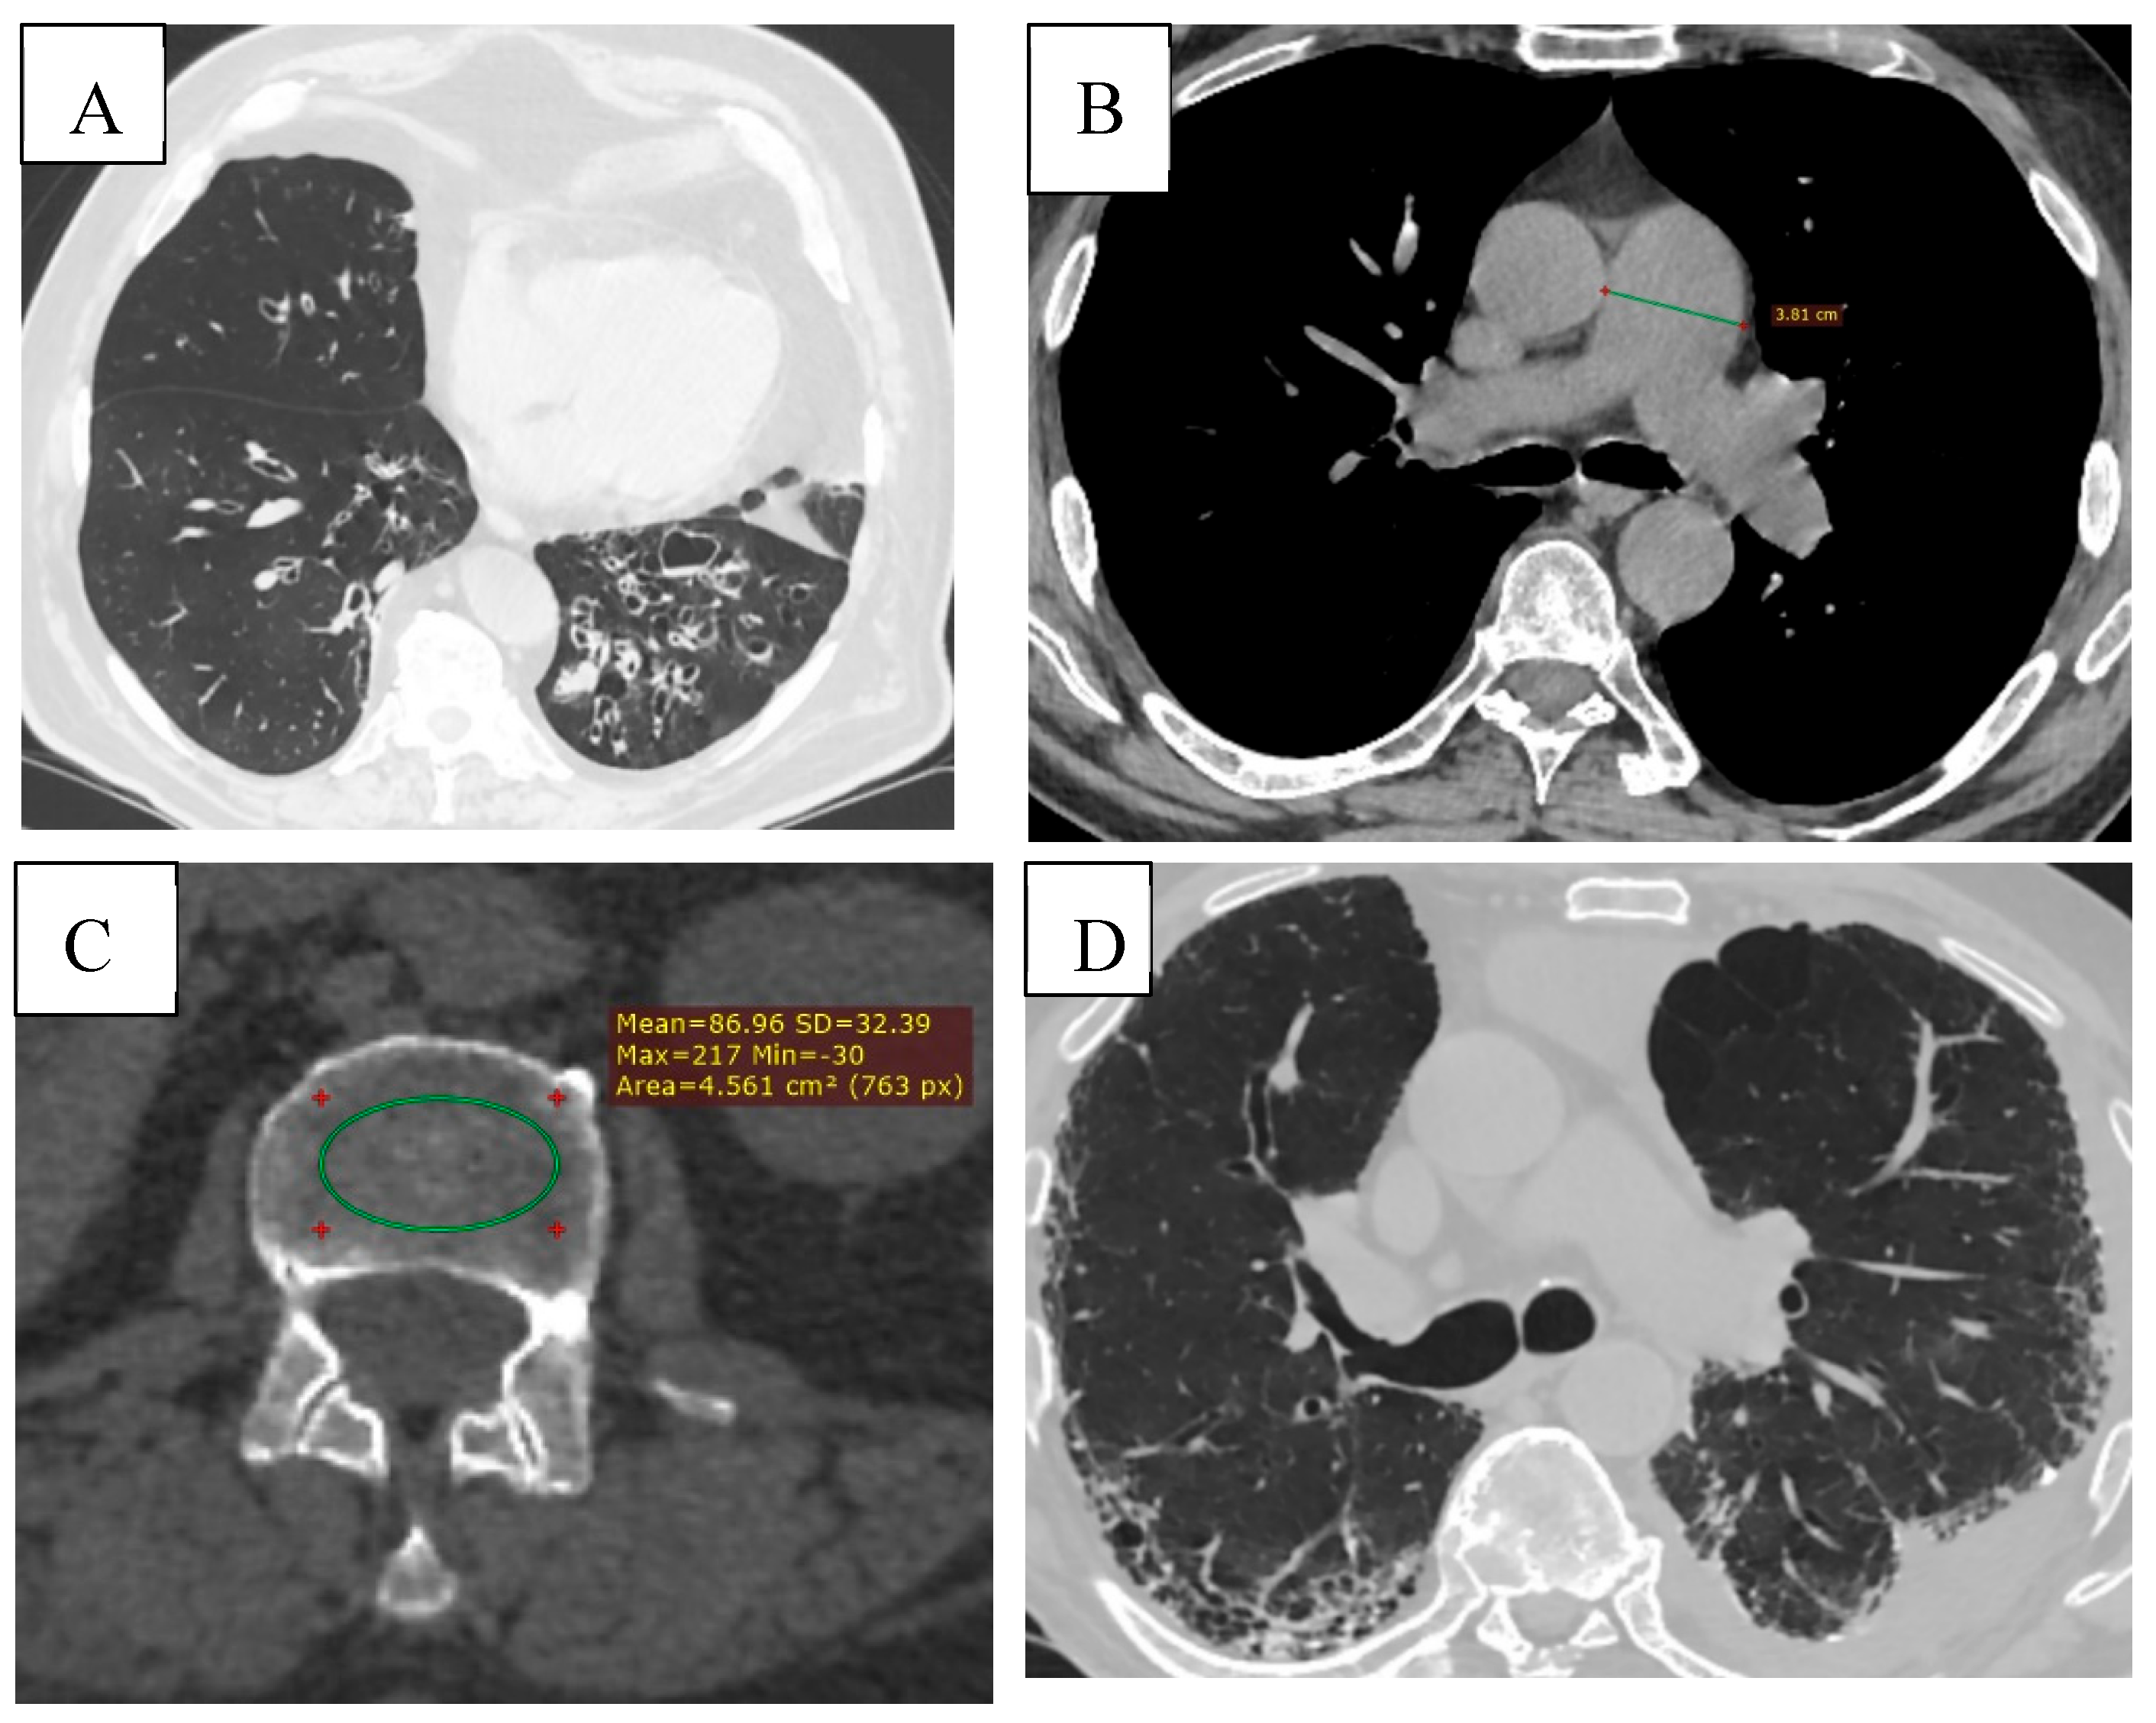
Figure 7.
(A) Pneumonia- Pulmonary consolidation in the lower lobe of the right lung, with the presence of air bronchogram. (B) Pulmonary infarction represented by the peripheral wedge-shaped pulmonary consolidation in the right lung with its base towards the pleura.
Figure 7.
(A) Pneumonia- Pulmonary consolidation in the lower lobe of the right lung, with the presence of air bronchogram. (B) Pulmonary infarction represented by the peripheral wedge-shaped pulmonary consolidation in the right lung with its base towards the pleura.
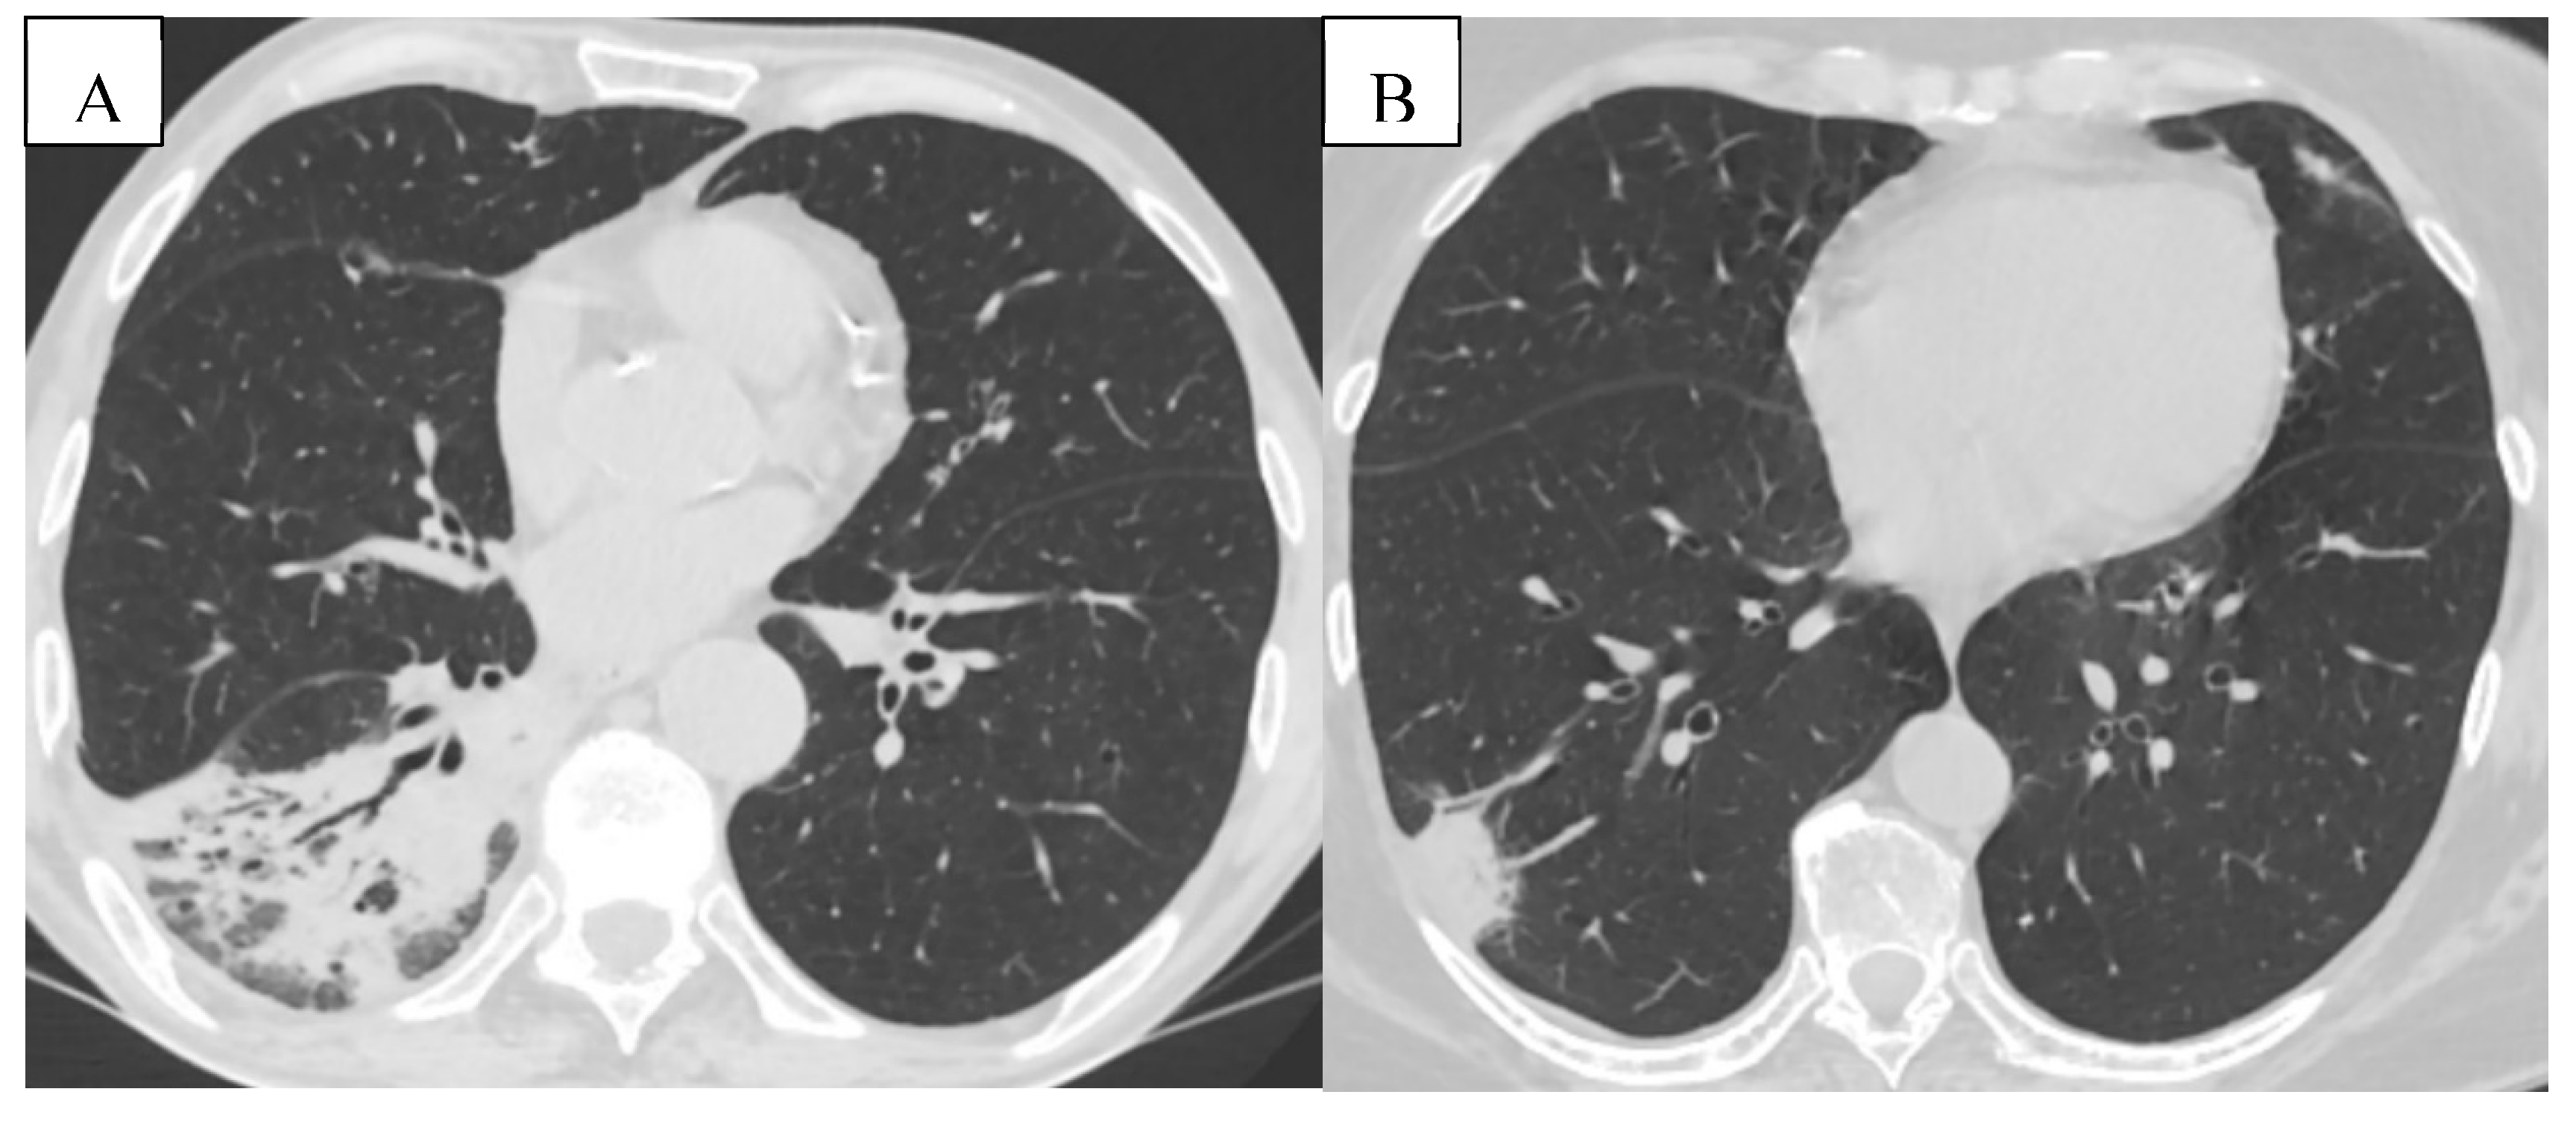
Figure 8.
(A) The axial CT scan shows a hiatal hernia (type 1), with a part of the stomach protruding through the esophageal hiatus into the thoracic cavity. (B) Hepatic steatosis. Diffusely decreased liver attenuation (37.98HU).
Figure 8.
(A) The axial CT scan shows a hiatal hernia (type 1), with a part of the stomach protruding through the esophageal hiatus into the thoracic cavity. (B) Hepatic steatosis. Diffusely decreased liver attenuation (37.98HU).
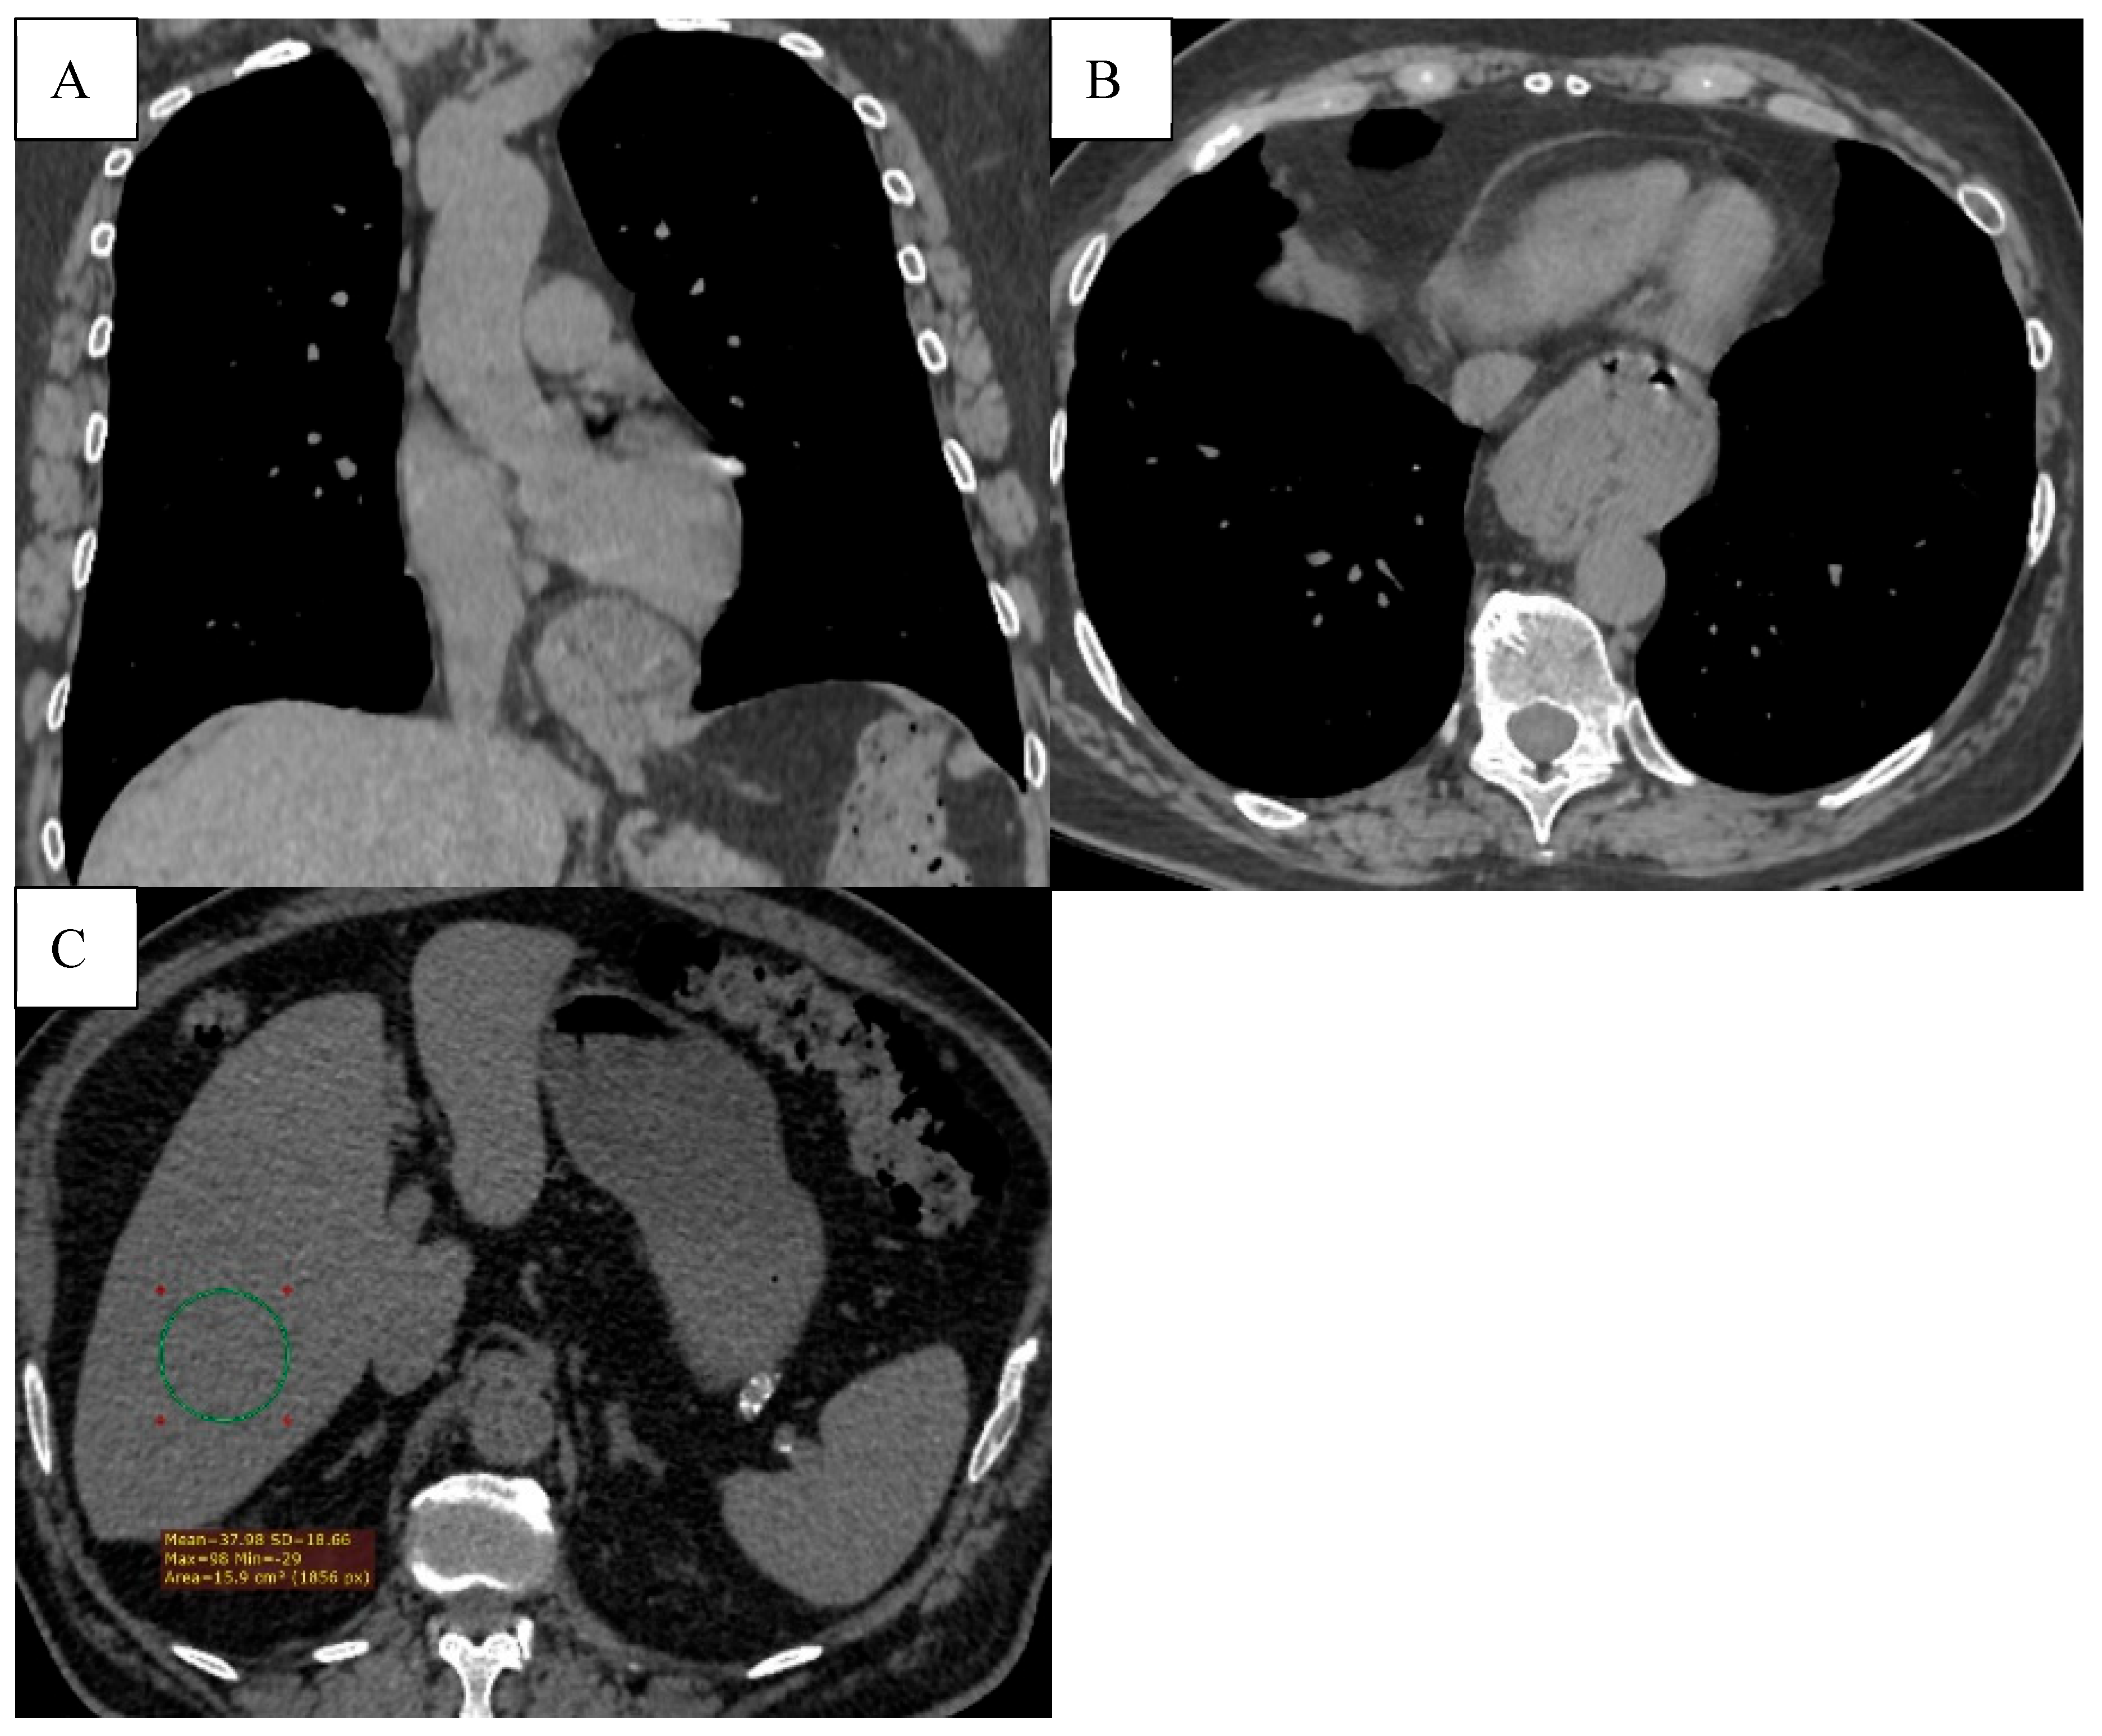
Figure 9.
(A-B) Multiple vascular calcifications of the thoracic aorta and proximal coronary arteries are visible, suggesting underlying atherosclerotic cardiovascular disease. (C) Coronal reconstruction further highlighting the presence of extensive aortic and coronary calcifications.
Figure 9.
(A-B) Multiple vascular calcifications of the thoracic aorta and proximal coronary arteries are visible, suggesting underlying atherosclerotic cardiovascular disease. (C) Coronal reconstruction further highlighting the presence of extensive aortic and coronary calcifications.
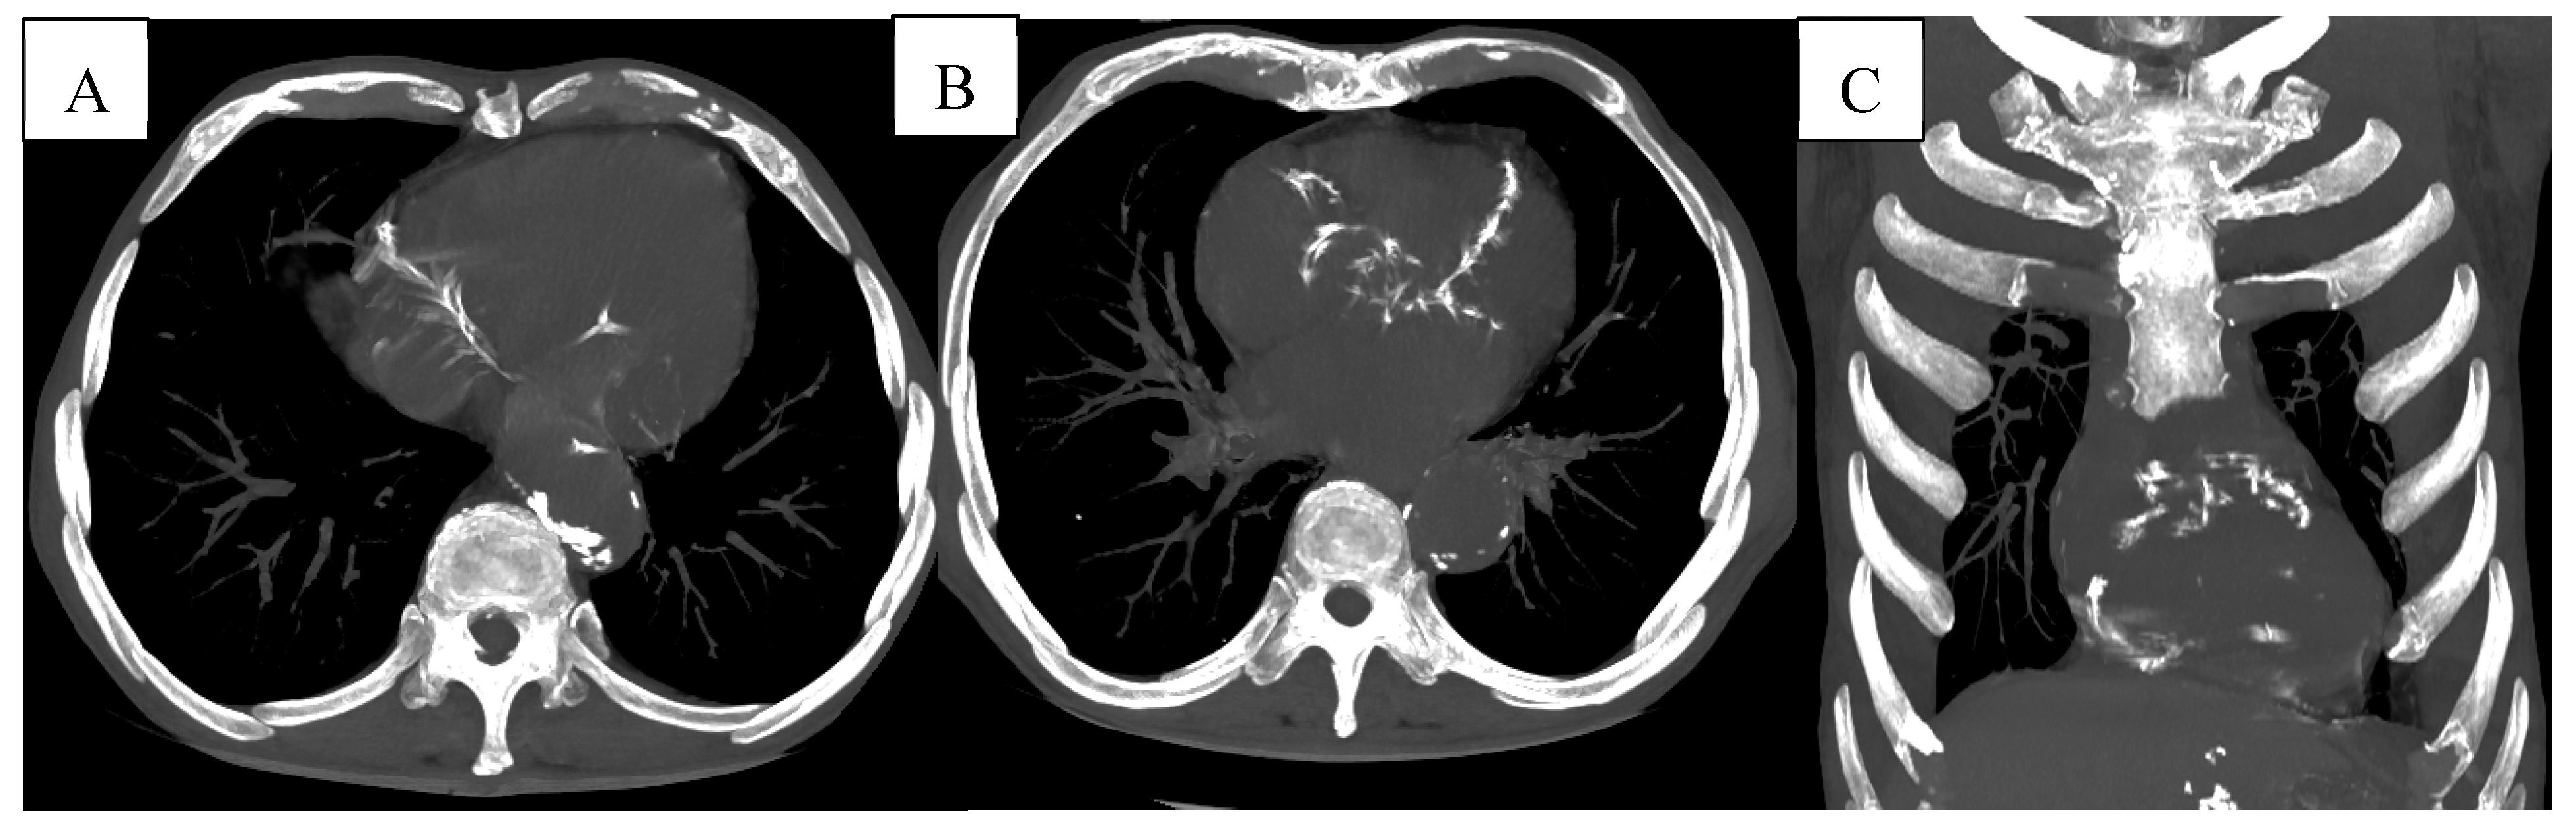

Table 1.
Demographic characteristics and functional data of participants at baseline (n = 99).
| Variables | ||
|---|---|---|
| Age in years, median (IQR) | 67.8 (37- 88) | |
| Sex, n (%) | Male sex | 86 |
| Female sex | 14 | |
| Smoker, n% | No smoker | 8,0 |
| Current smoker | 58,5 | |
| Ex-smoker | 33,3 | |
| FEV1%, mean Spirometry GOLD stages (%) |
I II III IV |
57,9 9 18 52 21 |
Notes: Data are presented as median (interquartile range) or mean (percentage) where appropriate. Abbreviations: GOLD, Global Initiative for Obstructive Lung Disease; FEV1, forced expiratory volume in 1 s; IQR, interquartile range.
Table 2.
Prevalence of the different CT- assessed comorbidities.
| Morbidity Detected | % of Pati ents |
|---|---|
| Osteoporosis | 83 |
| CAC | 66 |
| PAE | 36 |
| Emphysema (as a part of COPD) | 31 |
| Bronchiectasis | 19 |
| Hiatal hernia | 17 |
| Lung cancer | 14 |
| Pulmonary infections | 12 |
| ILA | 3 |
Abbreviations: CAC, coronary artery calcification; PAE, pulmonary artery enlargement; ILA, interstitial lung abnormalities.
Disclaimer/Publisher’s Note: The statements, opinions and data contained in all publications are solely those of the individual author(s) and contributor(s) and not of MDPI and/or the editor(s). MDPI and/or the editor(s) disclaim responsibility for any injury to people or property resulting from any ideas, methods, instructions or products referred to in the content. |
© 2026 by the authors. Licensee MDPI, Basel, Switzerland. This article is an open access article distributed under the terms and conditions of the Creative Commons Attribution (CC BY) license (http://creativecommons.org/licenses/by/4.0/).
Copyright: This open access article is published under a Creative Commons CC BY 4.0 license, which permit the free download, distribution, and reuse, provided that the author and preprint are cited in any reuse.


