Submitted:
31 December 2025
Posted:
02 January 2026
You are already at the latest version
Abstract
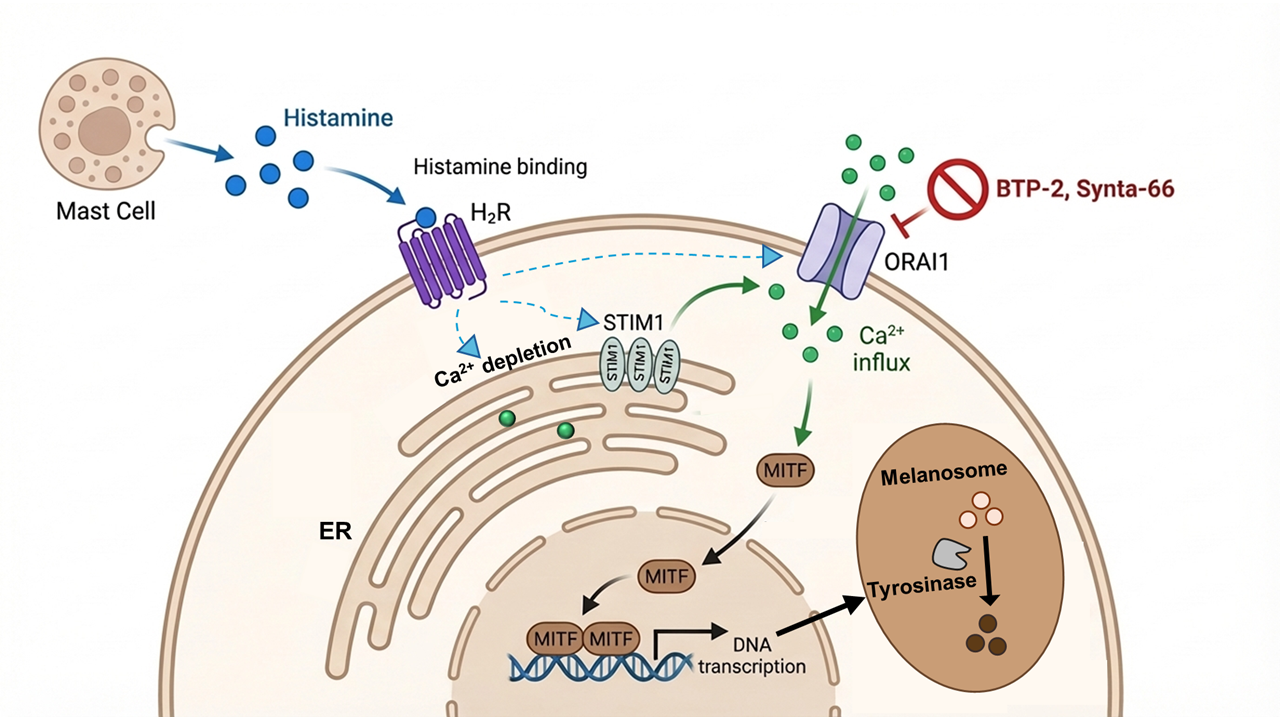
Post-inflammatory hyperpigmentation (PIH) is a common pigmentary disorder characterized by excessive melanin production following skin inflammation. Histamine, a key inflammatory mediator, is known to stimulate melanogenesis via H2 receptors; however, the underlying calcium signaling mechanisms remain largely unexplored. In this study, we investigated the role of the ORAI1-STIM1 complex in histamine-induced melanogenesis using B16F10 melanoma cells and normal human epidermal melanocytes (NHEMs). Histamine (10–30 μM) significantly increased melanin content (2.5–2.8-fold), an effect specifically abolished by the H2 antagonist famotidine. Notably, while acute histamine application failed to trigger immediate calcium influx, chronic exposure significantly enhanced store-operated calcium entry (SOCE) capacity by approximately 2.8-fold, providing evidence for a functional remodeling of the Ca2+ signaling machinery. Histamine-induced melanogenesis was significantly suppressed by intracellular calcium chelation, pharmacological inhibition of ORAI1 (BTP-2 or Synta-66), and siRNA-mediated silencing of ORAI1 or STIM1, but not ORAI2, ORAI3, or STIM2. Our findings demonstrate that chronic histamine exposure drives hyperpigmentation through ORAI1-STIM1-mediated SOCE remodeling, establishing this complex as a promising therapeutic target for the treatment of PIH and related inflammatory pigmentary disorders.
Keywords:
melanogenesis
; histamine
; ORAI1
; store-operated calcium entry
; H2 receptor
; post-inflammatory hyperpigmentation
; calcium signaling
; primary human melanocytes
1. Introduction
Melanin is the primary pigment determining the coloration of skin, hair, and eyes, while simultaneously providing essential protection against DNA damage induced by ultraviolet (UV) radiation [1]. Melanogenesis, the biosynthetic pathway producing melanin, involves an intricate enzymatic cascade initiated by the tyrosinase-catalyzed conversion of L-tyrosine into L-3,4-dihydroxyphenylalanine (L-DOPA), followed by progressive oxidation and polymerization into melanin macromolecules [2,3]. The microphthalmia-associated transcription factor (MITF) serves as the master regulator of this process, governing the transcriptional activation of key melanogenic enzymes, including tyrosinase (TYR), tyrosinase-related protein-1 (TRP-1), and dopachrome tautomerase (DCT/TRP-2) [2,4,5]. Multiple intracellular signaling cascades, notably the cAMP-dependent protein kinase A (PKA), MAPK, and Wnt/β-catenin pathways, converge to modulate MITF activity in response to external stimuli such as UV radiation, hormones, and inflammatory mediators [2,6,7,8]. While photoprotective, excessive melanin deposition characterizes hyperpigmentation disorders such as melasma, solar lentigines, and post-inflammatory hyperpigmentation (PIH), which present substantial aesthetic and psychological burdens to affected individuals [9,10].
PIH represents one of the most common acquired pigmentary disorders, characterized by darkened patches of skin that develop following inflammatory or traumatic insults to the epidermis and dermis [11]. PIH can arise from diverse triggers, including acne vulgaris, atopic dermatitis, infections, and cosmetic procedures, significantly impacting patients' quality of life [11]. The pathogenesis of PIH involves a complex interplay between inflammatory mediators and melanocyte activity. During the inflammatory response, keratinocytes, fibroblasts, and immune cells (including mast cells and macrophages) release various mediators such as prostaglandins, cytokines (IL-1α, IL-6, TNF-α), reactive oxygen species, and histamine. These mediators stimulate melanocyte activity, leading to increased melanin synthesis and transfer to surrounding keratinocytes [12]. Despite its clinical prevalence, current therapeutic options primarily targeting tyrosinase activity or epidermal turnover frequently yield slow or incomplete responses and carry risks of adverse effects [11]. Histamine is a potent stimulator of melanogenesis, particularly in pruritic inflammatory conditions that lead to pronounced PIH [13,14]. Early investigations demonstrated that histamine induces morphological changes, including cell enlargement and increased dendricity, alongside elevated tyrosinase activity and melanin content [13]. Subsequent studies confirmed that histamine also enhances melanocyte proliferation and migration [15]. Mechanistically, H2 receptor activation increases intracellular cyclic AMP (cAMP) accumulation, which activates PKA, ultimately upregulating MITF and its downstream targets [13].
Intracellular calcium (Ca2+) serves as another critical second messenger in melanogenesis, directly influencing melanin synthesis by modulating cAMP and tyrosinase activity [16,17,18,19]. Elevated intracellular Ca2+ enhances melanin production, while disruption of calcium homeostasis impairs pigmentation [16,17,20]. Ca2+-dependent kinases, such as CaMKII and PKC, transduce calcium signals by phosphorylating key regulators like CREB and MITF [21]. Among various calcium entry mechanisms, store-operated calcium entry (SOCE) has emerged as a key regulator. Previous studies have established that ORAI1 mediates melanin synthesis triggered by endothelin-1 (ET-1) and UVB, where pharmacological inhibition or siRNA-mediated ORAI1 downregulation significantly reduces Ca2+ entry and tyrosinase activity [22,23,24].
Despite these advances, critical gaps remain regarding how inflammatory mediators drive sustained melanin overproduction in PIH. While histamine signals via H2 receptors and ORAI1 mediates ET-1-induced melanogenesis, the potential crosstalk between these systems remains unexplored. Significantly, in other pathological models, chronic exposure to inflammatory stimuli has been shown to induce 'SOCE remodeling', a phenotypic shift that enhances the Ca2+signaling machinery.
Building on these observations, we hypothesized that chronic histamine exposure might remodel the SOCE machinery in melanocytes, thereby enhancing Ca2+ entry to drive sustained melanin production. In this study, we investigated the role of ORAI1 channels in histamine-induced melanogenesis. We aimed to determine the effects of histamine on SOCE capacity and the specific contribution of ORAI1 to melanin production in both B16F10 melanoma cells and normal human epidermal melanocytes (NHEMs). Our findings identify ORAI1 as a potential therapeutic target for inflammation-associated pigmentary disorders.
2. Results
2.1. Histamine Induces Melanin Production in Melanocytes
To investigate the effect of histamine on melanogenesis, we first evaluated its impact on B16F10 cell viability. After 24 hours, histamine (0-100 μM) showed no significant effect on cell viability. However, at 48 hours, treatment with 100 μM histamine reduced cell viability to 76.8% compared to the control. At 72 hours, treatment with 30 μM and 100 μM histamine decreased cell viability to 72.8% and 71.8% of the control, respectively, while lower concentrations remained non-toxic (Figure 1A). Based on these findings, we selected 0-30 μM histamine with 48-hour treatment for the next experiments. Visual examination of B16F10 cell pellets revealed progressive darkening with increasing histamine concentrations (Figure 1B). Quantitative analysis confirmed that 10 μM and 30 μM histamine significantly increased melanin content approximately 2.74-fold and 2.73-fold compared to control (p < 0.001), respectively, while 1 μM and 3 μM showed no effect (Figure 1C). Therefore, 10 μM histamine for 48 hours was used in subsequent experiments. To validate these findings in primary cells, we examined NHEMs. Histamine (10 μM) induced progressive darkening of NHEM pellets over 8 days (Figure 1D). Quantitative analysis showed that histamine significantly increased melanin production from day 4 (approximately 1.95-fold, p < 0.001), reaching peak levels at days 6 and 8 (approximately 2.51 and 2.70-fold, p < 0.001), while controls maintained relatively stable melanin levels (Figure 1E). Collectively, these results demonstrate that histamine potently stimulates melanin production in both immortalized melanoma cells and primary human melanocytes.
2.2. Histamine Induces Melanogenesis in Melanocytes Through Histamine H2 Receptors
To elucidate the receptor subtype mediating histamine-induced melanogenesis, we examined the effects of selective histamine receptor antagonists. B16F10 cells were treated with histamine (10 μM) alone or in combination with pyrilamine (H1 antagonist), famotidine (H2 antagonist), or thioperamide (H3 antagonist). Visual inspection revealed that histamine-induced darkening was maintained with pyrilamine and thioperamide but markedly attenuated by famotidine (Figure 2A). Quantitative analysis confirmed that histamine significantly increased melanin content approximately 2.5-fold compared to untreated control (p < 0.001). Co-treatment with pyrilamine or thioperamide did not significantly inhibit histamine-induced melanin production, whereas famotidine completely abolished the stimulatory effect of histamine, reducing melanin levels to those comparable with untreated controls (Figure 2B). These results indicate that histamine stimulates melanin synthesis in B16F10 cells primarily through H2 receptor activation. To confirm these findings in primary human melanocytes, we performed similar experiments using NHEMs. Consistent with the B16F10 results, visual examination and quantitative melanin analysis showed that histamine-induced darkening of NHEM pellets was prevented by famotidine but not by pyrilamine or thioperamide (Figure 2C-D). Taken together, these findings demonstrate that histamine-induced melanogenesis in both B16F10 melanoma cells and primary human melanocytes is mediated through the H2 receptor subtype.
2.3. Chronic Histamine Exposure Enhances SOCE Capacity in Melanocytes
To investigate whether histamine induces intracellular calcium signaling in melanocytes, we performed calcium imaging experiments. In B16F10 cells, acute application of histamine (1-100 μM) in the presence of extracellular calcium (1.3 mM Ca²⁺) did not significantly increase cytosolic Ca²⁺ levels across all tested concentrations (Figure 3A). Similarly, in NHEMs, histamine application did not elicit detectable changes in intracellular Ca²⁺ concentration (Figure 3B). These results suggest that histamine does not trigger immediate calcium influx through plasma membrane calcium channels in either cell type.
We next examined whether histamine modulates SOCE, a major calcium influx pathway in non-excitable cells. B16F10 cells were pretreated with vehicle control or histamine (10 μM) for 48 hours, followed by SOCE measurement. Representative traces showed that histamine pretreatment significantly enhanced SOCE amplitude compared to control cells (Figure 3C, left). Quantitative analysis revealed that histamine increased SOCE amplitude (ΔF340/F380) approximately 2.86-fold compared to control (p < 0.001) (Figure 3C, right). Similar experiments were performed in NHEMs pretreated with vehicle or histamine (10 μM) for 6 days. Consistent with B16F10 results, histamine pretreatment significantly enhanced SOCE in NHEMs (Figure 3D, left and middle). Quantification demonstrated that histamine increased SOCE amplitude approximately 2.81-fold compared to control (p < 0.001) (Figure 3D, right). The marked contrast between the lack of acute response and the significant enhancement following long-term exposure provides strong evidence that histamine does not simply trigger an immediate Ca2+ signal but rather remodels the Ca2+ signaling machinery over time to sustain hyperpigmentation.
2.4. Intracellular Calcium Is Required for Histamine-Induced Melanogenesis
To determine whether intracellular calcium plays a role in histamine-induced melanin production, we examined the effects of BAPTA-AM (an intracellular calcium chelator, 10 μM) on melanogenesis in both B16F10 cells and NHEMs. Kojic acid (KA, 50 μM), a well-known tyrosinase inhibitor, was used as a positive control. In both B16F10 and NHEM cells, histamine significantly increased melanin content compared to control (p < 0.001). Co-treatment with BAPTA-AM significantly reduced histamine-induced melanin production (p < 0.001), while kojic acid completely abolished the effect (Figure 4). These findings demonstrate that histamine-induced melanogenesis requires intracellular calcium signaling in both B16F10 cells and primary human melanocytes, directly linking the observed SOCE potentiation to pigment production.
2.5. ORAI1 and STIM1 Are the Essential Molecular Components of SOCE in Melanocytes
To determine the specific molecular mediators of SOCE in melanocytes, we performed siRNA-mediated knockdown of the ORAI and STIM family members in NHEMs. In control cells, thapsigargin-induced store depletion followed by the addition of extracellular calcium elicited a robust SOCE response. Strikingly, silencing of either ORAI1 or STIM1 significantly abrogated the SOCE response. Representative traces showed that knockdown of ORAI1 (Figure 5B) or STIM1 (Figure 5E) dramatically reduced calcium influx compared to the control (Figure 5A). Quantitative analysis confirmed that ORAI1 and STIM1 knockdown significantly reduced the SOCE amplitude (ΔF340/F380) to approximately 23.96% and 32.76% of control levels (p < 0.001), respectively. In contrast, siRNA-mediated silencing of ORAI2, ORAI3, or STIM2 had no significant effect on the SOCE amplitude (Figure 5C, D, F, G). These findings demonstrate that ORAI1 and STIM1 are the primary functional units mediating SOCE in primary human melanocytes, while other isoforms do not contribute significantly to this pathway.
2.6. Histamine-Induced Melanogenesis Is Specifically Mediated Through the ORAI1-STIM1 Dependent SOCE Pathway
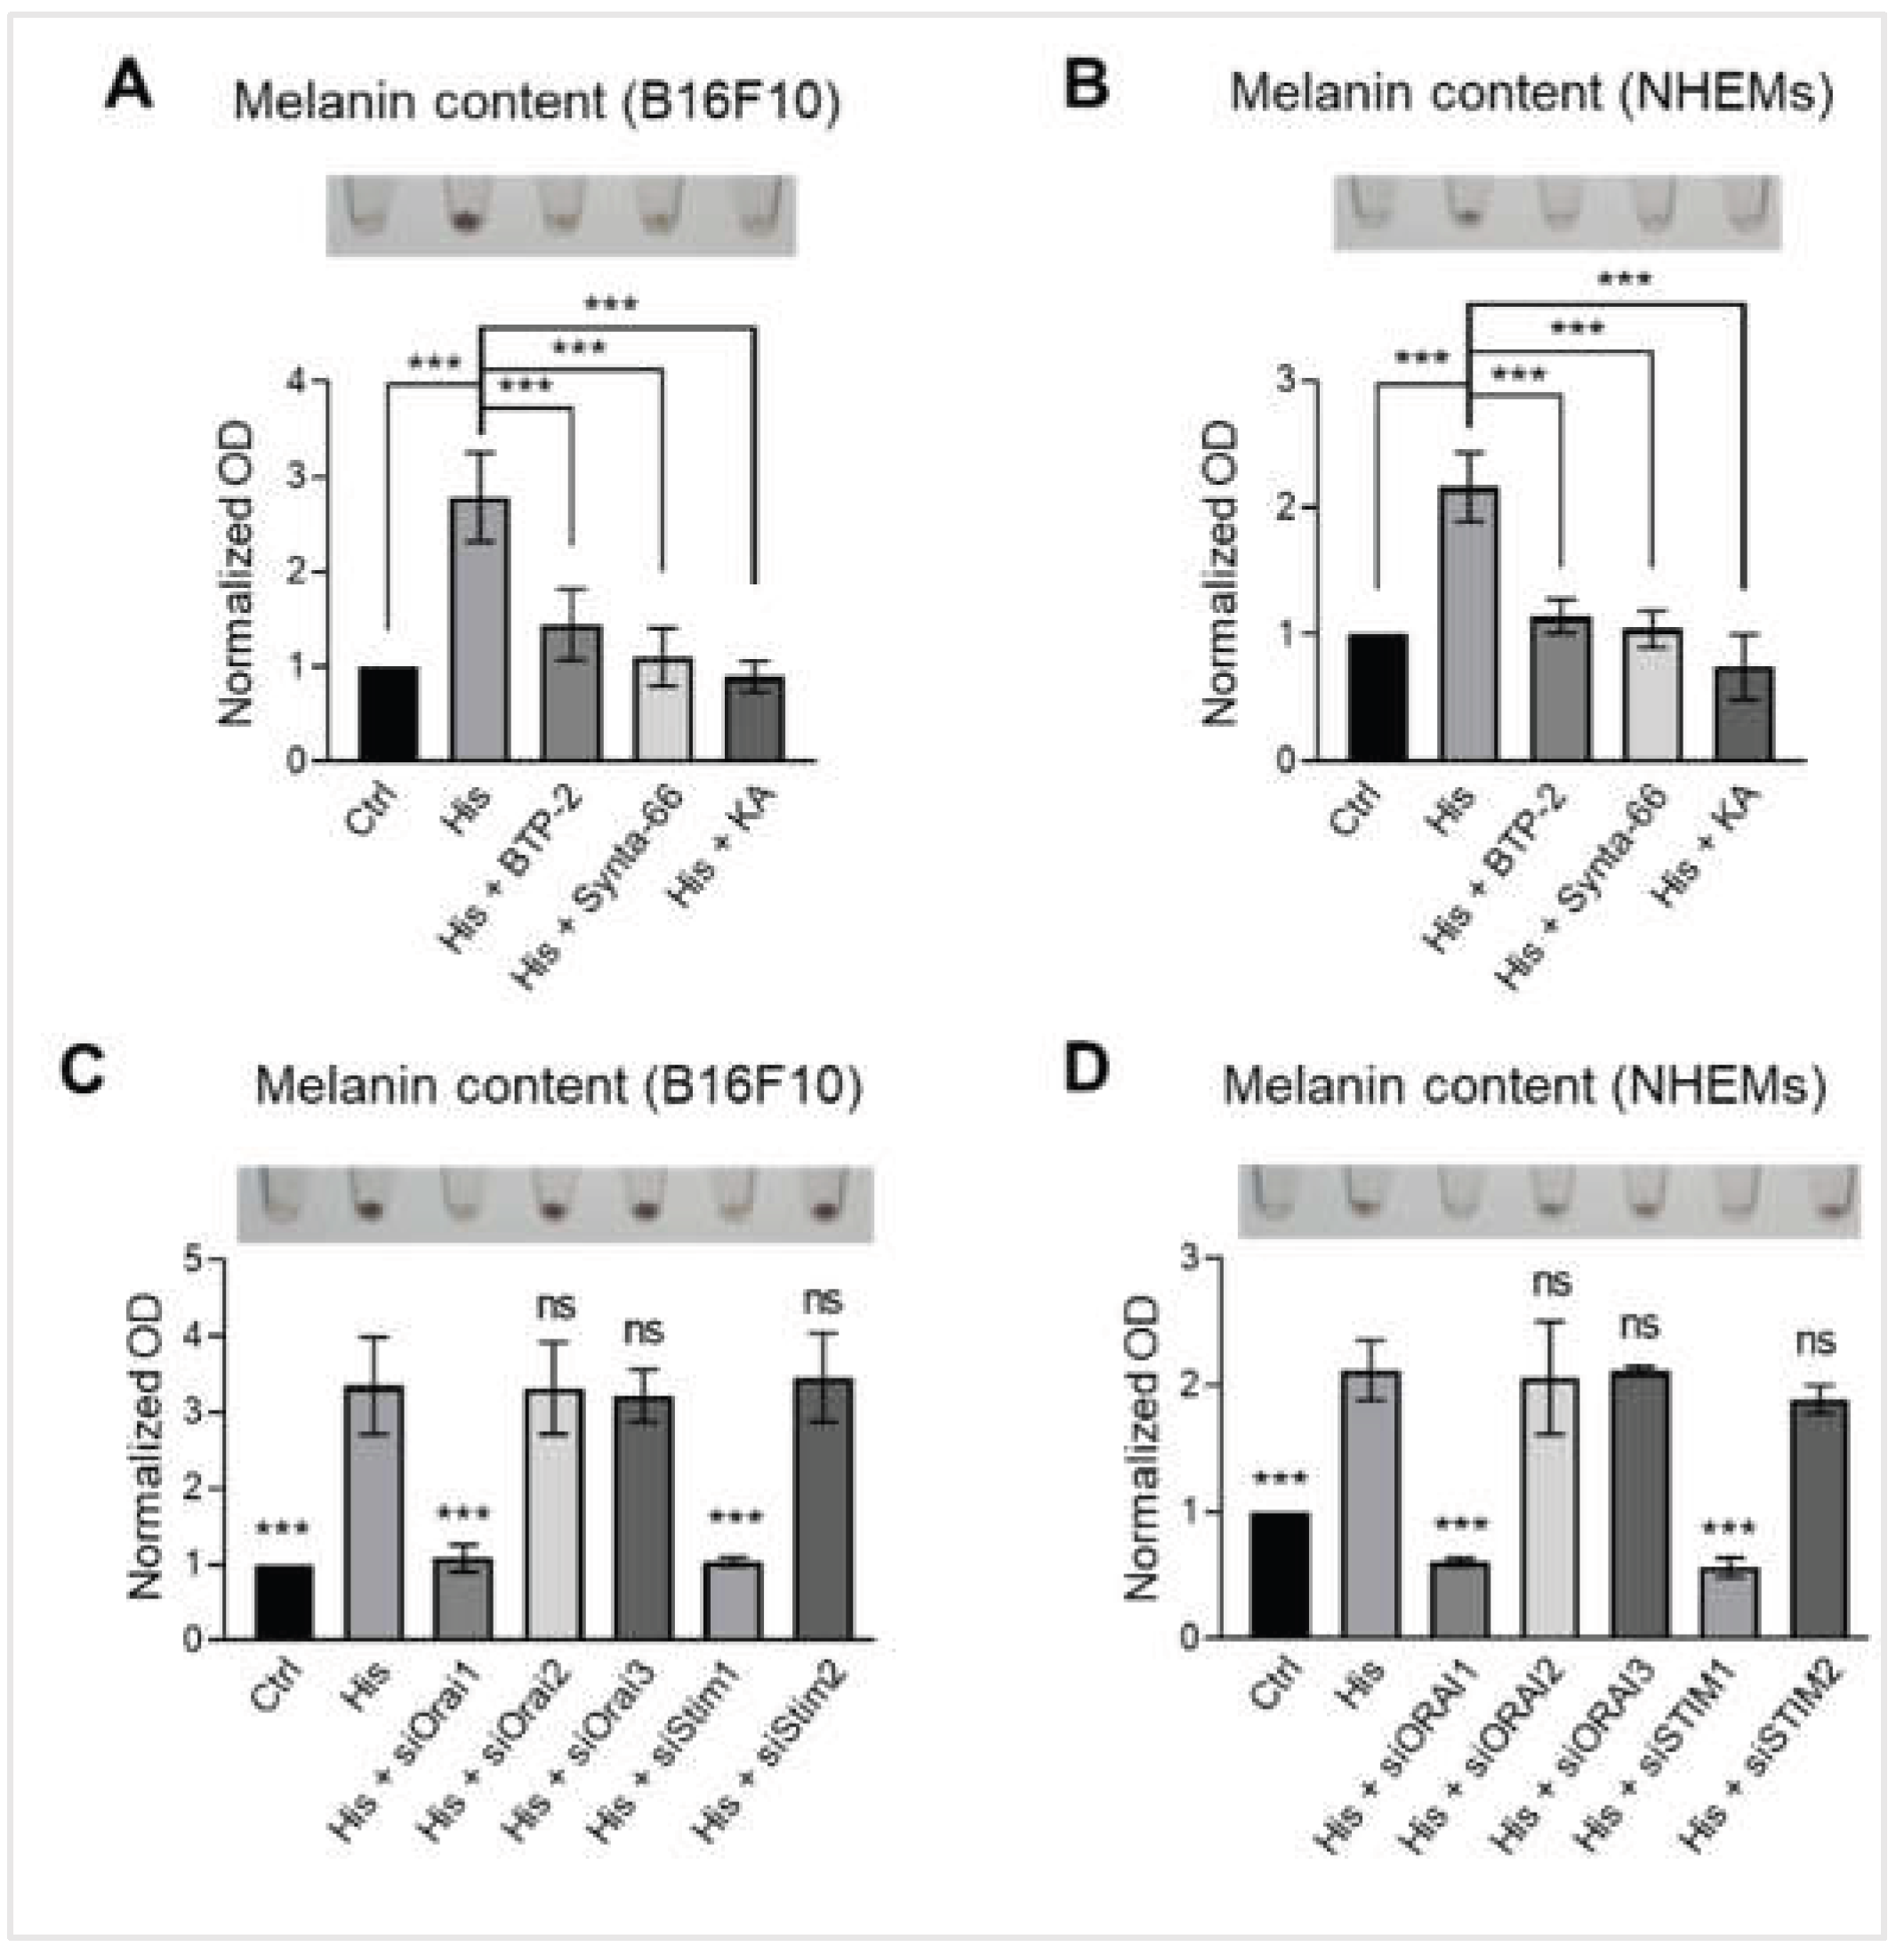
To investigate whether the ORAI1-STIM1 complex-mediated SOCE is functionally linked to histamine-induced melanogenesis, we utilized pharmacological inhibitors and genetic silence. In B16F10 cells, 10 μM histamine increased melanin content approximately 2.77-fold compared to the control (p < 0.001). This stimulatory effect was significantly suppressed by the SOCE inhibitor BTP-2 (5 μM) and the ORAI1-selective inhibitor Synta-66 (10 μM), reducing melanin content to 1.44-fold and 1.10-fold of the control, respectively; kojic acid served as a positive control for total inhibition (Figure 6A). Similar inhibitory effects were observed in NHEMs, where BTP-2 and Synta-66 reduced histamine-induced melanin production to 1.14 and 1.04-fold of the control, respectively (p < 0.001) (Figure 6B). To further validate the specific involvement of the ORAI1-STIM1 complex, we conducted siRNA knockdown experiments in both cell types. Silencing of either Orai1 or Stim1 in B16F10 cells effectively neutralized the melanogenic effect of histamine, reducing melanin levels to approximately 1.08-fold and 1.04-fold of the control, respectively (p < 0.001). In NHEMs, ORAI1 and STIM1 knockdown also significantly suppressed histamine-induced melanin production to near-control levels (p < 0.001). However, the knockdown of ORAI2, ORAI3, or STIM2 did not significantly affect the histamine-induced increase in melanin content in either cell line (Figure 6C, D). Collectively, these findings establish that histamine-induced melanin overproduction is critically dependent on the ORAI1-STIM1 mediated SOCE pathway in both melanoma cells and primary human melanocytes.
3. Discussion
In this study, we investigated the role of ORAI1 calcium channels in histamine-induced melanogenesis and uncovered a novel calcium-dependent mechanism linking inflammatory mediators to melanin production. Our key findings demonstrate that: (1) histamine significantly increases melanin content in both B16F10 melanoma cells and primary human melanocytes (NHEMs) through H2 receptor activation; (2) while acute histamine application does not trigger immediate calcium influx, chronic histamine pretreatment significantly enhances the capacity for SOCE ; (3) intracellular calcium is essential for histamine-induced melanogenesis; (4) ORAI1 and STIM1 serve as the primary molecular mediators of SOCE in melanocytes ; and (5) pharmacological inhibition or genetic silencing of ORAI1 or STIM1 effectively suppresses histamine-induced melanin production. These findings reveal ORAI1-STIM1 mediated calcium signaling as a critical pathway in histamine-induced melanogenesis and establish ORAI1 channels as a potential therapeutic target for PIH.
Our results confirm previous findings that histamine-induced melanogenesis is mediated specifically through H2 receptors, as demonstrated by the complete blockade with the H2 antagonist famotidine while H1 and H3 antagonists showed no effect. This is consistent with earlier reports by Yoshida et al., who established that histamine stimulates melanogenesis via H2 receptor-cAMP/PKA signaling in human melanocytes [13]. However, our study reveals a previously unrecognized role for calcium signaling in this process.
A pivotal finding of this study is the temporal distinction in histamine's effect on calcium signaling. Acute histamine application (1–100 μM) failed to trigger immediate calcium influx, yet chronic histamine pretreatment (48 hours in B16F10 cells, 6 days in NHEMs) significantly enhanced SOCE capacity by approximately 2.8-fold. This time-dependent effect suggests that histamine does not directly activate calcium channels but rather induces a functional remodeling of the Ca2+ signaling machinery over time. The requirement for chronic exposure aligns with the clinical observation that PIH develops gradually during sustained inflammation rather than appearing immediately after inflammatory insults [10]. This distinguishes the histamine-H2 receptor pathway from other stimuli like ET-1, which acutely triggers calcium influx through ORAI1 channels.
Mechanistically, this SOCE remodeling may involve H2 receptor-mediated upregulation of ORAI1 or STIM1 protein expression, or enhanced trafficking of these proteins to the plasma membrane. Notably, STIM1 has been shown to directly activate adenylyl cyclase 6 (AC6) in melanocytes, creating a positive feedback loop that amplifies cAMP signaling [25]. Thus, the histamine-induced enhancement of SOCE likely leads to increased cAMP accumulation, further upregulating the MITF axis and driving the excessive melanin production characteristic of PIH. Future investigations using Western blot analysis to quantify ORAI1 and STIM1 protein levels after chronic exposure will be essential to further validate this remodeling hypothesis.
The pivotal role of ORAI1 in melanogenesis has been increasingly recognized across diverse stimuli. Previous studies have shown that ORAI1 mediates ET-1-induced pigmentation, where its knockdown significantly reduces both calcium influx and tyrosinase activity [22]. Similarly, ORAI1 inhibition has been shown to block UV-induced melanogenesis, with ORAI1-targeting agents suppressing melanin production by up to 60% [24]. Interestingly, recent reports on echinochrome A (Ech A) further support this paradigm; Ech A not only downregulates the cAMP/PKA-CREB-MITF cascade but also potently inhibits ORAI1/STIM1 channels at similar concentrations [26,27]. This dual inhibitory action suggests a synergistic interplay between cAMP and calcium signaling pathways, a concept that aligns with our identification of the ORAI1-STIM1 complex as a central hub for histamine-induced signaling.
Our findings extend these observations by identifying histamine as a novel upstream stimulus that converges on the ORAI1-STIM1 machinery. However, we reveal a distinct temporal signature: while ET-1 and UV typically trigger immediate calcium influx through direct channel activation, chronic histamine exposure enhances SOCE capacity without eliciting an acute response [22]. This suggests that different melanogenic stimuli engage ORAI1 through specialized mechanisms either through rapid gating or through the functional remodeling we observed here. Despite these upstream differences, the convergence of multiple pathways (UV, ET-1, and histamine) on ORAI1-mediated calcium entry marks it as a critical and universal step in melanogenesis. From a clinical perspective, this makes ORAI1 an ideal therapeutic target. Unlike conventional tyrosinase inhibitors that often interfere with basal pigmentation [28], ORAI1-targeted therapy could specifically suppress stimulus-induced hypermelanosis while potentially preserving the skin's natural baseline coloration.
While this study provides compelling evidence for ORAI1’s role in both B16F10 cells and NHEMs, certain aspects warrant further investigation. Although we focused on the functional outcomes of melanin content, future studies mapping the precise temporal expression dynamics of MITF and tyrosinase proteins would complement our current findings. Furthermore, while two-dimensional cultures established the fundamental signaling logic, validating these pathways in three-dimensional skin models or in vivo PIH models will be essential to account for the complex interactions within the skin microenvironment.
Ultimately, the development of topically applicable ORAI1 inhibitors presents a promising translational opportunity. By targeting the ORAI1-STIM1 complex locally, it may be possible to mitigate inflammatory hyperpigmentation with high specificity and minimal systemic exposure. These findings establish a strong foundation for advancing ORAI1-targeted interventions as a next-generation treatment strategy for PIH and related pigmentary disorders.
4. Materials and Methods
4.1. Chemicals and Cell Lines
Histamine, pyrilamine, famotidine, thioperamine, BTP-2, synta-66, BAPTA-AM, kojic acid, and thapsigargin were procured from Sigma. Both the B16F10 cell line and Normal Human Epithelial primary Melanocytes (NHEMs) were purchased from American Type Culture Collection (ATCC) (Manassas, VA, USA).
4.2. Cell Culture
Experiments were performed on B16F10 and NHEM cells. B16F10 were cultured in Dulbecco's modified Eagle's medium (DMEM, Welgene Inc., Daegu, Korea) with 10% fetal bovine serum (FBS, Welgene Inc.) and 1% penicillin/streptomycin (P/S, Life technologies, Carlsbad, CA, USA) at 37oC in a 5% CO2 incubator. Melanoma cells with passage 5-15 were used. NHEMs were cultured in dermal cell basal medium (ATCC, Cat# PCS-200-030, Manassas, VA, USA) supplemented with adult human melanocyte growth supplement (ATCC, Cat# PCS-200-013, Manassas, VA, USA) and Penicillin-Streptomycin-Amphotericin B (ATCC, Cat# PCS-999-002, Manassas, VA, USA) at 37oC in a 5% CO2 incubator. The primary melanocytes with passage 2-6 were used.
4.3. Cell Viability
B16F10 cells were cultured in 96-well plate with density 1 x 10⁴ cells per well. After one day, various concentrations of Histamine were added. Following 24, 48, and 72 hours of incubation, cells were exposed to 10 uM CCK-8 (Dojindo Laboratories, Japan) for 120 minutes. The optical density (OD) was measured at 450 nm and normalized to the value of blank and control cells to calculate viability.
4.4. Melanin Content Measurement
B16F10 cells were seeded into a 6-well plate at a density of 1 x 10⁵ cells per well. After culturing overnight, cells were treated with various concentrations of histamine with or without other chemicals for 48 hours. NHEMs were seeded into 100 mm plates at a density of 1 x 10⁶ cells per well. After culturing overnight, cells were treated with histamine 10 μM with or without other chemicals for 6 days. To maintain consistent drug exposure during this extended treatment period, the culture medium containing fresh chemicals was replaced every 48 hours.
Following treatment, cells were harvested and washed twice with phosphate buffered saline (PBS). The pelleted cells were lysed in 1N sodium hydroxide (NaOH) and then heated at 80oC for 1 h. Cell lysates were transferred to a 96-well plate, and the absorbance was measured at 405 nm using a microplate reader. Relative melanin content was normalized to total protein measured using Pierce™ BCA Protein Assay Kit.
4.5. Small Interfering RNA Transfection
B16F10 cells were seeded into a 6-well plate at a density of 1 x 10⁵ cells per well. After culturing overnight, cells were transfected with each siRNA (100 nM) using TurboFect Transfection Reagent for 48 hours. NHEMs were seeded into 100 mm plates at a density of 1 x 10⁶ cells per well. After culturing overnight, cells were transfected with siRNA (300 nM) using Turbofect reagent for 6 days, the medium containing siRNA was changed every 48 hours. Pools of three or five target-specific siRNA directed against ORAI1, ORAI2, ORAI3, STIM1, and STIM2 for human and mouse were purchased from Santa Cruz Biotechnology (Santa Cruz, CA).
4.6. Calcium Imaging
Ca2+ influx measurements were performed with B16F10 and NHEM cells. B16F10 cells were seeded into a 6-well plate at a density of 1 x 10⁵ cells per well. After culturing overnight, cells were treated with histamine 10 μM for 48 hours. NHEMs were seeded into 100 mm plates at a density of 1 x 10⁶ cells per well. After culturing overnight, cells were treated with histamine 10 μM for 6 days. To maintain consistent drug exposure during this extended treatment period, the culture medium containing fresh chemicals was replaced every 48 hours.
Ca2+ influx measurements were conducted in the normal Tyrode’s (NT) solution, including 145 mM NaCl, 3.6 mM KCl, 10 mM HEPES, 1 mM MgCl2, 1 mM EGTA, 5 mM glucose, and adjusted to 7.4 pH with NaOH. B16F10 and NHEM cells were incubated with Fura-2 acetoxymethyl ester (Fura-2 AM, Thermo Fisher Scientific) at 2 μM final concentration in 30 min at 37oC. Then, these cells were loaded onto 14 mm coverslips coated with poly-L-Lysine. The ORAI1 channels were activated through store depletion induced by exposure to thapsigargin 1 μM. Fura-2 AM was excited at wavelengths of 340 nm and 380 nm and collected at an emission wavelength of 510 nm. Fluorescence signal was measured by a digital system including an illuminator (pE-340 fura; CoolLED, Andover, UK) and a camera (sCMOS pco.edge 4.2; PCO, Kelheim, Germany). The 340/380 ratio was obtained every 10 s and analyzed using NIS-Element AR Version 5.00.00 (Nikon).
4.7. Statistical Analysis
The results were analysed using GraphPad Prism 8.0 (GraphPad Software, Boston, MA, USA) and Origin 2021b (MicroCal). All data are shown as the mean ± standard deviation (SD). One-way analysis of variance (ANOVA), followed by Dunnett’s post-hoc test, was used for multiple comparisons. Statistical significance was defined as p-value < 0.05.
5. Conclusions
This study demonstrates that the ORAI1-STIM1-mediated SOCE pathway is essential for histamine-induced melanogenesis. We reveal that chronic, rather than acute, histamine exposure induces functional remodeling of the calcium signaling machinery, significantly enhancing SOCE capacity to drive sustained melanin overproduction. Pharmacological or genetic inhibition of this complex effectively suppresses histamine-induced hyperpigmentation. These findings establish the ORAI1-STIM1 complex as a promising therapeutic target for treating PIH and related inflammatory pigmentary disorders.
Author Contributions
Conceptualization, J.H.N. and H.J.K.; methodology, N.T.H.V. and P.T.L.H; software, N.T.H.V. and P.T.L.H.; validation, N.T.H.V.; formal analysis, N.T.H.V. and P.T.L.H.; investigation, N.T.H.V.; resources, N.T.H.V.; data curation, N.T.H.V.; writing—original draft preparation, N.T.H.V.; writing—review and editing, J.H.N, H.J.K and W.K.K.; visualization, N.T.H.V.; supervision, J.H.N. and H.J.K; project administration, W.K.K; funding acquisition, J.H.N. All authors have read and agreed to the published version of the manuscript.
Funding
This research was mainly supported by the Dongguk University Research Fund of 2022.
Institutional Review Board Statement
Not applicable.
Informed Consent Statement
Not applicable.
Data Availability Statement
Not applicable.
Conflicts of Interest
The authors declare no conflict of interest.
Abbreviations
The following abbreviations are used in this manuscript:
| PIH | Post-inflammatory hyperpigmentation |
| NHEMs | Normal Human Epidermal Melanocytes |
| SOCE | Store-operated calcium entry |
| UV | Ultraviolet |
| ET-1 | Endothelin-1 |
| MITF | Microphthalmia-associated transcription factor |
References
- Brenner, M.; Hearing, V.J. The protective role of melanin against UV damage in human skin. Photochem Photobiol 2008, 84, 539-549. [CrossRef]
- D'Mello, S.A.; Finlay, G.J.; Baguley, B.C.; Askarian-Amiri, M.E. Signaling Pathways in Melanogenesis. Int J Mol Sci 2016, 17,. [CrossRef]
- Słominski, A.; Moellmann, G.; Kuklinska, E.; Bomirski, A.; Pawelek, J. Positive regulation of melanin pigmentation by two key substrates of the melanogenic pathway, L-tyrosine and L-dopa. J Cell Sci 1988, 89 ( Pt 3), 287-296. [CrossRef]
- Yasumoto, K.; Yokoyama, K.; Shibata, K.; Tomita, Y.; Shibahara, S. Microphthalmia-associated transcription factor as a regulator for melanocyte-specific transcription of the human tyrosinase gene. Mol Cell Biol 1994, 14, 8058-8070. [CrossRef]
- Yasumoto, K.; Yokoyama, K.; Takahashi, K.; Tomita, Y.; Shibahara, S. Functional analysis of microphthalmia-associated transcription factor in pigment cell-specific transcription of the human tyrosinase family genes. J Biol Chem 1997, 272, 503-509. [CrossRef]
- Bertolotto, C.; Buscà, R.; Abbe, P.; Bille, K.; Aberdam, E.; Ortonne, J.P.; Ballotti, R. Different cis-acting elements are involved in the regulation of TRP1 and TRP2 promoter activities by cyclic AMP: pivotal role of M boxes (GTCATGTGCT) and of microphthalmia. Mol Cell Biol 1998, 18, 694-702. [CrossRef]
- Flaherty, K.T.; Hodi, F.S.; Fisher, D.E. From genes to drugs: targeted strategies for melanoma. Nat Rev Cancer 2012, 12, 349-361. [CrossRef]
- Widlund, H.R.; Horstmann, M.A.; Price, E.R.; Cui, J.; Lessnick, S.L.; Wu, M.; He, X.; Fisher, D.E. Beta-catenin-induced melanoma growth requires the downstream target Microphthalmia-associated transcription factor. J Cell Biol 2002, 158, 1079-1087. [CrossRef]
- Syder, N.C.; Quarshie, C.; Elbuluk, N. Disorders of Facial Hyperpigmentation. Dermatol Clin 2023, 41, 393-405. [CrossRef]
- Auffret, N.; Leccia, M.T.; Ballanger, F.; Claudel, J.P.; Dahan, S.; Dréno, B. Acne-induced Post-inflammatory Hyperpigmentation: From Grading to Treatment. Acta Derm Venereol 2025, 105, adv42925. [CrossRef]
- Kashetsky, N.; Feschuk, A.; Pratt, M.E. Post-inflammatory hyperpigmentation: A systematic review of treatment outcomes. J Eur Acad Dermatol Venereol 2024, 38, 470-479. [CrossRef]
- Maghfour, J.; Olayinka, J.; Hamzavi, I.H.; Mohammad, T.F. A Focused review on the pathophysiology of post-inflammatory hyperpigmentation. Pigment Cell Melanoma Res 2022, 35, 320-327. [CrossRef]
- Yoshida, M.; Takahashi, Y.; Inoue, S. Histamine induces melanogenesis and morphologic changes by protein kinase A activation via H2 receptors in human normal melanocytes. J Invest Dermatol 2000, 114, 334-342. [CrossRef]
- Lassalle, M.W.; Igarashi, S.; Sasaki, M.; Wakamatsu, K.; Ito, S.; Horikoshi, T. Effects of melanogenesis-inducing nitric oxide and histamine on the production of eumelanin and pheomelanin in cultured human melanocytes. Pigment Cell Res 2003, 16, 81-84. [CrossRef]
- Kim, N.H.; Lee, A.Y. Histamine effect on melanocyte proliferation and vitiliginous keratinocyte survival. Exp Dermatol 2010, 19, 1073-1079. [CrossRef]
- Carsberg, C.J.; Jones, K.T.; Sharpe, G.R.; Friedmann, P.S. Intracellular calcium modulates the responses of human melanocytes to melanogenic stimuli. J Dermatol Sci 1995, 9, 157-164. [CrossRef]
- Fuller, B.B. Inhibition of tyrosinase activity and protein synthesis in melanoma cells by calcium ionophore A23187. Pigment Cell Res 1987, 1, 176-180. [CrossRef]
- Ahuja, K.; Raju, S.; Dahiya, S.; Motiani, R.K. ROS and calcium signaling are critical determinant of skin pigmentation. Cell Calcium 2025, 125, 102987. [CrossRef]
- Buffey, J.A.; Edgecombe, M.; Mac Neil, S. Calcium plays a complex role in the regulation of melanogenesis in murine B16 melanoma cells. Pigment Cell Res 1993, 6, 385-393. [CrossRef]
- Bellono, N.W.; Oancea, E.V. Ion transport in pigmentation. Arch Biochem Biophys 2014, 563, 35-41. [CrossRef]
- Regazzetti, C.; Sormani, L.; Debayle, D.; Bernerd, F.; Tulic, M.K.; De Donatis, G.M.; Chignon-Sicard, B.; Rocchi, S.; Passeron, T. Melanocytes Sense Blue Light and Regulate Pigmentation through Opsin-3. J Invest Dermatol 2018, 138, 171-178. [CrossRef]
- Stanisz, H.; Stark, A.; Kilch, T.; Schwarz, E.C.; Müller, C.S.; Peinelt, C.; Hoth, M.; Niemeyer, B.A.; Vogt, T.; Bogeski, I. ORAI1 Ca(2+) channels control endothelin-1-induced mitogenesis and melanogenesis in primary human melanocytes. J Invest Dermatol 2012, 132, 1443-1451. [CrossRef]
- Lee, D.U.; Weon, K.Y.; Nam, D.Y.; Nam, J.H.; Kim, W.K. Skin protective effect of guava leaves against UV-induced melanogenesis via inhibition of ORAI1 channel and tyrosinase activity. Exp Dermatol 2016, 25, 977-982. [CrossRef]
- Nam, J.H.; Lee, D.U. Foeniculum vulgare extract and its constituent, trans-anethole, inhibit UV-induced melanogenesis via ORAI1 channel inhibition. J Dermatol Sci 2016, 84, 305-313. [CrossRef]
- Motiani, R.K.; Tanwar, J.; Raja, D.A.; Vashisht, A.; Khanna, S.; Sharma, S.; Srivastava, S.; Sivasubbu, S.; Natarajan, V.T.; Gokhale, R.S. STIM1 activation of adenylyl cyclase 6 connects Ca(2+) and cAMP signaling during melanogenesis. Embo j 2018, 37,. [CrossRef]
- Choi, M.R.; Lee, H.; Kim, H.K.; Han, J.; Seol, J.E.; Vasileva, E.A.; Mishchenko, N.P.; Fedoreyev, S.A.; Stonik, V.A.; Ju, W.S.; et al. Echinochrome A Inhibits Melanogenesis in B16F10 Cells by Downregulating CREB Signaling. Mar Drugs 2022, 20,. [CrossRef]
- Kim, S.E.; Chung, E.D.S.; Vasileva, E.A.; Mishchenko, N.P.; Fedoreyev, S.A.; Stonik, V.A.; Kim, H.K.; Nam, J.H.; Kim, S.J. Multiple Effects of Echinochrome A on Selected Ion Channels Implicated in Skin Physiology. Mar Drugs 2023, 21,. [CrossRef]
- Deri, B.; Kanteev, M.; Goldfeder, M.; Lecina, D.; Guallar, V.; Adir, N.; Fishman, A. The unravelling of the complex pattern of tyrosinase inhibition. Sci Rep 2016, 6, 34993. [CrossRef]
Figure 1.
Histamine induces melanin production in melanocytes. (A) Cell viability was assessed over 72 hours following treatment with increasing concentrations of histamine (0-100 μM) in B16F10 cells. Cell density was measured by optical density (OD) and normalized to the value of day 0. (B) Representative images showing B16F10 pellets treated with histamine (0-30 μM) for 48 hours. (C) Quantification of melanin content normalized to total protein in B16F10 cells. Data are expressed as fold change relative to untreated control (0 μM). (D) Representative images of NHEM pellets showing melanin accumulation at indicated time points (days 0, 2, 4, 6, and 8) in the absence (0 μM) or presence (10 μM) of histamine. (E) Quantification of melanin content normalized to total protein over the 8-day culture period in NHEMs. Data are expressed as fold change relative to control at day 0. Data are presented as mean ± SD from three independent experiments. One-way analysis of variance (ANOVA), followed by Dunnett’s post-hoc test, was used for multiple comparisons. *p < 0.05, ***p < 0.001, ns: not significant.
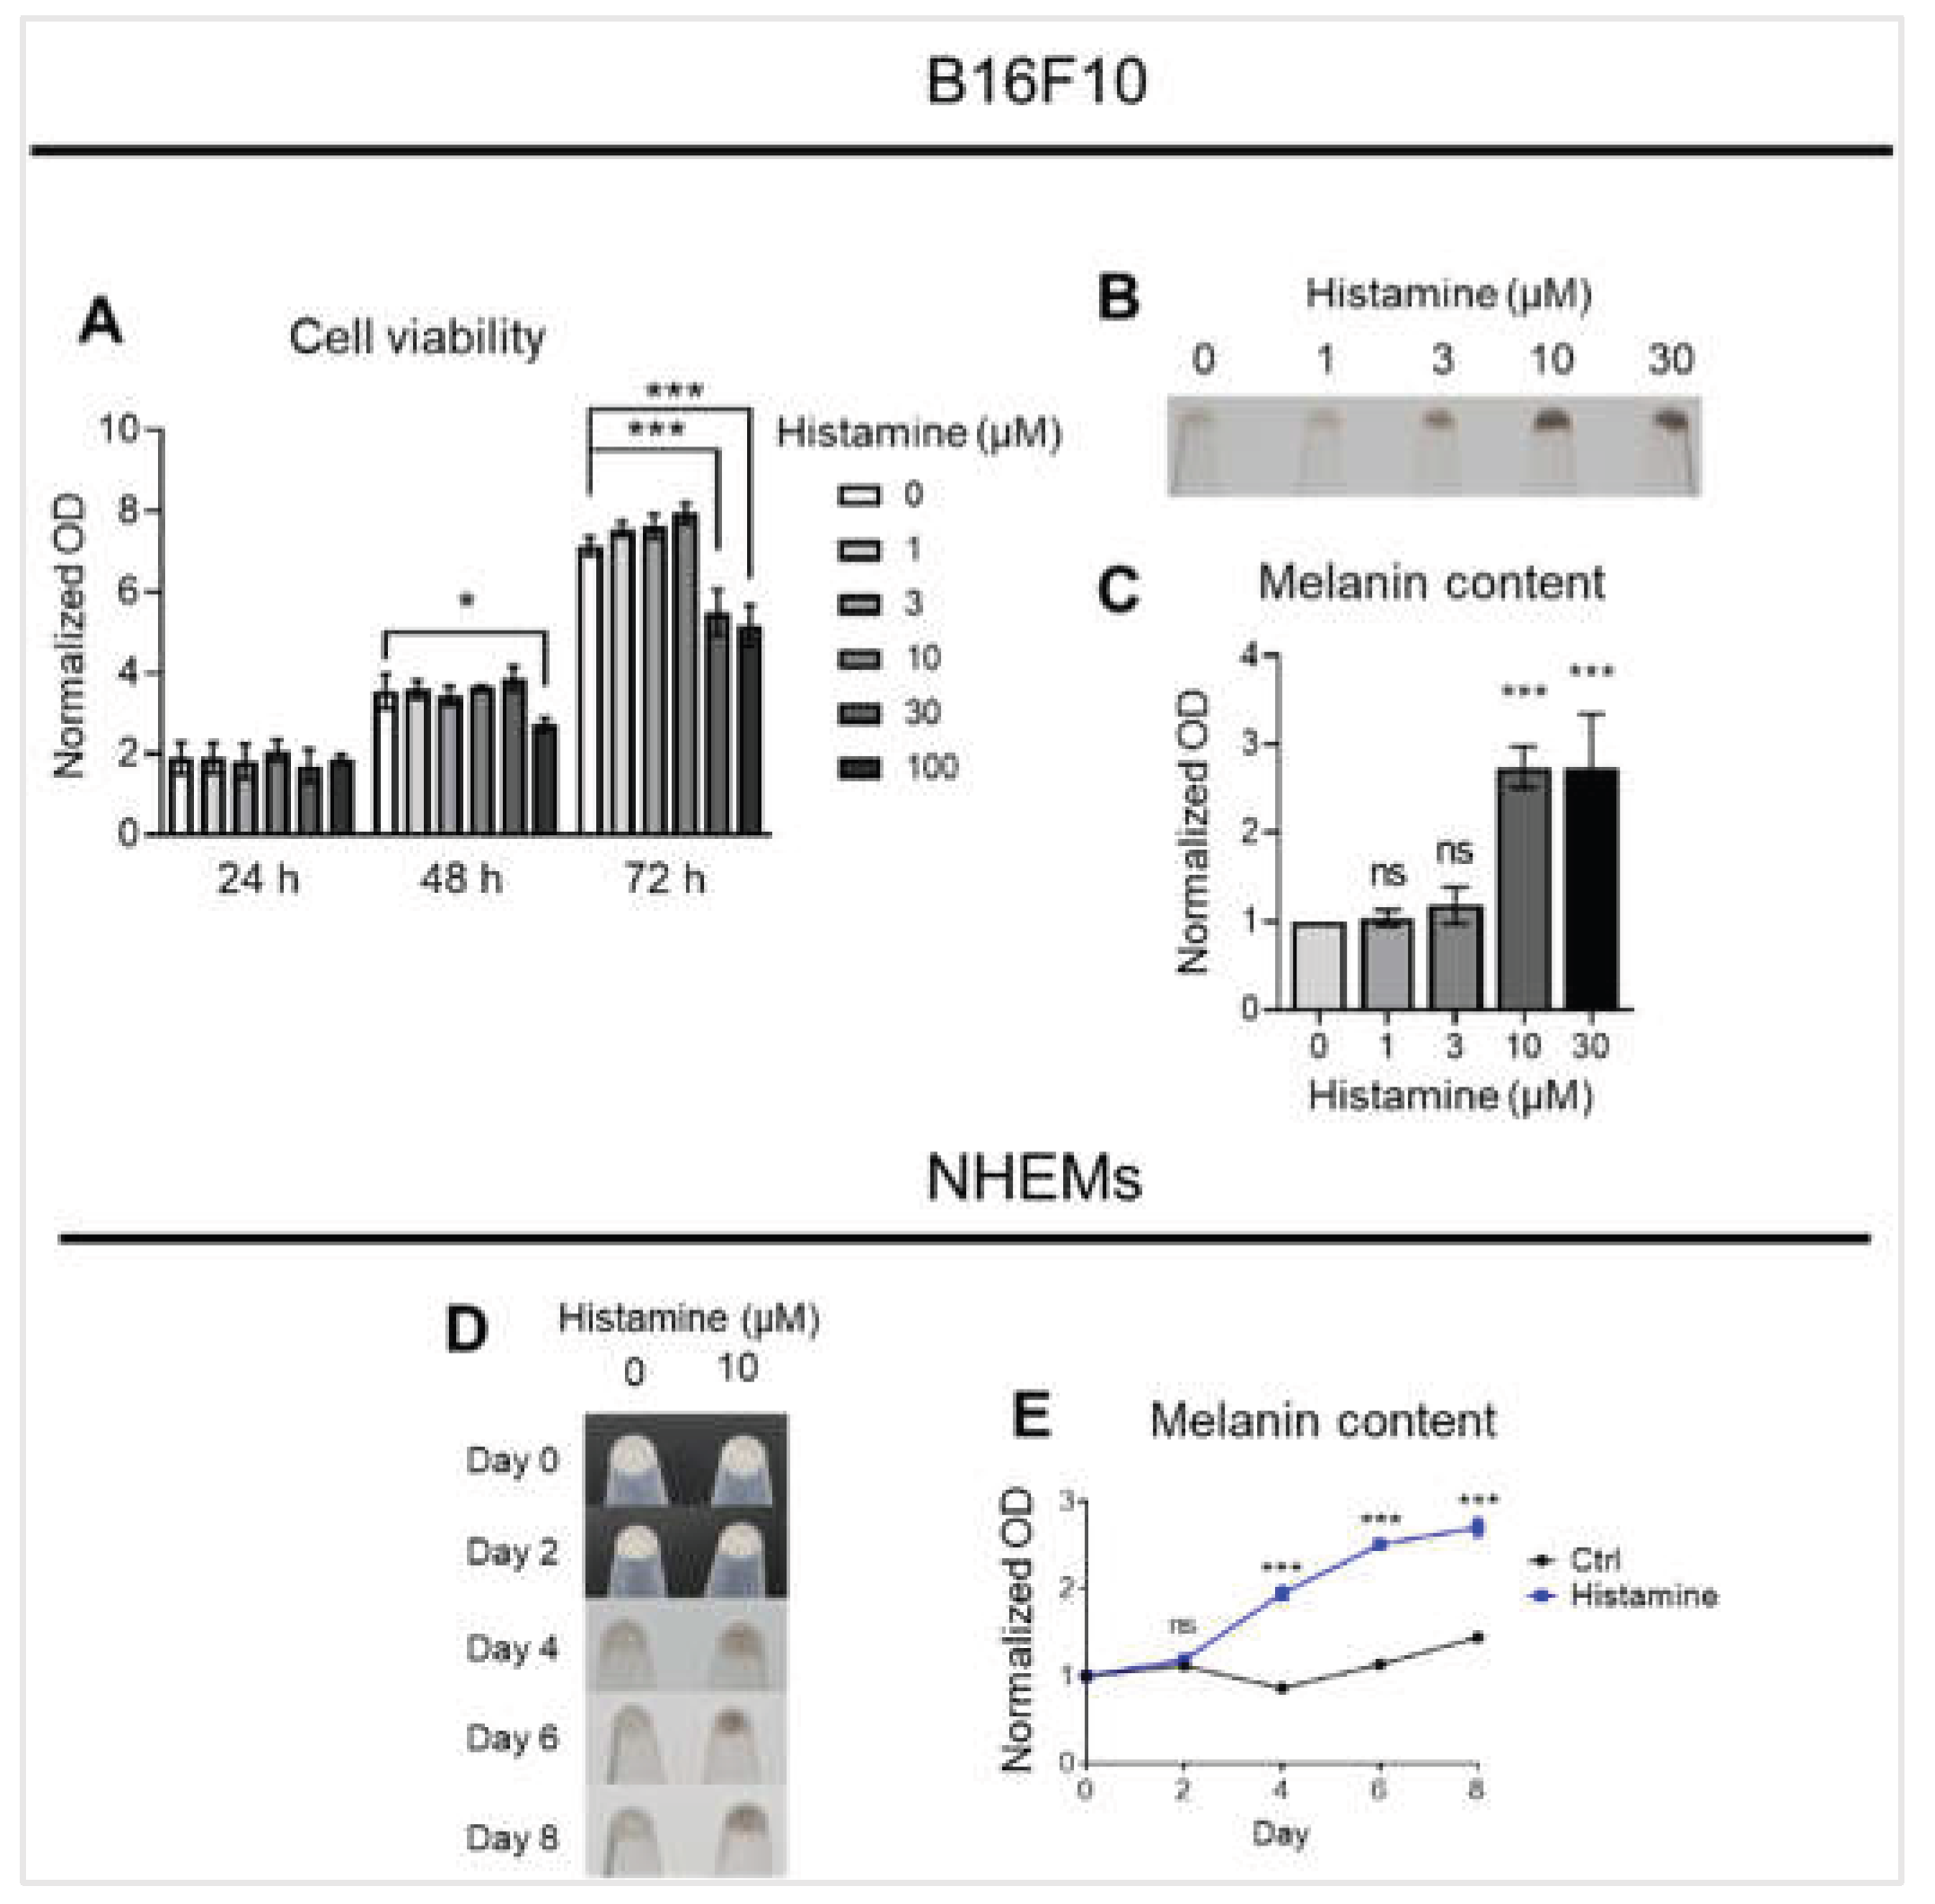
Figure 2.
Histamine induces melanogenesis in melanocytes through histamine H2 receptors. (A) Representative images showing B16F10 pellets (upper) and quantification of melanin content normalized to total protein (lower). Cells were treated with vehicle control (Ctrl), histamine (His, 10 μM), or histamine in combination with selective histamine receptor antagonists: pyrilamine (H1 antagonist, 10 μM), famotidine (H2 antagonist, 10 μM), or thioperamide (H3 antagonist, 10 μM) for 48 hours. Data are expressed as fold change relative to vehicle control. (B) Representative images showing NHEM pellets (upper) and quantification of melanin content normalized to total protein (lower). Cells were treated with vehicle control (Ctrl), histamine (His, 10 μM), or histamine in combination with pyrilamine (10 μM), famotidine (10 μM), or thioperamide (10 μM) for 6 days. Data are expressed as fold change relative to vehicle control. Data are presented as mean ± SD from three independent experiments. One-way analysis of variance (ANOVA), followed by Dunnett's post-hoc test, was used for multiple comparisons. *p < 0.05, **p < 0.01, ***p < 0.001, ns: not significant.
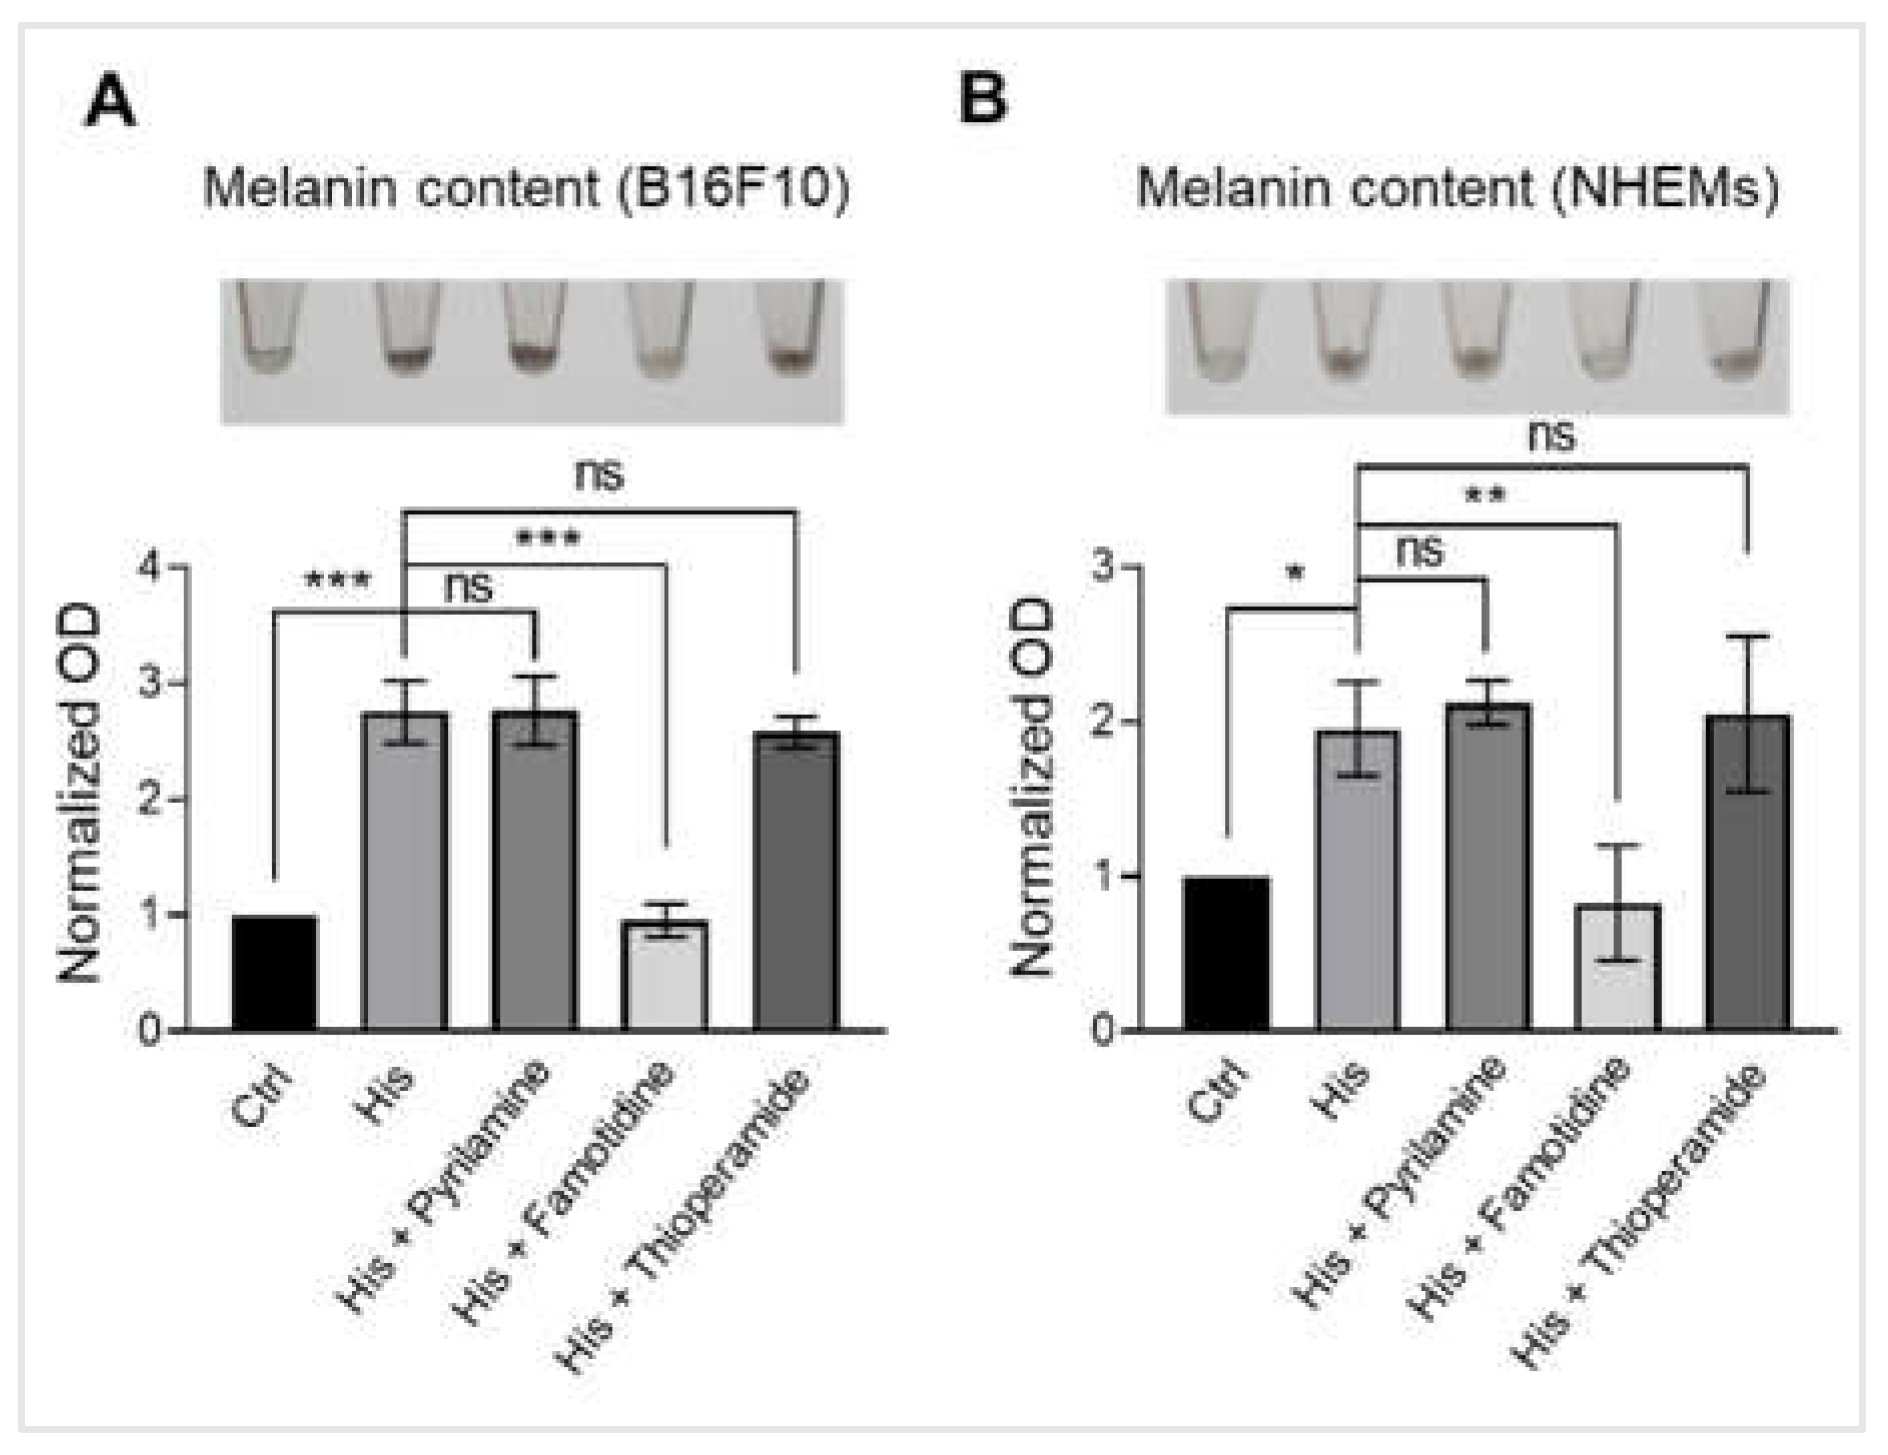
Figure 3.
Histamine enhances store-operated calcium entry (SOCE) in melanocytes. (A) Representative trace (left) and averaged peak value (right) of cytosolic Ca²⁺ levels in response to increasing concentrations of histamine (1, 3, 10, 30, and 100 μM) in the presence of extracellular calcium (1.3 mM Ca²⁺) in B16F10 cells (n = 24 cells). (B) Representative trace (left) and averaged peak value (right) of cytosolic Ca²⁺ levels in response to increasing concentrations of histamine (1, 3, 10, 30, and 100 μM) in the presence of extracellular calcium (1.3 mM Ca²⁺) in NHEMs (n = 24 cells). (C) Representative traces (left) show SOCE in B16F10 cells pretreated with vehicle control (Ctrl, black trace, n = 29 cells) or histamine (His, 10 μM, blue trace, n = 16 cells) for 48 hours. Thapsigargin (Tg, 1 μM) was applied in the absence of extracellular calcium (0 Ca²⁺) to deplete intracellular Ca²⁺ stores, followed by the presence of extracellular calcium (1.3 mM Ca²⁺) to measure SOCE. Quantitative SOCE amplitude (ΔF340/F380) (right) shows the change in cytosolic calcium level before and after the presence of extracellular calcium. (D) Representative traces show SOCE in NHEMs pretreated with vehicle control (Ctrl, left, n = 19 cells) or histamine (His, 10 μM, n = 18 cells) (middle) for 6 days. Tg (1 μM) was applied in the absence of extracellular calcium (0 Ca²⁺), followed by the presence of extracellular calcium (1.3 mM Ca²⁺). Quantitative SOCE amplitude (ΔF340/F380) (right) shows the change in cytosolic calcium level before and after the presence of extracellular calcium. Data are presented as mean ± SD. One-way analysis of variance (ANOVA), followed by Dunnett's post-hoc test, was used for multiple comparisons. Student's t-test was used for comparison between two groups. **p< 0.01, ***p < 0.001, ns: not significant.
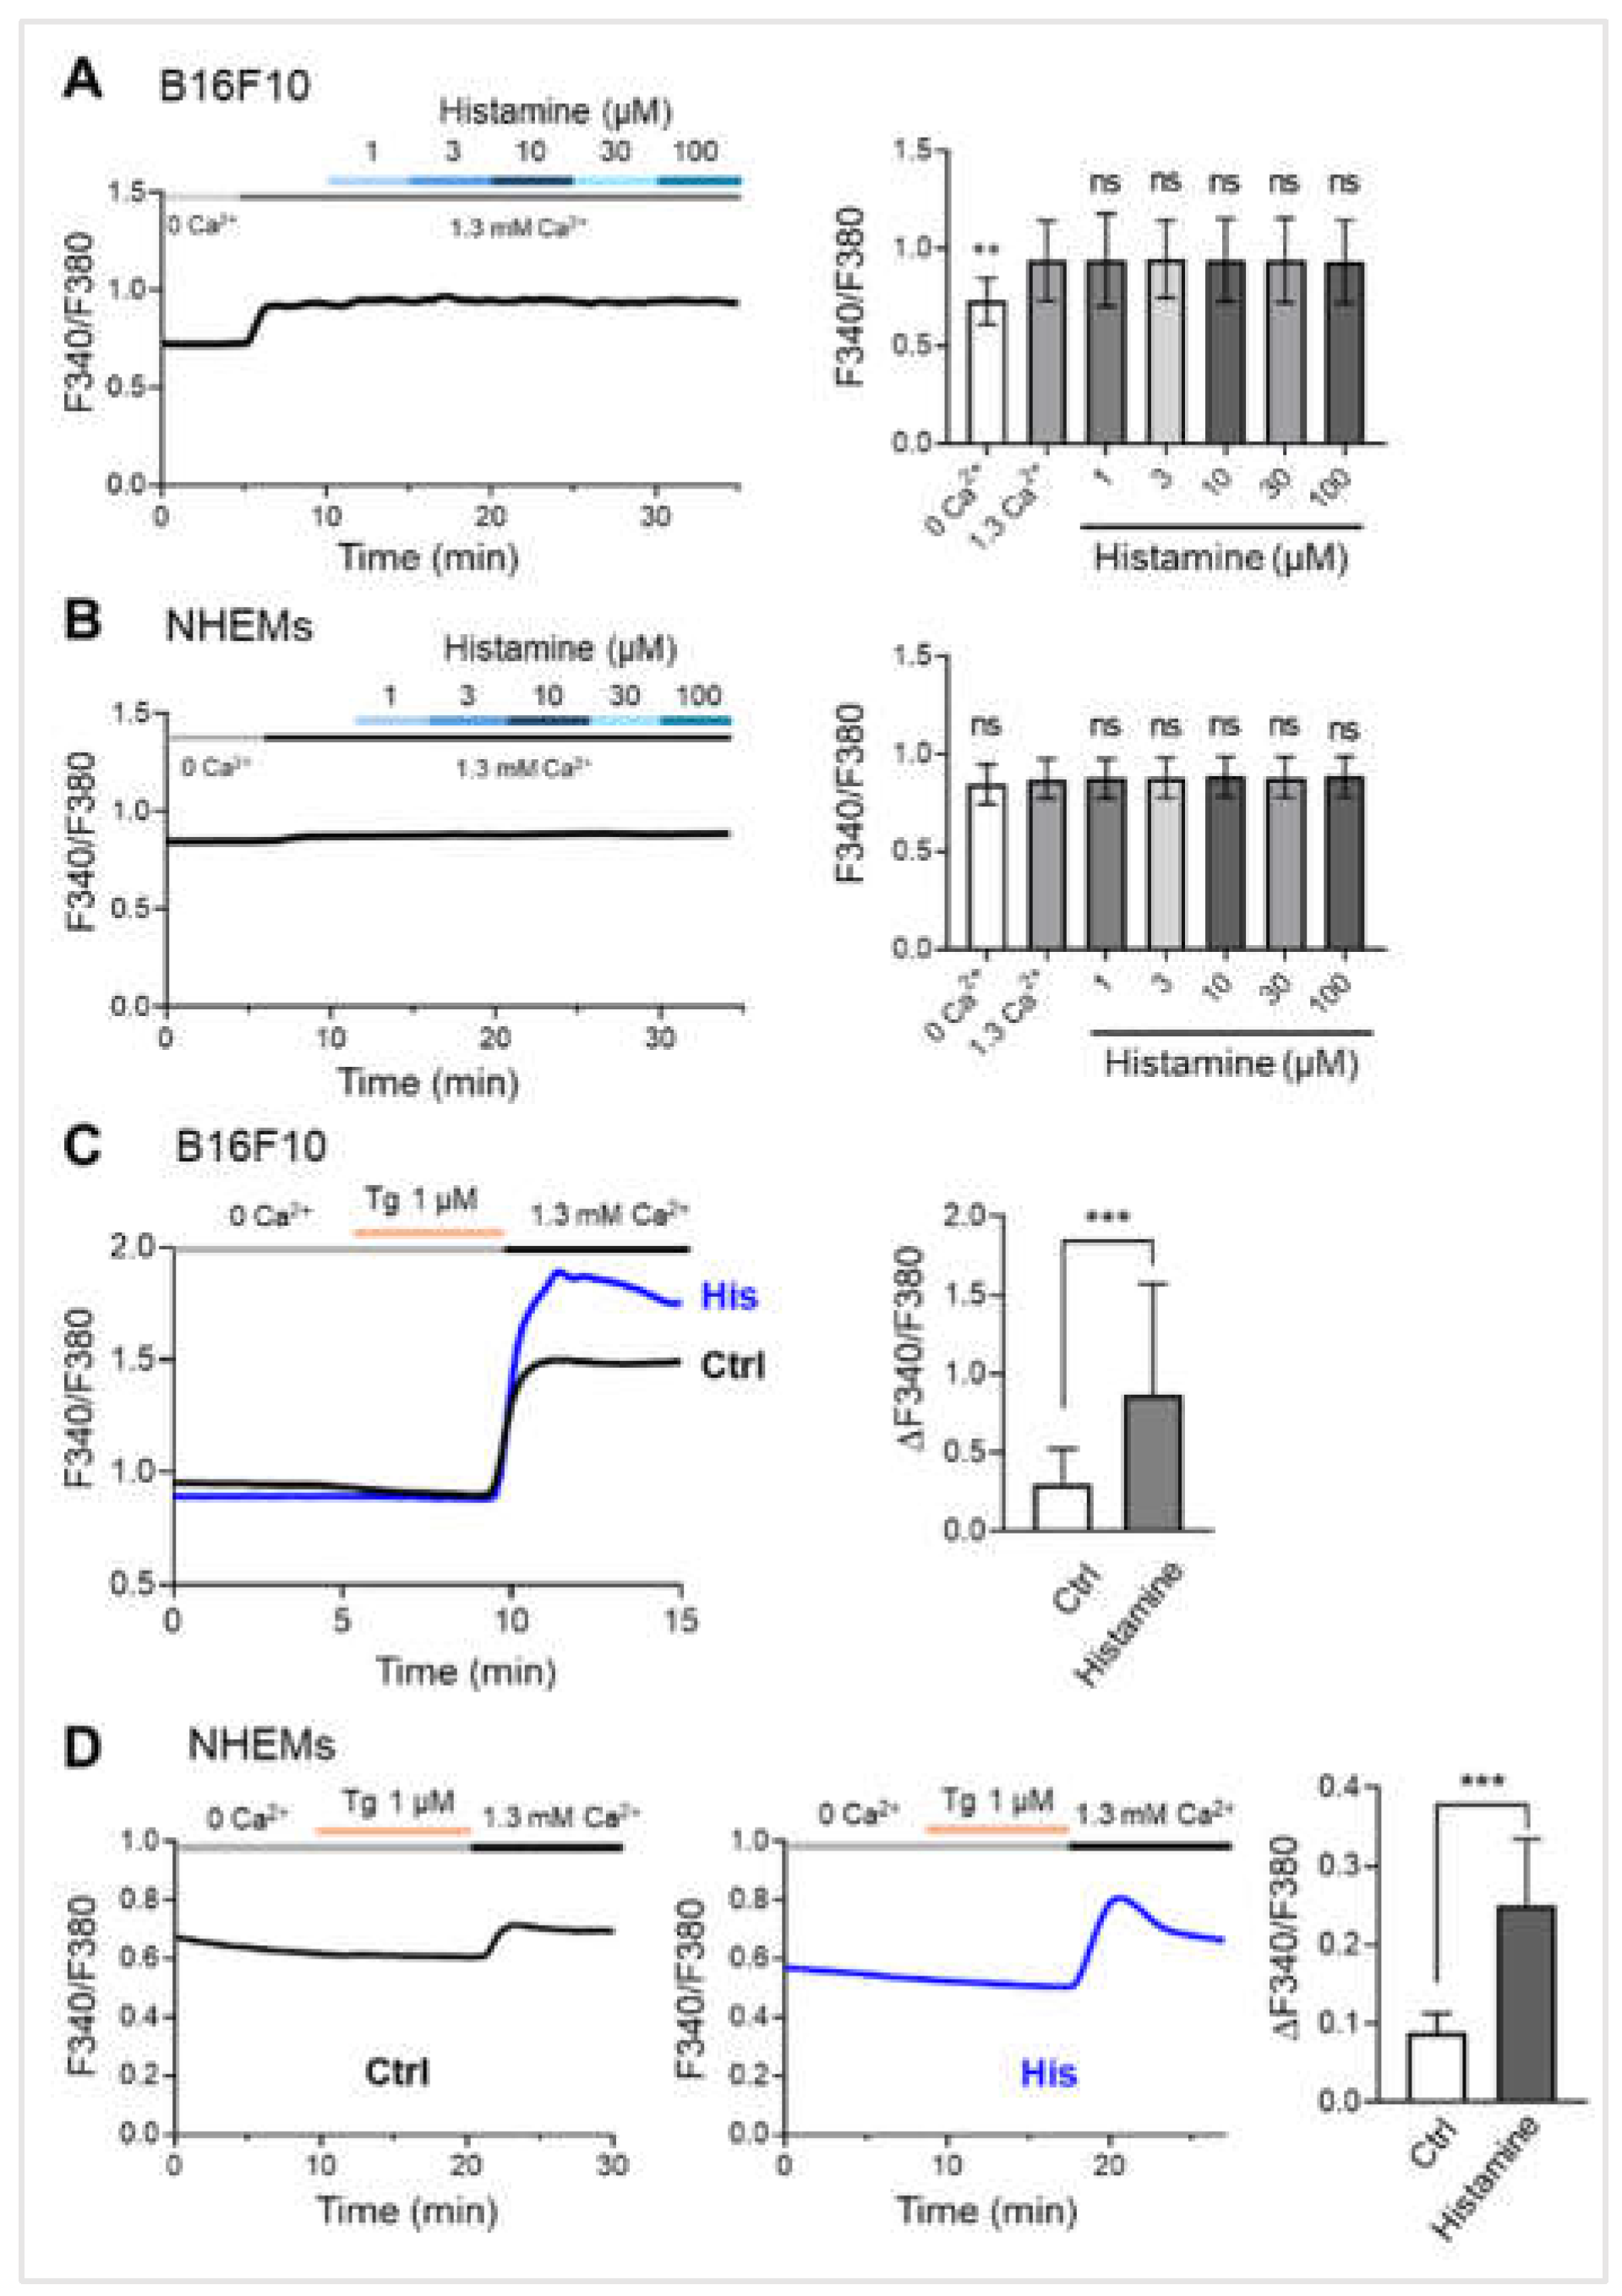
Figure 4.
Intracellular calcium is required for histamine-induced melanogenesis. (A) Representative images showing B16F10 pellets (upper) and quantification of melanin content normalized to total protein (lower). Cells were treated with vehicle control (Ctrl), histamine (His, 10 μM), histamine and BAPTA-AM (intracellular calcium chelator, 10 μM) or Kojic acid (tyrosynase inhibitor, 50 μM) for 48 hours. Data are expressed as fold change relative to vehicle control. (B) Representative images showing NHEM pellets (upper) and quantification of melanin content normalized to total protein (lower). Cells were treated with vehicle control (Ctrl), histamine (His, 10 μM), histamine and BAPTA-AM (10 μM), or KA (50 μM) for 6 days. Data are expressed as fold change relative to vehicle control. Data are presented as mean ± SD from three independent experiments. One-way analysis of variance (ANOVA), followed by Dunnett's post-hoc test, was used for multiple comparisons. ***p < 0.001.
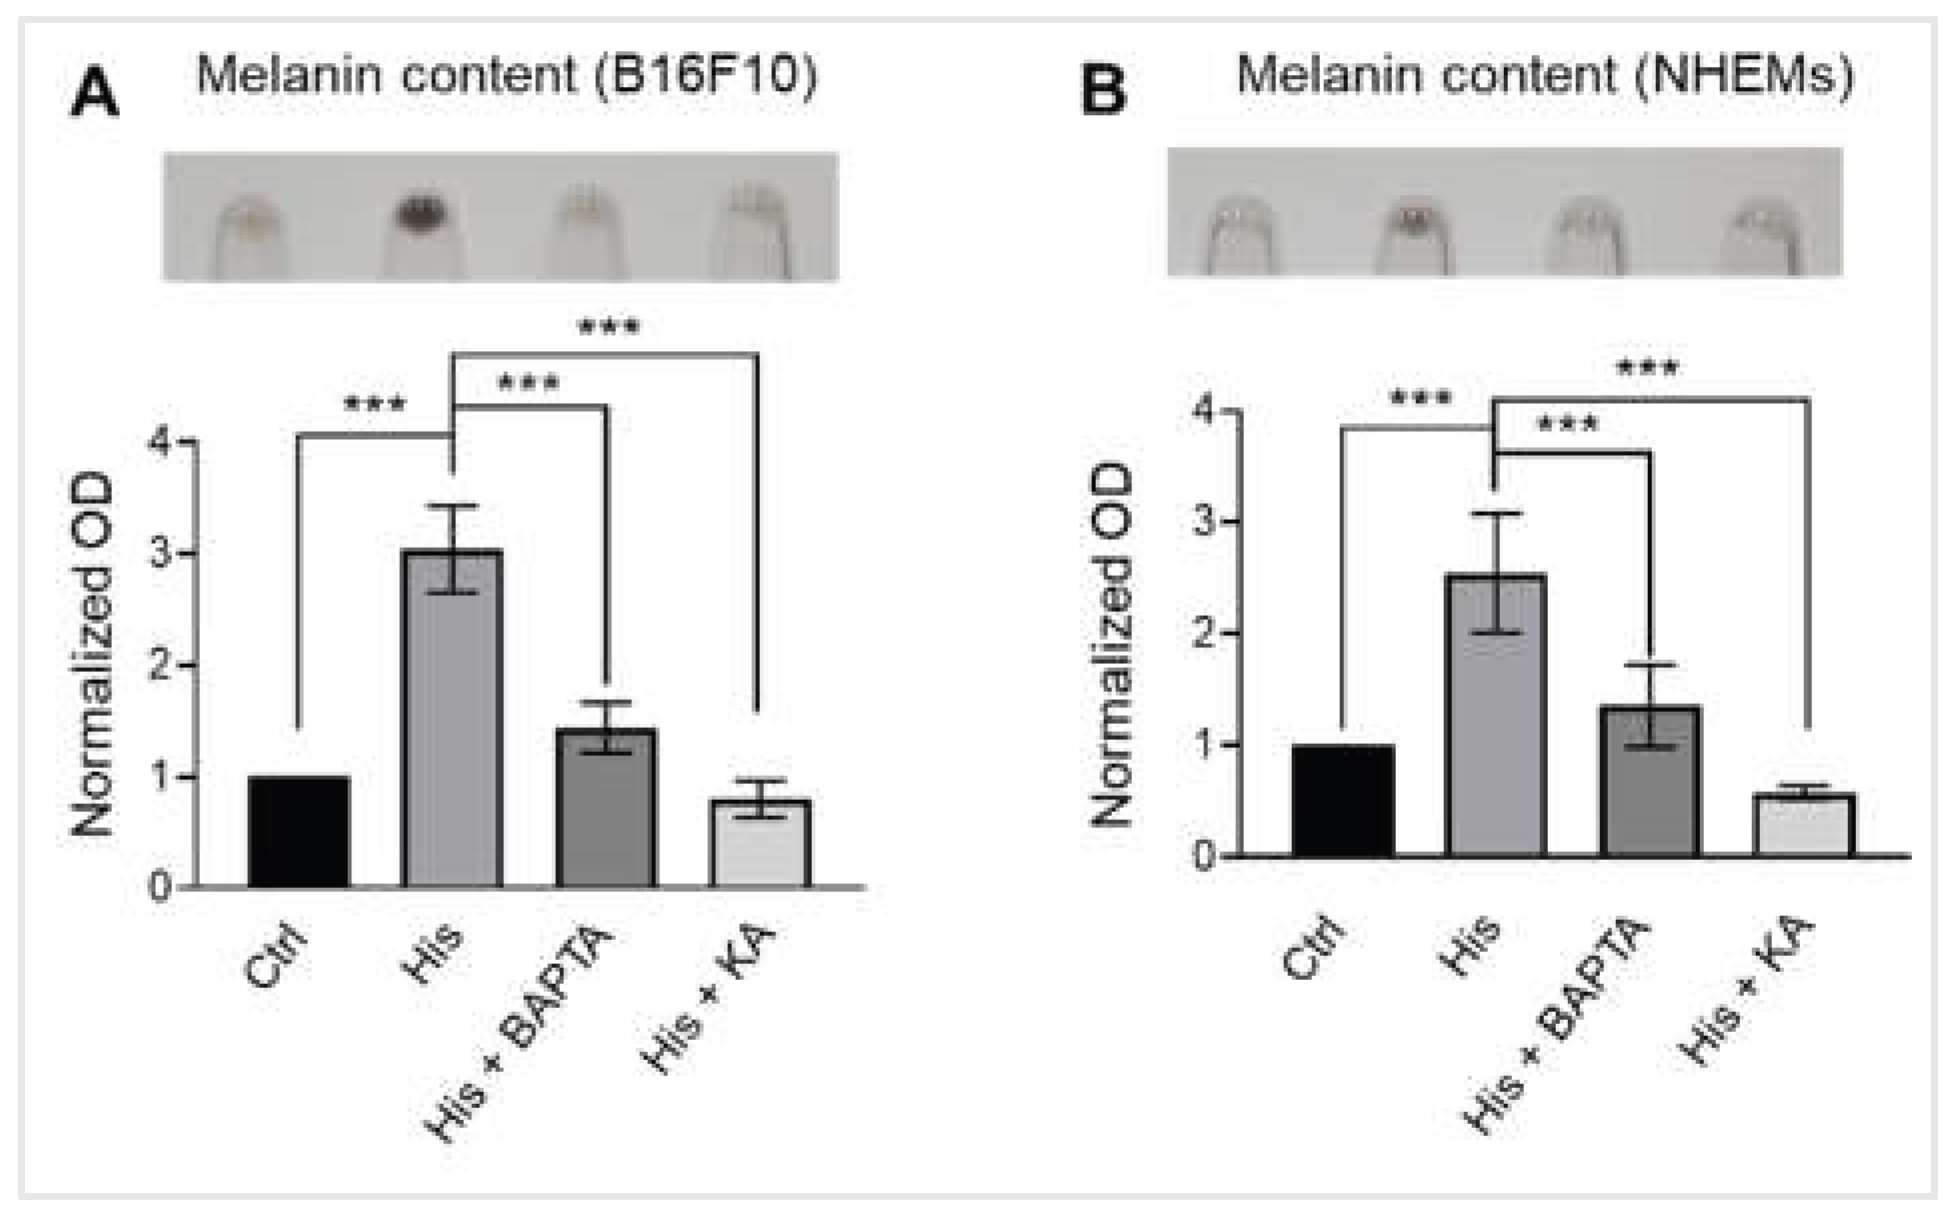
Figure 5.
ORAI1 and STIM1 are the essential molecular components of store-operated calcium entry (SOCE) in melanocytes. (A-F) Representative traces showing SOCE in NHEMs. Cells were transfected with siRNAs targeting ORAI1 (siORAI1, n = 36), ORAI2 (siORAI2, n = 21), ORAI3 (siORAI3, n = 27), STIM1 (siSTIM1, n = 37), or STIM2 (siSTIM2, n = 24) for 6 days. Thapsigargin (Tg, 1 μM) was applied in the absence of extracellular calcium (0 Ca²⁺) to deplete intracellular Ca²⁺ stores, followed by the presence of extracellular calcium (1.3 mM Ca²⁺) to measure SOCE. (G) Quantitative SOCE amplitude (ΔF340/F380) shows the change in cytosolic calcium level before and after the presence of extracellular calcium. Data are presented as mean ± SD. One-way analysis of variance (ANOVA), followed by Dunnett's post-hoc test, was used for multiple comparisons. ***p < 0.001, ns: not significant.
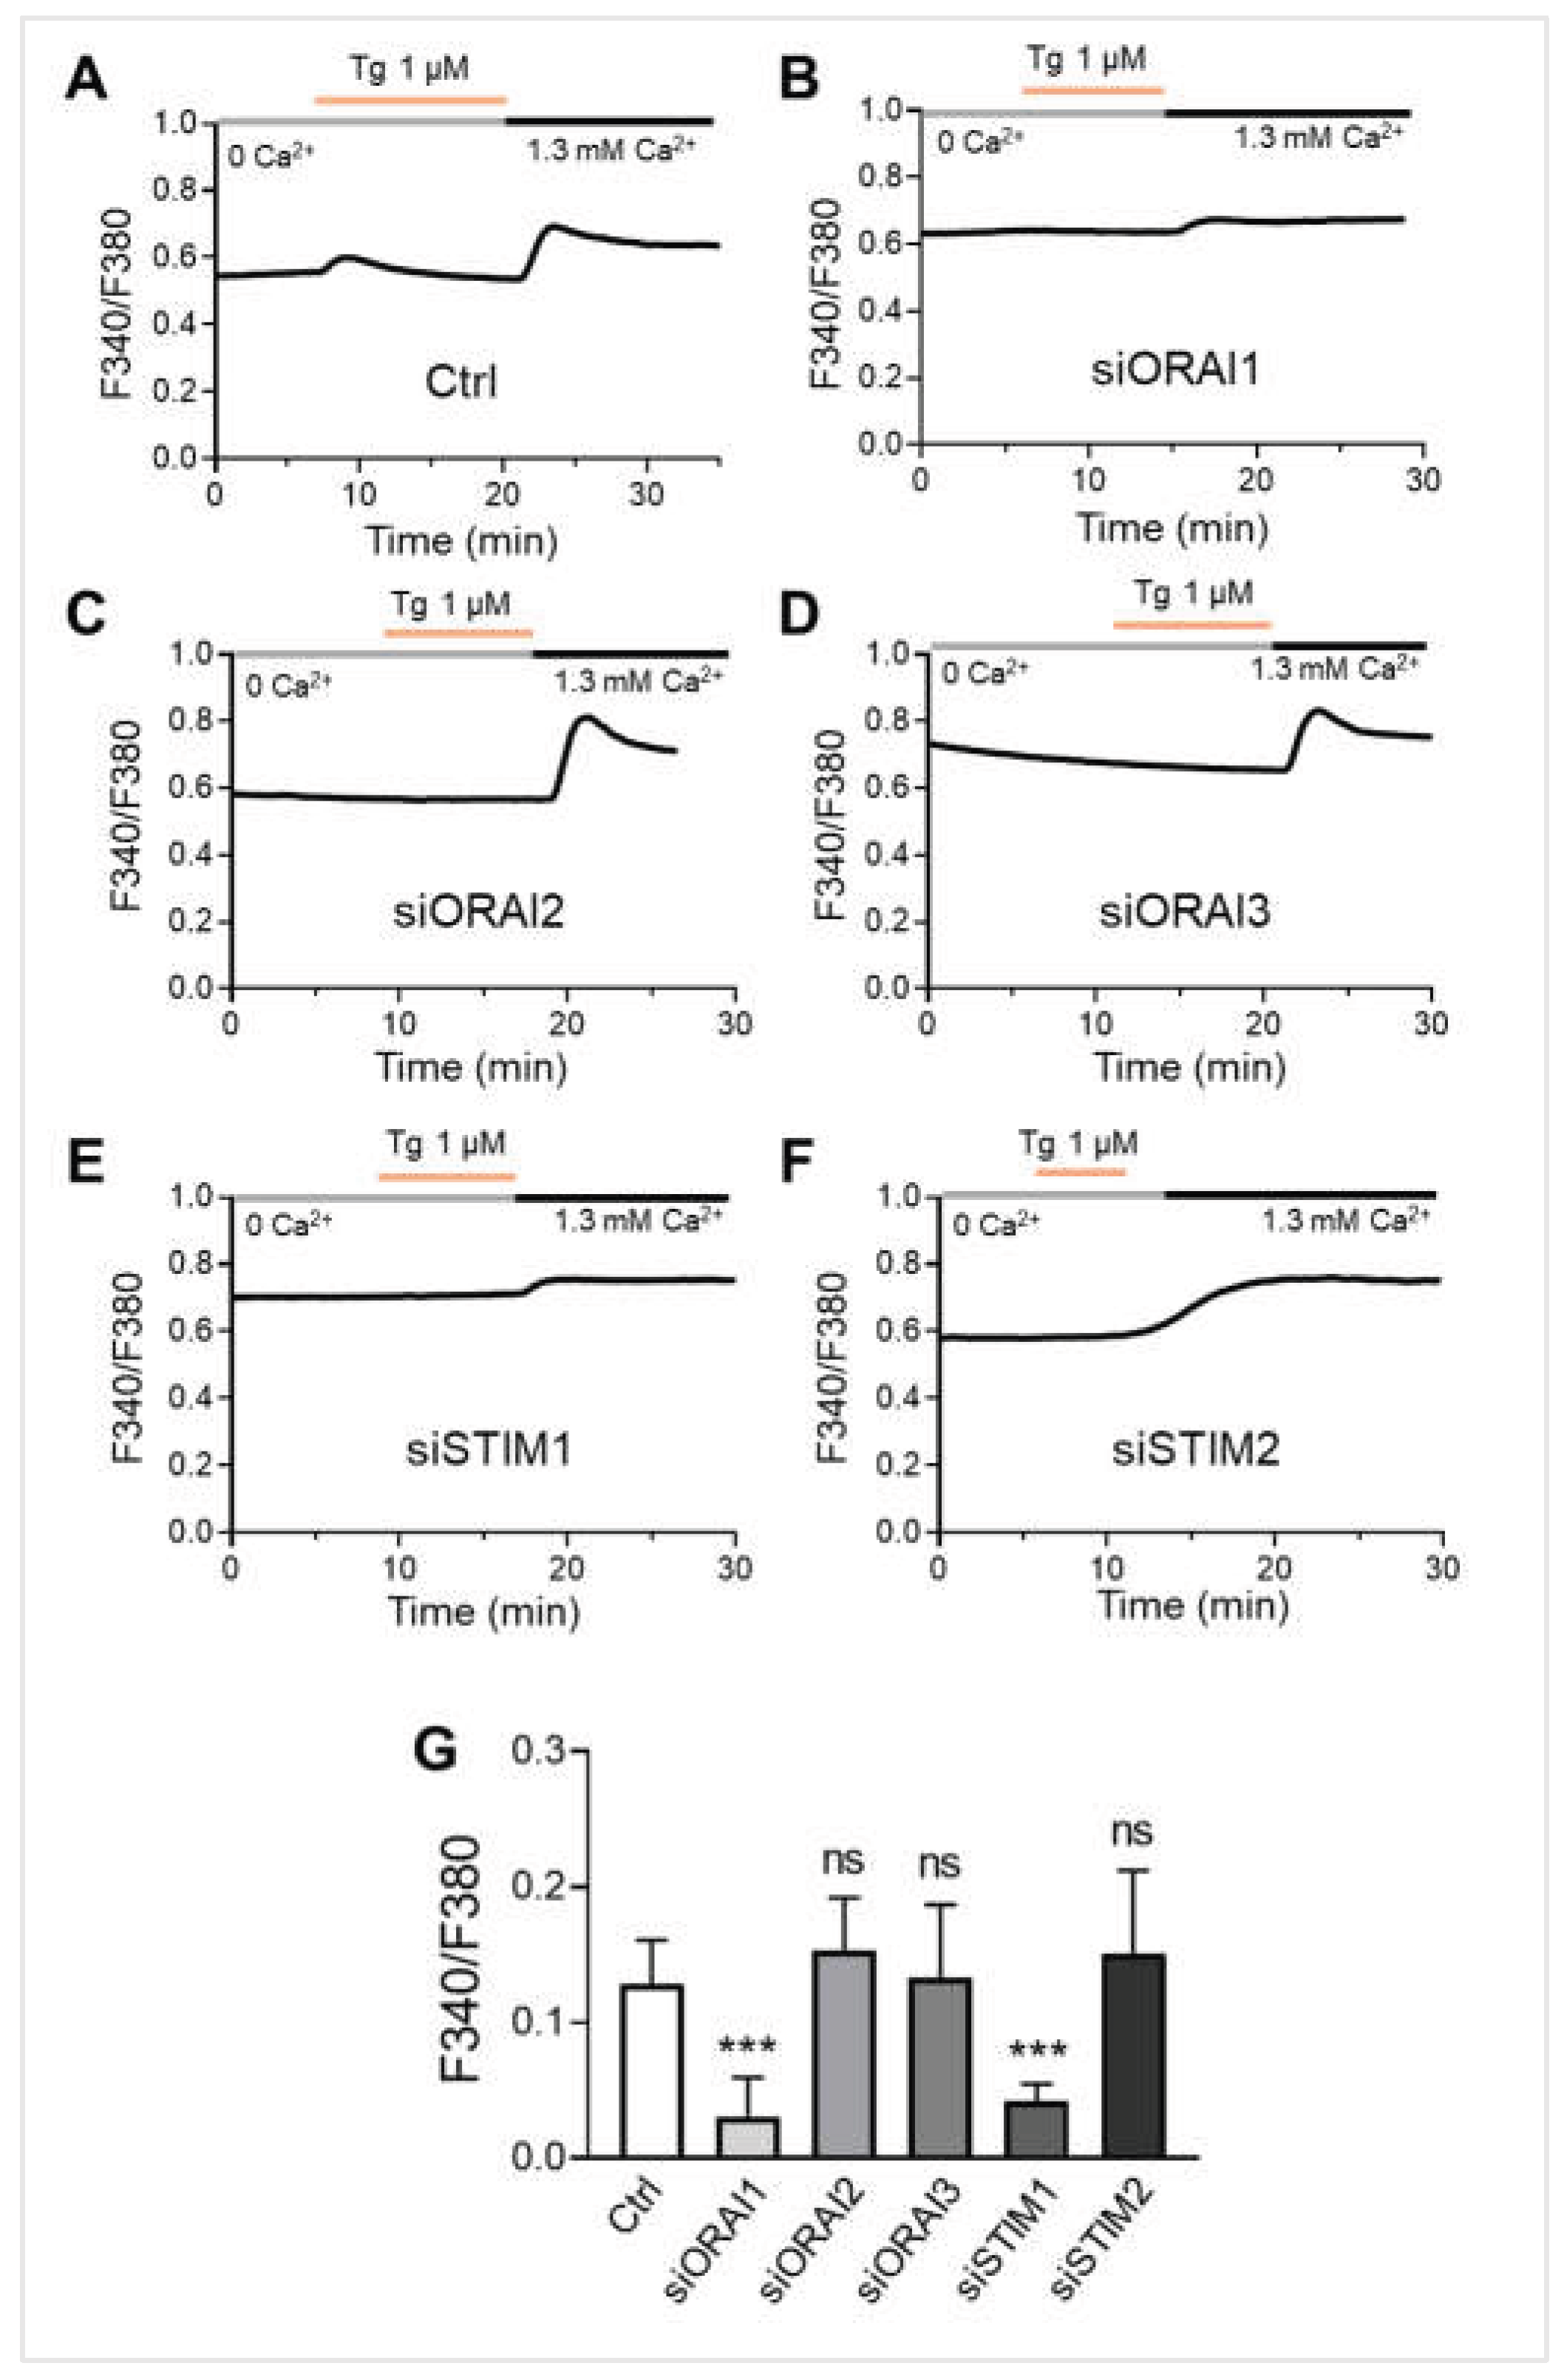
Figure 6.
Histamine-induced melanogenesis is specifically mediated through the ORAI1-STIM1 dependent SOCE pathway. (A) Representative images showing B16F10 pellets (upper) and quantification of melanin content normalized to total protein (lower). Cells were treated with vehicle control (Ctrl), histamine (His, 10 μM), histamine and BTP-2 (CRAC channel inhibitor, 5 μM), Synta-66 (ORAI1 inhibitor, 10 μM), or Kojic acid (KA, tyrosinase inhibitor, 50 μM) for 48 hours. Data are expressed as fold change relative to vehicle control. (B) Representative images of NHEM pellets (upper) and quantification of melanin content normalized to total protein (lower). Cells were treated with vehicle control (Ctrl), histamine (His, 10 μM), histamine and BTP-2 (5 μM), Synta-66 (10 μM), or KA (50 μM) for 6 days. Data are expressed as fold change relative to vehicle control. (C) Representative images showing B16F10 pellets (upper) and quantification of melanin content normalized to total protein (lower). Cells were treated with histamine (His, 10 μM) and transfected with siRNAs targeting Orai1 (siOrai1), Orai2 (siOrai2), Orai3 (siOrai3), Stim (siStim1), or Stim2 (siStim2) for 48 hours. Data are expressed as fold change relative to vehicle control. (D) Representative images showing NHEM pellets (upper) and quantification of melanin content normalized to total protein (lower). Cells were treated with histamine (His, 10 μM) and transfected with siRNAs targeting ORAI1 (siORAI1), ORAI2 (siORAI2), ORAI3 (siORAI3), STIM1 (siSTIM1), or STIM2 (siSTIM2) for 6 days. Data are expressed as fold change relative to vehicle control. Data are presented as mean ± SD from three independent experiments. One-way analysis of variance (ANOVA), followed by Dunnett's post-hoc test, was used for multiple comparisons. ***p < 0.001, ns: not significant.
Disclaimer/Publisher’s Note: The statements, opinions and data contained in all publications are solely those of the individual author(s) and contributor(s) and not of MDPI and/or the editor(s). MDPI and/or the editor(s) disclaim responsibility for any injury to people or property resulting from any ideas, methods, instructions or products referred to in the content. |
© 2026 by the authors. Licensee MDPI, Basel, Switzerland. This article is an open access article distributed under the terms and conditions of the Creative Commons Attribution (CC BY) license.
Copyright: This open access article is published under a Creative Commons CC BY 4.0 license, which permit the free download, distribution, and reuse, provided that the author and preprint are cited in any reuse.


