
Submitted:
31 December 2025
Posted:
01 January 2026
You are already at the latest version
Abstract
Fruits are an integral part of our diet. Various types of proteins and vitamins are obtained through fruits. Apple is a major fruit that is consumed globally. This is a multipurpose fruit that is used in the preparation of various food products and also in medicines. Therefore, it is important to analyze its future prices. India is the largest producer of apples, thus it is very important to analyze the Apple prices of Indian agricultural markets. Machine learning and deep learning models have not been previously applied to this Indian dataset. Various time series models like Long Short-Term Memory (LSTM), SARIMA, and ETS are developed, but the performance of LSTM is much better compared to the other models, with the lowest error rates (MAE of 554.08, RMSE of 752.10, 191, and MAPE of 6.63 percent). Thus, the proposed study provides the solution to a real-life problem, which ultimately can be used for agriculture policy making and smart market strategies.
Keywords:
SARIMA
; ETS
; LSTM
; time-series data
1. Introduction
Agriculture is the major occupation for the people of India. There are significant differences between the state’s various markets in terms of the amount of land that can be farmed, the area planted with different crops, the availability of irrigation facilities, the use of agricultural inputs, and other factors. The multiple fruits grown in India are exported to countries worldwide. However, apple production is the most prominent in India [1]. Out of these, my dataset focuses on major marketing or trading states(like Uttar Pradesh, Punjab, Haryana, and Himachal Pradesh). The variation in Apple’s Price reflects market trends, arrival, and quantity over time. In simple words, we can say Apple’s Price behavior over time(forecasting). In this, we use historical Apple market data collected from the AGMARKNET database from the year to predict Apple’s future price, which contains information such as state, district, arrival time, reported date, quantity, and fruit name. By using statistical models like the SARIMA (Seasonal Autoregressive Integrated Moving Average) model, ETS (Error, Trend, Seasonality model), and deep learning LSTM (long Short-Term Memory network). These models cover Time Series Analysis and a deep learning approach for forecasting Apple’s Price across different states, which cover fluctuations, seasonal variations, and an LSTM focused on learn price changes over time. The prediction of prices was necessary for taking up policy measures [2]. This paper found that out of three models, SARIMA, ETS, and LSTM. Preliminary result shows that the LSTM model outperforms the ETS and SARIMA models with better forecasting of Apple’s Price in the Indian State. The result of this study can help or support farmers, traders, and marketing people in making data-driven decisions or forecasting. Statistical models like ETS, SARIMA, and deep learning models like LSTM are better for time series data in prediction and forecasting.
1.1. Problem Statement
In the Indian agriculture market, Apple prices keep changing because of seasonal variations, region, weather, market trends which make it difficult for farmers, traders and police makers, to predict future price of fruits because of this they sometimes face huge financial losses. So it is very necessary to forecast accuractely Apple prices within the India Market, such as:- Uttar Pradesh, Punjab, Haryana, and Himachal Pradesh. The main focus of this study is to determine which statistical model and deep learning model predict best Apple prices and give more accurate and reliable results. This paper compares three models, ETS, LSTM, and SARIMA, from which we find the best model for forecasting Apple prices in the Indian Market.
1.2. Contribution
The main contribution of this study is a Comparative Analysis of deep learning and statistical models in predicting Apple prices in the Indian Market.
1. Used AGMARKNET Apple’s price data from 2000 to 2025 for forecasting.
2. Used three distinct models, ETS, LSTM, and SARIMA and compared their accuracy measures like R2, MAR, and RMSE for finding the best model for the data.
3. This study explains how each models record seasonality, trends, and variations in apple prices from year to year.
4. This model demonstrates that LSTM model outperforms both ETS and SARIMA with accuracy value (R2=0.7886).
5. Forecasted next 5-years prices of apple(2026-2030) with LSTM, most accurate and reliable model which provide most impactful insights.
6. It offers valuable forecasting model for farmers, policy makers and traders through which they can predict apple prices, which is very useful in today’s markets.
2. Literature Review
The related work of apple price forecasting is shown in Table 1.

Table 1.
Summary of Studies on Apple and Fruit Price/Stock Forecasting
| SNo. | Citation (Author, Year) | Research Objective | Methodology | Data Used (Time Series Period) | Key Findings and Accuracy Level | Evaluation Metric |
|---|---|---|---|---|---|---|
| 1 | [5] | Predicting Apple Inc. Stock close price to compare Linear Regression and Random Forecast model. | Applied Random Forest and Linear Regression on Apple stock price; used 80% training 20% test. | Apple stock data(High, close, low, adjusted and volume from 01-2018-07-2023 (14,35 RECORDS) | LR outperformed RF with lowest (MAE=2.0988, MSE =7.9001,RMSE=2.8017). LR shows lower error values as compared to RF fails to capture fluctuations after 2023. | MAE, MSE, RMSE |
| 2 | [17] | To find which ML models can best to predict apple Inc. stock price using Technical Indicators. | Compared five ML models- Linear Regression, Random forest, KNN, Neural Network and Decision Tree. | Apple Inc. Stock data and 23 Technical Indicators( Yahoo Finance, Trading View) over 5 years. | Neural Network performs best with average = 0.90% , lowest = 0.74%.Random Forest overfitted.LR close. Simpler models with fewer indicators worked better. | Percent Error, MAPE |
| 3 | [12] | Comparative Analysis of Support Vector Regression and Linear Regression Models to Predict Apple Inc. Share Prices with hyperparameter tunning. | Data Prep-> normalization->train/test split-> Grid-Search and 5-fold CV to optimize SVR and Linear Regression. | Daily Apple Stock historical data (2018- 2023), variables: Data, high, low, close, volume; focus on date & Close. | Linear Regression outperformed best (Intercept= True); RMSE=0.931231, MSE=0.879372; SVR RMSE=0.945622, MSE=0.907957. | RMSE and MSE |
| 4 | [10] | Ragi price prediction in karnataka using deep learning techniques | VAR, LSTM, GRU, 1D CNN and VAR_Stacked_LSTM | Ragi prices from 2010-2019 collected from AGMARKNET | VAR_Stacked_LSTM perform well with minimum MAPE | AIC, BIC, MAPE |
| 5 | [9] | To predict future stock prices using a deep learning model (Bi-Directional LSTM) that can learn patterns in both forward and backward time directions. | Used Bi-LSTM neural network architecture with two LSTM layers (forward + backward) and a Dense output layer. Data was normalized using MinMaxScaler, split 80% for training and 20% for testing. Model trained with Adam optimizer, batch size 64, for 100 epochs. | Daily closing prices of Apple Inc. from Jan 1, 2010 – Dec 31, 2020 (total 2769 data points). | Bi-LSTM captured both short-term and long-term stock price trends. Achieved low error (). Model accurately predicted trends but struggled with sudden market changes. | Mean Squared Error (MSE) |
| 6 | [8] | Predicting Apple’s Stock price based on Machine Learning using LSTM and ARIMA model | Preprocessed data separately input into ARIMA and LSTM networks.Scale the data using "MinMaxScaler". | Closing price of Apple’s Stock data from 1980 to 2021 extracted from Yahoo Finance total (10,468) data points | LSTM model outperforms the ARIMA model for long-term overall predictions with lowest () | Mean Squared Error (MSE),Mean Absolute Error(MAE), Root Mean Squared Error(RMSE) |
| 7 | [7] | Compared models (MLP, DAN2 and GARCH) for forecasting NASDAQ stock exchange index. | MLP, GARCH-MLP,DN2 , GARCH-DN2 models compared.MLP and DAN2 used 4 days inputs. Hybrid models used NeuroSolutions 5.06 software and excel. | Daily Stock exchange rates of NASDAQ from Oct 7, 2008- June 26, 2009 used. 146 data points are used for training and 36 data points for testing. | MLP outperforms DAN2 and GARCH-MLP with a small difference. MLP has the lowest (MSE, MAD, accurately forecasted first downward movements ±0.54%), hybrids underperformed. | MSE, MAD, MAD% (lowest value better) |
| 8 | [24] | Data-Driven analysis of climate impact on tomato and apple prices using machine learning models, time-delay | LSTM model with time-lag effects(0-180 days, SHAP for importance of each factor, price modelled nominal and real-term. | The daily environmental data, exchange volume data, and wholesale price data used from (01-12-2011 to 30-11-2023). Training data were (Dec 1, 2011 to Nov 30, 2020), 3 years for evaluation. Two fruits were used - apple and tomato. | Time-lags improved accuracy; for tomato nominal best NSE of 0.458(d=88), Tomato real-term 0.292 (d=53, volume significant), Apple real-term 0.140 (); cloud volume and amount are most important, apples less affected by volume. | NSE(Nash-Sutcliffe efficiency)-higher value is better for prediction, MAE for model training. |
| 9 | [21] | Forecasting apple prices for Solan market, Himachal Pradesh, using different time series and machine learning models. | Various time series models, ARIMA, ARCH-GARCH and RNN-LSTM were used. | Daily price data from AGMARKNET over the period 2012 to 2023 were used. | RNN-LSTM model performs well with lowest(RMSE, MAPE). ARIMA(6,1,1) and GARCH(1,1) were best-fitted models based on minimum Information Criteria. | RMSE, MAPE, AIC, HQC, AICC,SBC |
| 10 | [2] | Apple’s price forecasting of Solan Market, Himachal Pradesh using different time series models | ARIMA, HWMS, TDNN, Hybrid ARIMA-TDNN , RMSE | Apple’s Price data from JAN 2008 to DEC 2020 from Solan Market | Hybrid ARIMA -TDNN performs well with lowest RMSE = 19.78 | RMSE |
| 11 | [19] | Apple Price forecasting of fruit market in Jammu Kashmir | Polynomial Regression, CAGR(Compound Annual Growth Rate ), SMA, Seasonal index | The Data is derivated from AGMARK and National Horticulture Board between the timeline of 2003 to 2022 | Prices peaks in June, Compound Annudal Growth Rate is=8.75, Prediction for 2030 = ¤9,293/qtl | Seasonal Index, CAGR, R squared |
| 12 | [4] | Exploring the fluctuation of prices and anlyzing the factors affecting fluctuations in Hebei, China | Multiple regression model. | Data from E commerce site-Jingdong, taobao ( Dec-2017), and wholesale monthly data from Feb-2011 to October-2015 | Seasonal upward trend Higher in summer and lower in winter, Main factors like Variety Logistics, place. Goodness of fit of model is R = 0.853 | ANOVA, R, R-square, F, Significance, Co-integration test, t- Statistics |
| 13 | [25] | For the Forecast of prices using ensemble regression | Regression Models SVR, GPR, DTR(Decision Regression), GPR, RFR, Gradient Boosting (XGBoot) | Data collected from Indian Rainfall, Wholesale Price Index, crops; ragi, barley, wheat,paddy and maize. | Ensemble regression improved accuracy over individual models; XGBOOST lowest RMSE (1.86-11.39) | MAPE, MAE, R-Square, PE |
| 14 | [14] | Analyze apple price using SARIMA model | SARIMA model ARIMA(2,1,0) *ARIMA(1,1,0,12) | Apple data collected from Jan 1998 to Jul 2017 with 235 data points | Relative error approx. 2% close to ideal. | Relative error ( 2%), Normality of errors |
| 15 | [18] | Apple price prediction of Indonesian Market using SARIMA model | SARIMA(1,0,0) *(0,0,0,12) | Average apple price data from Indonesian market. 109 month taken from year 2018 | SARIMA performs best with AIC =-126.8965. MAPE shows error 99.47 which means model is not good for univariate analysis | MAPE,AIC |
| 16 | [13] | Advanced Mango classification and Price Prediction using deep learning techniques | EfficientBNet2 model and Tensor flow | labeled dataset of 2,000 images of mangoes of 8 varities. | Model performs well with 98% validation accuracy. Predicted varities with high probability(95-96%) | Precision, F1 Score, Accuracy, Recall |
| 17 | [3] | Sales prediction of fruits using linear regression model | Linear regression, Decision Tree,Neural Netwrok with L1 & L2 regularization | Sales data from 2021-2023 | Linear Regression performed well with accuracy=99.99% and R-square=0.9996 | Accuracy, RMSE, MSE, R-square |
| 18 | [26] | Forecasting fruit and vegetables prices using seasonal rainfall data | ML model for regression(LSTM, ANN, Decision Tree etc.) and calssification(KNN, Naïve-bayes,gradient boost, RF etc.) | Daily price data from Goa including five types fruits and vegetables and rainfall data from supplier region . | Random forest performs well with accuracy (R-square=0.99 and RMSE = 18.99) and DT in classification 99% accuracy. | Accuracy, Precision, F1-Score, MAE, RMSE, MSE, R-square error |
| 19 | [16] | Predict price of fruits, vegetables and pulses using trends in prior data. | ML Decision Tree, KNN, Random Forest, Neural Network | total dataset of 3100 including temp, humidity , ph of soil, rainfall , fruits , vegetables and pulses. | Decision tree works well gives accuracy 91.70% | RMSE, Accuracy |
| 20 | [15] | Crop forecasting and estimation to help farmers & Crop Yield Estimation and profitability analysis for Agriculture | Models like SVM, KNN, Decision tree, Naïve bayes fro crop prediction and for crop price estimation Random forest regressor, XG boosting regressor, Gradient Boosting Regressor | Data set with soil, weather and crop data of Tamil Nadu | Best model is XG Boosting Regressor with lowest MSE= 357. 61, RMSE= 18.91, MAE= 16.10 and highest R square = 0.977 | MSE, MAE, RMSE, R square, F1 Score, Accuracy, Precision, Recall |
| 21 | [27] | Predicting Agriculture commodities price using ensemble method | ARIMA , LSTM, ensemble ARIMA-LSTM algorithms were used for price prediction.Dataset is clean and processed using MATLAB | Data collected from FAMA, Malaysia: daily market price from 1st Jan 2018 to 5th April 2022 containing six commodity types with three prices types. | ensemble ARIMA-LSTM performed better | RMSE, MAPE |
| 22 | [6] | Forecasting price prediction of fruits and vegetables using RNN | Three RNN techniques were used LSTM , GRU and SimpleRNN | dataset of historical prices of fruits and vegetables from websites. | LSTM performs well with lowest RMSE= 8.10, MAE=3.34, MSE= 65.659 with highest R square =0.993 as compared to GRU and Simple RNN. | RMSE, MAE, MSE, R2 |
| 23 | [23] | To estimate cost and fruit weight prediction using image based deep learning | Based on YOLOv9 CNN for image- based detection | Image based dataset | YOLOv9 achieved 95% accuracy in fruit detection 96% accuracy achieved for weight prediction | R2, accuracy, exceution time |
| 24 | [20] | This study focuses durian yield prediction method based on Multiple regression model. | Multiple regression model using Residual Principal Component . Used Intel i7-12700T processor and MATLAB. | Durian field data collected from different sensors from 2008 to 2022, production base in Penang, Malaysia | In training test model accuracy is 9.946, and In test data 7.134% | Standard error, F- value, Error rate |
| 25 | [22] | Spoilage detection and price assessment of fruit-quality using CNNs combined with (LLMs) | Deep learning models:- EfficientNetB7, ResNet50, VGG16. | Used fresh and rotten fruits dataset with images from Robolfow(224*224 pixel) | EfficientNetB7 performs well with Accuracy =94.26 then ResNet50 with accuracy =92.26. Underformed VGG16 | Accuracy, Precision, F-1 Score , Recall |
| 26 | [11] | Cost and income forecast for fruit crop entrepreneurs using Multiple Regression model and BI tools | Business tools (BI) and Multiple Regression model | Historical data of cost, yield, weather conditions and soil quality gathered from book by MARDI | Cost model R2 = 0.8649 , Income model R2= 0.7481. BI provided real time insights from better decision making | R2, RMSE, MAE |
3. Methodology
Data collected from AGMAKRTNET for predicting Apple’s price covering the period October 2000 to August 2025, for editing and running code, we used Python and Jupyter Notebook, which are powerful tools and platforms with inbuilt functions and features that make it easy to analyse data and make the analysis smooth and efficient. There were so many commodities in that dataset, so we chose the Apple price among them. Before performing any predictive models, data should be prepared through several steps, like:- Data Pre-Processing, Data Aggregation, and Data Balancing. These steps make sure that the data is clean, balanced with relevant features for modeling, as demonstrated in Figure 1.
3.1. Data Preprocessing
This step involves cleaning and proper formatting of data. This involved converting the date formats, removing and replacing null values, arranging records in order of date and deleting repetitive records. This contributed to making sure that the data was correct and fit to be modeled.
3.2. Data Aggregation
This was a step in which they aggregate the similar features in order to have a better view of the trends. Such as, the mean price per month was given to simplify the results of the apple prices so that one could easily see the trends in apple prices, which facilitated the modeling process as well.
3.3. Data Balancing
There was a balancing to ensure that the categories or groups present in the dataset were nearly equal. It aids the model to learn more and avoid the biasness in one side of the data.
3.4. SARIMA Model
SARIMA(Seasonal Auto-Regressive Moving Average) model , which is extension of ARIMA model that also captures seasonal variations and fluctuations in time series data. On the other hand, the ARIMA model only works with trends and ephemeral correlations. SARIMA has a seasonal factor to deal with seasonal data that repeats after a fixed period of time, like monthly, yearly, or price cycles. SARIMA combines both Seasonal(P,D,Q,s) and Non-seasonal(p,d,q) components into a single model for record seasonal patterns and trends.
Where:
P,D,Q,s = Seasonal Auto-Regressive order , seasonal differencing order, seasonal Moving average order, seasonal periods in a single seasonal cycle
p,d,q = Non-seasonal Auto-regressive order, non-seasonal differencing order, Moving average order
The model is also applicable in making a prediction of prices where the data being analyzed and shows repeating seasonal variations and fluctuations, as in case of agricultural or fruit prices that are supposed to vary in different months. First, the stationarity of the data are tested with Augmented Dickey-Fuller (ADF) test before the SARIMA model is fitted.
3.5. ETS
ETS (Error, Trend, Seasonality) model. It is combination of three components, which is a forecasting approach. It uses Exponential Smoothing, by which it gives more importance to recent data as compared to older data. Various types of the ETS model can be applied depending on the combination of these components, i.e., additive or multiplicative. These terms defines below:
3.5.1. Error
It represents random error and fluctuations in data.
3.5.2. Trend
It shows increasing and decreasing pattern of series of data over time in one direction.
3.5.3. Seasonality
It captures seasonal fluctuations, variations and, patterns of time series data which repeat after a fixed period of time such, yearly or monthly. Generally, the ETS model can be very useful in price prediction and agricultural data analysis where the data shows seasonal and trend changes.
3.6. LSTM
Long Short-Term Memory is variant of RNN(recurrent neural networks It presents the long-term dependencies in time-based or sequential data. This is unlike the traditional RNNs that require only one hidden state to achieve a more effective prediction but LSTM presents a memory cell which remembers or holds information over long period.It has three gates which determine what information should be stored, updated, and removed or forgotten at each step. Forget gate: It determines what information should be remove from the long-term memory. Input gate: It determines what new information should be added to the long-term memory. Output gate: It determines what information should be passed for the final output or prediction. These steps assist LSTM to learn or understand both short-term and long-term dependencies of time series data shown in Figure 2.
4. Results and Experiments
For any type of time series analysis the very first step is to check stationary of data. The data collected for Apple’s price prediction from AGMARKNET covers the period October 2000 to August 2025. There were multiple commodities out of these we uniquely chose Apple for prediction. We check the stationary of data by the Augmented-Dickey fuller Test(ADF). Apple’s price data shows non-stationary at p-value: 0.80221>0.05. So we make it stationary by performing first-order differencing by subtracting the previous value from the current value, now it gives p-value: 0.0000025<0.05 shown in Table -3.
Table -3.
ADF Test Results for Stationarity.
| Series | ADF p-value | Stationary |
|---|---|---|
| Original | 0.802188 | No |
| 1st Difference | Yes |
After this, we split the Apple’s price data into training and testing, data from October 2002 to December 2020 were used for training, and data from January 2021 to August 2025 were used for testing shown in Table -2. Testing data was used for model validation. If model performs well in training data, but not in testing data that means the data was overfitted not generalized.
Table -2.
Train/Test Split Data Summary.
| Dataset | Period | Months |
|---|---|---|
| Train | 09-2002–12-2020 | 220 |
| Test | 01-2021–08-2025 | 56 |
We apply three models ETS, LSTM, and SARIMA to Apple’s price time series data. We used auto_arima function for selecting optimal Parameters of SARIMA model. Stepwise search to minimize AIC, leading to give best fit SARIMA(0,1,0)(1,0,1)[12] model. The SARIMA(0,1,0)(1,0,1)[12] model achieved lowest Akaike Information Criterion(AIC)=3197.131 and Bayesian Information Criterion(BIC)=3207.115 values among all tested models, which indicates model is good fit for data shown in Table -1.
Table -1.
SARIMA Model Statistical Summary
| Model Overview | |||
|---|---|---|---|
| Dep. Variable | Modal price (Rs./Quintal) | No. Observations | 220 |
| Model | SARIMA(0,1,0)×(1,0,[1],12) | Log Likelihood | -1595.566 |
| Date | Tue, 21 Oct 2025 | AIC | 3197.131 |
| Time | 23:02:45 | BIC | 3207.115 |
| Sample | 09-30-2002 | HQIC | 3201.169 |
| Coefficient Estimates | |||
| Term | Coef | Std Err | z / P / [0.025, 0.975] |
| ar.S.L12 | 1.0248 | 0.018 | 58.348 / 0.000 / [0.990, 1.059] |
| ma.S.L12 | -0.7604 | 0.062 | -12.312 / 0.000 / [-0.881, -0.639] |
| sigma2 | 3.09e+05 | 2.47e+04 | 12.533 / 0.000 / [2.61e+05, 3.57e+05] |
| Diagnostic Statistics | |||
| Ljung-Box (L1) (Q): | 0.015 | Jarque-Bera (JB): | 25.55 |
| Prob(Q): | 0.70 | Prob(JB): | 0.00 |
| Heteroskedasticity (H): | 0.65 | Skew: | -0.15 |
| Prob(H) (two-sided): | 0.08 | Kurtosis: | 4.70 |
Diagnostic test such as Ljung-Box(P=0.015>0.05) which means errors are independent and Heteroskedasticity(P=0.65>0.05) which means errors have stable variance shown in Table -1. Then we calculate accuracy matrix of SARIMA , ETS, and LSTM model. The Comparison between them illustrated that LSTM model outperforms the ETS and SARIMA model with lowest Mean Average Error(MAE)=554.08, Root Mean Squared Error(RMSE)=752.10 along with lowest Mean Average Percentage Error(MAPE)=6.63%, determing best prediction accuracy and slightest deviation from actual values. R squre(R2)= 0.7886, which is very close to 1. This means it explain the data very well with 78.9% accuracy as compared to other models. On the other side, SARIMA perform average or moderate with values MAE=1221.61, RMSE=1459.78 and MAPE=14.44 along with value R2=0.3264 , that means it only explains 32% of data. While, ETS model performs very poorly among all of them with value of negative R2= -0.2552, which indicates that it fails to analyze and capture seasonality in data shown in Table 1.
Table 1.
Model Performance Comparison.
| Index | Model | MAE | RMSE | MAPE (%) | R2 (Accuracy) |
|---|---|---|---|---|---|
| 0 | SARIMA | 1221.61 | 1459.68 | 14.44 | 0.3264 |
| 1 | ETS | 1693.58 | 1990.36 | 19.97 | -0.2522 |
| 2 | LSTM | 554.08 | 752.10 | 6.63 | 0.7886 |
SARIMA model graph for Actual vs Predicted values which compares forecasted value with actual value how well model capture seasonality and fluctuations of apple price shown in Figure 3. Clearly seen in graph that model captures both seasonality and trend of apple price efficiently. Modal Price of Apple peaks at early 2021 and 2025 as shown by Blue line, But Red Line miscalculates the value and shows lower peaks at early 2021 and 2025. Clearly indicates error or residuals, however blue line or Actual data show more sharper waves then the redline, leading to some level of poor performace of SARIMA model.
Same as we plot ETS Model graph of actual and predicted value to show visually how it performs. ETS model effectively identify seasonal timing trends of apple price, but fails to predict prices of apple how much prices goes up or down, In simple words it fails to identify fluctuations. Overall , we can say ETS model misses the magnitude changes in prices shown in Figure 4.
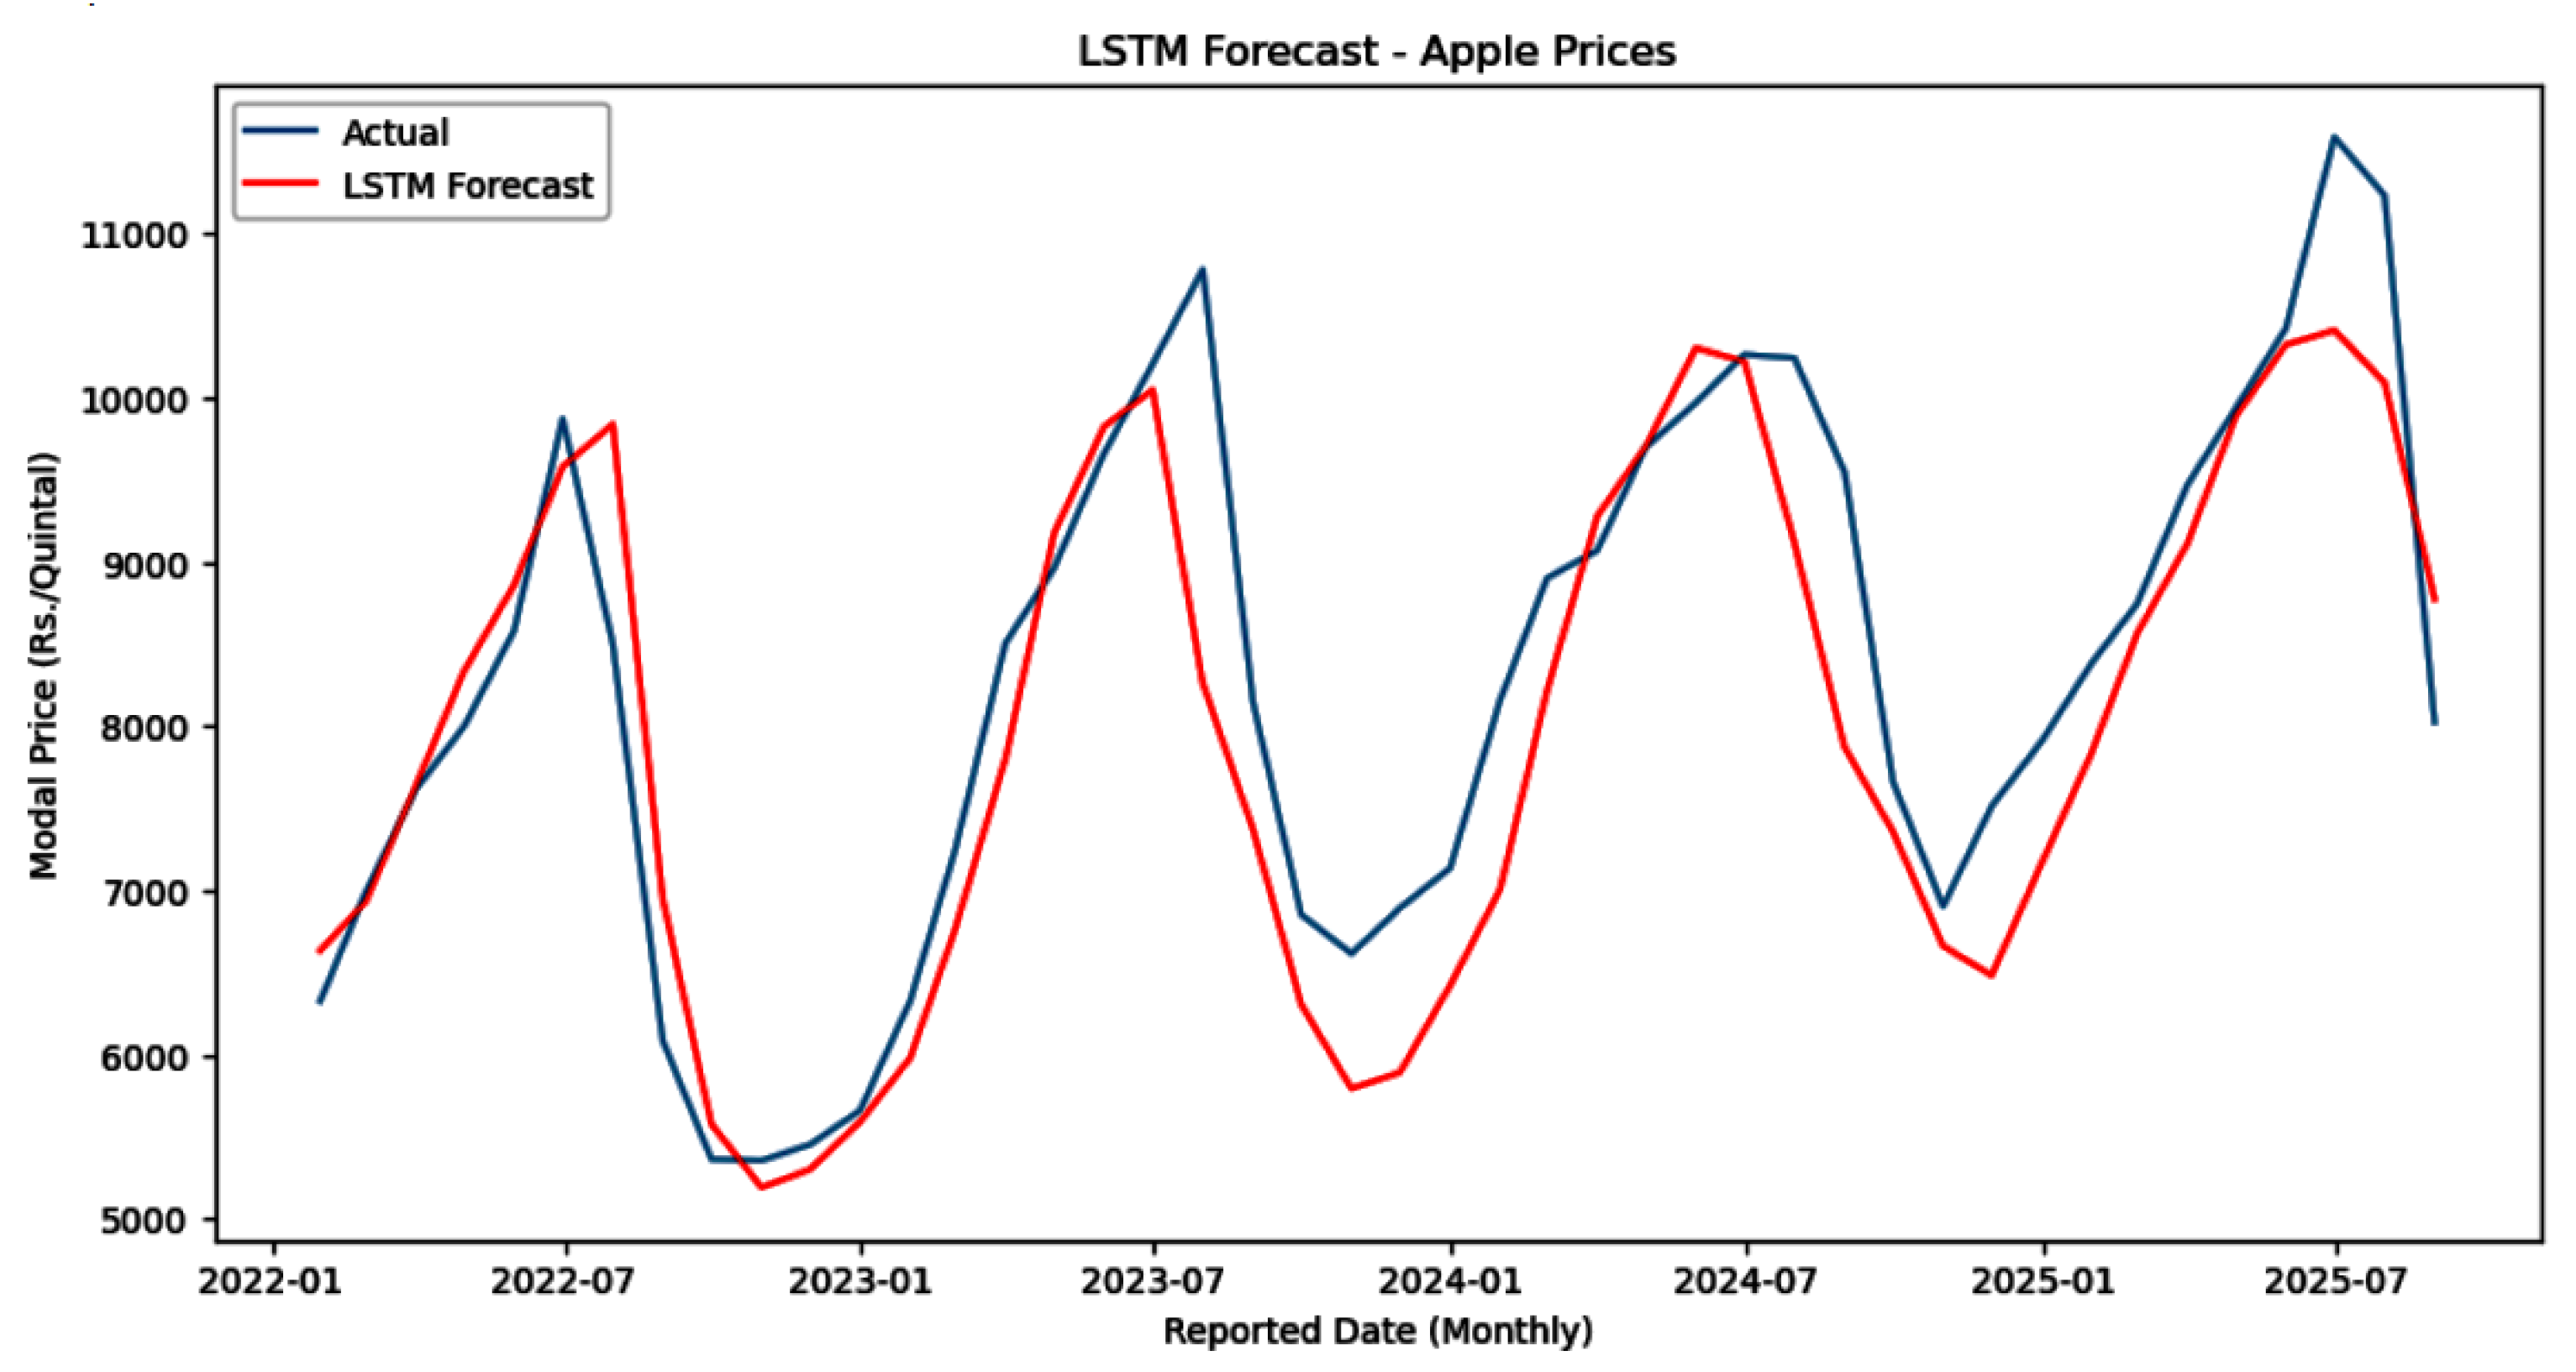
At last , we plot graph of LSTM model for comparing Actual and Predicted value visually, LSTM model exhibits both long-term and short-term dependecies for time series data shown in Figure 5.
It takes Model of Apple price from 2021 to 2025. We can clearly see in the graph that red line follows the blue line very closely. Means errors or residuals are mininum. Actual Prices show strong and clear seasonal patterns or trends which peak at a year, then drop immediately. Same pattern followed by the red line with minor errors. As compared to both ETS and, SARIMA model LSTM model performs well with high level of accuracy and predictive capability. Bases on the accuracy table, we used an LSTM model to forecast 5-year Modal Price of Apple from 2026 to 2030. To see how well it forecasts the Modal Prices for 5- year shown in Figure 6.
5. Conclusion
In the investigation of Comparative Analysis employed on the Apple price time series data in the Indian market, it can aboustely assumed that the Long Short-Term Memory (LSTM) deep learning model is much more precise in regression and prediction operations than the statistical models, SARIMA and ETS. This is achieved through the comparison of the three major accuracy measures, which are the Mean Absolute Error (MAE), the Root Mean Squared Error (RMSE) and the Mean Average Percentage Error (MAPE). The predicted prices were very close to the actual market movements and captures seasonal variations in the analysis which is determined by R2=0.7886 denoted that the LSTM model is a good fit. The model also had the lowest error measures (MAE of 554.08, RMSE of 752.10 and MAPE of 6.63percent), which indicates its better predictive power. The SARIMA model was moderate in terms of the precision of the prediction of the magnitude of price peaks (R2=0.3264) yet failed to be precise when it comes to the prediction of the magnitude of the price peaks. The ETS model, however, proved to be quite weak, as the value of R2 is negative, which shows that it was not able to forecast agricultures price data.
Author Contributions
Conceptualization, Dr.Suraj Arya, Dr Sahimel Azwal Bin Sulaiman and Dr. Dedek Andrian.; Methodology, Dr.Suraj Arya and Nisha Soni.; software, Nisha Soni.; validation, Dr.Suraj Arya and Nisha Soni.; formal analysis, Nisha Soni.; investigation, Dr.Suraj Arya and Nisha Soni.; resources, Dr.Suraj Arya and Nisha Soni.; writing—original draft preparation Dr.Suraj Arya and Nisha Soni.; writing—review and editing, Dr.Suraj Arya, Nisha Soni, Dr Sahimel Azwal Bin Sulaiman.; visualization, Dr.Suraj Arya and Nisha Soni.; supervision, Dr.Suraj Arya; project administration, Dr.Suraj Arya and Dr. Dedek Andrian.; funding acquisition: Dr Sahimel Azwal Bin Sulaiman and Dr. Dedek Andrian. All authors have read and agreed to the published version of the manuscript.
Funding
This work was supported in part by the Research Innovation Department, Universiti Malaysia Pahang Al215 Sultan Abdullah, for the financial support received through the Internal Grant UMPSA (RDU242706/UIC241507).
Institutional Review Board Statement
Not applicable, as this study did not involve human or animal subjects.
Informed Consent Statement
Informed consent was obtained from all participants involved in the study.
Data Availability Statement
Data may be available upon request .
Acknowledgments
All authors thank the Institute for providing valuable resources for conducting this research.
Conflicts of Interest
The authors declare no conflicts of interest.
Abbreviations
The following abbreviations are used in this manuscript:
| LSTM | Long Short-Term Memory |
| SARIMA | Seasonal AutoRegressive Integrated Moving Average |
| ETS | Error, Trend, Seasonal |
| MAE | Mean Absolute Error |
| RMSE | Root Mean Squared Error |
| MAPE | Mean Absolute Percentage Error |
References
- Thakur, R.; Sharma, S.; Laishram, C.; Negi, A. Farmer’s perception towards adoption of eco-friendly natural farming system in Mandi District of Himachal Pradesh, India. Asian Journal of Agricultural Extension, Economics & Sociology 2023, 41(10), 576–585. [Google Scholar]
- Vinay, T.V.; Gupta, R.K.; Swain, D.K.; Bohidar, C.; Sahoo, B.; Satapathy, B.; Chandel, A.; Devi, S.; Bansal, S.; Rattan, A. Apple price forecasting using different time series models for Solan market; Himachal Pradesh, India.
- Bhumireddy, J.; Bose, A. Sales prediction for imported fruits using a linear regression model. In Proceedings of the 16th International Conference on Computational Intelligence and Communication Networks (CICN), 2024; IEEE; pp. 1505–1509. [Google Scholar]
- Gan, Y. The research of apple price fluctuations and influencing factors. In Proceedings of the 6th Annual International Conference on Social Science and Contemporary Humanity Development (SSCHD 2020), 2021; Atlantis Press; pp. 727–734. [Google Scholar]
- Gao, Y. The prediction of apple stock price based on linear regression model and random forest model. Theoretical and Natural Science 2024, 30(1), 103–109. [Google Scholar] [CrossRef]
- Gothai, E.; Rajalaxmi, R.R.; Thamilselvan, R.; Harshath, S.M. Forecasting price prediction for vegetables and fruits using recurrent neural network. In Proceedings of the 5th International Conference on Electronics and Sustainable Communication Systems (ICESC), 2024; IEEE; pp. 1889–1896. [Google Scholar]
- Guresen, E.; Kayakutlu, G.; Daim, T.U. Using artificial neural network models in stock market index prediction. Expert Systems with Applications 2011, 38(8), 10389–10397. [Google Scholar] [CrossRef]
- Yang, C.-Y.; Hwang, M.-S.; Tseng, Y.-W.; Yang, C.-C.; Shen, V.R.L. Advancing financial forecasts: stock price prediction based on time series and machine learning techniques. Applied Artificial Intelligence 2024, 38(1), 2429188. [Google Scholar] [CrossRef]
- Han, C.; Fu, X. Challenge and opportunity: deep learning-based stock price prediction by using bi-directional LSTM model. Challenge 2023, 8(2). [Google Scholar] [CrossRef]
- Meena, K.; Chaitra, B. A novel framework using deep learning techniques for ragi price prediction in Karnataka. IEEE Access 2024. [Google Scholar]
- Mishan, M.T.; Amir, A.L.; Salleh, N.M. An analysis on cost and income prediction system using multiple linear regression and business intelligence for entrepreneur in fruit crop. In Proceedings of the 5th International Conference on Artificial Intelligence and Data Sciences (AiDAS), 2024; IEEE; pp. 430–434. [Google Scholar]
- Pangestu, R.A.; Vitianingsih, A.V.; Kacung, S.; Maukar, A.L.; Noertjahyana, A. Comparative Analysis of Support Vector Regression and Linear Regression Models to Predict Apple Inc. Share Prices. Ph.D. Thesis, Petra Christian University, Indonesia, 2024. [Google Scholar]
- Peerzada, S.; Saud, M.R.; Javed, D. Neuralmango: Advanced mango classification and price prediction. In Proceedings of the International Conference on Engineering & Computing Technologies (ICECT), 2024; IEEE; pp. 1–6. [Google Scholar]
- Ruiz Hernández, J.A.; Barrios Puente, G.; Gómez Gómez, A.A. Analysis of the price of the apple using a SARIMA model. Revista Mexicana de Ciencias Agrícolas 2019, 10(2), 225–237. [Google Scholar] [CrossRef]
- Shanmugasundaram, C.; Umamaheswari, C.; Vijayalakshmi, A.; Varghese, P.E. Crop forecasting and estimation: crop yield estimation and profitability analysis for precision agriculture. In Proceedings of the International Conference on System, Computation, Automation and Networking (ICSCAN), 2024; IEEE; pp. 1–7. [Google Scholar]
- Sharma, C.; Misra, R.; Bhatia, M.; Manani, P. Price prediction model of fruits, vegetables and pulses according to weather. In Proceedings of the 13th International Conference on Cloud Computing, Data Science & Engineering (Confluence), 2023; IEEE; pp. 347–351. [Google Scholar]
- Smith, H. The utilization of artificial intelligence to predict Apple Inc. stock price. Journal of High School Science 2024, 8(3), 16–29. [Google Scholar] [CrossRef]
- Soetrisno, Y.A.A.; Handoyo, E.; Ilyasa, M.H.; Denis; Sinuraya, E.W. Time-series analysis for predicting apple prices in Indonesian market using the SARIMA method. In Proceedings of the 1st International Conference on Advanced Information Science and System, 2019; pp. 1–6. [Google Scholar]
- Sutradhar, S.; Sharma, E.; Bhat, A.; Sood, A. Price analysis and forecasting of apple: An empirical study on fruit market of Jammu and Kashmir. Economic Affairs 2024, 69(4), 1695–1700. [Google Scholar]
- Tang, R.; Aridas, N.K.; Abu Talip, M.S. A durian yield prediction method based on an improved multiple regression model. In Proceedings of the 7th International Conference on Information Technology, Information Systems and Electrical Engineering (ICITISEE), 2023; IEEE; pp. 140–145. [Google Scholar]
- Thakur, R.; Sharma, S.; Negi, A. Apple price forecasting using different time series models in Himachal Pradesh 2023.
- Joseph, K.; Thanka, M.R. AI framework for fruit quality assessment: integrating CNN-based spoilage detection, price estimation, and LLM-powered insights. In Proceedings of the 2025 Fourth International Conference on Smart Technologies, Communication and Robotics (STCR), 2025; IEEE; pp. 1–6. [Google Scholar]
- Kumar, S.Y.; Mishra, A.; Nambiar, R.; Nekar, A.; Benedict, S. Fruit weight prediction and cost estimation using YOLOv9-based deep learning. In Proceedings of the 2024 International Conference on IoT Based Control Networks and Intelligent Systems (ICICNIS), 2024; IEEE; pp. 1304–1309. [Google Scholar]
- Yoon, S.; Kim, T.-H.; Kim, D.S. Data-driven analysis of climate impact on tomato and apple prices using machine learning. Heliyon 2025, 11(1). [Google Scholar] [CrossRef]
- Ragunath, R.; Rathipriya, R. Predicting agriculture commodity price trends using ensemble regression approach. Journal of Agricultural Sciences–Sri Lanka 2025, 20(3). [Google Scholar] [CrossRef]
- Oberoi, K.G.; Deepa, K.; Sangeetha, S.V.T.; Neelima, N. Predicting vegetables and fruits through supply chain insights. Proceedings of the 2024 IEEE International Conference on Interdisciplinary Approaches in Technology and Management for Social Innovation (IATMSI) 2024, Vol. 2, 1–5. [Google Scholar]
- Hakim, A.Q.A.; Abd Rahman, M.A.; Radzi, S.F.M. Ensemble ARIMA-LSTM algorithm in predicting agriculture commodities market price for farmer’s education. In Proceedings of the 2024 7th International Conference on Information Technologies in Engineering Education (Inforino), 2024; IEEE; pp. 1–6. [Google Scholar]
Figure 1.
Proposed methodology.
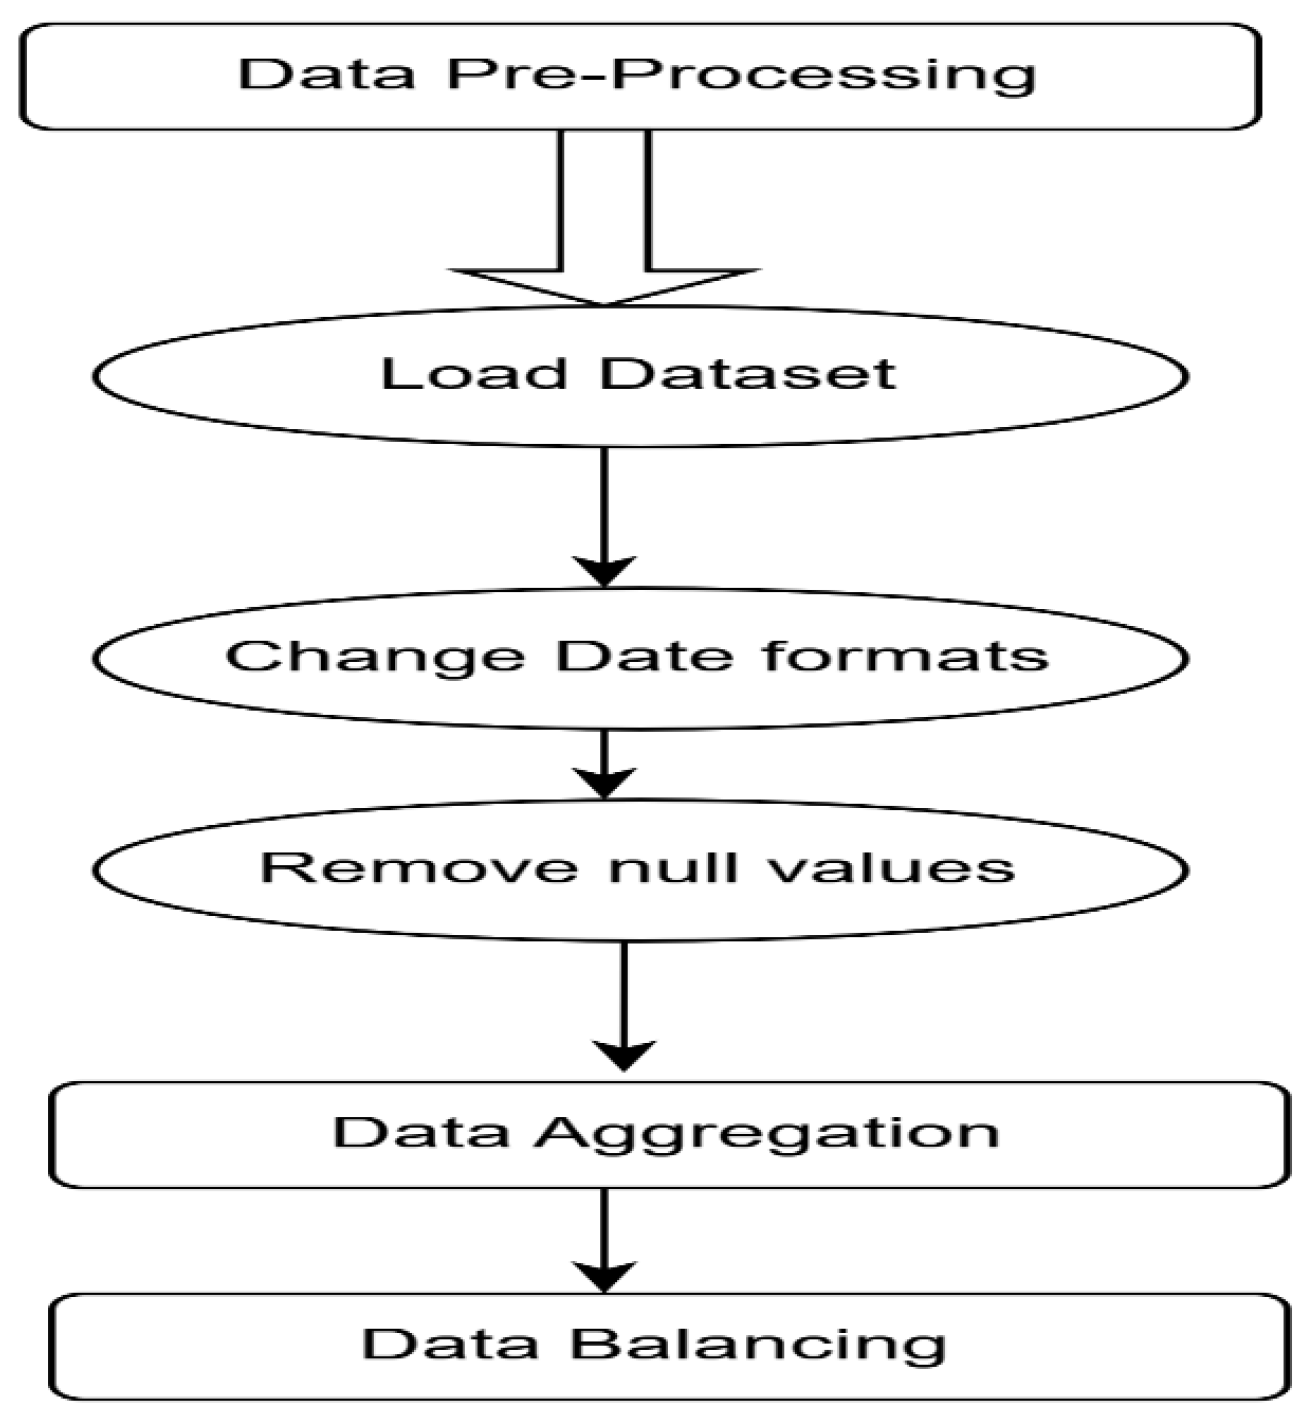
Figure 2.
Achitecture of LSTMs model
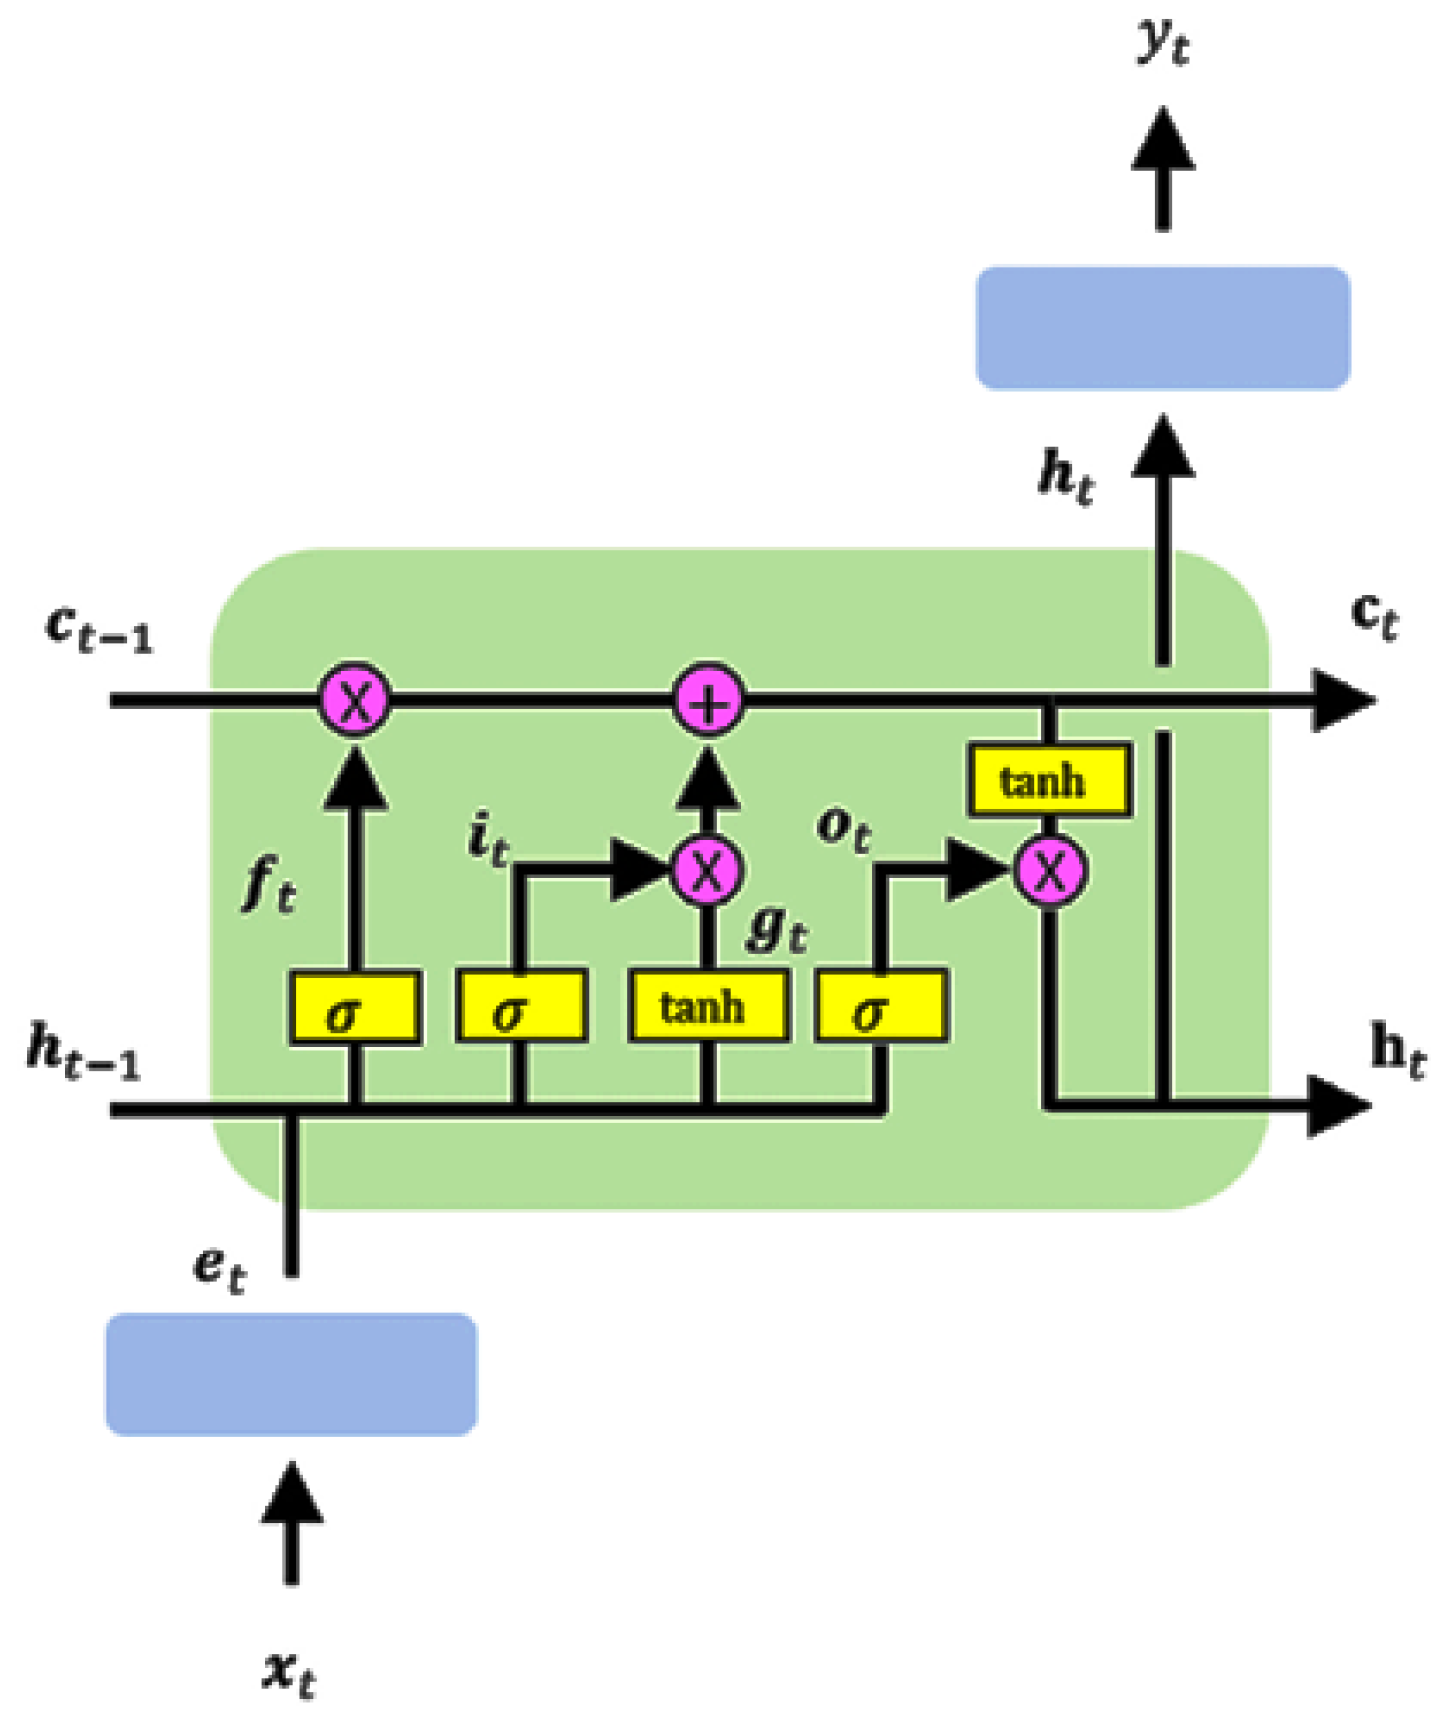
Figure 3.
SARIMA forecast.
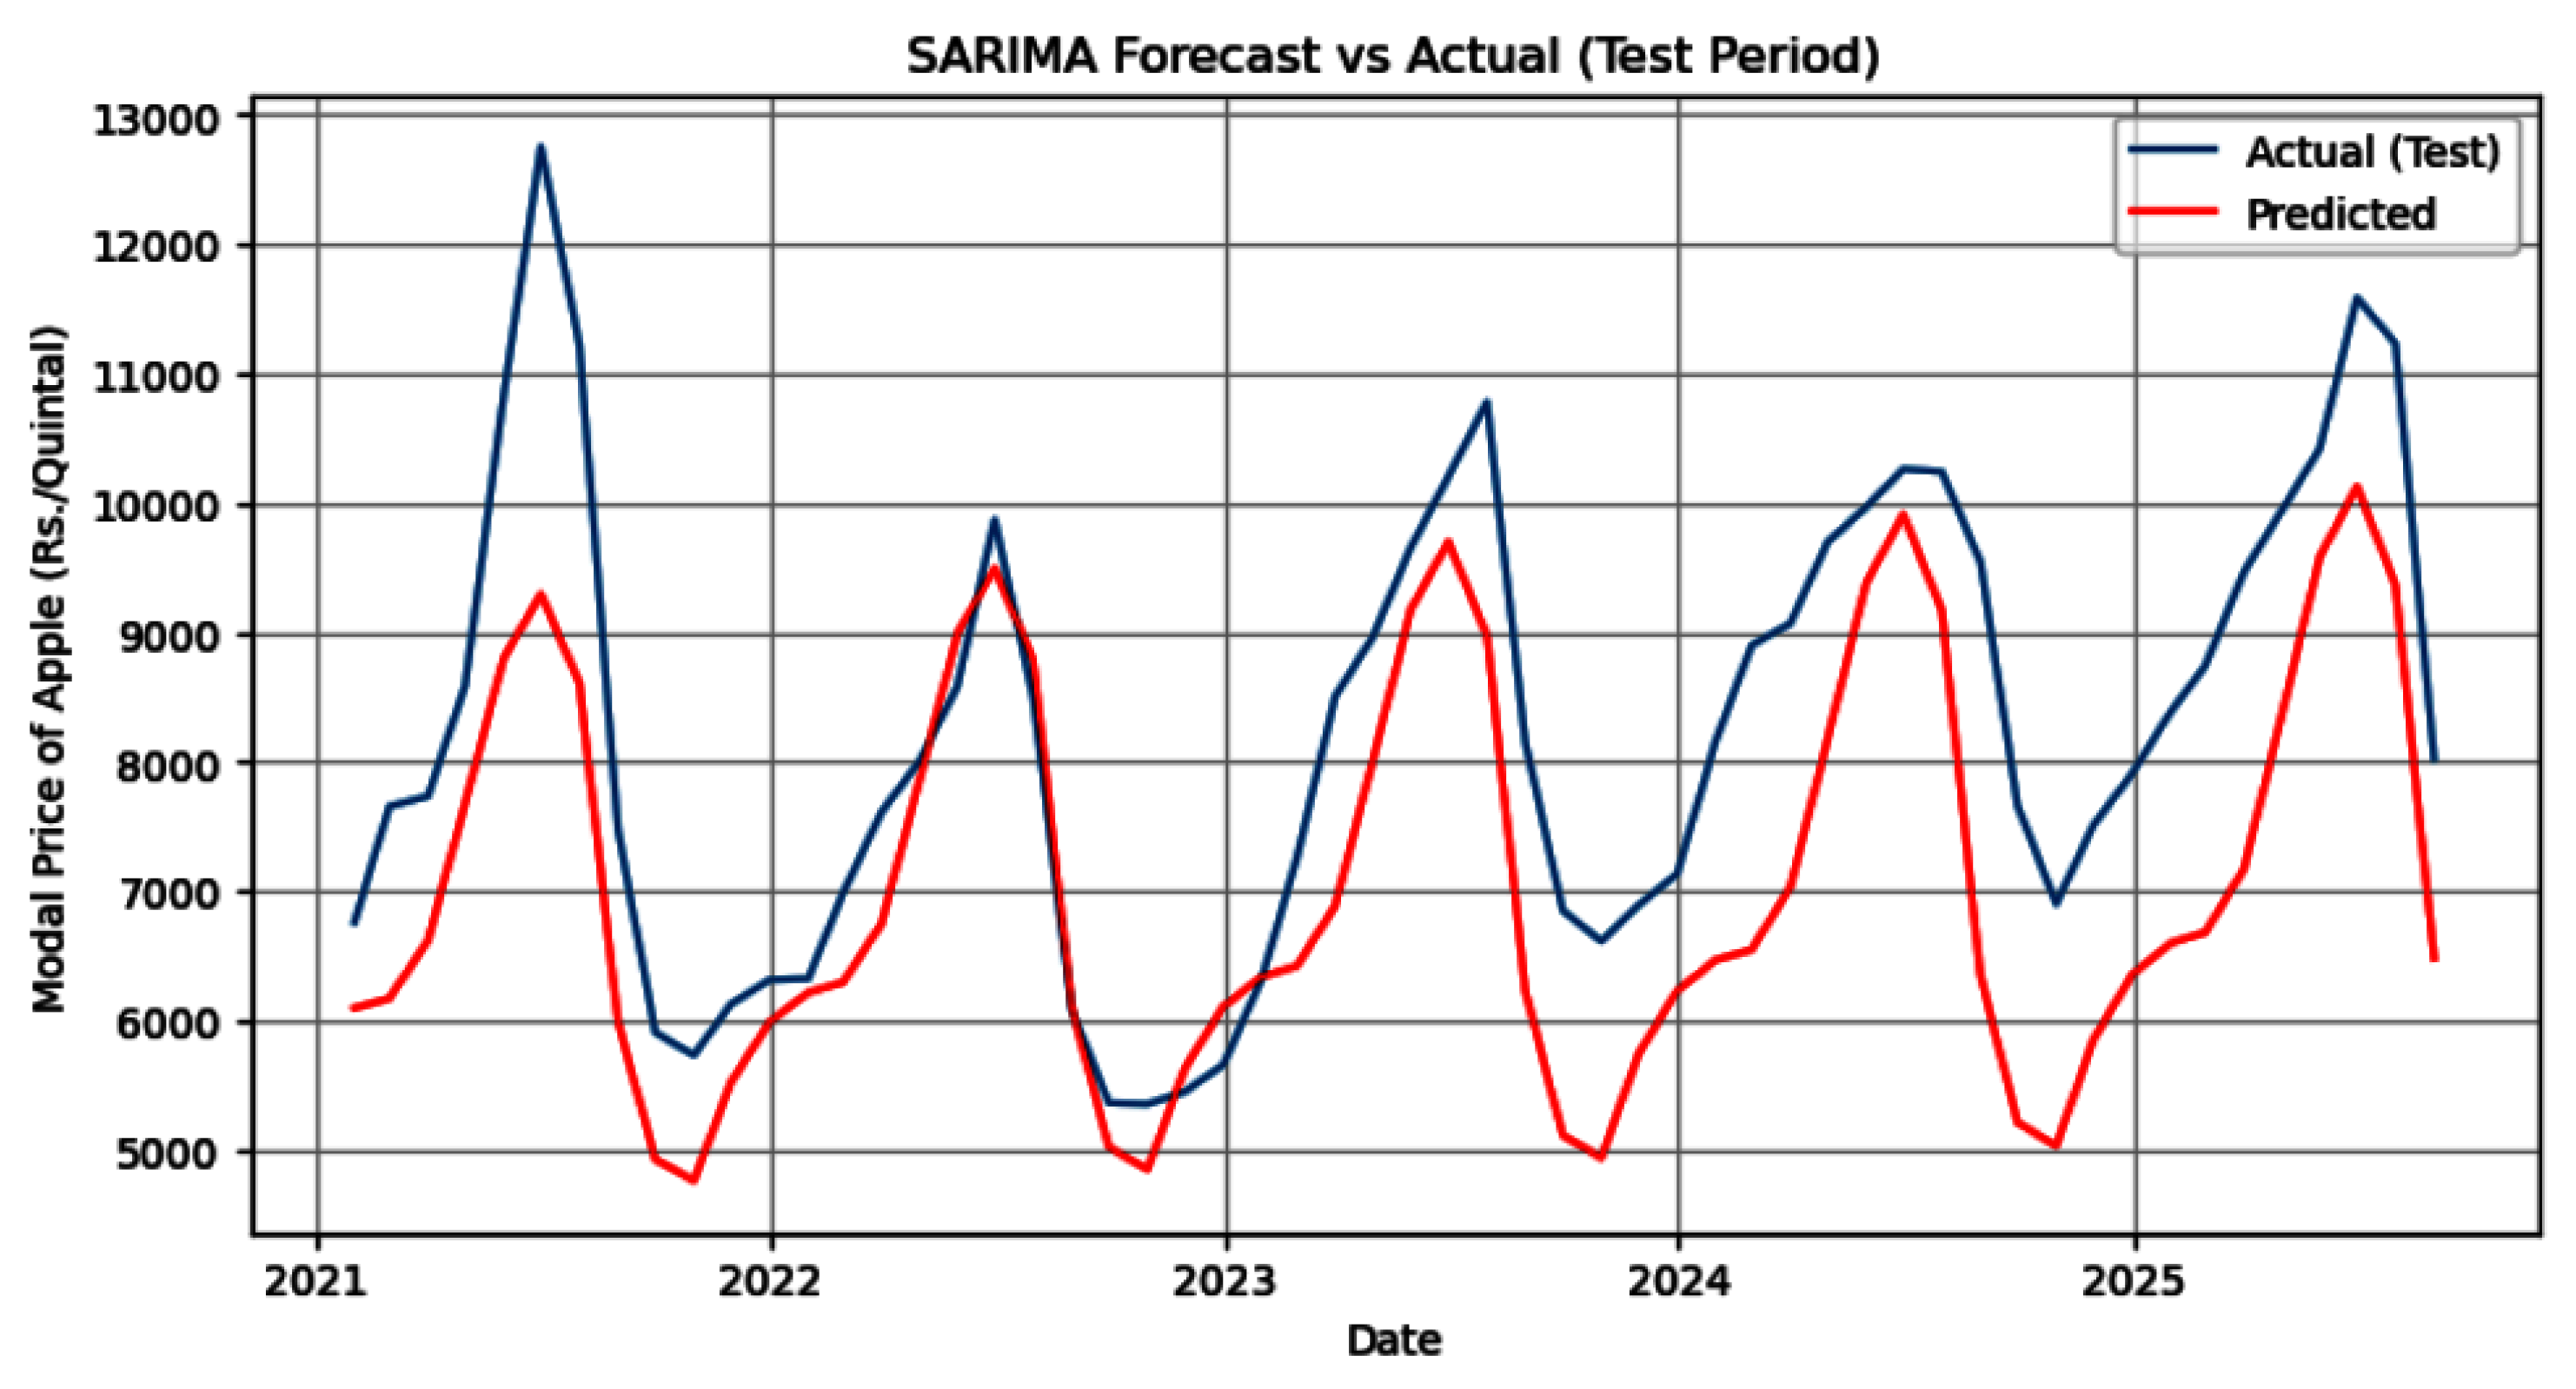
Figure 4.
ETS forecast.
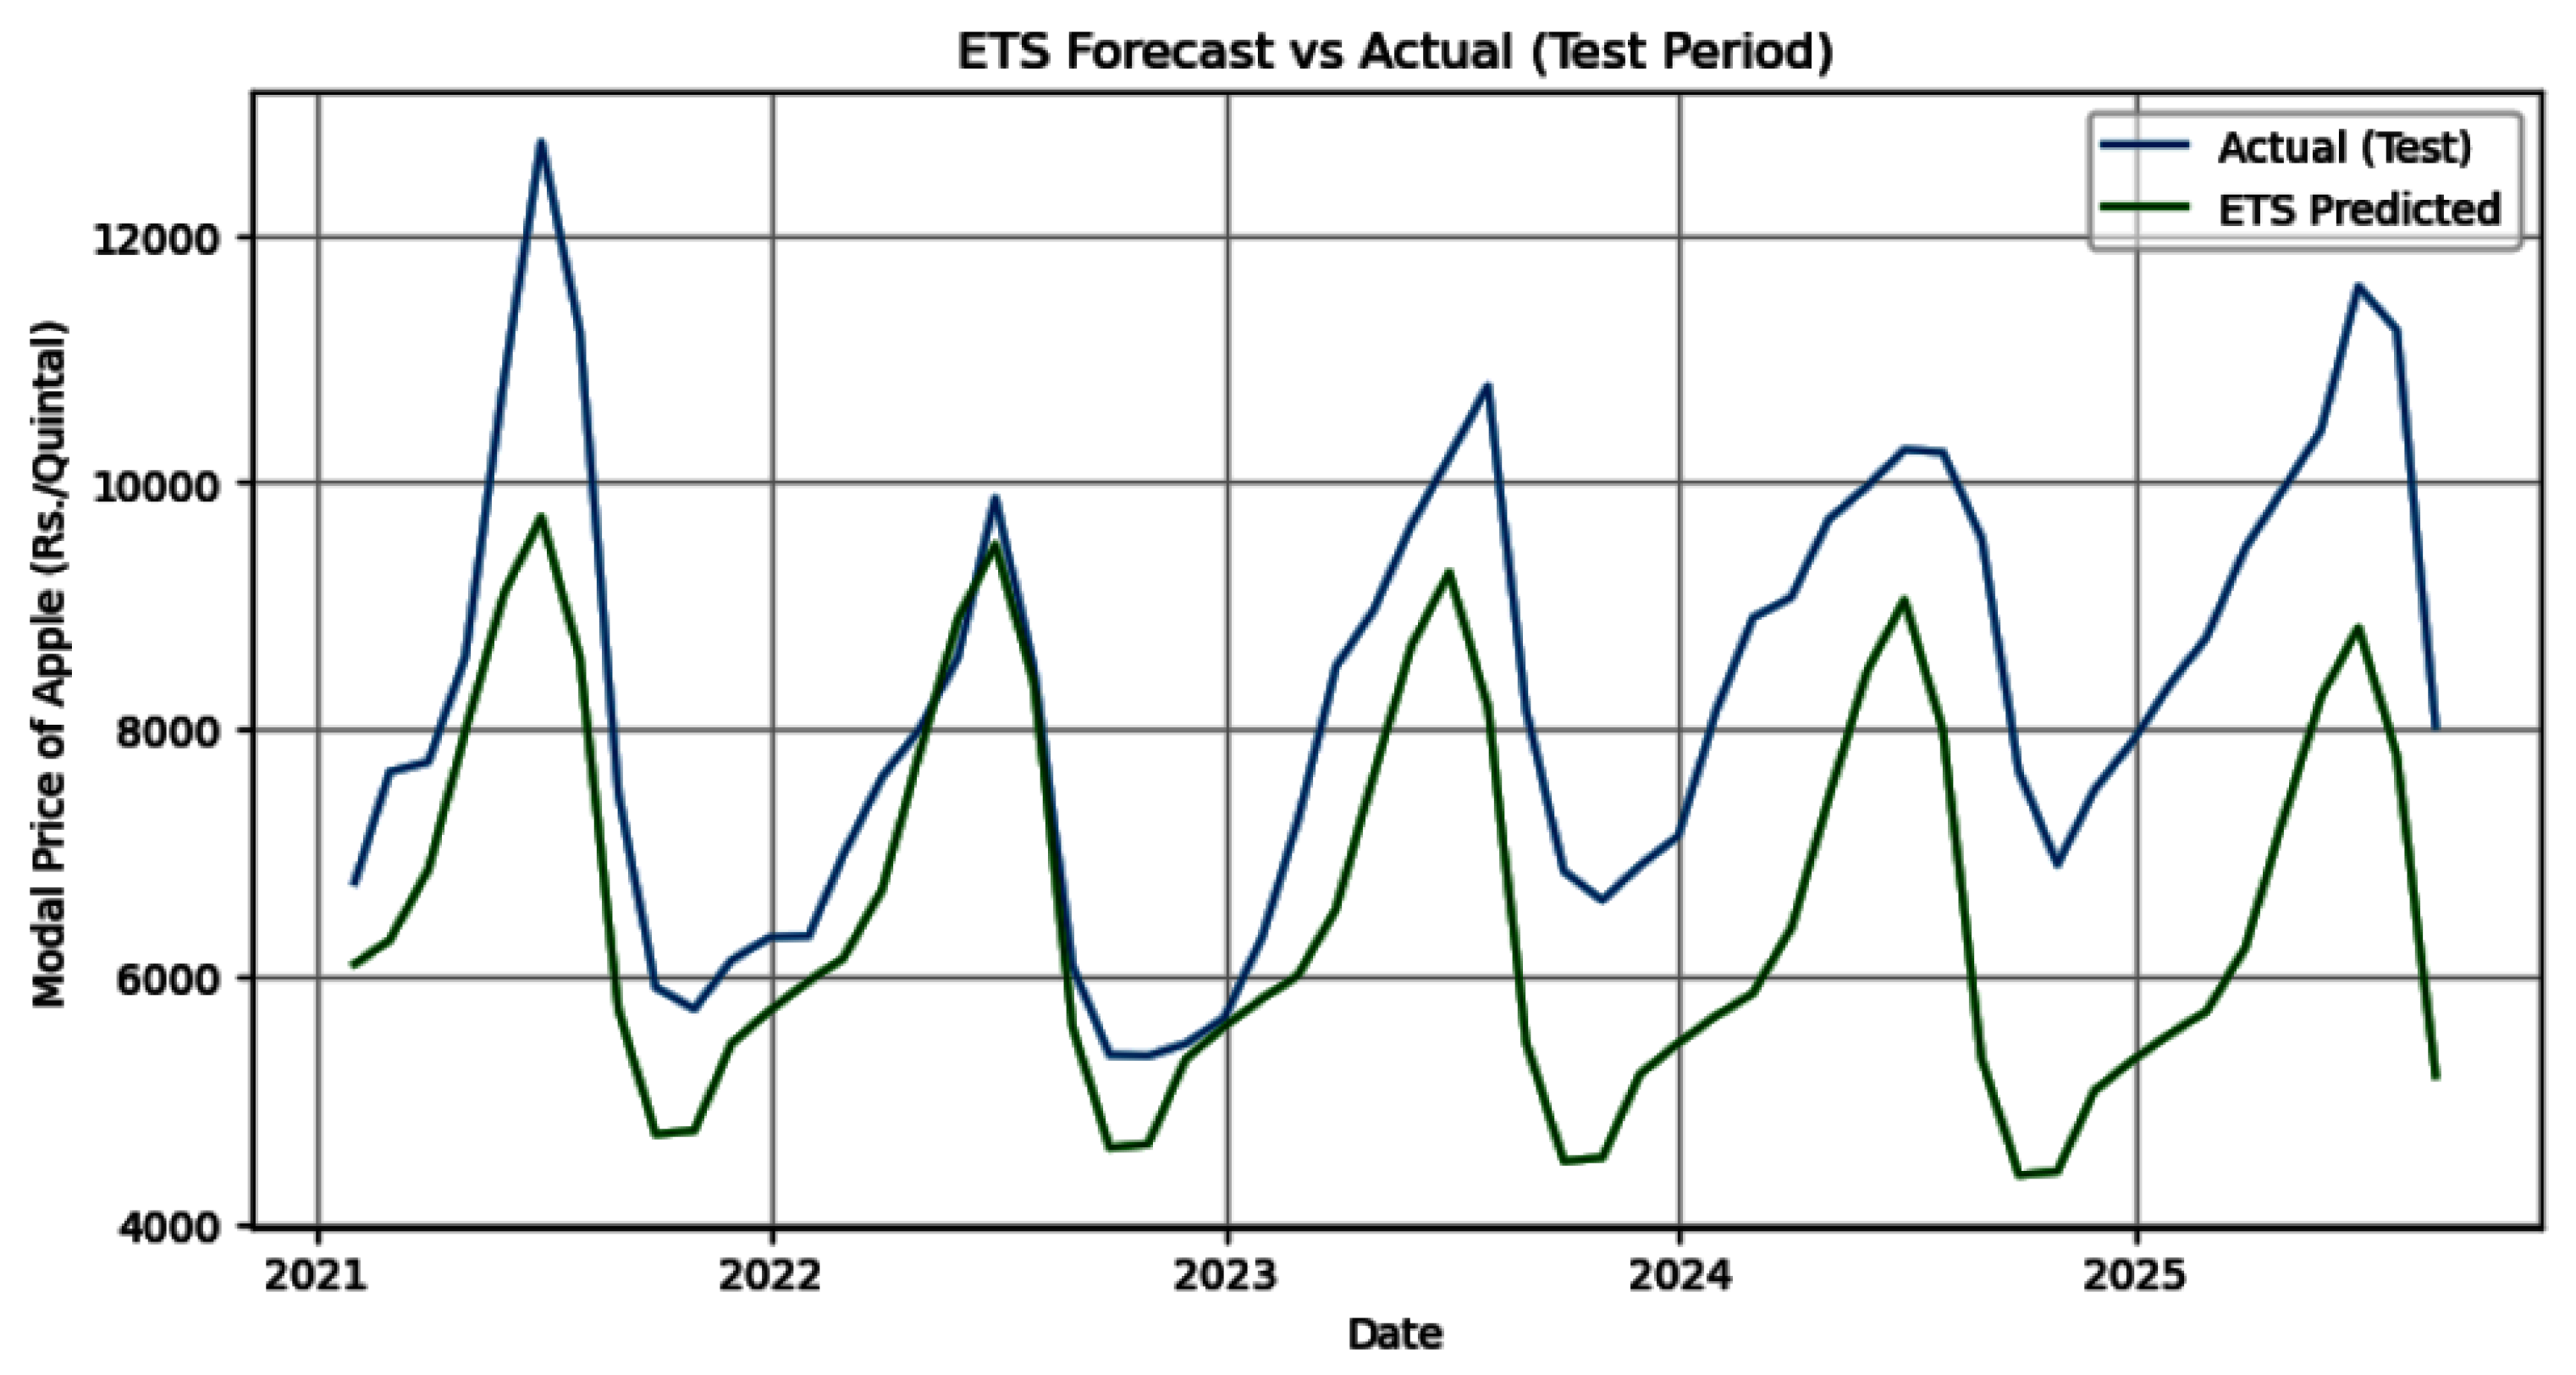
Figure 5.
LSTM forecast.
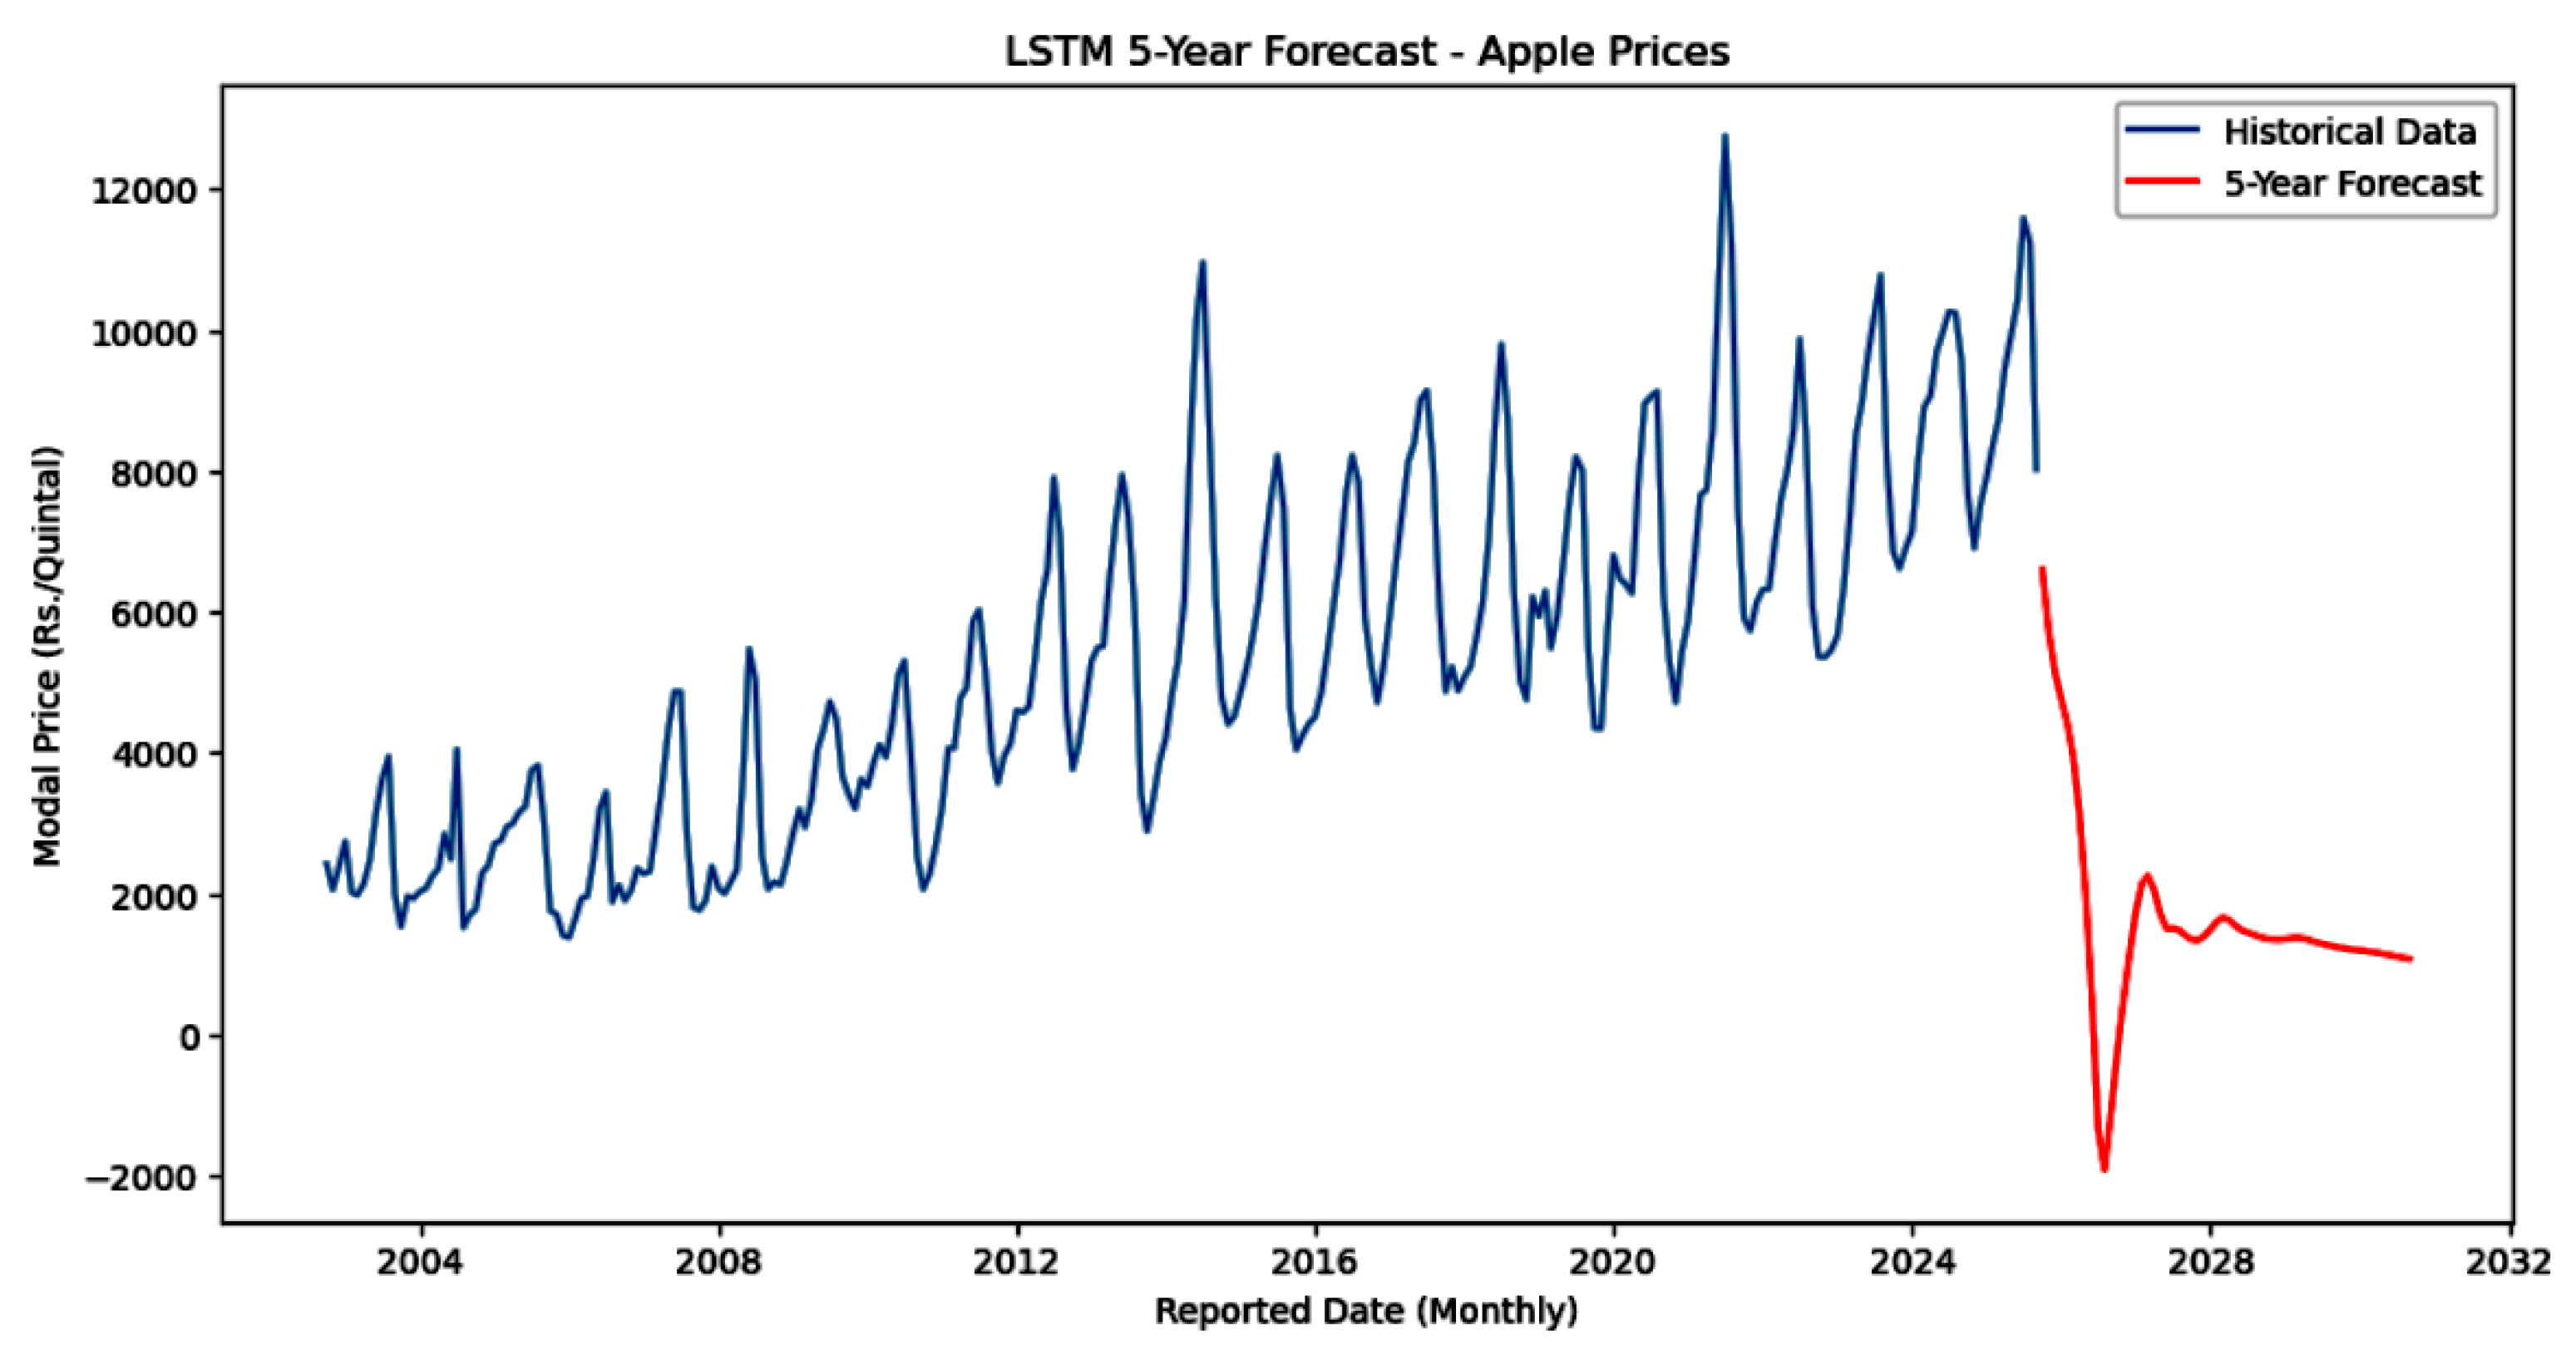
Figure 6.
LSTM forecast monthly.
Disclaimer/Publisher’s Note: The statements, opinions and data contained in all publications are solely those of the individual author(s) and contributor(s) and not of MDPI and/or the editor(s). MDPI and/or the editor(s) disclaim responsibility for any injury to people or property resulting from any ideas, methods, instructions or products referred to in the content. |
© 2026 by the authors. Licensee MDPI, Basel, Switzerland. This article is an open access article distributed under the terms and conditions of the Creative Commons Attribution (CC BY) license (http://creativecommons.org/licenses/by/4.0/).
Copyright: This open access article is published under a Creative Commons CC BY 4.0 license, which permit the free download, distribution, and reuse, provided that the author and preprint are cited in any reuse.


