

Submitted:
14 August 2026
Posted:
18 August 2026
You are already at the latest version
Abstract
L-asparaginase (L-ASNase) enzyme has found applications in medicine for treatment of various cancers. Herein, we report single-molecule study of thermal denaturation of L-ASNase within 25°C to 60°C temperature range by atomic force microscopy (AFM) and by single-molecule sensing with a (solid state nanopore)-based electrical detector (SSNPED). AFM has allowed us to reveal a thermally induced changes in aggregation state of L-ASNase and in its adsorbability on mica. At the same time, the configuration of the enzyme’s globule spatial conformation has been found to alter according to data obtained with the SSNPED. The results of AFM experiments have been confirmed by fluorescence spectroscopy. Our results reported open up opportunities for further development of anti-cancer drugs.
Keywords:
L-asparaginase
; solid-state nanopore
; thermal denaturation
; atomic force microscopy
; fluorescence spectroscopy
; enzyme fluorescence
1. Introduction
L-asparaginase (L-ASNase) enzyme pertains to hydrolases; the molecular weight of its monomer is about 36 kDa [1]. This enzyme catalyzes conversion of L-asparagine into aspartate [2]. Since L-asparagine, in its turn, represents an essential amino acid (AA) for tumour cells [2], L-ASNase has found applications in cancer therapy: for instance, the use of L-ASNase for treatment of lymphoblastic leukemia [3,4], hepatocellular carcinoma, lymphosarcoma, pancreatic adenocarcinoma ant other cancers [5,6]. Of note, only Type II L-ASNase is suitable for medical applications, while Type I enzyme lacks therapeutic activity [7].
Molecular detectors, which include atomic force microscope and nanopore-based detectors, allow one to perform single-molecule studies of biological macromolecules, such as proteins (including enzymes) [8,9] and DNA [10]. While atomic force microscopy (AFM) allows for visualization of enzyme macromolecules [8,9], (solid state nanopore)-based electrical detectors (SSNPEDs) enable registration of functional activity of single enzyme molecules [11,12,13].
The present research is aimed at single-molecule study of thermal denaturation of L-ASNase E. сarotovora. Functionality of the enzyme has been checked at 25°C with an SSNPED, whose nanopore was formed in a silicon nitride (SiN) membrane. Thermal denaturation and dependence of aggregation state of the enzyme on temperature have subsequently been studied by AFM within 25 to 60 °C temperature range; the thermal denaturation has also been studied by fluorescence spectroscopy. The results of the study can be of use in the development of novel anticancer drugs based on L-ASNase.
2. Materials and Methods
2.1. Enzyme and Chemicals
L-Asparaginase enzyme E. сarotovora was obtained and purified in IBMC (Laboratory of Medical Biotechnology) according to previously published protocols [17]. Lyophilized powder of the enzyme was dissolved in 2 mM Dulbecco’s modified phosphate buffered saline (PBSD) and diluted to the desired concentration. In all experiments, ultrapure (with a resistivity of 18.2 MΩ×cm) water obtained with a Simplicity UV purification system (Millipore, Molsheim, France) was used.
2.2. Solid State Nanopore-Based Electrical Detector
The SSNPED comprised a measuring cell fabricated from polydimethylsiloxane (PDMS). The cell was divided into two chambers with a holder, in which a nanopore chip was fixed. Namely, 40-nm-thick silicon nitride chip with a single ~6 nm nanopore was inserted into and fixed in the holder. The nanopore was formed in the chip by electron beam drilling (EBD) with a JEM 2000F transmission electron microscope (TEM; JEOL Ltd., Akishima, Tokyo, Japan). Figure 1 displays a TEM image of the nanopore.
Each of the two chambers was filled with 700 µL of 1 mM PBSD (pH 7.6). Ag/AgCl electrodes were immersed into the solution in each chamber in order to perform electrical measurements.
2.3. Atomic Force Microscopy
In AFM experiments, samples of enzyme solution were first warmed up to the desired temperature in a test tube; secondly, the enzyme was adsorbed from the warmed-up solution onto mica AFM substrates. This procedure was performed in the following way.
Firstly, 0.1 µM solution of L-ASNase in 2 mM PBSD (pH 7.4) was placed in an Eppendorf Thermomixer Comfort shaker (Eppendorf, Germany), and sequentially warmed up to the desired temperatures within the studied temperature range (25°С, 30°С, 45°С, 55°С, and 60°С). At each of these temperature points, two 1-mL samples of the solution were taken, and the warming-up was continued until the 60°С value was reached.
Secondly, the enzyme from the samples taken as described above was directly adsorbed [15] onto bare mica AFM substrates. Each 1-mL sample of the enzyme solution was pipetted into an 1.7-mL Eppendorf-type test tube, and a 7×15 mm rectangular piece of muscovite mica (SPI, USA) was immersed into the solution. The test tube was then placed into an Eppendorf Thermomixer Comfort shaker (Eppendorf, Germany) and continuously shaken at 60 rpm and room temperature (25°С) for ten minutes. Each of the AFM substrates was then evacuated from the enzyme solution, placed in another test tube with 1 mL of ultrapure water and, again, shaken at 60 rpm and room temperature (25°С) for ten minutes in order to wash off buffer salts from the substrate surface.
All AFM measurements were performed with a NTEGRA PRIMA atomic force microscope (NT-MDT, Zelenograd, Russia). Prior to the measurements, the microscope was calibrated with a TGZ1 calibration grating (NT-MDT, Zelenograd, Russia). The AFM scanning was performed in taping mode in air at controlled laboratory conditions (25 °C temperature, 55% air humidity). For each AFM substrate, no less than twenty-five 4 µm×4 µm scans with a resolution of 256×256 were obtained.
The analysis of the AFM data was performed with a NOVA Px software (NT-MDT, Zelenograd, Russia) and odAFM specialized software developed in IBMC (Rospatent registration No. 2010613458, 05/26/2010), and the main criterion for assessing the size of enzyme molecules was the height of their AFM images. The processing of the AFM data included calculation of the distributions of AFM images of the enzyme molecules by height ρ(h) and the normalized number N400 of the enzyme molecules per 400 µm2 area of the AFM substrate; these calculations were performed as described elsewhere [16].
2.4. Spectrophotometry
Absorbance spectra of 1 µM L-ASNase solution in 2 mM PBSD were recorded at 25 °C within 190 to 100 nm range with an Agilent 8453 UV-Vis spectrophotometer employing a 10 µL quartz micro-cell with an optical pathlength of 2 mm.
2.5. Fluorescence Spectroscopy
In the fluorescence spectroscopy experiments, samples of L-ASNase solution were placed in standard Eppendorf-type test tubes and warmed up with a TS-100 thermoshaker (Vector-Best, Russia). The warming-up was performed stepwisely from 25 to 60 °C with a 5 °C step. In order to additionally perform more precise monitoring of the sample temperature, similar test tube with the same volume of blank enzyme-free solution was placed in the shaker, and the sensor of a FY-10 digital thermocouple-based thermometer was placed into this solution. Each to be studied in the fluorescence spectroscopy experiments was removed from the shaker two minutes after reaching the desired temperature indicated by the thermocouple-based thermometer.
Fluorescence spectra of 0.1 µM L-ASNase solution in 2 mM PBSD (pH 7.4) were acquired at an excitation wavelength of 280 nm within emission wavelength range from 290 to 400 nm with an LS55 luminescent spectrometer (Perkin Elmer, USA) using a 300 µL quartz fluorimetric cell with an optical pathlength of 1 cm. In each temperature point, fluorescence spectra were recorded in three technical replicates. At the most temperatures studied, the central maximum of fluorescence intensity was observed at 308 nm. Background signal was subtracted using a LabView (v. 6.1) software. Processing of fluorescence spectroscopy data is described in detail in °endix A.
3. Results
3.1. SSNPED Measurements of L-ASNase Functionality
In the SSNPED measurements, time dependence of the ion current through the nanopore dividing the measuring cell into two chambers (cis-chamber and trans-chamber) was recorded (Figure 2). Prior to the enzyme addition, baseline level of the ion current through the nanopore was recorded in 1 mM PBSD (pH 7.6) at 25°С. Then, the solution in the cis-chamber of the SSNPED’s measuring cell was substituted with 0.1 µM L-ASNase solution (Figure 1). After the enzyme addition, the absolute value of the ion current decreased, indicating partial blockade of the nanopore by a molecule of the enzyme. Subsequent addition of 10 µM L-asparagine solution, in its turn, led to a considerable increase in the ion current (Figure 1), indicating unblocking of the nanopore. In blank experiments performed with pure buffer instead of L-ASNase solution, no considerable change in the ion current was observed.
3.2. AFM Study of L-ASNase Thermal Denaturation
Figure 3 displays typical AFM images of L-ASNase adsorbed on mica from its solutions treated at either 25°С, 30°С, 45°С, or 55°С. In Figure 3d, black ellipses mark denatured L-ASNase structures. At 60°С, no adsorption of the enzyme was observed.
The AFM images shown in Figure 3 illustrate that within 25 to 45°С temperature range, the enzyme adsorbed on mica in the form of separate globules, while warming of the enzyme solution up to 55 °C led to its adsorption in the form of extended structures. The latter indicates considerable denaturation of the enzyme at 55 °C. Figure 4 displays typical plots of ρ(h) distributions obtained for the enzyme samples treated at either 25°С, 30°С, 45°С, or 55°С.
In Figure 4, blue curve indicates that the maximum of the ρ(h) distribution of L-ASNase, adsorbed on mica at 25°С, corresponds to hmax = 2.4 nm. In previous AFM studies of another enzyme — horseradish peroxidase (HRP), whose molecular weight (40 to 44 kDa [17,18]) is comparable to that of L-Aspaase (36 kDa [1]), it was demonstrated that the maximum height of AFM images of monomeric form of HRP on mica is 1.0 to 1.2 nm [8,9]; the height of AFM images of high-order HRP aggregates on mica makes up ≥2.4 nm [9]. For these considerations, we conclude that after treatment at 25°С, L-ASNase adsorbs onto mica in the form of aggregates with heights of AFM images about 2.4 nm.
In our experiments reported herein, upon treatment at higher (30 to 45°С) temperatures, we observe a decrease in hmax down to the 1.6 and 1.4 nm values (see Figure 4, orange and green curves). This decrease indicates a disaggregation of L-ASNase with an increase in the relative content of monomeric L-ASNase in the total amount of the mica-adsorbed enzyme.
The AFM images of mica-adsorbed individual molecules of L-ASNase are quite well distinguishable for all temperature values studied — namely, up to 45°С (see Figure 3a-c). In contrast, at higher (55°С) temperature, compact objects are virtually not observed (Figure 3d). The lack of compact objects in the AFM images obtained in experiments with the enzyme treated at 55°С indicates that the enzyme molecules undergo considerable structural changes at this high temperature. These changes lead to the occurrence of extended structures on mica (Figure 3d), while no adsorption of the enzyme in its “usual” form is observed. In experiments performed at 55°С, only filamentary structures of denatured enzyme are visualized. The height of AFM images of these structures makes up 0.5 to 0.8 nm. Further elevation of temperature to 60°С leads to a complete disappearance of the enzyme adsorption on mica: neither compact objects nor filamentary structures are visualized after treatment of the enzyme at such a high temperature.
Table 1 lists the number N400 of mica-adsorbed L-ASNase particles normalized per 400 µm2 area of the AFM substrate.
The data listed in Table 1 indicate that maximum adsorption of the enzyme is observed after its treatment at 45°С.
3.3. Spectroscopy Results
Firstly, UV-Vis absorbance spectrum of 1 µM L-ASNase solution in 2 mM PBSD was recorded. The obtained spectrum shown in Figure 5 exhibits the absorbance maximum at 275 nm.
Secondly, fluorescence spectroscopy analysis was performed in order to study characteristic temperature-induced changes in the L-ASNase structural organization. Since the enzyme molecule contains aromatic residues of amino acids, which exhibit fluorescent properties (tyrosine, tryptophan and phenylalanine) [19], this analysis can be carried out without using additional fluorescent labels. Figure 6 displays temperature dependence of fluorescence intensity I308(T) of 0.1 µM L-ASNase solution in 2 mM PBSD at 308 nm.
The I308(T) curve shown in Figure 6 indicates that I308 begins to increase considerably at 30 °C. At this temperature, the I308 makes up 0.746. The observed increase in fluorescence intensity is connected with changes in the enzyme globule’s structure. At 40 °C (when I308 value of 0.775 is registered) and higher temperatures, the increase in I308 is even more pronounced, so that I308 reaches 1.799 at 50 °C, indicating the more serious structural changes in the enzyme globule. At higher temperatures, however, the I308 decreases markedly: at 55 °C, I308 is only 1.155, and at 60 °C, no distinct fluorescence intensity peak could be distinguished at 308 nm. The latter clearly indicates denaturation of the enzyme.
4. Discussion
AFM study of thermal denaturation of L-ASNase has shown that at 25°С the enzyme adsorbs onto mica in aggregated form. Elevation of temperature to 30°С has led to a twofold decrease in the N400 number of mica-adsorbed enzyme particles. The latter fact indicates a temperature-induced changes in the conformation of the enzyme globules, which have led to the decrease in the enzyme adsorption. Based on both the N400 values (see Table 1) and ρ(h) plots (See Figure 4), one can conclude that the elevation of temperature favours disaggregation of the enzyme and adsorption of higher amount of monomeric enzyme. These phenomena are likely connected with thermal denaturation processes. Further elevation of temperature up to 45°С promotes the enzyme adsorption, indicating a continuation of the denaturation processes, which lead to changes in the enzyme globule’s conformation. The latter favoured stronger attachment of the enzyme to the mica surface. Here we, again, emphasized that maximum adsorption of L-aspase on mica is observed at 45°С. Further elevation of temperature up to 55°С, however, leads to a dramatic decrease in the enzyme adsorption accompanied by occurrence of filamentary structures of denatured enzyme. At highest temperature studied (60°С) the enzyme completely loses its adsorbability, since neither compact objects nor filamentary structures are visualized on mica.
In the experiments with SSNPED, the addition of the enzyme into the measuring cell leads to a decrease in the ion current through the nanopore, indicating its blockade. The addition of L-asparagine — the L-ASNase substrate — the nanopore-embedded enzyme molecule begins functioning, partially unblocking the nanopore. This is why the ion current increased after the addition of L-asparagine. Thus, the use of SSNPED with a 6-nm nanopore has allowed us to register functioning of L-ASNase at 25°С. Disaggregation of the enzyme at higher temperatures may, however, lead to passing of the enzyme through the nanopore instead of embedding in it.
The results of AFM study of L-ASNase denaturation are quite consistent with the data obtained by fluorescence spectroscopy. As was mentioned above in Section 3.3, fluorescence intensity at 308 nm I308 increased upon increasing temperature of the enzyme solution from 30 to 50 °С. Namely, the I308(T) dependence increased from 0.746 at 30°С to 0.775 at 40 °С, further reaching its maximum of 1.799 at 50°С. This increase in the I308 upon increasing the temperature indicated structural changes in the enzyme’s globules. Namely, the increase in fluorescence intensity indicates changes in the local microenvironment surrounding fluorescing chemical groups [20,21]. These changes accompany gradual unfolding of the globules and denaturation of the enzyme. Subsequent fluorescence decay with increasing T to 50°С can be explained by decreasing hydrophobicity of the microenvironment surrounding aromatic residues of amino acids exhibiting fluorescent properties [22,23] upon further denaturation and unfolding of the enzyme. At the highest temperature studied (60°С), no distinct fluorescence peak at 308 nm was distinguished, indicating denaturation of the enzyme.
5. Conclusions
The successful use of molecular detectors — atomic force microscope and solid state nanopore-based electrical detector — for single-molecule study of thermal denaturation of L-ASNase has been demonstrated. The results of the experiments with the electrical detector based on 6-nm solid-state nanopore formed in silicon nitride have indicated that the enzyme was functionally active at 25°C. By AFM, the height of mica-adsorbed L-ASNase has been found to decrease from 2.4 nm at 25°C down to 1.6 and 1.4 nm values within 35 to 45°C temperature range. At that, the number of mica-adsorbed L-ASNase particles considerably increased, reaching its maximum at 45°C. This indicated that changes in the enzyme’s globule structure, induced by thermal denaturation within this range of temperatures, favoured its adsorption onto mica. However, further elevation of temperature up to 55°C has led to a dramatic decrease in the enzyme adsorbability, which was accompanied by formation of filamentary structures on the mica surface. Furthermore, at highest temperature studied (60°C), the enzyme exhibited a complete loss of adsorbability on mica. The results obtained by AFM were consistent with the temperature dependence of fluorescence intensity of 0.1 µM L-ASNase solution at 308 nm recorded by fluorescence spectroscopy. Fluorescence spectroscopy data obtained indicated an increase in the enzyme solution intensity within 30 to 45°C temperature range. At 50°C, the fluorescence intensity decayed, and at 60 °C the fluorescence peak at 308 nm became indistinguishable, indicating denaturation of the enzyme. The results reported herein can be of use in further development of anti-cancer drugs.
Author Contributions
Conceptualization, Y.D.I.; methodology, Y.D.I. and A.N.A.; software, A.A.L.; validation, V.V.S., V.S.Z., I.N.S. and D.D.Z.; formal analysis, Y.D.I. and I.D.S.; investigation, E.E.V., V.S.Z., .A.N.A., V.V.S., A.F.K., N.V.V., D.V.L., A.S.B., and I.S.M.; resources, D.D.Z., D.V.L., A.S.B., and I.S.M.; data curation, E.E.V., A.N.A., A.F.K. O.N.A. and V.Y.T.; writing—original draft preparation, I.D.S. and Y.D.I.; writing—review and editing, I.D.S. and Y.D.I.; visualization, I.D.S.; supervision, A.I.A.; project administration, Y.D.I.; funding acquisition, A.I.A. All authors have read and agreed to the published version of the manuscript.
Funding
This work was financed by the Ministry of Science and Higher Education of the Russian Federation within the framework of Agreement No. 075-15-2024-643.
Data Availability Statement
The data underlying the research can be obtained from the corresponding author upon reasonable request.
Conflicts of Interest
The authors declare no conflicts of interest.
Appendix A
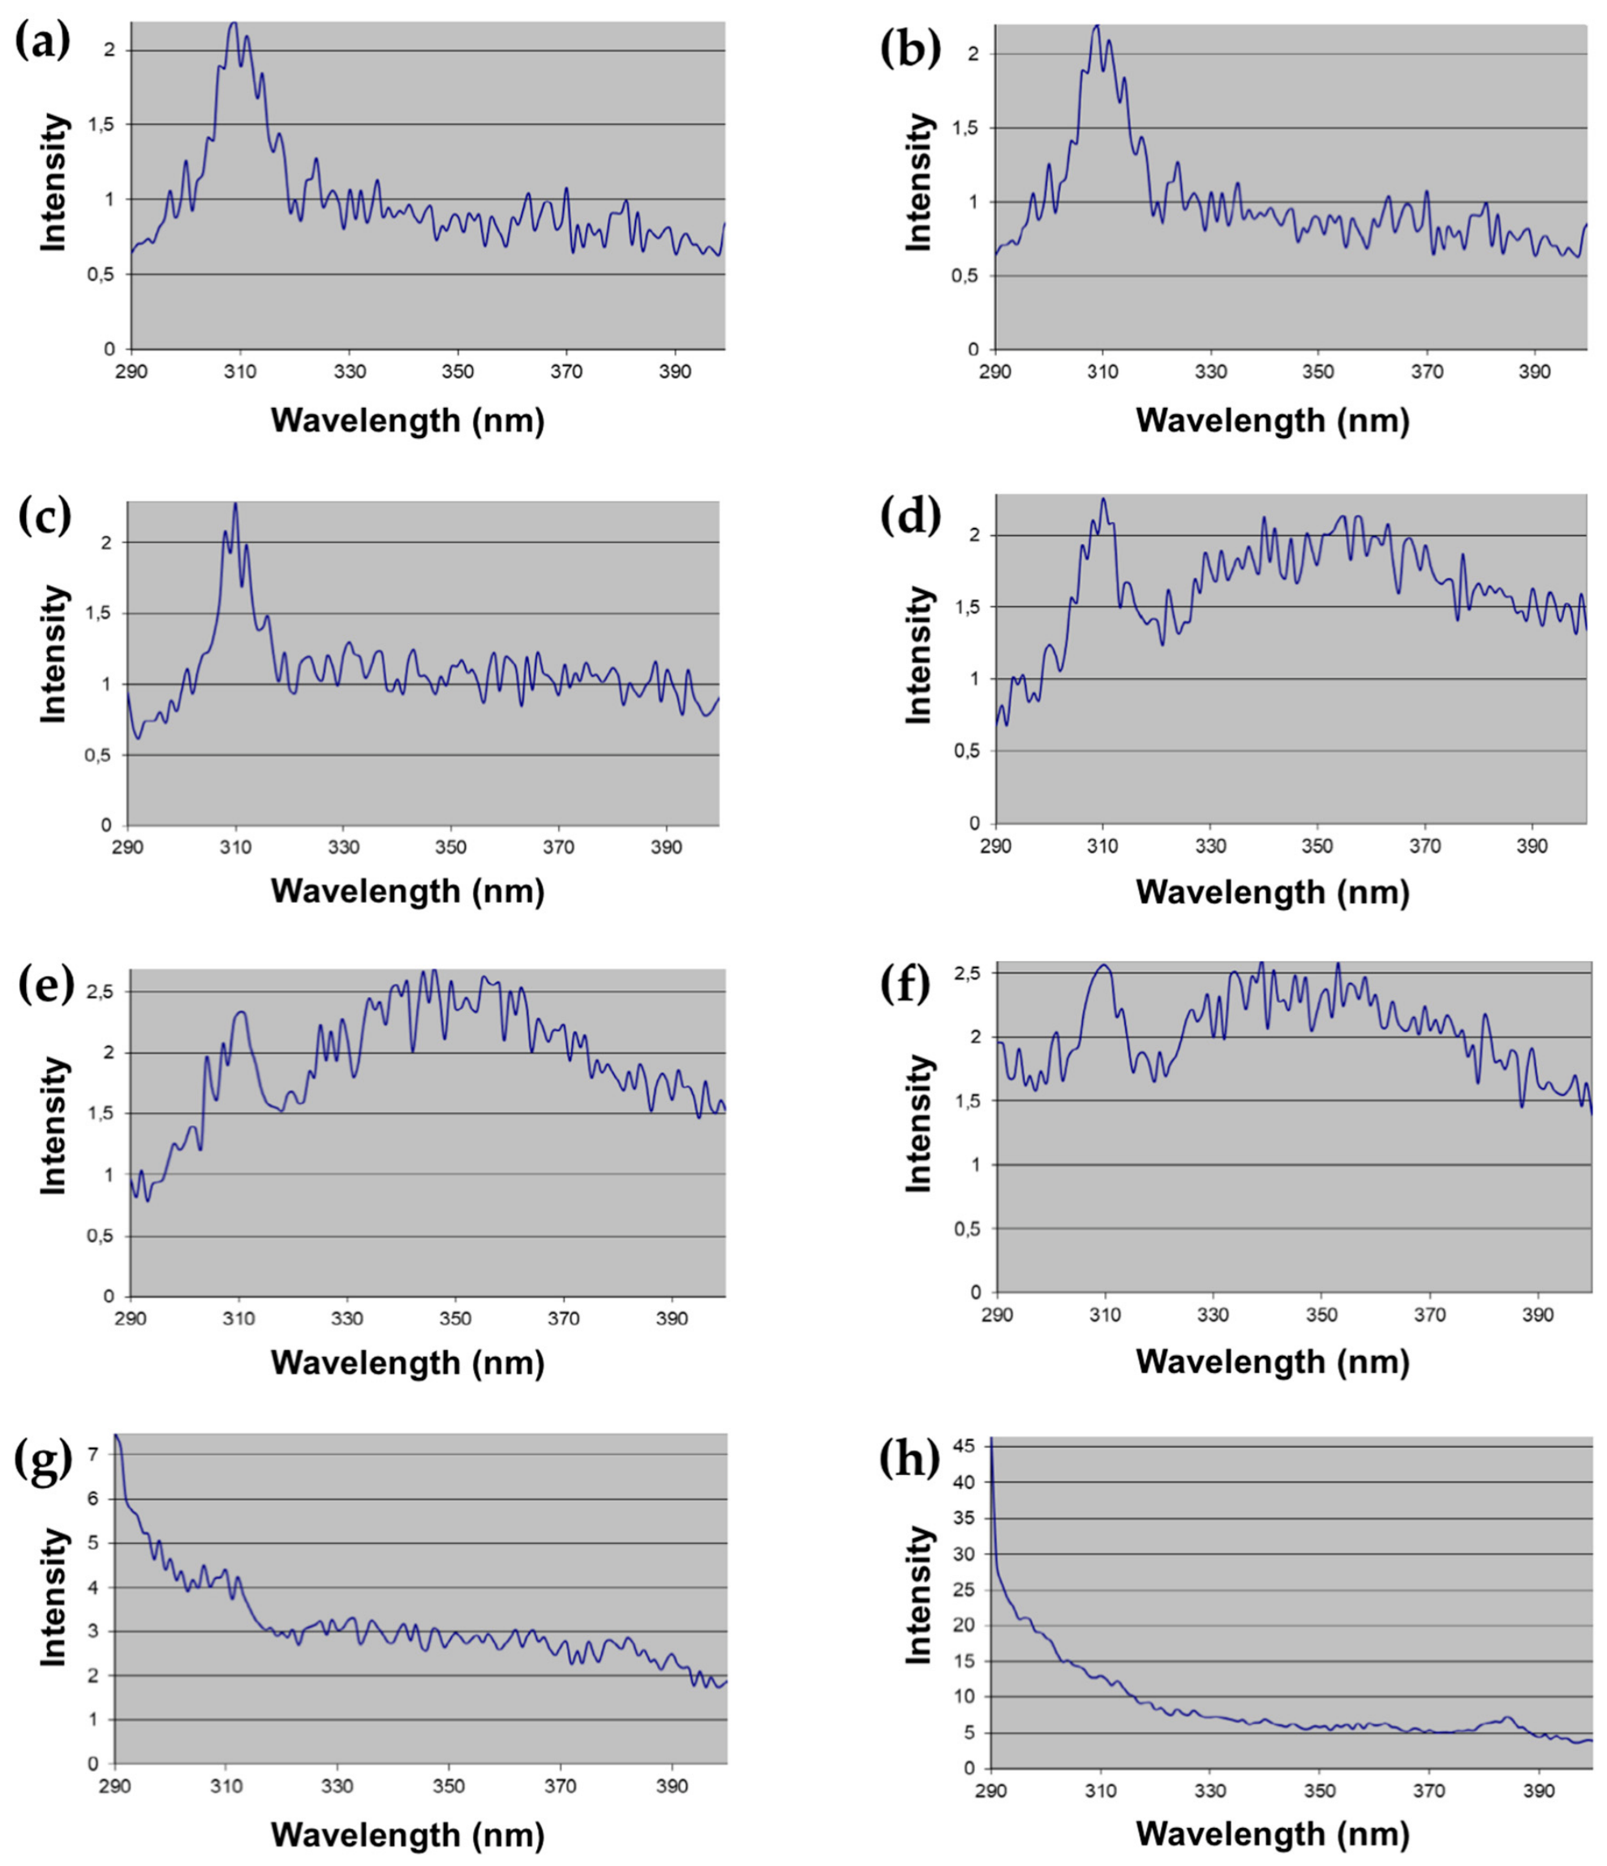
Figure A1 displays typical fluorescence spectra of 0.1 µM L-ASNase solution in 2 mM PBSD recorded within emission wavelength range from 290 to 400 nm at various temperatures ranging from 25 to 60 °C.
Figure A1.
Typical fluorescence spectra of 0.1 µM L-ASNase solution in 2 mM PBSD recorded at 25 °C (a), 30 °C (b), 35 °C (c), 40 °C (d), 45 °C (e), 50 °C (f), 55 °C (g), and 60°C (h). Experimental conditions: excitation wavelength 280 nm, optical pathlength 10 mm (1 cm).
Figure A1.
Typical fluorescence spectra of 0.1 µM L-ASNase solution in 2 mM PBSD recorded at 25 °C (a), 30 °C (b), 35 °C (c), 40 °C (d), 45 °C (e), 50 °C (f), 55 °C (g), and 60°C (h). Experimental conditions: excitation wavelength 280 nm, optical pathlength 10 mm (1 cm).
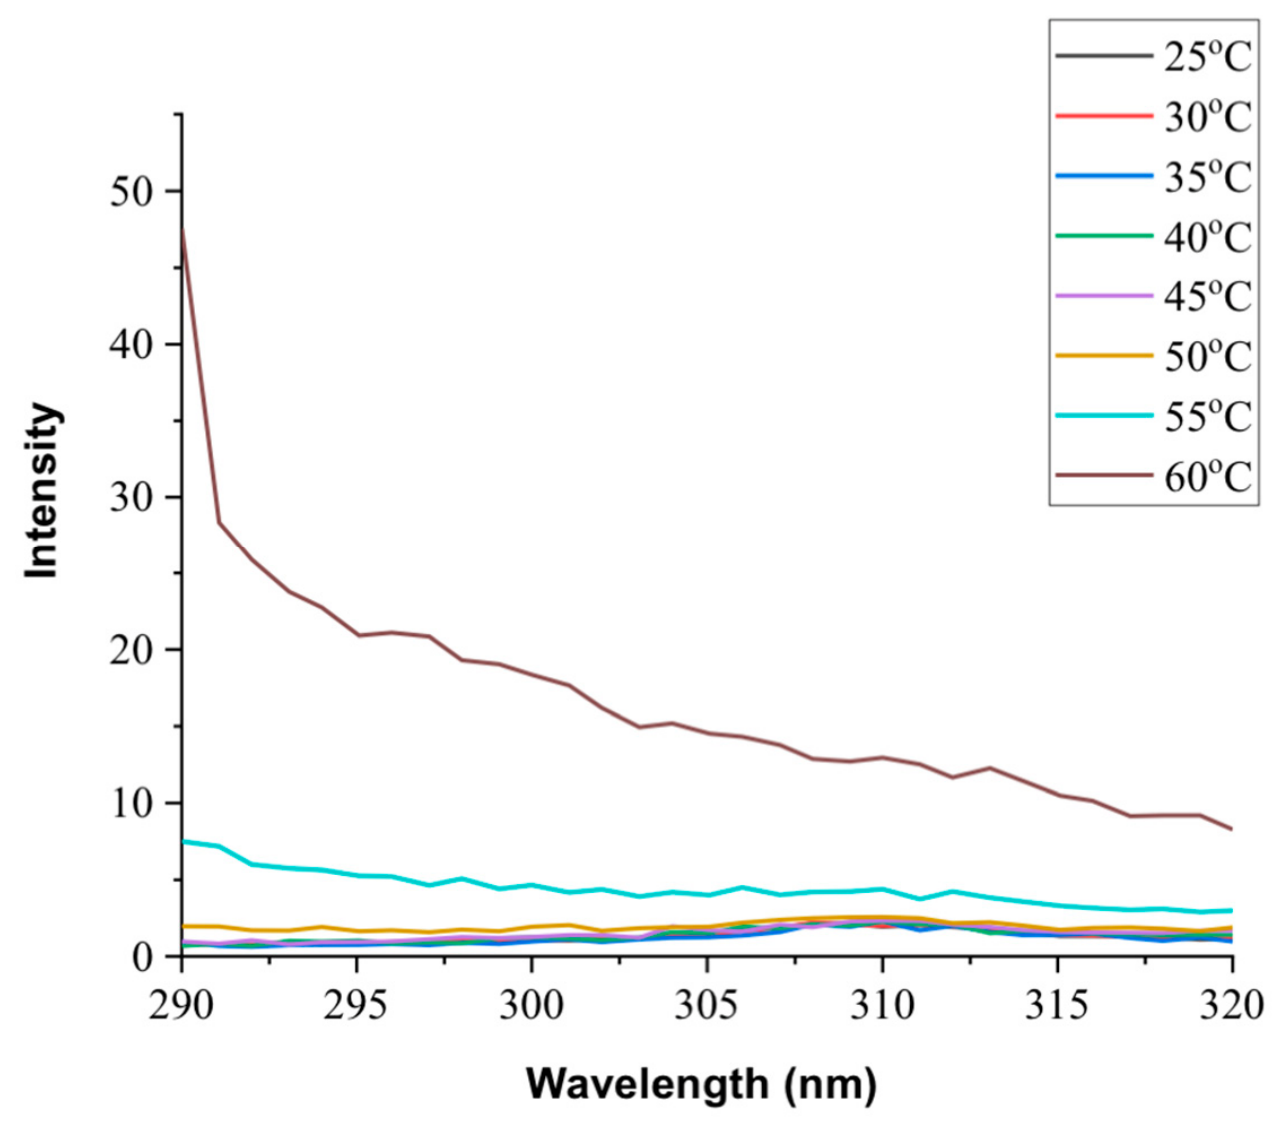
Measurements at each temperature were repeated in three technical replicates. Then, the spectra recorded at each of the temperatures studied were averaged. The resulting averaged fluorescence spectra of 0.1 µM L-ASNase solution in 2 mM PBSD are shown in Fig. A2.
Figure A2.
Averaged fluorescence spectra of 0.1 µM L-ASNase solution in 2 mM PBSD. Experimental conditions: excitation wavelength 280 nm, optical pathlength 10 mm (1 cm).
Figure A2.
Averaged fluorescence spectra of 0.1 µM L-ASNase solution in 2 mM PBSD. Experimental conditions: excitation wavelength 280 nm, optical pathlength 10 mm (1 cm).
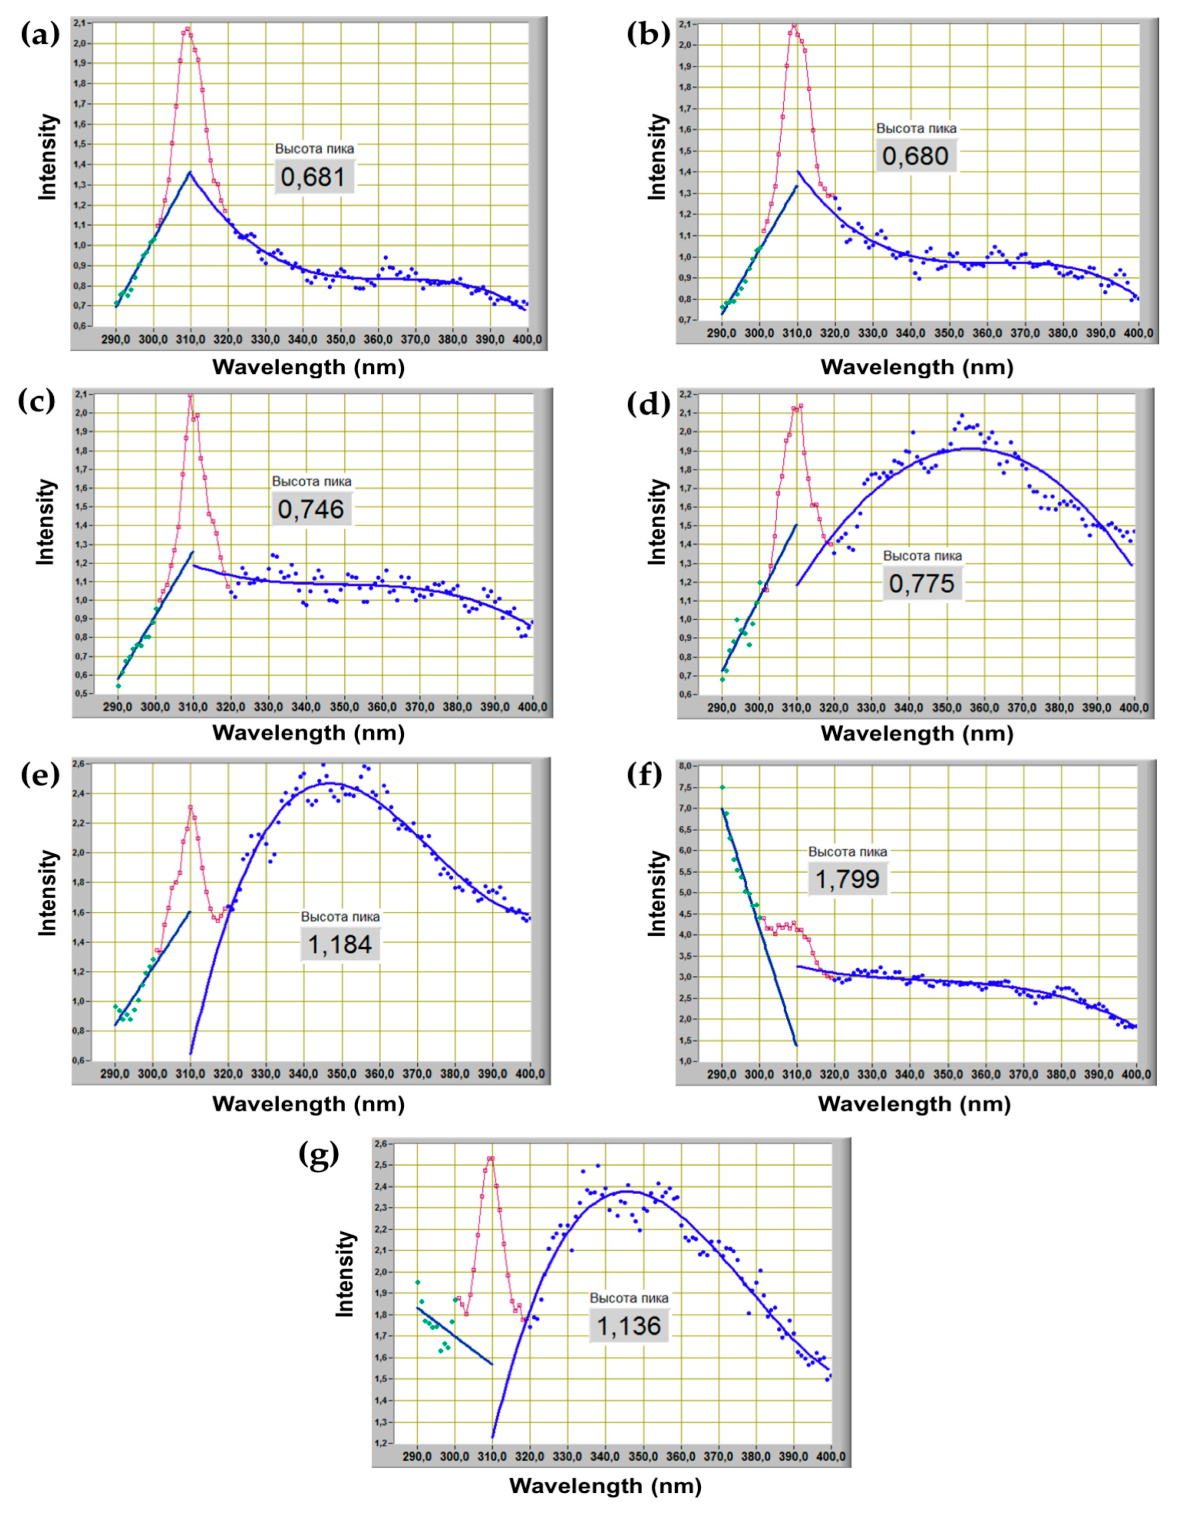
In the most measurements, the central maximum of fluorescence intensity was observed at 308 nm. Figure A3 displays fluorescence spectra of 0.1 µM L-ASNase solution in 2 mM PBSD (magenta curves) and background fluorescence spectra (blue curves) plotted using a LabView software (v. 6.1); numerical values in grey boxes indicate the resulting calculated I308 values. Based on the latter, the resulting temperature dependence of fluorescence intensity at 308 nm I308 (which is shown in Figure 6 in the main text) was obtained.
Figure A3.
Fluorescence spectra of 0.1 µM L-ASNase solution in 2 mM PBSD (magenta curves) and background fluorescence spectra (blue curves) recorded at 25 °C (a), 30 °C (b), 35 °C (c), 40 °C (d), 45 °C (e), 50 °C (f), and 55 °C (g). Numbers in grey boxes indicate the resulting I308 values in each case. Experimental conditions: excitation wavelength 280 nm, optical pathlength 10 mm (1 cm).
Figure A3.
Fluorescence spectra of 0.1 µM L-ASNase solution in 2 mM PBSD (magenta curves) and background fluorescence spectra (blue curves) recorded at 25 °C (a), 30 °C (b), 35 °C (c), 40 °C (d), 45 °C (e), 50 °C (f), and 55 °C (g). Numbers in grey boxes indicate the resulting I308 values in each case. Experimental conditions: excitation wavelength 280 nm, optical pathlength 10 mm (1 cm).
References
- Michalska, K.; Jaskolski, M. Structural aspects of L-asparaginases, their friends and relations. Acta Biochim. Pol. 2006, 53(4), 627–640. [Google Scholar] [CrossRef] [PubMed]
- Batool, T.; Makky, E.A.; Jalal, M.; Yusoff, M.M. A Comprehensive Review on L-Asparaginase and Its Applications. Appl. Biochem. Biotechnol. 2016, 178, 900–923. [Google Scholar] [CrossRef] [PubMed]
- Aguayo, A.; Cortes, J.; Thomas, D.; Pierce, S.; Keating, M.; Kantarjian, H. Combination therapy with methotrexate, vincristine, polyethylene-glycol conjugated-asparaginase, and prednisone in the treatment of patients with refractory or recurrent acute lymphoblastic leukemia. Cancer 1999, 86(7), 1203–1209. [Google Scholar] [CrossRef]
- Verma, N.; Kumar, K.; Kaur, G.; Anand, S. L-Asparaginase: A Promising Chemotherapeutic Agent. Clin. Rev. Biotechnol. 2007, 27, 45–62. [Google Scholar] [CrossRef] [PubMed]
- Okuda, K.; Umemura, A.; Kataoka, S.; et al. Enhanced Antitumor Effect in Liver Cancer by Amino Acid Depletion-Induced Oxidative Stress. Front. Oncol. 2021, 11, 758549. [Google Scholar] [CrossRef] [PubMed]
- Karpel-Massler, G.; Ramani, D.; Shu, C.; Halatsch, M.-E.; Westhoff, M.-A.; Bruce, J.N.; Canoll, P.; Siegelin, M.D. Metabolic reprogramming of glioblastoma cells by L-asparaginase sensitizes for apoptosis in vitro and in vivo. Oncotarget 2016, 7(23), 33512–33528. [Google Scholar] [CrossRef] [PubMed]
- Whitecar, J.P.; et al. L-Asparaginase. N. Engl. J. Med. 1970, 282(13), 732–734. [Google Scholar] [CrossRef] [PubMed]
- Ivanov, Y.D.; Pleshakova, T.O.; Shumov, I.D.; Kozlov, A.F.; Ivanova, I.A.; Valueva, A.A.; Tatur, V.Y.; Smelov, M.V.; Ivanova, N.D.; Ziborov, V.S. AFM imaging of protein aggregation in studying the impact of knotted electromagnetic field on a peroxidase. Sci. Rep. 2020, 10, 9022. [Google Scholar] [CrossRef] [PubMed]
- Ivanov, Y.D.; Shumov, I.D.; Kozlov, A.F.; Ershova, M.O.; Valueva, A.A.; Ivanova, I.A.; Tatur, V.Y.; Lukyanitsa, A.A.; Ivanova, N.D.; Ziborov, V.S. Stopped Flow of Glycerol Induces the Enhancement of Adsorption and Aggregation of HRP on Mica. Micromachines 2023, 14, 1024. [Google Scholar] [CrossRef] [PubMed]
- Crampton, N.; Bonass, W.A.; Kirkham, J.; Thomson, N.H. Formation of aminosilane-functionalized mica for atomic force microscopy imaging of DNA. Langmuir 2005, 21, 7884–7891. [Google Scholar] [CrossRef] [PubMed]
- Ivanov, Y.D.; Vinogradova, A.V.; Nevedrova, E.D.; Ableev, A.N.; Kozlov, A.F.; Shumov, I.D.; Ziborov, V.S.; Afonin, O.N.; Vaulin, N.V.; Lebedev, D.V.; et al. Solid-State Nanopore-Based Nanosystem for Registration of Enzymatic Activity of a Single Molecule of Cytochrome P450 BM3. Int. J. Mol. Sci. 2024, 25, 10864. [Google Scholar] [CrossRef] [PubMed]
- Ivanov, Y.D.; Ableev, A.N.; Shumov, I.D.; Ivanova, I.A.; Vaulin, N.V.; Lebedev, D.V.; Bukatin, A.S.; Mukhin, I.S.; Archakov, A.I. Registration of Functioning of a Single Horseradish Peroxidase Macromolecule with a Solid-State Nanopore. Int. J. Mol. Sci. 2023, 24, 15636. [Google Scholar] [CrossRef] [PubMed]
- Tan, S.W.; Gu, D.J.; Liu, H.; Liu, Q.J. Detection of a single enzyme molecule based on a solid-state nanopore sensor. Nanotechnology 2016, 27, 155502. [Google Scholar] [CrossRef] [PubMed]
- Papageorgiou, A.C.; Posypanova, G.A.; Andersson, C.S.; Sokolov, N.S.; Krasotkina, J. Structural and functional insights into Erwinia Carotovora L-asparaginase. FEBS J. 2008, 275(17), 4306–4316. [Google Scholar] [CrossRef] [PubMed]
- Kiselyova, O.I.; Yaminsky, I.V.; Ivanov, Yu.D.; Kanaeva, I.P.; Kuznetsov, V.Y.; Archakov, A.I. AFM study of membrane proteins, cytochrome P450 2B4, and NADPH–Cytochrome P450 reductase and their complex formation. Arch. Biochem. Biophys. 1999, 371(1), 1–7. [Google Scholar] [CrossRef] [PubMed]
- Pleshakova, T.O.; Kaysheva, A.L.; Shumov, I.D.; Ziborov, V.S.; Bayzyanova, J.M.; Konev, V.A.; Uchaikin, V.F.; Archakov, A.I.; Ivanov, Y.D. Detection of hepatitis C virus core protein in serum using aptamer-functionalized AFM chips. Micromachines 2019, 10, 129. [Google Scholar] [CrossRef] [PubMed]
- Davies, P. F.; Rennke, H. G.; Cotran, R. S. Influence of molecular charge upon the endocytosis and intracellular fate of peroxidase activity in cultured arterial endothelium. J. Cell Sci. 1981, 49(1), 69–86. [Google Scholar] [CrossRef] [PubMed]
- Welinder, K.G. Amino acid sequence studies of horseradish peroxidase. amino and carboxyl termini, cyanogen bromide and tryptic fragments, the complete sequence, and some structural characteristics of horseradish peroxidase C. Eur. J. Biochem. 1979, 96, 483–502. [Google Scholar] [CrossRef] [PubMed]
- Yamashita, Y.; Tanoue, E. Chemical characterization of protein-like fluorophores in DOM in relation to aromatic amino acids. Mar. Chem. 2003, 82, 255–271. [Google Scholar] [CrossRef]
- Alexandrov, A.I.; Mileni, M.; Chien, E.Y.T.; Hanson, M.A.; Stevens, R.C. Microscale fluorescent thermal stability assay for membrane proteins. Structure 2008, 16(3), 351–359. [Google Scholar] [CrossRef] [PubMed]
- Vivian, J.T.; Callis, P.R. Mechanisms of Tryptophan Fluorescence Shifts in Proteins. Biophys. J. 2001, 80, 2093–2109. [Google Scholar] [CrossRef] [PubMed]
- Zhang, R.; Wu, Q.; Liu, R. Characterizing the binding interaction between ultrafine carbon black (UFCB) and catalase: Electron microscopy and spectroscopic analysis. RSC Adv. 2017, 7(67), 42549–42558. [Google Scholar] [CrossRef]
- Zhao, Y.; Wang, X.; Wang, L.; Vendrell, M.; Wang, H. Design, Synthesis, and Applications of Fluorescent Amino Acids in Bioimaging. Chem. Biomed. Imaging 2026. [Google Scholar] [CrossRef]
Figure 1.
TEM image of a 6 nm nanopore formed in a 40-nm-thick SiN chip by EBD.
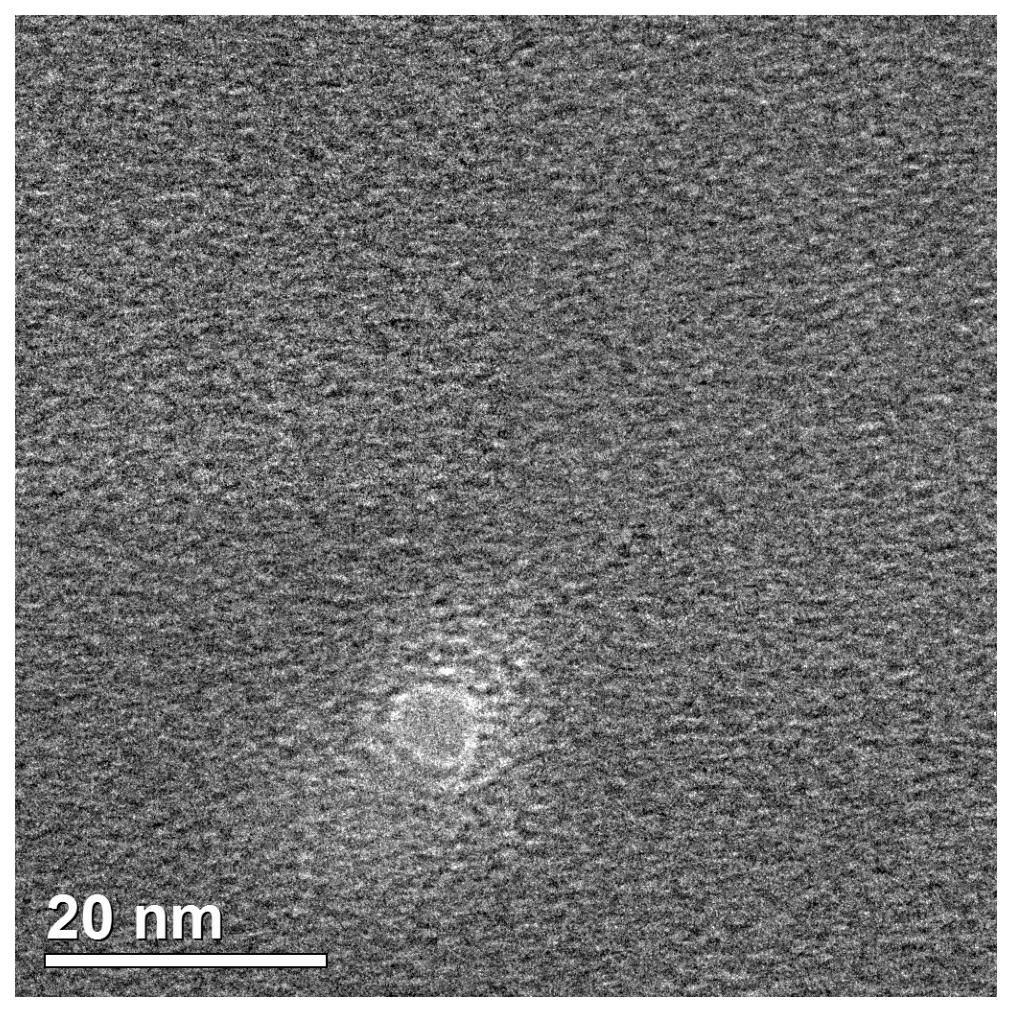
Figure 2.
Typical time dependence of the ion current through the nanopore obtained in the SSNPED experiments on the registration of L-ASNase functionality.
Figure 2.
Typical time dependence of the ion current through the nanopore obtained in the SSNPED experiments on the registration of L-ASNase functionality.
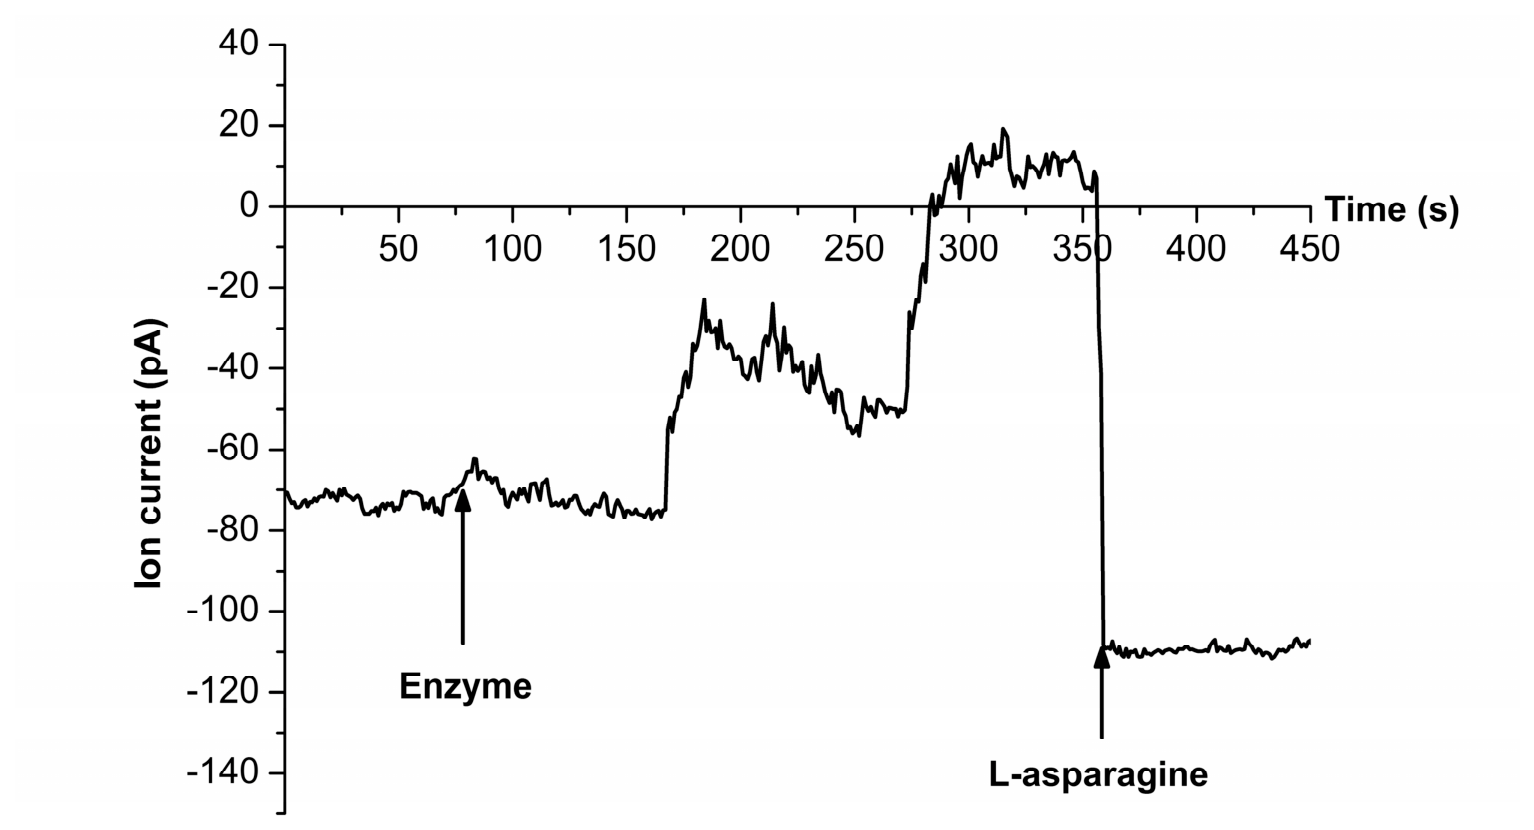
Figure 3.
Typical AFM images and cross-section profiles of L-ASNase adsorbed on mica from its solutions treated at 25°С (a), 30°С (b), 45°С (c), or 55°С (d). Black ellipses mark areas of mica surface with denatured enzyme structures.
Figure 3.
Typical AFM images and cross-section profiles of L-ASNase adsorbed on mica from its solutions treated at 25°С (a), 30°С (b), 45°С (c), or 55°С (d). Black ellipses mark areas of mica surface with denatured enzyme structures.
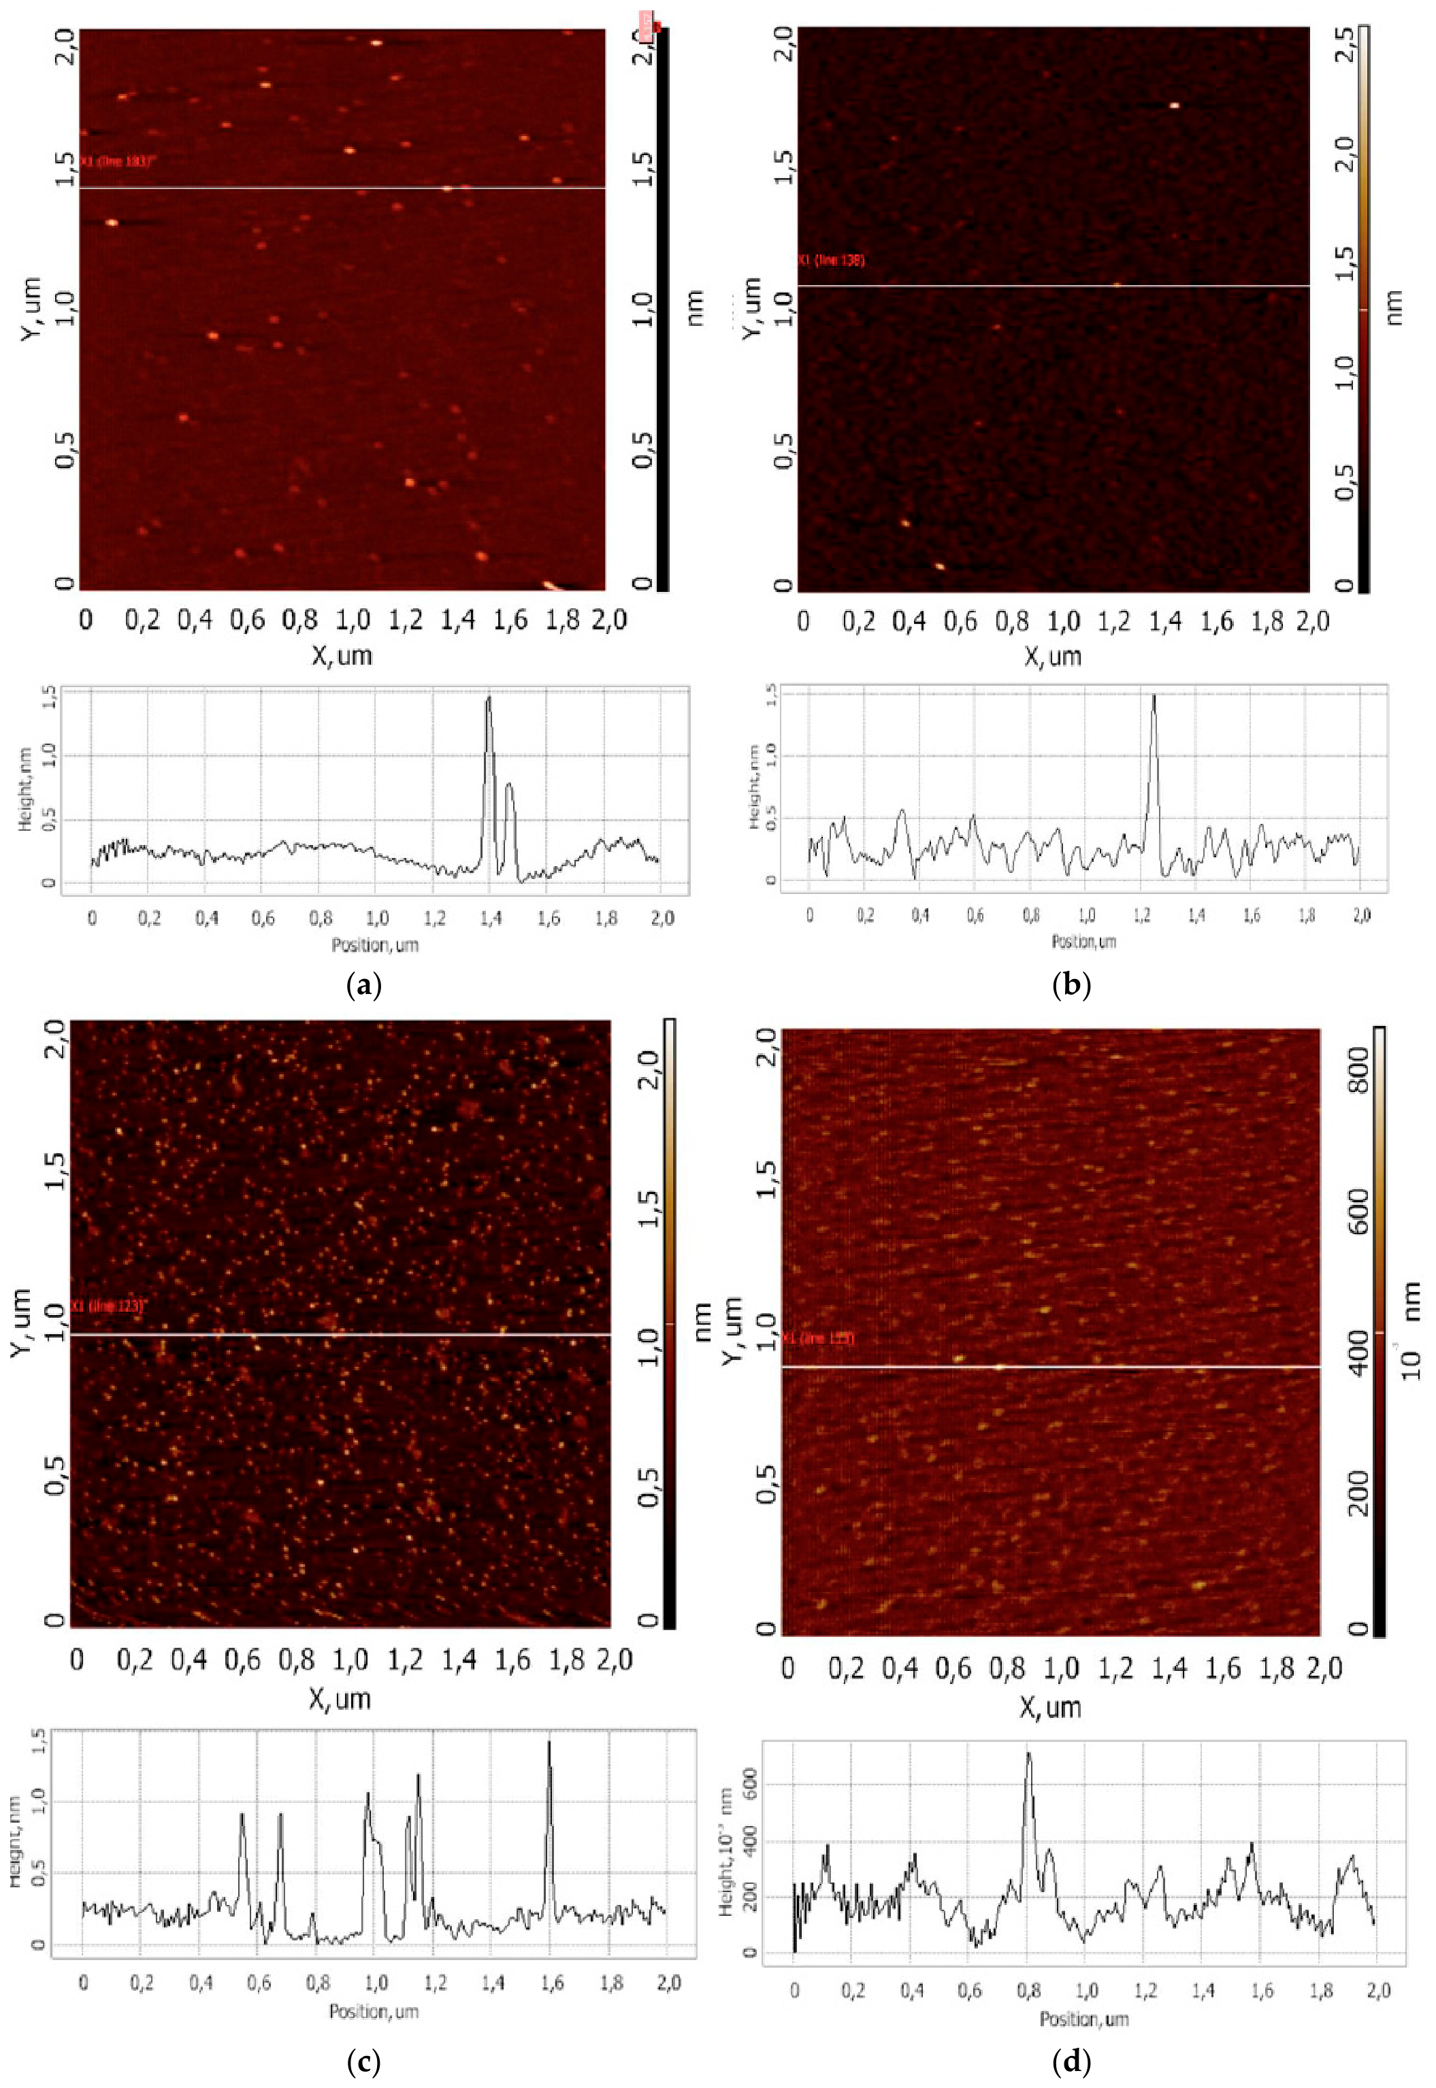
Figure 4.
Typical plots of ρ(h) distributions obtained for the enzyme samples treated at 25°С (blue curve), 30°С (orange curve), 45°С (green curve), or 55°С (red curve).
Figure 4.
Typical plots of ρ(h) distributions obtained for the enzyme samples treated at 25°С (blue curve), 30°С (orange curve), 45°С (green curve), or 55°С (red curve).
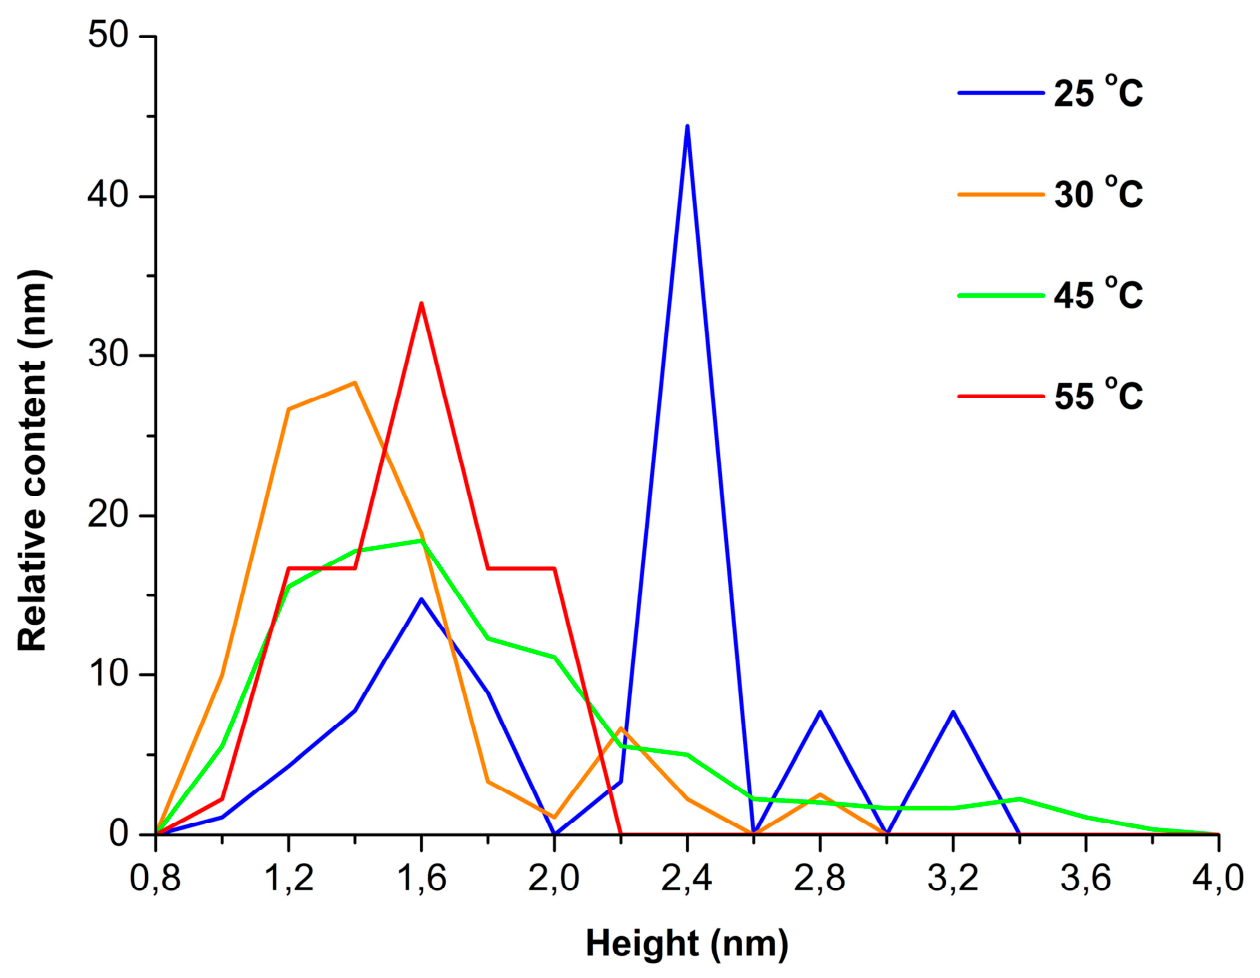
Figure 5.
UV-Vis absorbance spectrum of 1 µM L-ASNase solution in 2 mM PBSD. Experimental conditions: optical pathlength 2 mm, temperature 25 °C.
Figure 5.
UV-Vis absorbance spectrum of 1 µM L-ASNase solution in 2 mM PBSD. Experimental conditions: optical pathlength 2 mm, temperature 25 °C.
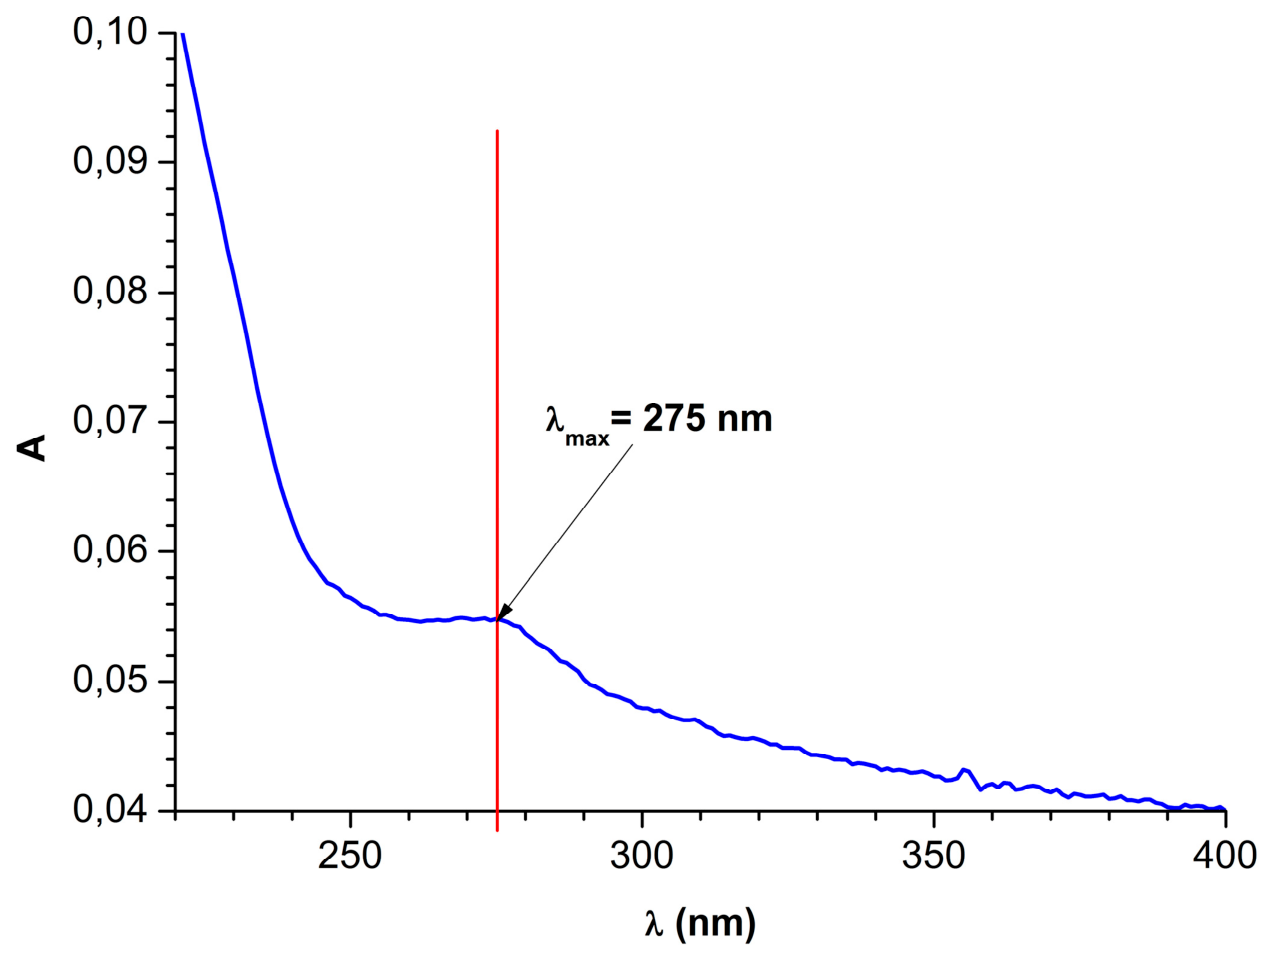
Figure 6.
Temperature dependence of fluorescence intensity I308(T) of 0.1 µM L-ASNase solution in 2 mM PBSD at 308 nm. Experimental conditions: excitation wavelength 280 nm, optical pathlength 10 mm (1 cm). The I308 values were obtained after subtracting background intensity as described in Appendix A.
Figure 6.
Temperature dependence of fluorescence intensity I308(T) of 0.1 µM L-ASNase solution in 2 mM PBSD at 308 nm. Experimental conditions: excitation wavelength 280 nm, optical pathlength 10 mm (1 cm). The I308 values were obtained after subtracting background intensity as described in Appendix A.
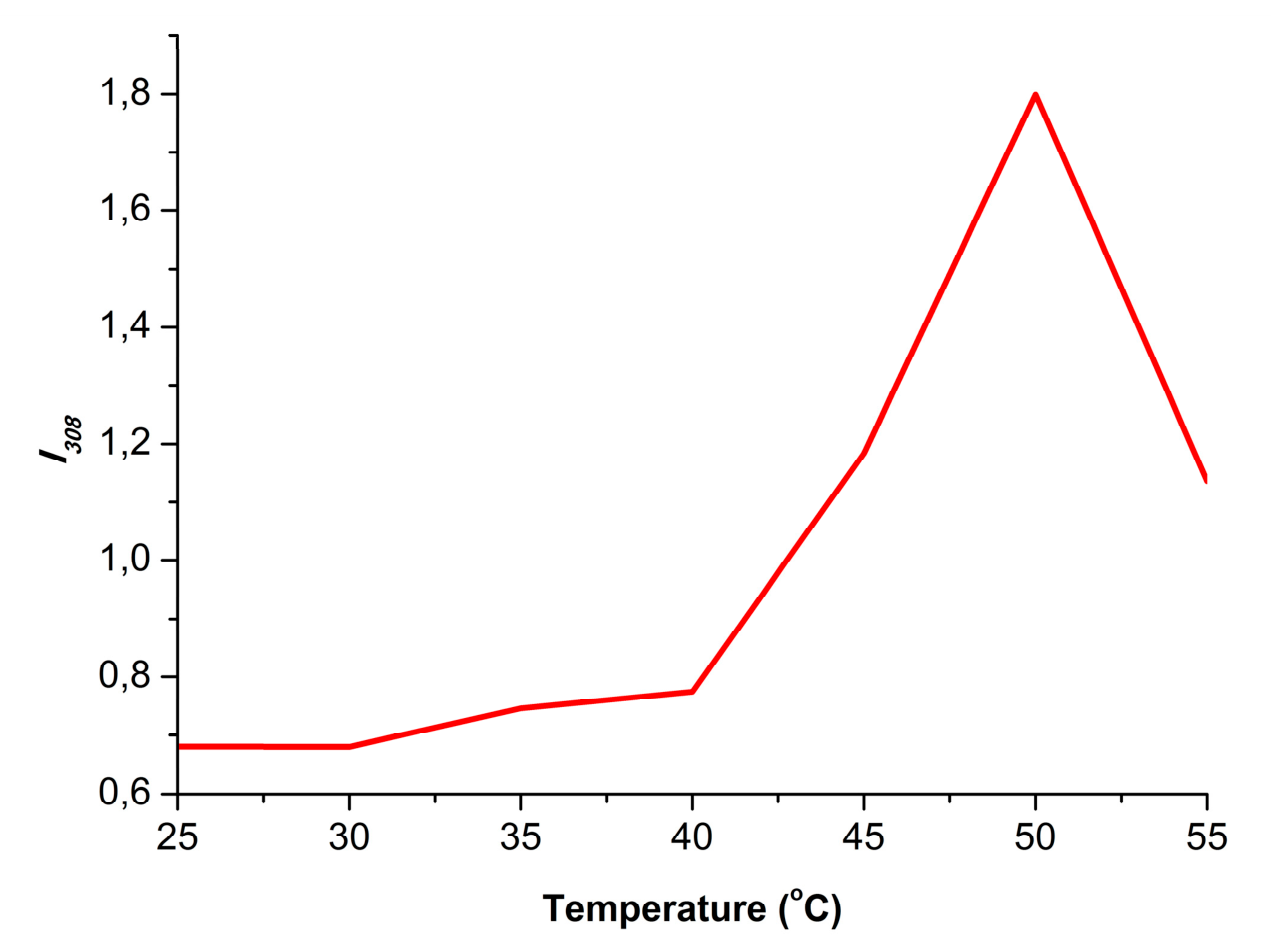

Table 1.
Number N400 of mica-adsorbed L-ASNase particles normalized per 400 µm2 area of the AFM substrate.
Table 1.
Number N400 of mica-adsorbed L-ASNase particles normalized per 400 µm2 area of the AFM substrate.
| Temperature, degrees Сelsius | N400 |
| 25 | 1003 |
| 30 | 540 |
| 45 | 1605 |
| 55 | 159 separate molecules, enzyme denaturation with formation of filamentary structures is observed |
| 60 | No objects |
Disclaimer/Publisher’s Note: The statements, opinions and data contained in all publications are solely those of the individual author(s) and contributor(s) and not of MDPI and/or the editor(s). MDPI and/or the editor(s) disclaim responsibility for any injury to people or property resulting from any ideas, methods, instructions or products referred to in the content. |
© 2026 by the authors. Licensee MDPI, Basel, Switzerland. This article is an open access article distributed under the terms and conditions of the Creative Commons Attribution (CC BY) license.
Copyright: This open access article is published under a Creative Commons CC BY 4.0 license, which permit the free download, distribution, and reuse, provided that the author and preprint are cited in any reuse.