Submitted:
31 December 2025
Posted:
01 January 2026
You are already at the latest version
Abstract
This study examines how investment efficiency and risk jointly shape grain supply-chain upgrading. Using firm-level panel data for 25 listed grain supply-chain firms in China from 2015 to 2023, this study examines efficiency–risk structures and their heterogeneity across upstream, midstream, and downstream segments. A three-stage data envelopment analysis (DEA) is applied to measure investment efficiency while controlling for environmental heterogeneity and statistical noise, and a multidimensional investment risk index is constructed using principal component analysis (PCA). The results reveal a clear supply-chain gradient: downstream firms exhibit consistently high investment efficiency with low risk, upstream firms remain characterized by low efficiency and higher risk exposure, and midstream firms display improving efficiency accompanied by pronounced risk volatility. Efficiency decomposition shows that upstream inefficiency is mainly driven by scale inefficiency rather than insufficient pure technical efficiency. Joint efficiency–risk mapping further indicates that efficiency–risk mismatch constitutes a key micro-level constraint on supply-chain upgrading, as high efficiency alone fails to sustain investment under elevated risk. These findings provide micro-level evidence on efficiency–risk alignment and offer policy-relevant insights for segment-specific interventions to improve scale efficiency, mitigate risk, and promote coordinated upgrading in grain supply chains.
Keywords:
grain supply chain
; investment efficiency
; investment risk
; efficiency‐risk mismatch
; supply chain upgrading
1. Introduction
Global grain supply chains have, in recent years, been exposed to multiple compounded shocks as a result of climate change, geopolitical uncertainty, and price volatility, resulting in supply-chain upgrading and structural optimization becoming key instruments in the protection of food security as well as food competitiveness [1,2]. The grain supply chain in China is developed through various levels, starting with the primary production, passing through the processing and distribution stage, and is marked by a large number of heterogeneous companies and multifaceted organizational systems. The efficiency and risk profile of the firms through these stages does not only determine the performance of individual firms but also directly affect national food security policies and the greater agenda on the modernization of agriculture. With China making positive progress towards the goal of developing an integrated modern agri-food supply chain, the choices of resource allocation of firms in various segments of the supply-chain have become more and more decisive. The interaction between the efficiency of investment and investment risk dynamic channel in this respect is a major micro-level basis on which drivers and constraints of grain supply-chain upgrading are understood.
In a microeconomic approach, upgrading of the supply-chain is deeply in the investment decision-making of the firms as agents in the market. In differentiating capital, labor and technological inputs among the various parts of the supply chain, the companies are not only able to trust their own proceeding but have a structural outlay of restructuring the industry chain over time [3]. When a particular segment exhibits higher investment efficiency and lower risk exposure, companies tend to inject more funds in the segment, hence leading to scale growth and functional upgrading. On the other hand, when the upgrading segments have high risk or comparatively low efficiency, then the companies have a tendency not to redirect their resources to production processes that have higher value-added and inhibit supply-chain upgrading [4]. Based on this, the issue of determining the attractiveness of various segments of a supply-chain, using a dual response of both investment efficiency and the level of risk, is important in explaining the micro-level mechanisms that drive agricultural supply-chain upgrading.
Nevertheless, even with the increasing amount of research concerning efficiency and risk in investment, empirical research that addresses both efficiency and risk at the same analytical level and makes comparatively uniform analysis across segments of the supply chain is often rare. The available literature has also been majorly either concerned with enhancing the technical performance within an agricultural or manufacturing firm [5,6,7] or in understanding how the financial and operational risks of firms and their financial results are linked to each other [8], the two strands of study normally emerging independently of each other. Simultaneously, macro-level policy perspectives or industry-structure approaches [9,10] have been by far the predominant point-of-view in agricultural supply-chain upgrading studies, and there have been many fewer applications of firm-level microdata to describe segment-specific efficiency gaps and risk or exposure. Consequently, there is a significant shortage of systematic data on the effect of efficiency–risk mismatches in determining supply-chain upgrading dynamics. It is not only this gap, which impairs theoretical knowledge but also restricts the structure of more specific and efficient policies aimed at supply-chain upgrading.
It is against this background that this paper outlines the concept of efficiency–risk mismatch to answer the following key question: are there systematic differences between investment efficiency and investment risk between the various segments of a supply-chain, and do the possible existence of these differences limit upgrading dynamics of the grain supply chain? To operationalize this question, we consider three distinct issues: Do the upstream, midstream and downstream firms differ systematically in efficiency in the risk involved in investing; do the structures of risk differ across these segments; and do unstructured differentiations of risk combined with differentiations in efficiency create a structure of mismatch that reinvigorates upgrading incentives and routes?
In this regard, we create a three-stage DEA model to quantify the efficiency of firm-level investment and utilize the PCA to create a multidimensional index of investment risk. We describe the efficiency–risk structure segment specificity along the upstream–midstream–downstream line by using panel data of 25 representative listed grain companies in China between 2015 and 2023. There are three key contributions in the research as compared to previous research. First, it combines investment efficiency and risk in a single assessment scheme and formally pushes the concept of the efficiency–risk mismatch. Second, it will offer a new micro-level explanation of the upgrading of agricultural supply-chains because it highlights behavior at the firm level. Third, it provides a comparative efficiency–risk evaluation level across a supply-chain segmentation, which provides quantitative evidence and can be used to support more focused policy interventions.
The remainder of the paper is organized as follows. Section 2 reviews the related literature; Section 3 describes the research design, including efficiency measurement, risk index construction, and data sources; Section 4 presents the empirical results; and Section 5 concludes with a discussion of key findings and policy implications.
2. Literature Review
2.1. The Theoretical Basis and Measurement Methods of Enterprise Investment Efficiency
The efficiency of corporate investment is the subject of research traceable to the input–output theory that revolves around measuring whether companies could efficiently utilize their inputs of capital, costs and labor to productive outputs [11]. DEA and stochastic frontier analysis (SFA) have become the two most popular methodological frameworks in the global literature in the field of empirical applications. DEA is especially appreciated because it can measure relative efficiency without imposing a priori assumptions on the production function, and therefore has been extensively used in manufacturing, food processing, energy, and other industries [12,13,14,15]. The EA models, however, cannot identify the managerial inefficiency and exogenous environmental heterogeneity. In order to overcome this drawback, Fried et al. [16] established the three-stage DEA model that uses the SFA regressions to eliminate the environmental impacts and statistical errors in the input slacks, increasing the comparability of efficiency estimates among the firms and industries. Due to these benefits, the three-stage DEA method was increasingly implemented in the research of corporate efficiency in investment, or other similar topics, such as green efficiency and digital efficiency [17,18,19,20].
In relation to the truths of corporate investment efficiency, literature has generally approached the analysis of firm behavior in two extensive dimensions: internal governance systems and external operating conditions [21,22,23]. This analytical framework has been applied to other categories of firms within the context of the grain supply chain, where empirical studies have evaluated efficiency performance and its drivers at production stage, processing stage, distribution stage, and retail stage. In particular, the research on the upstream segments, like cultivating and primary processing, has highlighted the implications as to how the natural conditions, production cost and input constraint influence the efficiency of the investment made by the firms [24,25,26]. Conversely, studies have been conducted to identify the significance of the mid-stream operations such as processing and storage–logistics to making efficiency gains, and the results in this area have emphasized economies of scale, technological changes and structuring of production [27,28]. In the downstream segments that touch on branding and retail, literature has put more emphasis on market-channel development, consumer preference and abilities of managing brands as key determinants of investment returns and efficiencies of operations [29,30].
Regardless of the massive evidence proved by the existing studies about the measurement of corporate efficiency and its determinants, there are still significant limitations. To begin with, the majority of analyses are limited to one segment of the supply-chain, little effort is taken to systematically compare investment efficiency in upstream, midstream, and downstream supply-chain in a vertically integrated supply-chain view. Second, efficiency research has successfully pursued by-and-large distinct paths over time, and research on risk has successfully pursued distinct paths, although not many studies have integrated investment efficiency and financial risk into a single analytical platform to investigate their potential mismatch. Consequently, the contextual processes through which the efficiency–risk misalignment models the firms’ investment behavior and, ultimately, the supply-chain upgrading, are not fully comprehended. Based on this, a comparative analysis of investment efficiency and risk structures within the supply-chain segments with microdata of firms is imperative to define the key bottlenecks in upgrading, describe the logic of factor reallocation, and develop the evolutionary dynamics of the agricultural supply chains, with fruitful theoretical and empirical prospects.
2.2. Multi-Dimensional Construction and Comprehensive Assessment of Enterprise Investment Risks
Corporate investment risk is multidimensional, dynamic and systemic by nature. Its sources include not only the general financial risks, including capital structure weakness, liquidity measures, and earnings variations, but also those peculiar to the agricultural and food-related companies, like price fluctuations, seasonality, unpredictability of supply and seasonal demand, and natural and biological risks [31,32,33,34]. Conventional research has mainly used one financial variable to rank firms’ risk exposure, which is either leverage ratios or liquidity ratios. But an accumulating literature reveals that it is not possible to effectively capture several aspects of risk, including leverage intensity, solvency capacity, earnings stability and quality of operations [35,36,37] simultaneously.
In order to overcome the issue of high inter-correlation of risk indicators and subsequent “indicator fragmentation”, recent studies have been using PCA to generate composite risk indices to a larger extent [38,39,40]. Through the extraction of shared latent factors of various risk factors, PCA minimizes the dimension and the explanatory variance of the risk. It has, therefore, exhibited evident benefits regarding empirical research on financial risk, systemic risk and supply-chain risk [41,42,43].
2.3. The Driving Mechanism for the Upgrading of the Grain Supply Chain
Supply-chain upgrading is most often analyzed in the realms of industrial economics and development economics in terms of global value chain (GVC) analysis. The conceptualizations of the seminal literature of upgrading present upgrading as a network of mutually connecting pathways, the most prominent of which are process upgrading, product upgrading and functional upgrading, where the firms advance their place in the value chain through improvement of technological advancement, streamlined organizational structure or an enhancement of relevant capacities [44,45,46,47]. Within this framework, supply-chain upgrading is generally considered a key tool in adding value through enhancing industrial competitiveness and has been used extensively in empirical studies of manufacturing, agri-food processing and the food industry, in general [48,49,50].
Studies examining the supply-chain upgrading drivers have also been conducted mainly on macro and meso levels, specifically the technological innovation, government policy, foreign direct investment, industrial agglomeration and institutional environments [48,51,52,53,54,55]. Even though these studies present useful contributions on the upgrading pathways, in most instances, they interpret firm behavior as an exogenous reaction and consequently, they do not capture the agency of the firm as the major driver of the upgrading process. At the micro-level, it is up to the companies to invest in their supply-chain upgrading. Working capital, labor, and technological inputs are distributed among various supply chain units by the firms, and in such a way directly define the structure of the channel and its evolutionary path. An impressive amount of research suggests that the efficiency of firms in terms of productivity and investment is the basic precondition of the value-chain upgrading [55,56,57]. In industries where resource limits are constraining, like in grain supply chain, where risk exposure is great, however, the willingness to invest in more or upgrading segments by firms is not only limited by the aspects of efficiency but also largely limited by the multidimensional financial and operational risks [58,59].
Based on the argumentation above, it is claimed in this paper that joint structure of investment efficiency at the firm and investment risk is the determinant of different segments of a supply-chain to be more attractive to investment and subsequently the need to reallocate factors to influence the course of upgrading a supply-chain. When a particular segment simultaneously has high efficiency and manageable risk, it is more attractive to get the endogenous momentum of long-term capital, labor and technological inputs. Conversely, an efficiency–risk mismatch can lead to distribution of factors in the economy being distorted, with potentially upgrading segments being continuously underinvested. Although the relevance of this mechanism has been recognized, the prevalent studies have provided no systematic evidence of efficiency and risk integration within a single framework, and compared the structural heterogeneity of these variables across the vertical supply chain. Accordingly, based on the GVC upgrading theory and adopting a firm investment–behavior perspective, this research creates an analytical framework in connection to investment efficiency, investment risk, and supply-chain upgrading. This model allows to methodically describe the efficiency–risks segment-specific patterns and provides new empirical findings on the micro-level efficiency towards upgrading dynamics in the grain supply chain.
3. Research Design
3.1. Research Method
3.1.1. Three-Stage DEA Method
This study takes a three-stage DEA approach to evaluate the efficiency of investments made by companies in various strands of Chinese grain supply chain. In contrast to traditional models of DEA, which define all the deviations of the efficiency frontier by managerial inefficiency, the three-stage DEA breaks down the efficiency deviations into three categories, namely, managerial inefficiency, external environmental factors, and noise [16]. This has been of greater difference in the case of supply-chain studies, as firms in the upstream, midstream, and downstream of the grain supply chain are often highly heterogeneous in terms of financing capacity, market rivalry, support of policies and economies of scale. In the absence of isolating these environmental influences, there would be systematic bias with regard to differences in efficiency between firms at various stages of the supply chain, which results in the wrongful depiction of actual managerial performance by the firms. The approach has three distinct stages, as discussed below.
Stage 1: Traditional DEA Model. The first stage of the study involves the application of an input-based DEA model to estimate the initial efficiency measures of every sample firm. The stage offers preliminary efficiency estimates and determines the input slack values. These slack values are the total possible items of inputs, which are a combination of managerial inefficiency, environmental factors, and noise.
Stage 2: SFA Model. The second stage views the slack variables with regard to efficiency. Such slack variables are mainly due to managerial inefficiency, environmental and statistical noise that this is a reflection of the initial efficiency scores. The focus of this stage is to break these slack variables into three effects, namely, environmental effect, managerial effect and noise effect. The model is to be specified in the following way:
Where represents the slack value for firm in the th input; is the deterministic impact of environmental variable on input slack, typically modeled as a linear function ; denotes statistical noise, assumed to follow a normal distribution ; and signifies managerial inefficiency, assumed to follow a truncated normal distribution .
The purpose of the SFA regression is to eliminate the impact of environmental factors and random disturbances on the measurement of technical efficiency, ensuring that all decision-making units are evaluated under the same external conditions. Fried et al. (2002) proposed an adjusted formula:
Where is the adjusted input; is the original input, adjusts for external environmental factors; and ensures that all decision-making units are placed under the same external conditions.
Stage 3: Adjusted DEA Efficiency Estimation. Lastly, the same DEA-BCC model is rerun using adjusted input data and original output data. The obtained efficiency values at this stage will reflect purified measures of managerial efficiency. These scores are used to show how much a firm is capable of transforming its inputs, taking into account the heterogeneity of fields of operation and random statistical noise and with this, it is a better basis on which to compare the intrinsic investment efficiency of the upstream, midstream, and downstream links of the grain supply chain.
3.1.2. PCA Method
In developing a composite index of investment risk of companies within the grain supply chain, this paper uses PCA. The problem of investment risk is multidimensional in nature as it includes financial stability of the firm, operational pressure and earnings volatility. A single financial measure of risk usually measures only a single dimension of risk and the ones that are measured are frequently highly multicollinear. PCA, as a powerful dimensionality reduction method, captures orthogonal principal components of a group of highly correlated variables, in a systematic presentation of the commonality of risk profile structures across firms [38].
As far as operational steps are concerned, PCA standardizes all risk-related indicators first to remove the effect produced by dimensional differences on the results. The data is then normalized and a correlation matrix is constructed, which undergoes eigenvalue decomposition to derive the eigenvalues and eigenvectors of each principal component. Based on the criterion proposed by Kaiser [60] and the cumulative variance contribution principle, the key elements to describe the larger part of the original information are chosen. Lastly, the chosen major factors are multiplied and added up following their weightings, which generates a composite risk score, reflecting the total risk level of each company.
The risk index, which was developed based on PCA, has a number of benefits. First, it packs various risk facets, including the capital structure, the capacity to repay debt, profitability as well as asset turnover into one measure, enabling the comparison of risk levels among various segments of the supply-chain. Second, PCA gets rid of the multicollinearity issue between the indicators and so the measurement of risk becomes more stable. Third, the composite index of risk supplements the DEA index of investment efficiency, allowing for further investigation of the effect of efficiency–risk compliance on upgrading of supply-chains to contribute to this paper.
3.1.3. Efficiency–Risk Quadrant Classification
In order to examine the nature of the joint distribution of the investment efficiency and investment risk by various segments of the grain supply chain, this research uses a two-dimensional quadrant-based classification framework. Based on the multidimensional performance evaluation scheme that is widely applicable in both operations management and supply chain management [61], the study positions the firms in a two-dimensional coordinate structure characterized by the DEA investment efficiency and the composite risk score produced by PCA. By this means, the coincidence/inconsistency between efficiency and risk can be determined, and the effect of that on the upgrading of the supply-chain considered. In particular, all sample firms are classified according to the mean investment efficiency and the investment risk, which forms the threshold of classification and the coordinate plane consists of four quadrants, as indicated in Figure 1.
Quadrant 1: High Efficiency and High Risk. Firms in this quadrant exhibit high investment efficiency, but are also exposed to higher levels of risk. This typically indicates that these firms employ aggressive capital strategies or face significant external pressures, resulting in unstable efficiency improvements.
Quadrant 2: High Efficiency and Low Risk. Firms in this quadrant demonstrate both high efficiency and low risk. These firms are the most resilient and capable of driving supply-chain upgrading, serving as the core source of momentum within the supply chain.
Quadrant 3: Low Efficiency and High Risk. This quadrant represents the most concerning area, characterized by the coexistence of low efficiency and high risk. Firms in this quadrant are the weak links in the supply chain and potential points of failure, susceptible to disruption under external shocks.
Quadrant 4: Low Efficiency and Low Risk. Firms in this quadrant exhibit low risk but insufficient efficiency, often adopting conservative or risk-averse strategies. However, their limited innovation capacity may hinder the pace of supply-chain upgrading.
The main direction of analytical approach of this research is to project all the sample firms on this matrix and differentiate them based on their location in various supply-chain segments. The resulting scatter plot will provide a graphical depiction of the clustering of each segment and provide an analysis of the structural mismatches of the supply chain, which will directly answer the research questions.
3.2. Variable Definition and Source
3.2.1. Sample Selection
The proposed research seeks to examine efficiency in investments of various segments of the grain supply chain, using the A-share market-listed firms in China as the research group. The financial and market information of such firms is obtained in the Wind and CSMAR databases and cross-validated with the annual reports. The first sample will consist of all A-share listed companies from 2018-2022. To begin with, according to the Guidelines for the Industry Classification of Listed Companies, firms in the “Agricultural and By-Product Processing” (C13), “Food Manufacturing” (C14), and “Agriculture, Forestry, Animal Husbandry, and Fishery” (A01) sectors that are directly related to the grain industry are chosen, which forms the heart of the grain supply chain.
Then, the companies that were marked as ST or *ST during the time interval were excluded to reduce the effects of financially anomalous companies. Incomplete observations regarding important monetary variables were also eliminated. The risk index calculations and balance of the panel data are to be ensured; this is why firms listed later than 2018 were excluded. Therefore, the overall dataset consists of a balanced panel of 25 firms, with a year of 2015 to 2023, and 225 firm-year observations.
To enable the comparative analysis between the segments of the supply-chains, the sample firms would be operationalized into three segments of the grain supply chain, upstream, midstream, and downstream, according to the GVC theory and functional attributes of the core value-creating activities of the firms [45,62]. In particular, the upstream segment consists of companies that are either involved in grain cultivation, breeding, the production of agricultural inputs, including fertilizers and pesticides, or primary processing, which is a modification of the physical shape of products only. Midstream segment includes companies engaging in grain storage, logistics, milling, oil extraction, and feed production, among other advanced processing and distribution services, where the major focus is to add value to products by intensifying processing and relocating the location spatially. The downstream segment involves companies that deal directly with end consumers, including branded food production, snack food processing, retail and food service supply chain management, where value realization depends mostly on brand building, developing the channel and advancing on final goods. To segment, the main criterion will be the share of each firm in the main business operations reported in the annual reports, with the limit being more than 50%. The classification is compared to the Wind industry segmentation codes to fully make a judgment.
3.2.2. Variable Definitions
- Selection of Input and Output Variables
Using the available literature on economic principles of agriculture and the efficiency of industries as well as taking into account the realities operating in the grain industry among listed companies, this paper develops an input indicator system based on three dimensions: capital, costs and labor. An output variable will be taken as a scale output and the size of the firm and its performance in operations are reflected, which is a more complete parameter to individualize the efficiency of investment in grain industry firms [63,64,65,66]. The input variables will be capital investment, which is directly proportional to the accumulation of long-term asset and new productive investments, the operating costs input denoting the direct cost of production incurred by the firm to earn revenue, period cost input denoting the consumption of indirect resources in activities, that is, sales, management, and R&D, and lastly, labor input, which captures the scale of human resource in the firm. The output variable is the scale output, which not only indicates the level of scale of operation and potential level of functionality of the firm in the markets but also represents overall outcome of the ultimate profits of the firm in the core of its operations, which is a holistic expression of the level of value creation in the firm.
- Environmental Variable
Based on mainstream research paradigms in the analysis of corporate efficiency and productivity, and taking into account the circumstances of the unique Chinese institutional and market organization, environmental variables, like the size of firms, the year of IPO, per capita GDP, ownership concentration (OWNC), and market competition are introduced in the second-stage regression of SFA, to control the exogenous variables [67,68]. The size of firms indicates how the firm is endowed with resources and managerial powers, which are generally thought to play a large role in scale effects and technological choices in the production process. It has been widely researched on its relations with efficiency in agricultural enterprises [69]. Listing year is used as a measure of the maturity of a firm in capital market and stability of its governance, which in most cases influences the managerial effectiveness and strategic decision-making of the firm. The business location of the firm in relation to its external conditions has critical importance in influencing the operational efficiency of a firm, whose regional per capita GDP measures the level of economic development of the firm in which it is located. The concentration of ownership, being one of the characteristics of corporate governance system, is important in the areas of internal control, investment policy, and efficiency in distributing resources [70]. Lastly, the market rivalry indicates external rivalry pressures on the firm, which shape the decision and performance of the firm in relation to its behavior patterns. The stiffer the competition, the greater is the probability of the firms being pushed into enhancing their operational efficiency [71]. Having these environmental variables included in the three-stage DEA model also eradicates biases in firm efficiency due to external environmental differences, thus giving more precise estimates of pure technical efficiency.
- Investment Risk Variable
In order to formulate an all-encompassing and sound composite investment risk index, this paper constructs a multidimensional risk integration model building on the contemporary financial theory, including four main dimensions [36]. The leverage risk is calculated on the basis of the asset-liability ratio (ALR) and the equity multiplier (EM) that assess the level of emissions of the financial structure of firms and their possible pressure to repay the debt. These two are basic to the measurement of financial risk and probability of bankruptcy, where ALR is a ratio between the total debt and total assets and EM is a ratio between the assets and equity magnification [72]. The current ratio (Liquid) and cash flow ratio (CashFlow) are used to estimate liquidity risk at any given time, as the former shows the overall capacity of a firm to meet its short-term debts by a given short-term asset, and the latter is the most immediate cash asset available in a firm to uniformly meet its financial obligations [73]. The profitability and the volatility risk consist of the return on equity (ROE), the net profit growth rate (NPG), and return on assets (ROA). While ROE and ROA evaluate the efficiency of profitability using the shareholder and asset perspectives, respectively, NPG is an indicator of the stability of profits, with increased volatility itself being a risk [74]. The operational risk is determined through the accounts receivable ratio (Rec) and inventory ratio (Inv) that comprise the efficiency in working capital management. High ratios are potentially a warning of slow collections, inventory accumulation and cash flow problems [75]. Direct aggregation may be biased because of the overlap/multicollinearity of these indicators. Thus, the dimensionality reduction is performed by PCA, which has been extensively proven to be an objective and strong method of data compression in recent risk integration works [76]. The last composite risk index is a continuous proxy variable that measures the overall risk of the firms; the higher the index values, the more the risk, and can be analyzed later as the relationship with the efficiency of investment.
3.2.3. Descriptive Statistics
Table 1 shows the descriptive statistics of the important variables to enable the comprehension of the basic features of sample firms in specific dimensions of inputs, outputs, external environment and risk. On the whole, one can demonstrate considerable differences between companies in regard to the indicators of operations such as capital investment, operating costs, period costs and scale output, which demonstrates the fact of great heterogeneity of the grain supply chain in resource distribution and the efficiency of output. Regarding the environmental variables, the sample firms seem to have a significant difference in terms of firm size and GDP per capita in different regions, implying that the sample firms enjoy dissimilar external development conditions. The different risk indicators are also highly dispersive, especially when it comes to the operating leverage, cash flow ratio, and net profit volatility, which have high variance in the financial health of companies. The given variation also gives the needed foundation to construct the risk composite index on the basis of PCA. Overall, the descriptive statistics will indicate that there is significant heterogeneity in the sample, and this fact supports the further empirical research of the efficiency assessment, measurement of risk, and its effects on the supply-chain upgrading.
4. Data Analysis and Empirical Results
4.1. Investment Efficiency Analysis
4.1.1. Stage I: Initial BCC Efficiency Estimation
Using input–output data, we estimate the investment efficiency of 25 listed firms in the grain supply chain with DEAP 2.1, and the results are presented in Table 2.
All in all, there is an apparent efficiency gradient across grain supply chain segments during 2015–2023, with upstream firms showing the least investment efficiency, the midstream firms suffering a consistent improvement, and downstream firms being the most efficient among all. On the aggregate level, the investment efficiency (crete) grows slowly from 0.434 to 0.617, which is a sign of the long-term improvement of resource allocation throughout the industry. Yet, there is a large heterogeneity across supply-chain stages: the upstream firms continue to be inefficient (average 0.315), indicating the lack of input–output matching; the midstream firms achieve the largest efficiencies, reaching the level of 0.553 in 2023, which corresponds to the scale effect and technological upgrading; the downstream firms sustain the most efficient level in the entire period of the sample, which reaches 0.761 in 2023, which is consistent with the effects of scale expansion and technological modernization.
Efficiency breakdown indicates that both technical and scale elements make contributions to this gradient. Downstream firms have the greatest level of pure technical efficiency (vrete) (0.918), midstream companies (0.787), and upstream companies (0.733), indicating that technological capability disparities are an important factor in investment efficiency determination. Conversely, the scale efficiency (scale) is lowest in upstream firms (average 0.383), indicating persistent deviations from optimal production scale, whereas the downstream firms run more efficiently at scale. On the whole, the closer the company is to the final market, the more efficient it is in terms of its investments, and the upstream segments are more limited by the lack of scale effect, which gives an empirical foundation to future analysis of supply-chain upgrading.
4.1.2. Stage II: SFA Regression on Input Slacks
The second-stage analysis was used to determine how the external environmental factors can influence input redundancy, using an SFA model to regress the variables in the input slack in stage two analysis (see Table 3). These findings indicate that the estimated variance parameter () and the inefficiency parameter () are significantly not equal to zero in all the slack equations, meaning that a combination of both inefficiency effects and random disturbances contributes to the creation of input redundancy. This observation confirms the statistical validity of the SFA specification.
In the context of the individual determinants, the size of firms (SIZE) has a substantively positive relationship with input slacks, and the most significant impact is associated with the capital input equation (CPA) (p < 0.01), implying that the growth of the scale can be subject to an increase in ineffective behavior of capital allocation. OWNC also generates a positive and significant consistent impact on all the slack equations, especially on capital and labor input (p < 0.01), thus ownership structure, whose concentration is high, can bring out inefficiency in resource allocation further. On the contrary, regional per capita GDP (PGDP) imposes a negative influence on all input slack variables, which means that the more developed a region is, the greater is the alleviation of the input redundancy in firms. There is a positive relationship between the listing age of firms (AGE) and capital and labor input slacks, which implies that the longer firms survive, the more resources will be wasted as a result of path dependence. In the meantime, the market competition (HHI) shows no statistically significant impact on all of the input slack equations.
In general, the findings of the second-stage show that external variables such as the level of the regional economy, firm size, and the ownership structure contribute to the input redundancy systematically. This could therefore result in biased estimates once firm efficiency is directly compared without considering these exogenous differences, hence the importance of environmental adjustment in an efficiency estimation exercise in the future to enhance a closer estimate of the individual efficiency levels of firms.
4.1.3. Stage III: Adjusted Efficiency After External Factor Correction
Following the elimination of the effects of the environmental heterogeneity and random noise using the second-stage SFA regressions, this research results in the environment-adjusted investment efficiency estimates along with their breakdown of firms in the three segments of the grain supply chain. All in all, the efficiency levels have been adjusted significantly lower than the ones achieved in the first-stage DEA, meaning that external environmental factors play an important role in the input redundancy of businesses and the three-stage DEA correction process is required. The average value of the investment efficiency of the whole sample is 0.357, as stated in Table 4, which means that there is an observed possibility of learner-environment regulation since investment efficiency has reduced significantly compared to the stages of the first-stage estimates. By contrast, the mean pure technical efficiency stands at a comparatively high level (0.945), whereas the mean scale efficiency is 0.366, which means that scale inefficiency is the most dominant cause of overall inefficiency, as opposed to shortcomings with respect to the functionality of the pure technical performance.
There is a clear analysis of segmental gradients when supply-chain position is evaluated. Downstream companies have the greatest adjusted investment efficiency (mean 0.633) and the largest drop as compared to the first-stage outcomes (−16.82%), which suggests a rather sound standing in resource allocation and scale growth. Their technical efficiency is kept aimed at the frontier and scale efficiency is affected with diminishing effect after the adjustment but it stands at the best position among all segments. Midstream companies are in a moderate stage, and they show a trend of sluggishness before showing a downturn, then level off. Though they retain a rather high level of pure technical efficiency (0.911), scale efficiency deteriorates considerably (−43.30%), indicating that inefficiency in this segment is primarily caused by the incongruities of scale structure. On the other hand, upstream companies have the lowest adjusted investment efficiency (mean 0.129) and the greatest decline (−59.05%). The most significant efficiency loss is manifested in their scale efficiency (−63.97%), which becomes the main point of loss of efficiency. Even though the upstream firms have a relatively high degree of pure technical efficiency (0.932), this merit cannot convert to a higher degree of efficiency, pointing to serious limitations in terms of input allocation, scale of production, as well as capacity to utilize resources.
From a temporal perspective, all three supply-chain segments exhibit a short-term rebound around 2017, followed by a pronounced decline during 2018–2019, coinciding with heightened external shocks. After 2020, investment efficiency across upstream, midstream, and downstream firms shows varying degrees of stabilization.
In an attempt to offer a more intuitive comparison of how the investment efficiency of the various segments of the grain supply chain evolved and differed over the study period, this study goes further to plot the time trends of the environment-adjusted investment effectiveness and decomposition indicators of each segment, as illustrated in Figure 2. The level of investment efficiency of downstream firms, as Figure 2(a) shows, is always above the average level of the supply-chain, with the overall upward direction and rather regular variability. The midstream segment also stabilizes in terms of efficiency of investment after 2017, with the upstream firms continuing to work at very low levels of efficiency and the volatility is high. Specifically, the accelerated growth in 2017 is preceded by a steep fall, which could be a result of policy adjustments or external shocks. As Figure 2(b) shows, pure technical efficiency is high and constant across all segments, and the downstream firms are always being operated near the frontier, which means that technological and managerial strengths are not the main sources of efficiency loss. Conversely, the upward tendency in scale efficiency shown in Figure 2(c) is also similar to that in the overall investment efficiency, which once again proves that inappropriate scale is a dominant structural limitation to the scaling up of efficiency along the supply chain, the upstream segment in particular.
In order to conduct further analysis of the transformation of investment efficiency among supply-chain segments in a firm-level view, three points in time, including the first year (2015), the intermediate point (2019), and the last year (2023), are chosen. Figure 3 is drawn by creating scatter plots of listed firms with pure technical efficiency (vrete) in the horizontal axis and scale efficiency (scale) in the vertical axis.
The downstream firms in 2015, to a large extent, are concentrated within the upper-right sector, which has relatively high levels of pure technical and scale efficiency, with most of the observations being on the efficiency frontier. Midstream firms are featured by relatively high vrete and lower scale, whereas the upstream firms are heavily dispersed in both directions, with few observations of efficiency in the scale, perceiving 0.1, which signifies a high degree of scale inefficiency.
By 2019, the distribution of vrete becomes more concentrated within the range of 0.85–1.00 across all segments, suggesting an overall improvement in managerial and technical efficiency. However, substantial heterogeneity in scale efficiency persists. Midstream firms experience the most notable improvement in scale, whereas upstream firms remain clustered in the low-scale-efficiency region. Downstream firms continue to exhibit the highest efficiency levels, with most observations located in the upper-right quadrant.
In 2023, differences in pure technical efficiency across segments further narrow, with a marked increase in observations approaching vrete=1, particularly among midstream firms, indicating near-complete technical efficiency. Nevertheless, structural divergence in scale efficiency remains evident: upstream firms largely continue to operate at low scale efficiency, midstream firms exhibit the widest dispersion in scale, and downstream firms consistently maintain a dominant position in the high-efficiency region.
4.2. Investment Risk Analysis
4.2.1. Principal Component Risk Structure and Enterprise Risk Distribution Characteristics
PCA is applied to the nine investment risk indicators, and the results are reported in Table 5. The eigenvalues of the first five principal components are 2.448, 1.844, 1.215, 1.044, and 0.808, accounting for 27.20%, 20.49%, 13.50%, 11.61%, and 8.98% of the total variance, respectively. Together, these components explain 81.77% of the overall risk variation, indicating that the dominant risk structure in the sample is effectively captured. A study of the loading patterns indicates obvious economic explanations. PC1 puts a great burden on Lev, EM and ROE, which is a systemic risk, formed by both the leverage intensity and profitability. PC2 has high loadings on NPG and ROA that determine disparity in the volatility of earnings and profit stability. The main drivers of PC3 are Rec and CashFlow, demonstrating risks associated with the efficiency of operations and the short-term solvency. The strongest relationship with Inv is demonstrating PC4, which is the risk of the inventory management–related risk, and PC5 is not linked with one prevalent risk factor.
The PC1–PC2 risk projection presented in Figure 4 also implies that two dimensions of corporate investment risk, leverage burden and earnings volatility, are the major drivers of corporate investment risk. The profitability-related metrics (ROE and ROA) have fairly high loadings on the two principal components, hence indicating that they cause the greatest variation among the risk profiles observed. Conversely, the indicators related to liquidity will move in the opposite direction to leverage risk, meaning that the indicators partially buffer against the financial vulnerability. A pattern of central clustering and peripheral dispersion of sample firms in the two-dimensional space results in a relatively low overall risk heterogeneity, while a small group of firms is defined by high leverage or nearly extreme earnings dispersion.
4.2.2. Investment Risk Evolution and Segment-Specific Risk Profiles
Once the main component structure of investment risk and the distribution features of the firm-level risk are identified, this section discusses the temporal development of investment risk in each of the many parts of the grain supply chain. As shown in Figure 5, investment risk of upstream, midstream, and downstream companies shows a typical aspect of fluctuation followed by a gradual convergence in the 2015-2023 time period. Nevertheless, significant inter-segment differences can be distinguished.
In 2015, midstream firms had the highest level of risks (1.004), which decreased rapidly and then leveled off to a low level in 2016. The risk of upstream firms is moderate and relatively stable and oscillates around the zero line. Conversely, downstream firms only temporarily increase in 2016 (0.615) and subsequently are consistently negative, indicating that it is under a low-risk regime in the vast majority of the sample period, a consequence of the stabilizing impact of the demand-side benefits.
Figure 6 shows how the investment risk is distributed between listed firms in the chain of grain supply. These findings indicate that upstream corporations demonstrate a strong-risk heterogeneity, and there are both strongly risky types and significantly low-risk types of firms simultaneously, which spreads the range of risk levels widely. Midstream companies show a similarly spread risk profile, though there are no low-risk companies, as in the case of the upstream sector, which implies that the segment is a risk-intensive region in the supply chain. Conversely, the downstream firms have the best risk profile, with all the firms within the moderate risk bracket, which means that this segment has a significant ability to absorb both financial and operational risks.
4.3. Joint Impact Analysis
The analysis of the investment risk and efficiency of investments in a unified analytical framework to determine where the upstream, midstream, and downstream segments of the grain supply chain lie relative to one another in terms of efficiency–risk space, and how these various segments change over time, is mutually analyzed in this section. Mapping the observation of firm-year on a scatter plot with investment efficiency as the horizontal axis and investment risk as the vertical axis (Figure 7), we investigate which parts of supply-chain are most appealing to the investors. This will help us to evaluate the existence of inter-segment variation in efficiency and risk as a binding constraint to grain supply-chain upgrading.
In Figure 7(a), upstream firms also constantly report investment efficiency, which is lower than supply-chain efficiency (0.272), with majority of the observations placed in Quadrant IV (low efficiency and low risk) or Quadrant III (low efficiency and high risk). Despite slow convergence of the risk levels after 2016 and efficiency showing a low growth trend improvement, the fact remains that upstream firms never reach the efficiency threshold and are not able to attain the desired and high efficiency and low risk configuration. As shown in this trend, during the sample period, the exposure to risks in upstream firms remains comparatively manageable, although their efficiency continues to be low and limits their capabilities to create long-term investment systems to encourage the upward supply chain adjustments.
The midstream segment has a significantly different structure, as evident in Figure 7(b). With regard to the efficiency of investments, the results for all years are higher than the threshold, which means that this level of efficiency is usually higher. Risk levels, however, are of a wide range, with a strong intertemporal differentiation. In particular, some of the observations, such as in 2021, can fit in the Quadrant II (high efficiency and low risk) configuration, which is not present in the upstream segment. It implies that the midstream firms can more frequently attain the synergy between risk control and efficiency improvement. In addition, in the initial years (2015–2019), the volatility of midstream firms is relatively higher, suggesting that high risk will decrease, resulting in more stable operations throughout the years. The midstream segment of the supply chain is being upgraded through an increase in efficiency and a reduction in risk concurrently, with the effect being of material benefit.
As shown in Figure 7(c), downstream observations fall in Quadrant II (high efficiency and low risk); the level of efficiency is significantly higher than the upstream and midstream segments. With the exception of 2015 and 2016, investment risk is also consistently low during the sample period. This delegation suggests that the downstream companies have developed a long-term matching of efficiency improvement and risk mitigation. Risk-taking no longer forms their development, but rather their development is based upon long-lasting competitive advantages obtained through branding, channels of distribution as well as supply-chain management capabilities. The downstream segment, in comparison to the upstream and midstream segments, has been in a steady and endogenous growth pattern and is now a major point of stabilization of risk and value creation in the grain supply chain.
5. Discussion and Implications
5.1. Discussion of Main Findings
This paper is based on firm-level data of listed firms in the grain supply chain of China to conduct a systematic analysis of the China grain supply chain on efficiency–risk structure and its development over time in upstream, midstream and downstream. As for the results, there is a strong gradient differentiation in the manner in which efficiency and risk are input collectively among the supply-chain segments. Such structural heterogeneity forms a fundamental micro-level basis of explaining the driving forces as well as the constraining breaks of upgrading supply-chains in the grain industry.
First, the outcomes indicate that downstream firms in the grain supply chain are stable and constantly more efficient when it comes to their investments with comparatively low average investment risk, and upstream firms are featured by the constant low efficiency and significant risk exposure, with midstream firms taking a middle position. This trend is in tandem with the results provided by Reardon and Timmer [77], who claim that the latter and lower branches of value chains tend to enjoy greater benefits of superior resource allocation. It coincides as well with Swinnen and Kuijpers [78], who underline that midstream and downstream segments in food value chains are likely to realize higher efficiency gains with help of marketization and scale expansion processes.
Second, this paper shows that one of the major micro-level phenomena that limits upgrading in the grain supply chain is the existence of a lack of accordance between investment efficiency and investment risk. This issue coincides with the previous research, which highlights the beneficial purpose of firm efficiency or productivity in enhancing the value-chain upgrading [79,80], as far as additional investment efficiency is mostly associated with an enhanced capacity of resource distribution and ensuing upgrading potential. Notably, our findings also imply that high efficiency in investment is not enough to maintain high-level continuous reallocation of resources by the firms in either more value addition or upgrading sectors. In cases where high efficiency goes hand in hand with increased financial and operational risk, investment incentives of firms can be significantly lowered so that the prospective upgrading segments cannot experience steady growth. In that regard, our results are direct empirical evidence of the findings by Wang and Zhu [81], as well as Zhang and Wang [82], which point to the binding role of firm-level risk when it comes to influencing investment decisions.
Lastly, the findings show that scale inefficiency is the main cause of the losses of efficiency in the upstream segment and investment risk is multidimensional and transmissive in the supply chain. The three-stage DEA decomposition demonstrates that low pure technical efficiency does not affect upstream firms; instead, the general investment inefficiency is mainly driven by the excessively strong scale inefficiency. Such a result confirms the findings of Rada and Fuglie [83] and Eder [84], who state that the scale of production is still restrictive due to structural aspects of land fragmentation and scattered farm activities, which also lead to significant scale efficiency losses. Meanwhile, In the meantime, the outcome of the PCA shows that investment risk is not a single-dimensional phenomenon. Upstream firms are also subjected to natural risks and market risks and thus exposed to compounded uncertainty. This fact further generalizes the studies by Xue et al. [31] and Bellemare and Bloem [85] on the diffusion of agricultural risk through value chains, indicating that the upstream segment of the grain supply chain is not just an efficiency point, but also serves as a cluster point of risks and their transfer to other participants in the chain.
5.2. Theoretical Significance
Theoretically, this paper builds up an integrated efficiency–risk mismatch framework and leaves the traditional distinction of efficiency and risk as has been applied in earlier studies. It shows that the process of supply-chain upgrading not only requires the absolute level of the efficiency of the separate segments, but the necessity of a parallel between the efficiency and the risk in a critical way. This framework offers a bottom-up micro-mechanism in which upgrading dynamics can be interpreted by a focused connection of the firm-level investment decision-making to the structural change of the supply chain. Furthermore, using the Chinese institutional focus, the paper detects and supports the existence of diseconomies of scale as the structural source of entrapment of upstream that stupidly remain in low-efficiency regimes, despite variations in spite of somewhat high technical efficiency. By doing so, it takes institutional and structural restrictions into consideration when theorizing the issue of agricultural supply-chain upgrading, and thus richly and profoundly contributing to the knowledge on how upgrading takes place in transition economies.
5.3. Practical Significance
The proposed efficiency–risk matching scheme in this study, alongside the empirical evidence of this scheme, provides an analytical perspective of practice in the designing of policies and operations in agricultural supply chains. It does not play the contribution of simply restating the existence of performance disparity by segments, but in offering a collective diagnosis of both efficiency and risk, which generates segment-specific and actionable intervention logics. The framework is widely applicable in the national settings in increasing the resilience of value-chain, effectiveness in resource allocation, and inclusiveness.
First, in upstream production, development constraints mainly arise from scale inefficiency and compounded risk exposure, not purely technological deficiencies. Thus, policy interventions should go beyond technology diffusion, addressing production organization and risk governance. Facilitating land-use rights transfer and supporting specialized agricultural service organizations can achieve economies of scale without altering the nature of farming entities. Establishing an integrated risk management system can stabilize producers’ expectations and reduce investment uncertainty, especially in smallholder-dominated countries.
Second, in midstream processing, efficiency gains coexist with risk volatility, highlighting its crucial yet vulnerable supply chain position. Priority should be given to alleviating risk constraints through financial–industrial integration and supply-chain coordination. Supply-chain finance instruments, like inventory-backed lending and advance-payment financing, can improve firms’ liquidity conditions, while digital technologies can enhance demand–supply matching and inventory management. Upstream integration through long-term contracts or equity partnerships can stabilize raw material supply and manage external risks, strengthening the midstream segment’s stability.
Third, in downstream, its efficiency and risk advantages provide a solid foundation for a coordinating role. Policy efforts should focus on market-based incentives rather than direct intervention. Measures include promoting sustainable procurement certification, offering tax or financing support for strategic investments, and enhancing data-sharing platforms to improve transparency and coordination. This approach offers a practical reference for lead firms in GVCs to foster overall upgrading through market mechanisms.
5.4. Limitations and Prospects
This study systematically analyzes the efficiency–risk structure across the grain supply chain and its implications for supply-chain upgrading, but faces limitations.
First, data primarily from listed firms limits the capture of non-listed agricultural operators’ characteristics. Future research could incorporate firm-level surveys or farm-household microdata to extend the conclusion to a broader range of entities.
Second, the relatively static analytical framework does not fully capture dynamic interactions between efficiency and risk or policy intervention lagged effects. Future work could expand data sources to construct mixed samples encompassing multiple types of economic agents, and apply dynamic panel models or longitudinal case-tracking approaches to more deeply explore the evolutionary paths and driving mechanisms underlying efficiency–risk alignment over time.
Author Contributions
Conceptualization, Z.L. and F.M.; methodology, Z.L. and B.L.; investigation, Z.L.and Y.L.; data curation, Z.L.; formal analysis, Z.L.; visualization, Z.L.; writing—original draft preparation, Z.L.and Y.L; writing—review and editing, F.M and B.L.; supervision, F.M and B.L.; project administration, F.M and B.L.; funding acquisition, B.L. All authors have read and agreed to the published version of the manuscript.
Data Availability Statement
The data used in this study were obtained from the Wind Financial Terminal and the China Stock Market and Accounting Research (CSMAR) database. Access to these databases is subject to institutional subscription or licensing agreements. The data are therefore not publicly available but can be accessed upon reasonable request through the respective data providers.
Acknowledgments
The authors would like to express their sincere gratitude to Ms. Fanlin Meng and Prof. Bingjun Lifor his continuous guidance, insightful suggestions, and constructive feedback throughout the development of this study. The authors also appreciate the helpful comments from anonymous reviewers and editors, which contributed to improving the quality of the manuscript.
Conflicts of Interest
The authors declare no conflict of interest.
Abbreviations
The following abbreviations are used in this manuscript:
| DEA | Multidisciplinary Digital Publishing Institute |
| SFA | Stochastic Frontier Analysis |
| PCA | Principal Component Analysis |
| GVC | Global Value Chain |
| SO | Scale Output |
| CPA | Capital Input |
| OC | Operating Cost Input |
| PE | Period Expenses Input |
| LAB | Labor Input |
| SIZE | Firm Size |
| AGE | Firm Age (Years Since Listing) |
| PGDP | Per Capita Gross Domestic Product |
| OWNC | Ownership Concentration |
| HHI | Herfindahl–Hirschman Index |
| Lev | Leverage Ratio (Total Liabilities / Total Assets) |
| EM | Equity Multiplier |
| Liquid | Current Ratio |
| CashFlow | Cash Flow Ratio |
| ROE | Return on Equity |
| ROA | Return on Assets |
| NPG | Net Profit Growth Rate |
| Rec | Accounts Receivable Ratio |
| Inv | Inventory Ratio |
| crete | Comprehensive Investment Efficiency |
| vrete | Pure Technical Efficiency |
| scale | Scale Efficiency |
| LR | Likelihood Ratio |
| NBS | National Bureau of Statistics of China |
| MIIT | Ministry of Industry and Information Technology of China |
| CSMAR | China Stock Market & Accounting Research Database |
| WIND | Wind Financial Database |
References
- Gereffi G. Global value chains and international development policy: Bringing firms, networks and policy-engaged scholarship back in[J]. Journal of International Business Policy, 2019, 2(3): 195-210.
- Belhadi, A., Kamble, S., Subramanian, N., Singh, R. K., & Venkatesh, M. Digital capabilities to manage agri-food supply chain uncertainties and build supply chain resilience during compounding geopolitical disruptions[J]. International Journal of Operations & Production Management, 2024, 44(11): 1914-1950.
- Sturgeon, T. J. (2021). Upgrading strategies for industrial value chains: Firm decisions and structural constraints. Industrial and Corporate Change, 30(2), 343–367.
- Bloom N. The impact of uncertainty shocks[J]. econometrica, 2009, 77(3): 623-685.
- Coelli, T. J., Prasada Rao, D. S., O’donnell, C. J., & Battese, G. E. An introduction to efficiency and productivity analysis[M]. Boston, MA: Springer US, 2005.
- Bozoğlu M, Ceyhan V. Measuring the technical efficiency and exploring the inefficiency determinants of vegetable farms in Samsun province, Turkey[J]. Agricultural systems, 2007, 94(3): 649-656.
- Tan J, Su X, Wang R. Exploring the measurement of regional forestry eco-efficiency and influencing factors in China based on the super-efficient DEA-tobit two stage model[J]. Forests, 2023, 14(2): 300.
- Ahmad H H, Azhari A. The performance and corporate risk-taking of firms: evidence from Malaysian agricultural firms[J]. Journal of Agribusiness in Developing and Emerging Economies, 2022, 12(5): 791-808.
- Huang J, Shi P. Regional rural and structural transformations and farmer’s income in the past four decades in China[J]. China agricultural economic review, 2021, 13(2): 278-301.
- Yang X, Liu W. Agricultural production networks and upgrading from a global–local perspective: a review[J]. Land, 2022, 11(10): 1864.
- Farrell M J. The measurement of productive efficiency[J]. Journal of the royal statistical society series a: statistics in society, 1957, 120(3): 253-281.
- Jung, S., Son, J., Kim, C., & Chung, K. Efficiency measurement using data envelopment analysis (DEA) in public healthcare: Research trends from 2017 to 2022[J]. Processes, 2023, 11(3): 811.
- Tone K. A slacks-based measure of efficiency in data envelopment analysis[J]. European journal of operational research, 2001, 130(3): 498-509.
- Cullinane K, Song D W, Wang T. The application of mathematical programming approaches to estimating container port production efficiency[J]. Journal of productivity analysis, 2005, 24(1): 73-92.
- Emrouznejad A, Yang G. A survey and analysis of the first 40 years of scholarly literature in DEA: 1978–2016[J]. Socio-economic planning sciences, 2018, 61: 4-8.
- Fried H O, Lovell C A K, Schmidt S S, et al. Accounting for environmental effects and statistical noise in data envelopment analysis[J]. Journal of productivity Analysis, 2002, 17(1): 157-174.
- Zhang X, Sun D, Zhang X & Yang H. Regional ecological efficiency and future sustainable development of marine ranch in China: An empirical research using DEA and system dynamics[J]. Aquaculture, 2021, 534: 736339.
- Moutinho V, Vale J, Bertuzi R, Bandeira A M, & Palhares J. A two-stage DEA model to evaluate the performance of Iberian Banks[J]. Economies, 2021, 9(3): 115.
- Yin Q, Wang Y, Wan K, & Wang D. (2020). Evaluation of green transformation efficiency in Chinese mineral resource-based cities based on a three-stage DEA method[J]. Sustainability, 2020, 12(22): 9455.
- Lyu Y, Xiao X, Zhang J. Does the digital economy enhance green total factor productivity in China? The evidence from a national big data comprehensive pilot zone[J]. Structural Change and Economic Dynamics, 2024, 69: 183-196.
- Kashani S M, Mousavi Shiri M. The role of corporate governance in investment efficiency and financial information disclosure risk in companies listed on the Tehran stock exchange[J]. Journal of risk and financial management, 2022, 15(12): 577.
- Nguyen X M, Tran Q T. Corruption and corporate investment efficiency around the world[J]. European Journal of Management and Business Economics, 2022, 31(4): 425-438.
- Ho L, Lu Y. Corporate Sustainability Performance and Liquidity: International Evidence[J]. Journal of International Financial Management & Accounting, 2025.
- Wang L F, Zhang X F. Analyze agricultural efficiency and influencing factors base on the three-stage DEA model and Malmquist index[J]. Frontiers in Earth Science, 2025, 13: 1633859.
- Huang P, Chen X. The impact of data factor-driven industry on the green total factor productivity: evidence from the China[J]. Scientific Reports, 2024, 14(1): 25377.
- Liu D, Zhu X, Wang Y. China’s agricultural green total factor productivity based on carbon emission: an analysis of evolution trend and influencing factors[J]. Journal of Cleaner Production, 2021, 278: 123692.
- He M, Yang M, Wu X, Pu J & Izui K. Evaluating and analyzing the efficiency and influencing factors of cold chain logistics in China’s major urban agglomerations under carbon constraints[J]. Sustainability, 2024, 16(5): 1997.
- Shen Z, Liu T. Impact of Agricultural Product Circulation Efficiency on Contract Farming Coverage and Regional Differences: Evidence from China[J]. Sustainability, 2025, 17(23): 10792.
- Gereffi G, Lee J. Economic and social upgrading in global value chains and industrial clusters: Why governance matters[J]. Journal of business ethics, 2016, 133(1): 25-38.
- Zhang S, Wen X, Sun Y & Xiong Y. Impact of agricultural product brands and agricultural industry agglomeration on agricultural carbon emissions[J]. Journal of Environmental Management, 2024, 369: 122238.
- Xue Y, Yan J, Mohsin M, et al. Supply chain risks in agri-food systems: a comprehensive review of economic vulnerabilities and mitigation approaches[J]. Frontiers in Sustainable Food Systems, 2025, 9: 1649834.
- Khalfaoui R, Goodell J W, Mefteh-Wali S, Chishti M Z, & Gozgor G. Impact of climate risk shocks on global food and agricultural markets: A multiscale and tail connectedness analysis[J]. International Review of Financial Analysis, 2024, 93: 103206.
- Aubert C, Raineau Y, Raynal M & Pasquier N. Multiple agricultural risks and insurance—issues, perspectives, and illustration for wine-growing[J]. Review of Agricultural, Food and Environmental Studies, 2024, 105(4): 371-391.
- Mihrete T B, Mihretu F B. Crop diversification for ensuring sustainable agriculture, risk management and food security[J]. Global Challenges, 2025, 9(2): 2400267.
- Beaver W H, McNichols M F, Rhie J W. Have financial statements become less informative? Evidence from the ability of financial ratios to predict bankruptcy[J]. Review of Accounting studies, 2005, 10(1): 93-122.
- Wei R, Wong E Y C, Sun M & Wang Z. Multidimensional financial metrics for corporate financial risk assessment and early warning mechanisms[J]. Journal of Organizational and End User Computing (JOEUC), 2024, 36(1): 1-23.
- Acharya V V, Pedersen L H, Philippon T & Philippon T. Measuring systemic risk[J]. The review of financial studies, 2017, 30(1): 2-47.
- Jolliffe I. Principal component analysis[M]//International encyclopedia of statistical science. Springer, Berlin, Heidelberg, 2011: 1094-1096.
- Cai L, Cui J, Jo H. Corporate environmental responsibility and firm risk[J]. Journal of Business Ethics, 2016, 139(3): 563-594.
- Ma Y, Wang J, Xiong J, Sun M & Wang J. Risk assessment for cropland abandonment in mountainous area based on AHP and PCA—Take Yunnan Province in China as an example[J]. Ecological Indicators, 2024, 158: 111287.
- Li M, Fu Y. Prediction of supply chain financial credit risk based on PCA-GA-SVM model[J]. Sustainability, 2022, 14(24): 16376.
- Caporin M, Garcia-Jorcano L, Jimenez-Martin J A. Early warnings of systemic risk using one-minute high-frequency data[J]. Expert Systems with Applications, 2024, 252: 124134.
- Zuhrohtun Z, Salim M Z, Sunaryo K & Astuti S. Returns co-movement and interconnectedness: Evidence from Indonesia banking system[J]. Cogent Economics & Finance, 2023, 11(2): 2226903.
- Gereffi G. International trade and industrial upgrading in the apparel commodity chain[J]. Journal of international economics, 1999, 48(1): 37-70.
- Gereffi G, Humphrey J, Sturgeon T. The governance of global value chains[J]. Review of international political economy, 2005, 12(1): 78-104.
- Humphrey J, Schmitz H. How does insertion in global value chains affect upgrading in industrial clusters?[J]. Regional studies, 2002, 36(9): 1017-1027.
- Gereffi G. Economic upgrading in global value chains[J]. Handbook on global value chains, 2019: 240-254.
- Feng S, Zhang R, Di D & Li, G. Does digital transformation promote global value chain upgrading? Evidence from Chinese manufacturing firms[J]. Economic Modelling, 2024, 139: 106810.
- Fu Q. The impact of global value chain embedding on the upgrading of China’s manufacturing industry[J]. Frontiers in Energy Research, 2023, 11: 1256317.
- Zhang D, Sun Z. The impact of agricultural global value chain participation on agricultural total factor productivity[J]. Agriculture, 2023, 13(11): 2151.
- Crescenzi R, Harman O. Climbing up global value chains: leveraging FDI for economic development[J]. 2022.
- Kergroach S. National innovation policies for technology upgrading through GVCs: A cross-country comparison[J]. Technological Forecasting and Social Change, 2019, 145: 258-272.
- Sun T, Abdullah M A. Impact of Industrial Agglomeration on the Upgrading of China’s Automobile Industry: The Threshold Effect of Human Capital and Moderating Effect of Government[J]. Sustainability, 2025, 17(7): 3090.
- Kano L, Tsang E W K, Yeung H W. Global value chains: A review of the multi-disciplinary literature[J]. Journal of international business studies, 2020, 51(4): 577-622.
- Melitz M J. The impact of trade on intra-industry reallocations and aggregate industry productivity[J]. econometrica, 2003, 71(6): 1695-1725.
- Bernard A B, Jensen J B, Redding S J, et al. The empirics of firm heterogeneity and international trade[J]. Annu. Rev. Econ., 2012, 4(1): 283-313.
- Lu Y, Shi H, Luo W & Liu B. Productivity, financial constraints, and firms’ global value chain participation: Evidence from China[J]. Economic Modelling, 2018, 73: 184-194.
- Zhai T, Wang D, Zhang Q, Saeidi P & Raj Mishra A. Assessment of the agriculture supply chain risks for investments of agricultural small and mediumsized enterprises (SMEs) using the decision support model[J]. Economic research-Ekonomska istraživanja, 2023, 36(2).
- Imbiri S, Rameezdeen R, Chileshe N & Statsenko L. A novel taxonomy for risks in agribusiness supply chains: a systematic literature review[J]. Sustainability, 2021, 13(16): 9217.
- Kaiser H F. The application of electronic computers to factor analysis[J]. Educational and psychological measurement, 1960, 20(1): 141-151.
- Venkatraman N, Ramanujam V. Measurement of business performance in strategy research: A comparison of approaches[J]. Academy of management review, 1986, 11(4): 801-814.
- Porter M E. Competitive advantage: Creating and sustaining superior performance[M]. simon and schuster, 2008.
- Becchetti L, Bedoya D A L, Paganetto L. ICT investment, productivity and efficiency: evidence at firm level using a stochastic frontier approach[J]. Journal of productivity analysis, 2003, 20(2): 143-167.
- Camanho A S, Silva M C, Piran F S & Lacerda D P. A literature review of economic efficiency assessments using Data Envelopment Analysis[J]. European Journal of Operational Research, 2024, 315(1): 1-18.
- Sokol O, Frýd L. DEA efficiency in agriculture: Measurement unit issues[J]. Socio-Economic Planning Sciences, 2023, 86: 101497.
- Pan Z, Tang D, Kong H & He J. An analysis of agricultural production efficiency of yangtze river economic belt based on a three-stage DEA Malmquist model[J]. International Journal of Environmental Research and Public Health, 2022, 19(2): 958.
- De Loecker J, Van Biesebroeck J. Effect of international competition on firm productivity and market power[R]. National Bureau of Economic Research, 2016.
- Jin S, Ma H, Huang J, Hu R & Rozelle S. Productivity, efficiency and technical change: measuring the performance of China’s transforming agriculture[J]. Journal of Productivity Analysis, 2010, 33(3): 191-207.
- Ju X, Li H, Liu J & Yao P. Can development of large scale agricultural business entities improve agricultural total factor productivity in China?: an empirical analysis[J]. Frontiers in Sustainable Food Systems, 2023, 7: 1281328.
- Thomsen S, Pedersen T. Ownership structure and economic performance in the largest European companies[J]. Strategic management journal, 2000, 21(6): 689-705.
- Olalere O E, Mukuddem-Petersen J. Product market competition, corporate investment, and firm value: Scrutinizing the role of economic policy uncertainty[J]. Economies, 2023, 11(6): 167.
- Iqbal N, Xu J F, Fareed Z, Wan G & Ma L. Financial leverage and corporate innovation in Chinese public-listed firms[J]. European Journal of Innovation Management, 2022, 25(1): 299-323.
- Seretidou D, Billios D, Stavropoulos A. Integrative Analysis of Traditional and Cash Flow Financial Ratios: Insights from a Systematic Comparative Review[J]. Risks, 2025, 13(4): 62.
- Nguyen D T, Le T D Q. The interrelationships between bank profitability, bank stability and loan growth in Southeast Asia[J]. Cogent Business & Management, 2022, 9(1): 2084977.
- Wanzala R W, Obokoh L. The effects of working capital management on the financial performance of commercial and service firms listed on the Nairobi Securities Exchange in Kenya[J]. Risks, 2024, 12(8): 119.
- Wang P, Huang G. Measuring systemic risk contribution: A higher-order moment augmented approach[J]. Finance Research Letters, 2024, 59: 104833.
- Reardon T, Timmer C P. The economics of the food system revolution[J]. Annu. Rev. Resour. Econ., 2012, 4(1): 225-264.
- Swinnen J, Kuijpers R. Value chain innovations for technology transfer in developing and emerging economies: Conceptual issues, typology, and policy implications[J]. Food Policy, 2019, 83: 298-309.
- Melitz M J. The impact of trade on intra-industry reallocations and aggregate industry productivity[J]. econometrica, 2003, 71(6): 1695-1725.
- Urata S, Baek Y. Impacts of firm’s GVC participation on productivity: A case of Japanese firms[J]. Journal of the Japanese and International Economies, 2022, 66: 101232.
- Wang J, Zhu S. Impact of economic policy uncertainty on corporate investment efficiency: Moderating roles of financing constraints and financialisation[J]. International Review of Economics & Finance, 2025, 98: 103897.
- Zhang W, Wang J. The role of associated risk in predicting financial distress: A case study of listed agricultural companies in China[J]. Finance Research Letters, 2025, 77: 107125.
- Rada N E, Fuglie K O. New perspectives on farm size and productivity[J]. Food Policy, 2019, 84: 147-152.
- Eder A. The Effect of Land Fragmentation on Risk and Technical Efficiency of Austrian Crop Farms[J]. Journal of Agricultural Economics, 2025.
- Bellemare M F, Bloem J R. Does contract farming improve welfare? A review[J]. World Development, 2018, 112: 259-271.
Figure 1.
Schematic Diagram of Investment Efficiency and Investment Risk Combination.
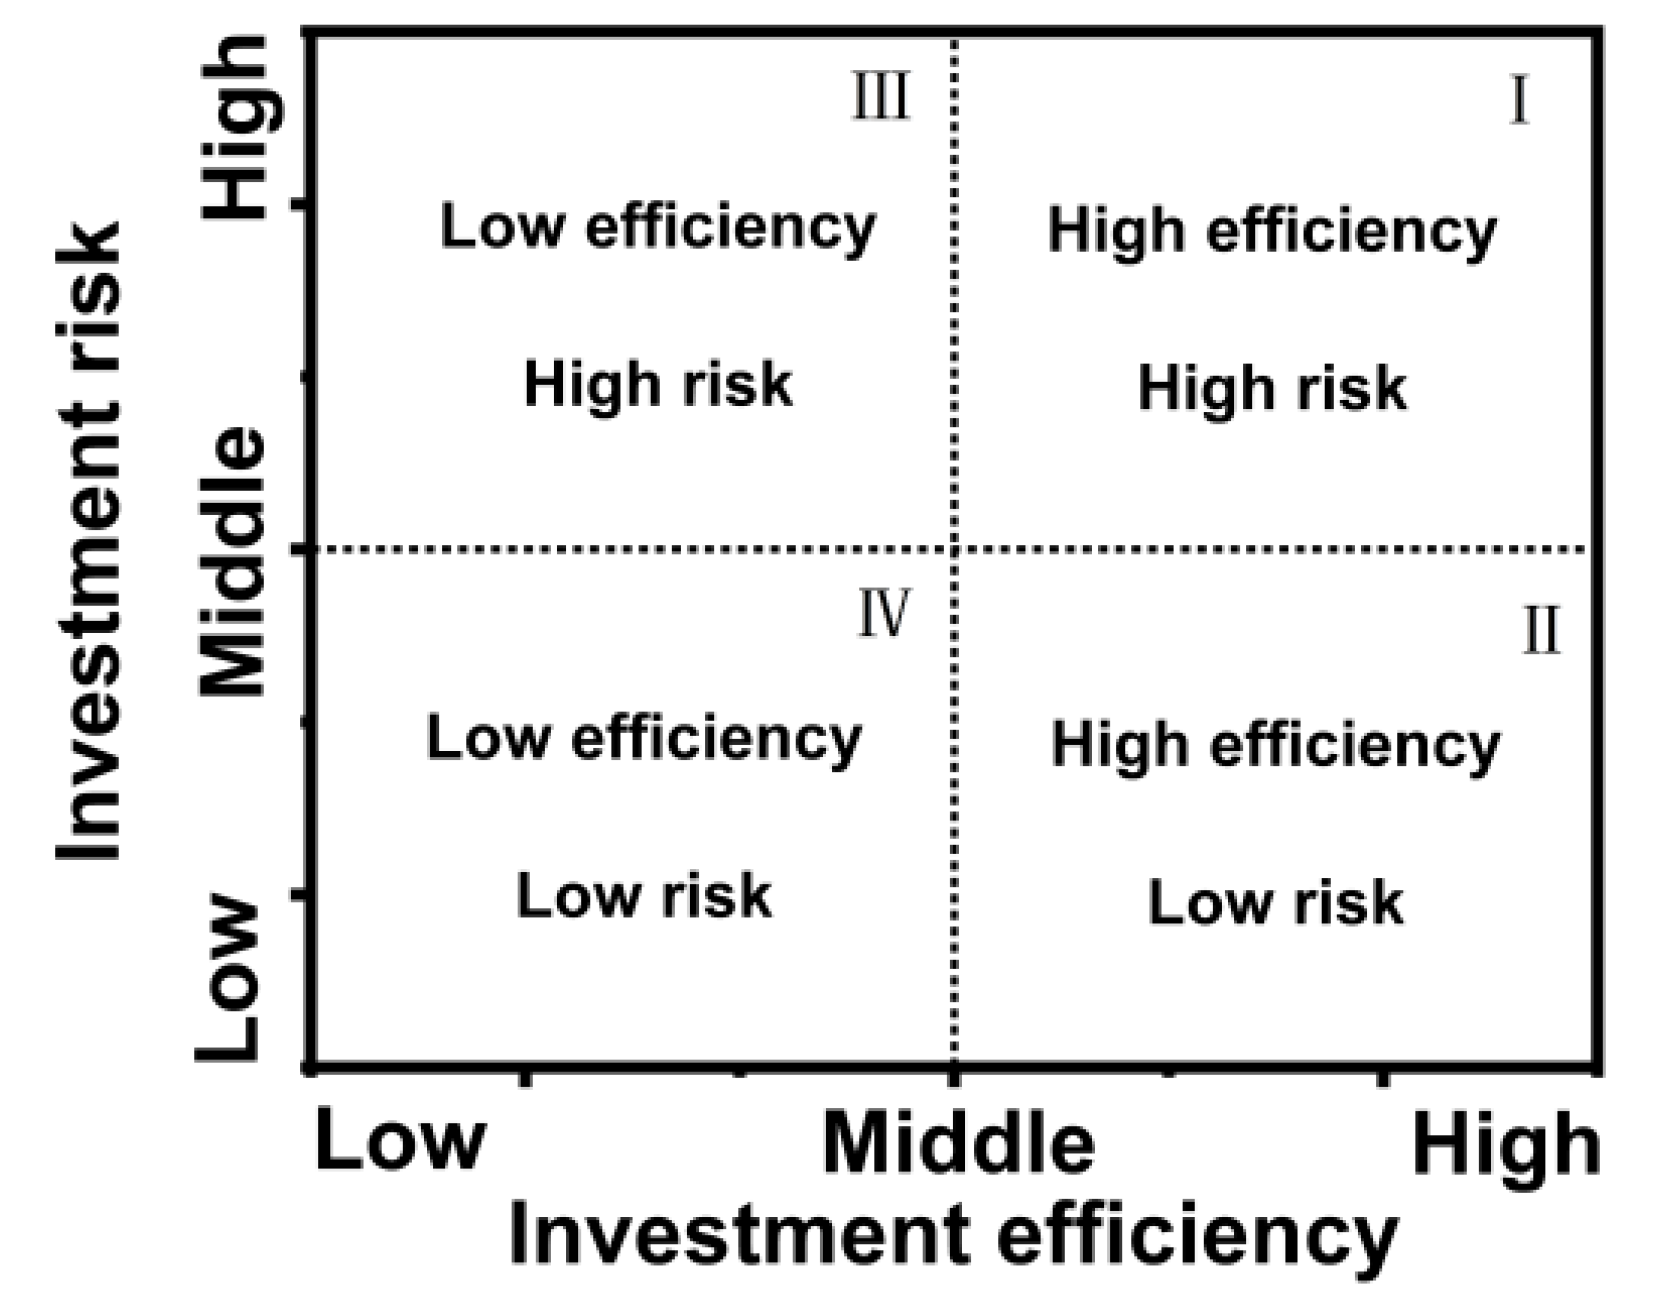
Figure 2.
Investment Efficiency of Each Link in the Grain Industry Chain and the Changing Trends of Its Decomposition Indicators.
Figure 2.
Investment Efficiency of Each Link in the Grain Industry Chain and the Changing Trends of Its Decomposition Indicators.
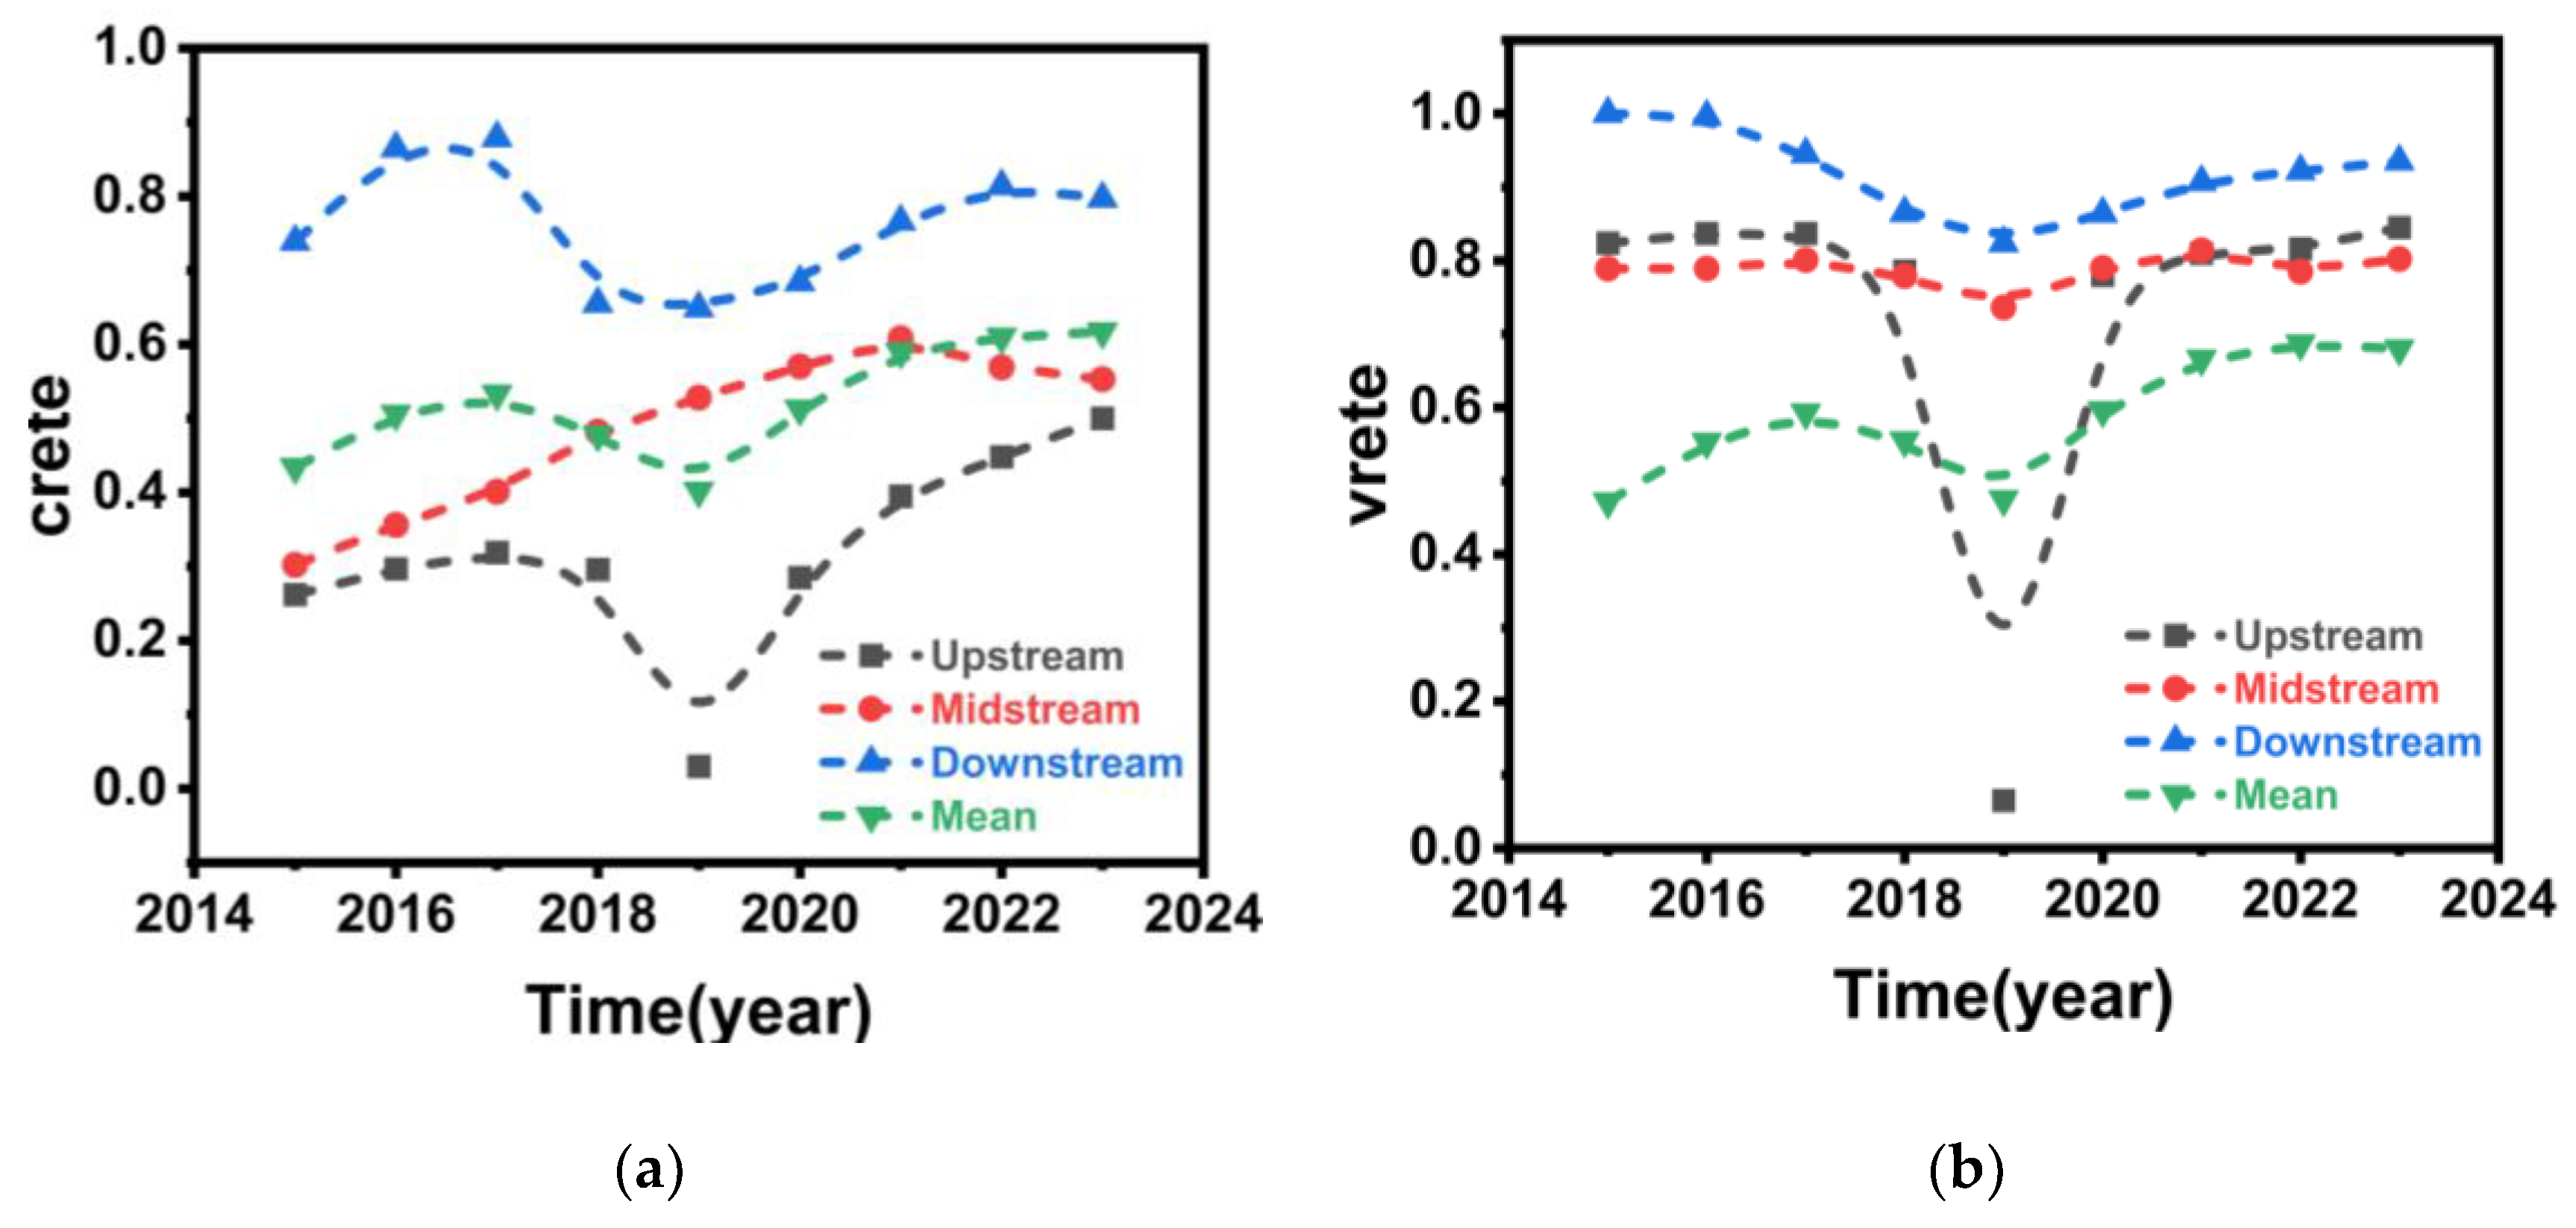
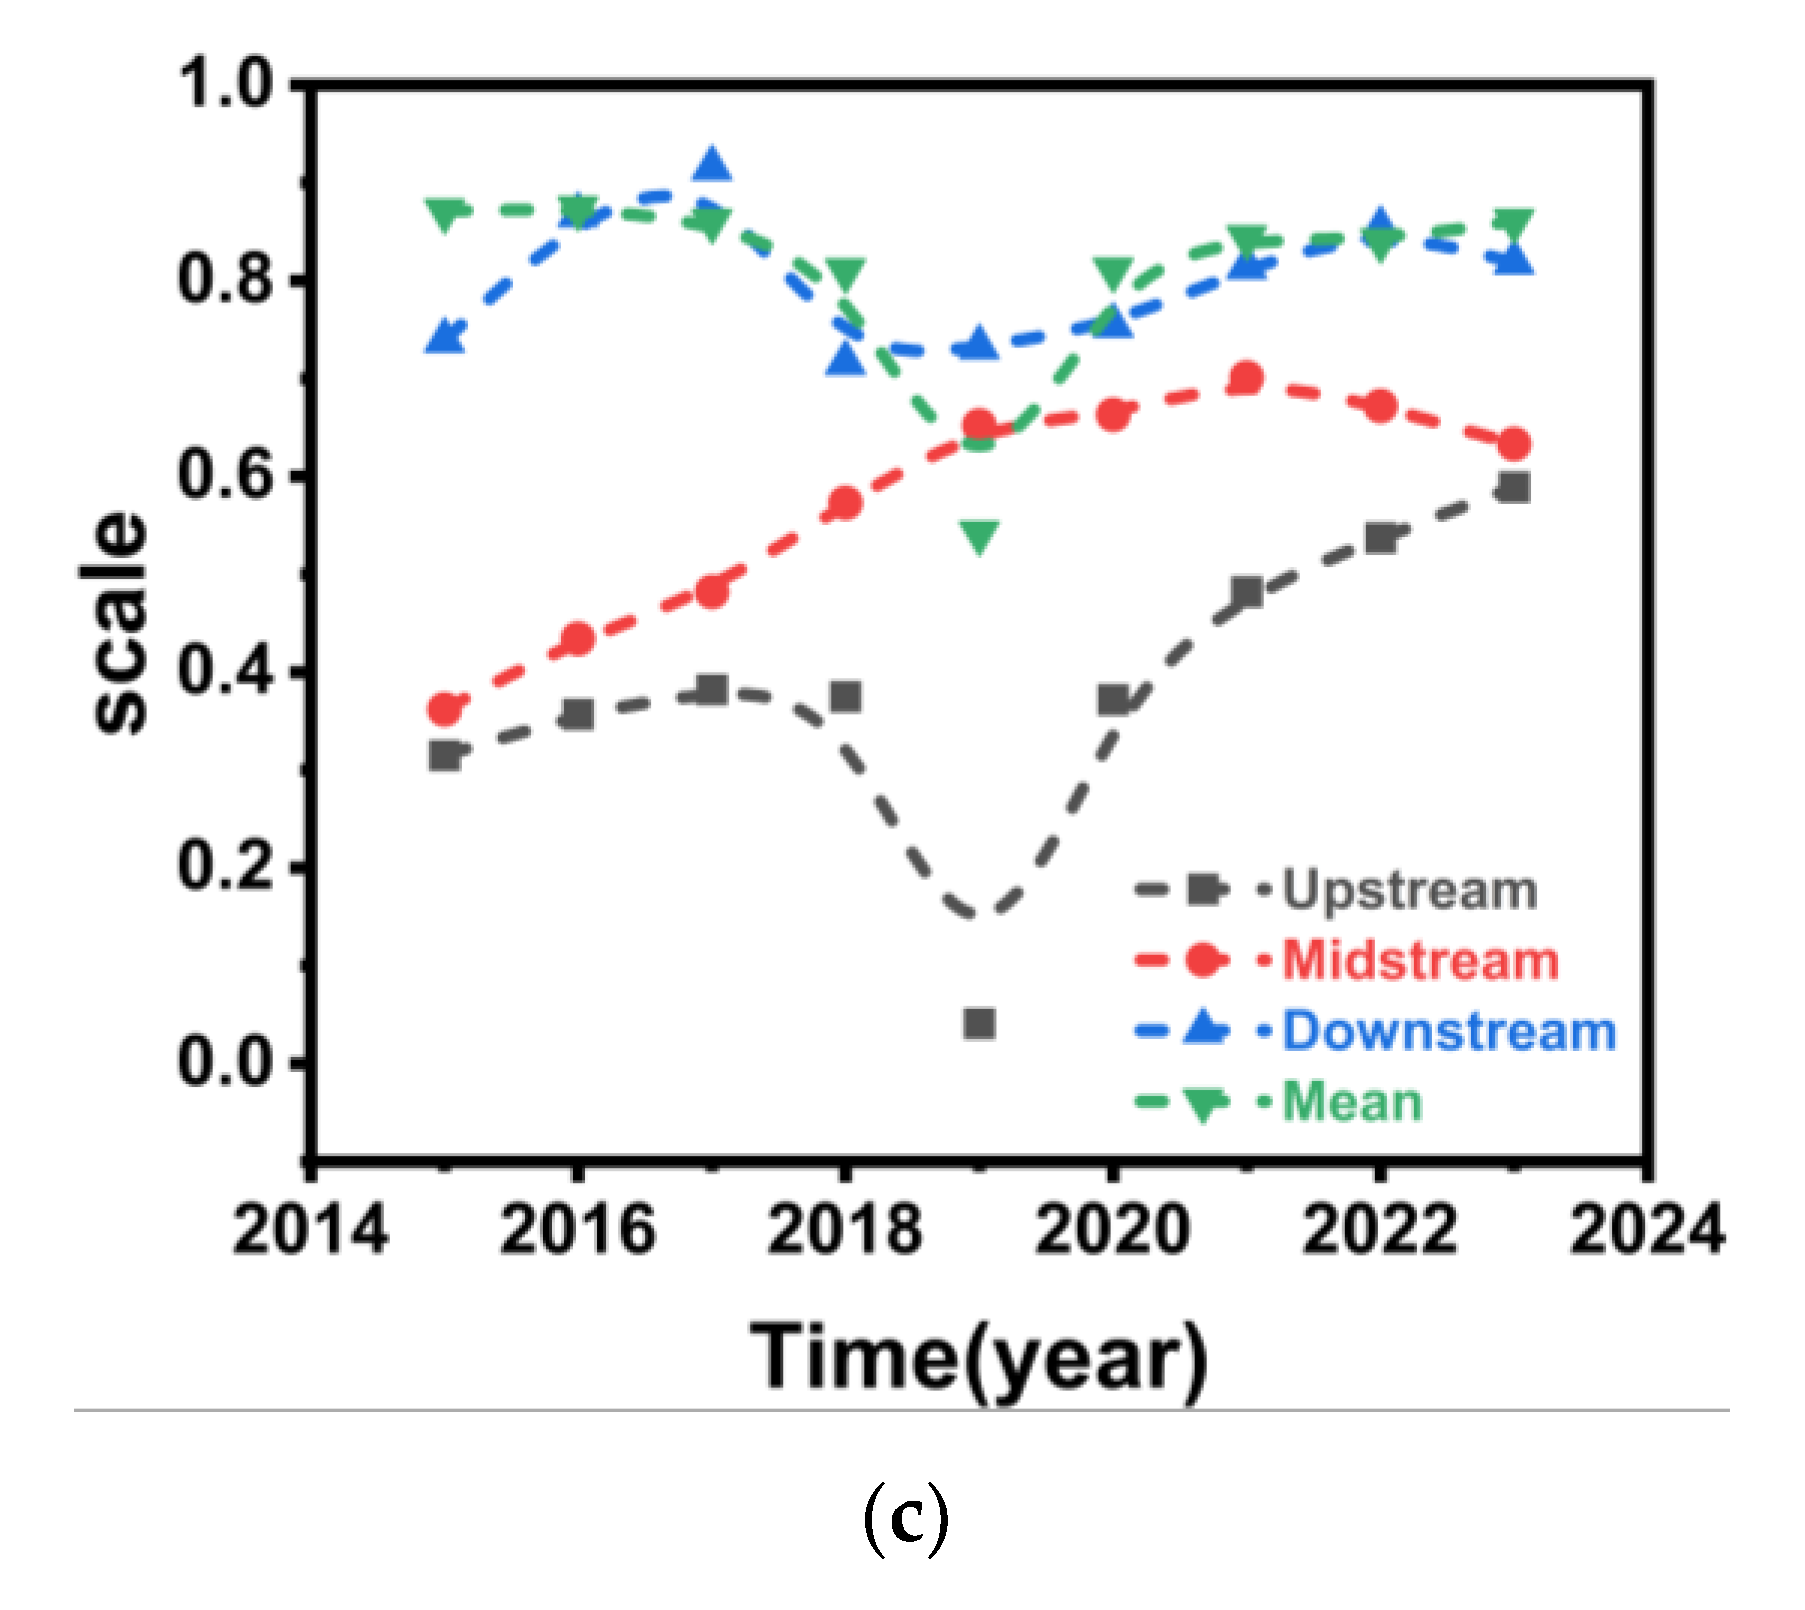
Figure 3.
Scattered Distribution of Investment Efficiency Decomposition Indicators of Listed Companies in Each Link of the Grain Industry Chain.
Figure 3.
Scattered Distribution of Investment Efficiency Decomposition Indicators of Listed Companies in Each Link of the Grain Industry Chain.
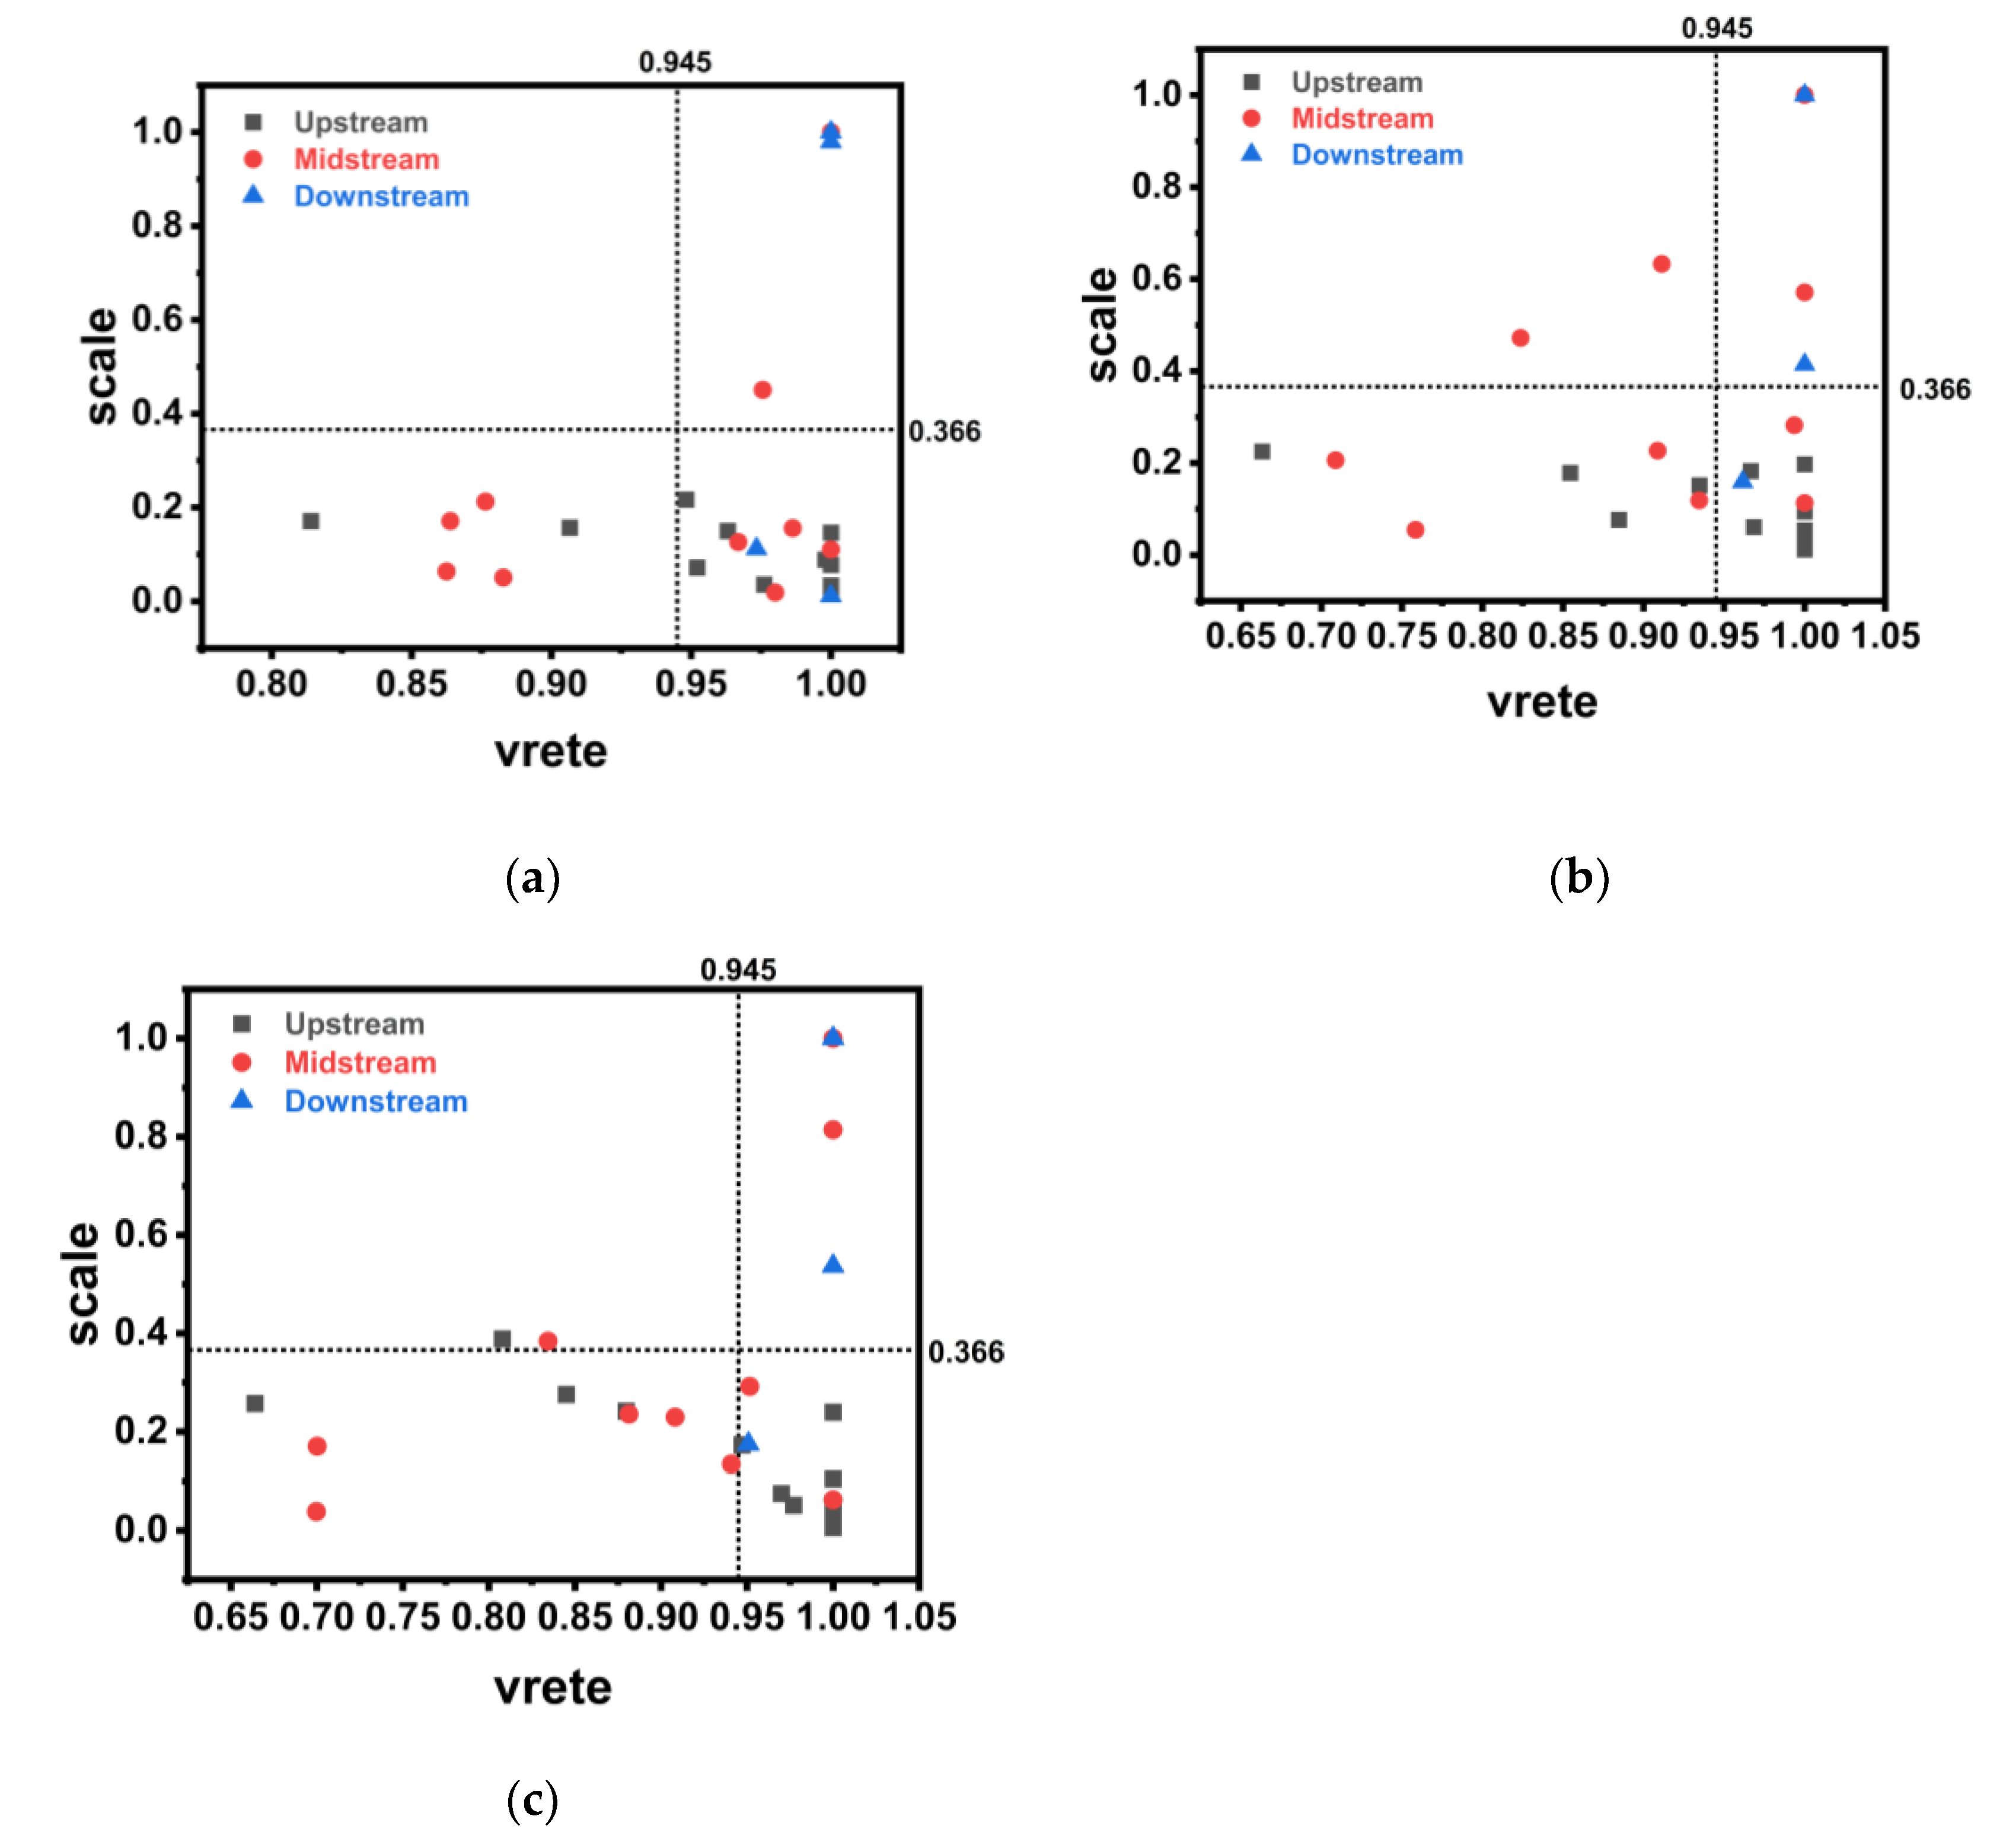
Figure 4.
PCA Biplot of Investment Risk Indicators.
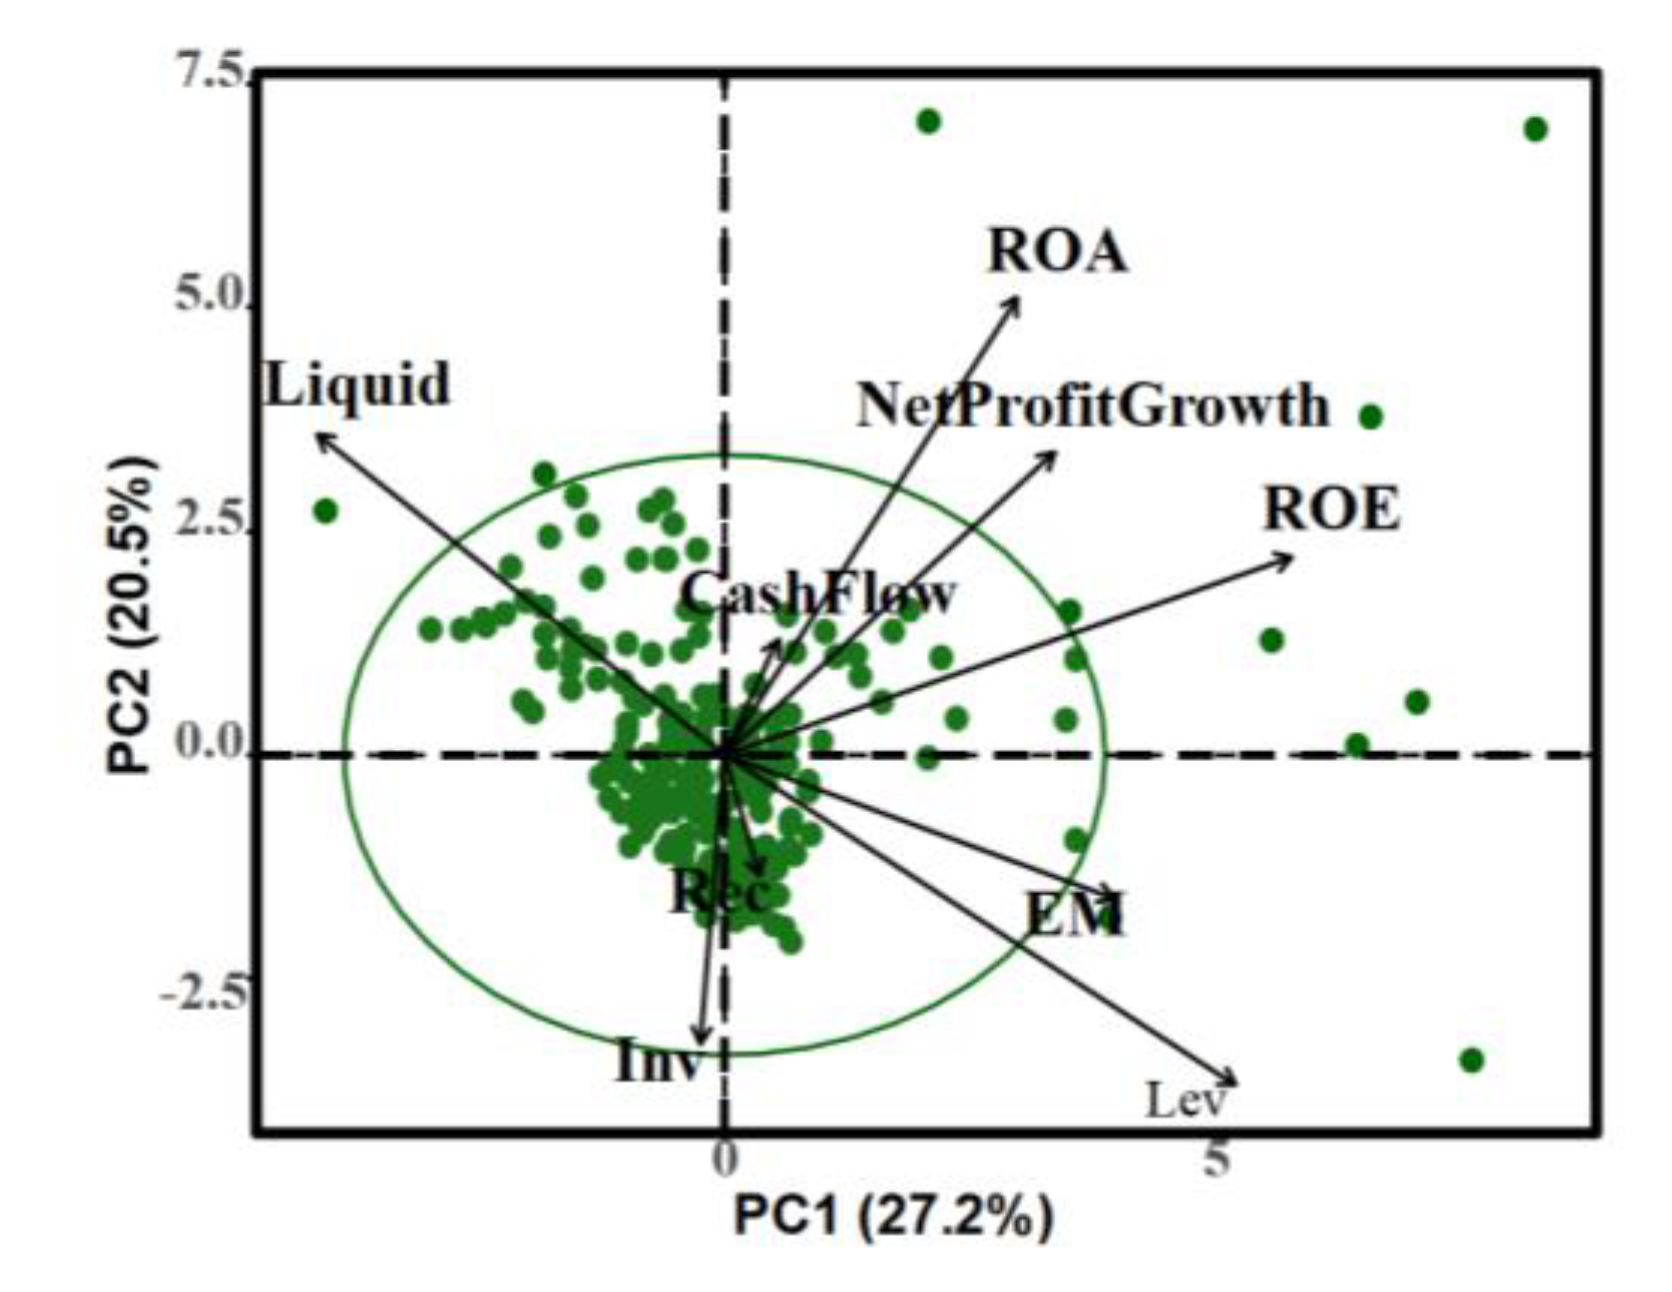
Figure 5.
Trends in Investment Risk Indices of Different Links in the Grain Industry Chain from 2015 to 2023.
Figure 5.
Trends in Investment Risk Indices of Different Links in the Grain Industry Chain from 2015 to 2023.
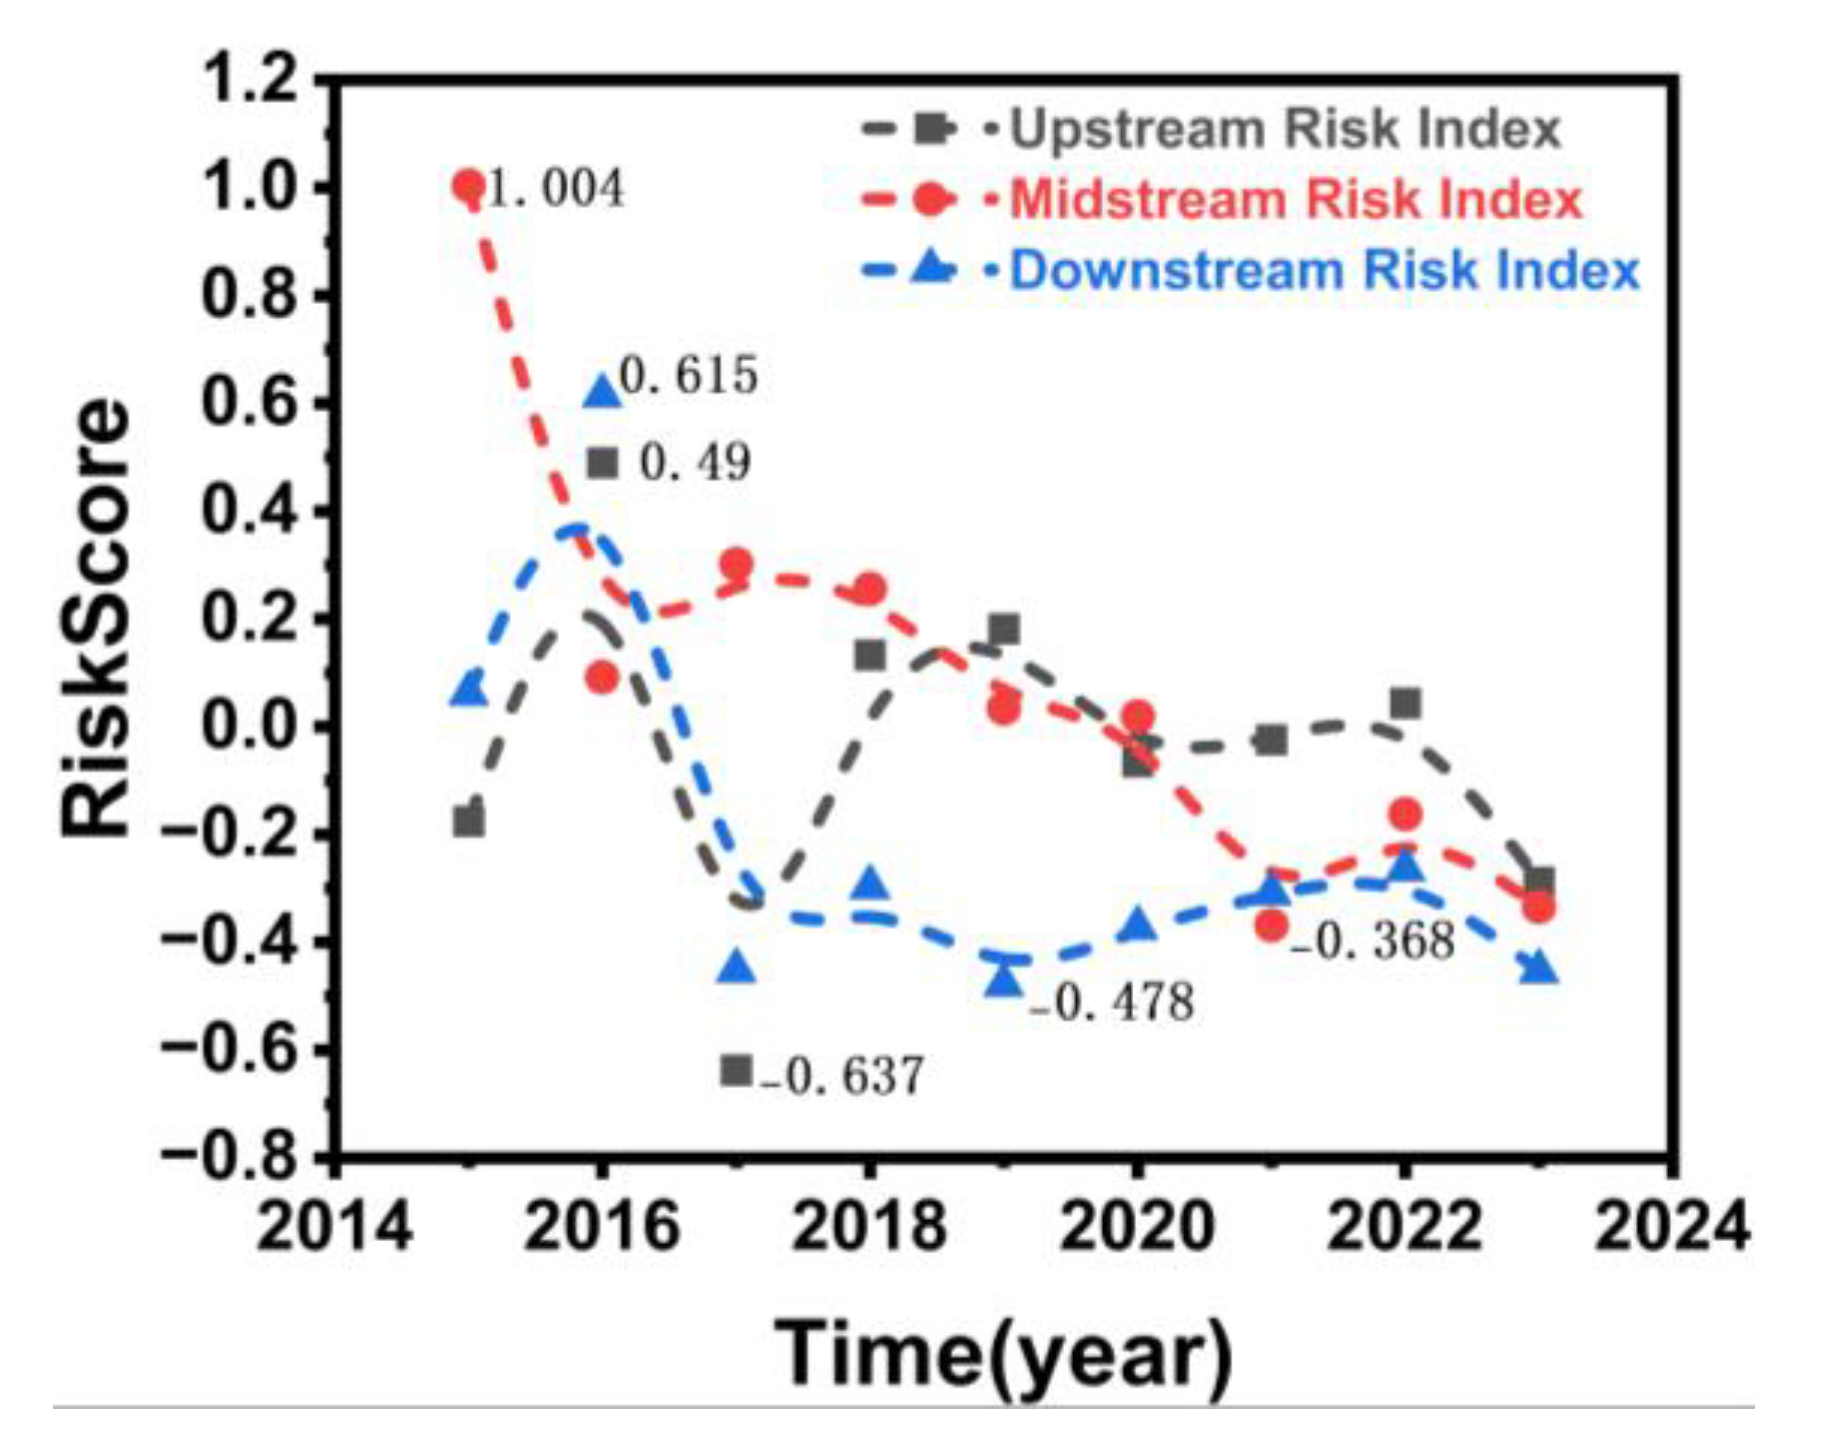
Figure 6.
Distribution of Investment Risk Levels among Listed Companies in Different Chain Segments.
Figure 6.
Distribution of Investment Risk Levels among Listed Companies in Different Chain Segments.
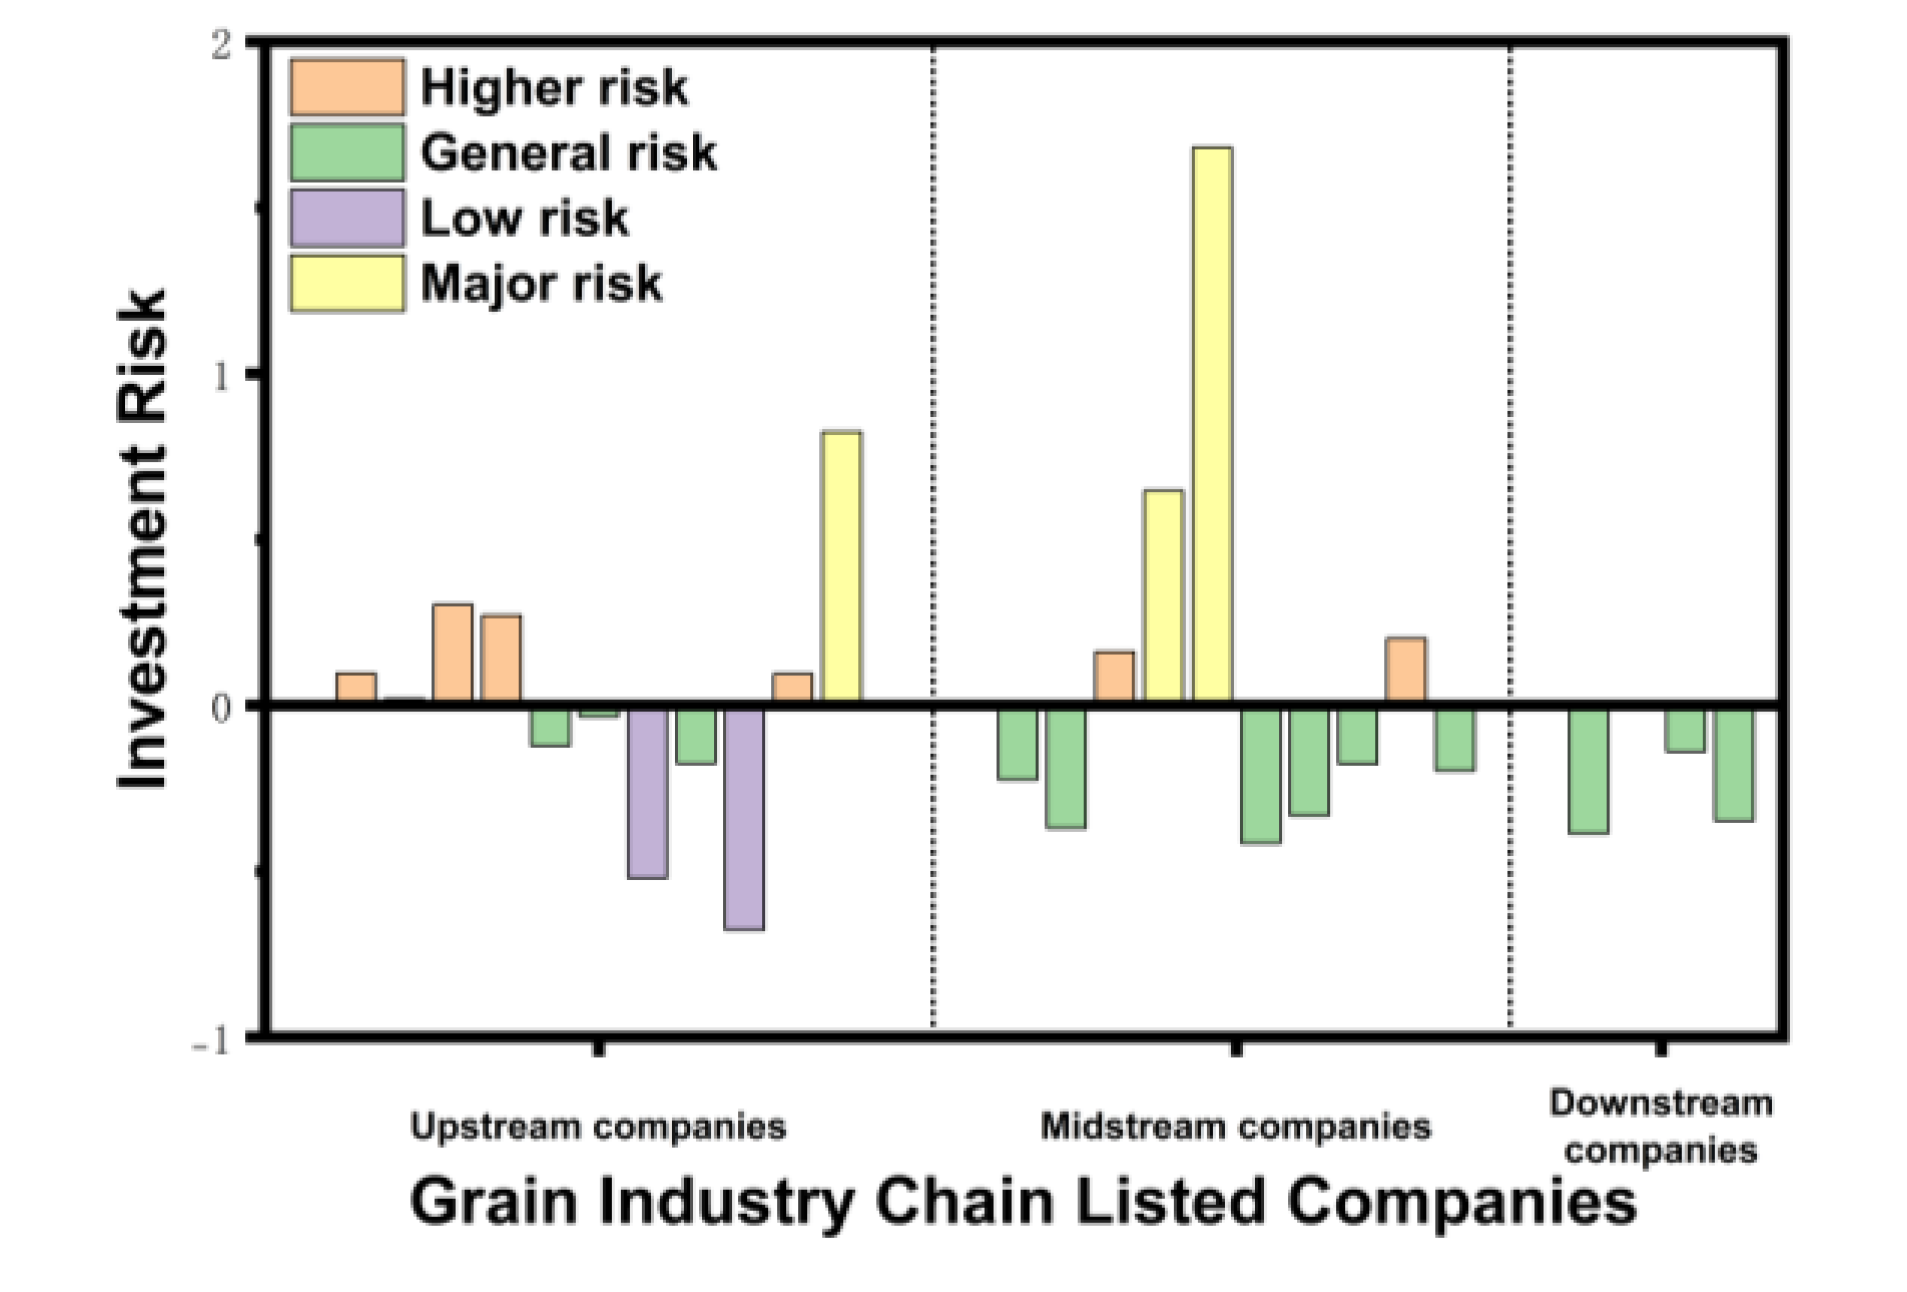
Figure 7.
Joint Distribution of Investment Efficiency and Investment Risk across Grain Supply-Chain Segments.
Figure 7.
Joint Distribution of Investment Efficiency and Investment Risk across Grain Supply-Chain Segments.
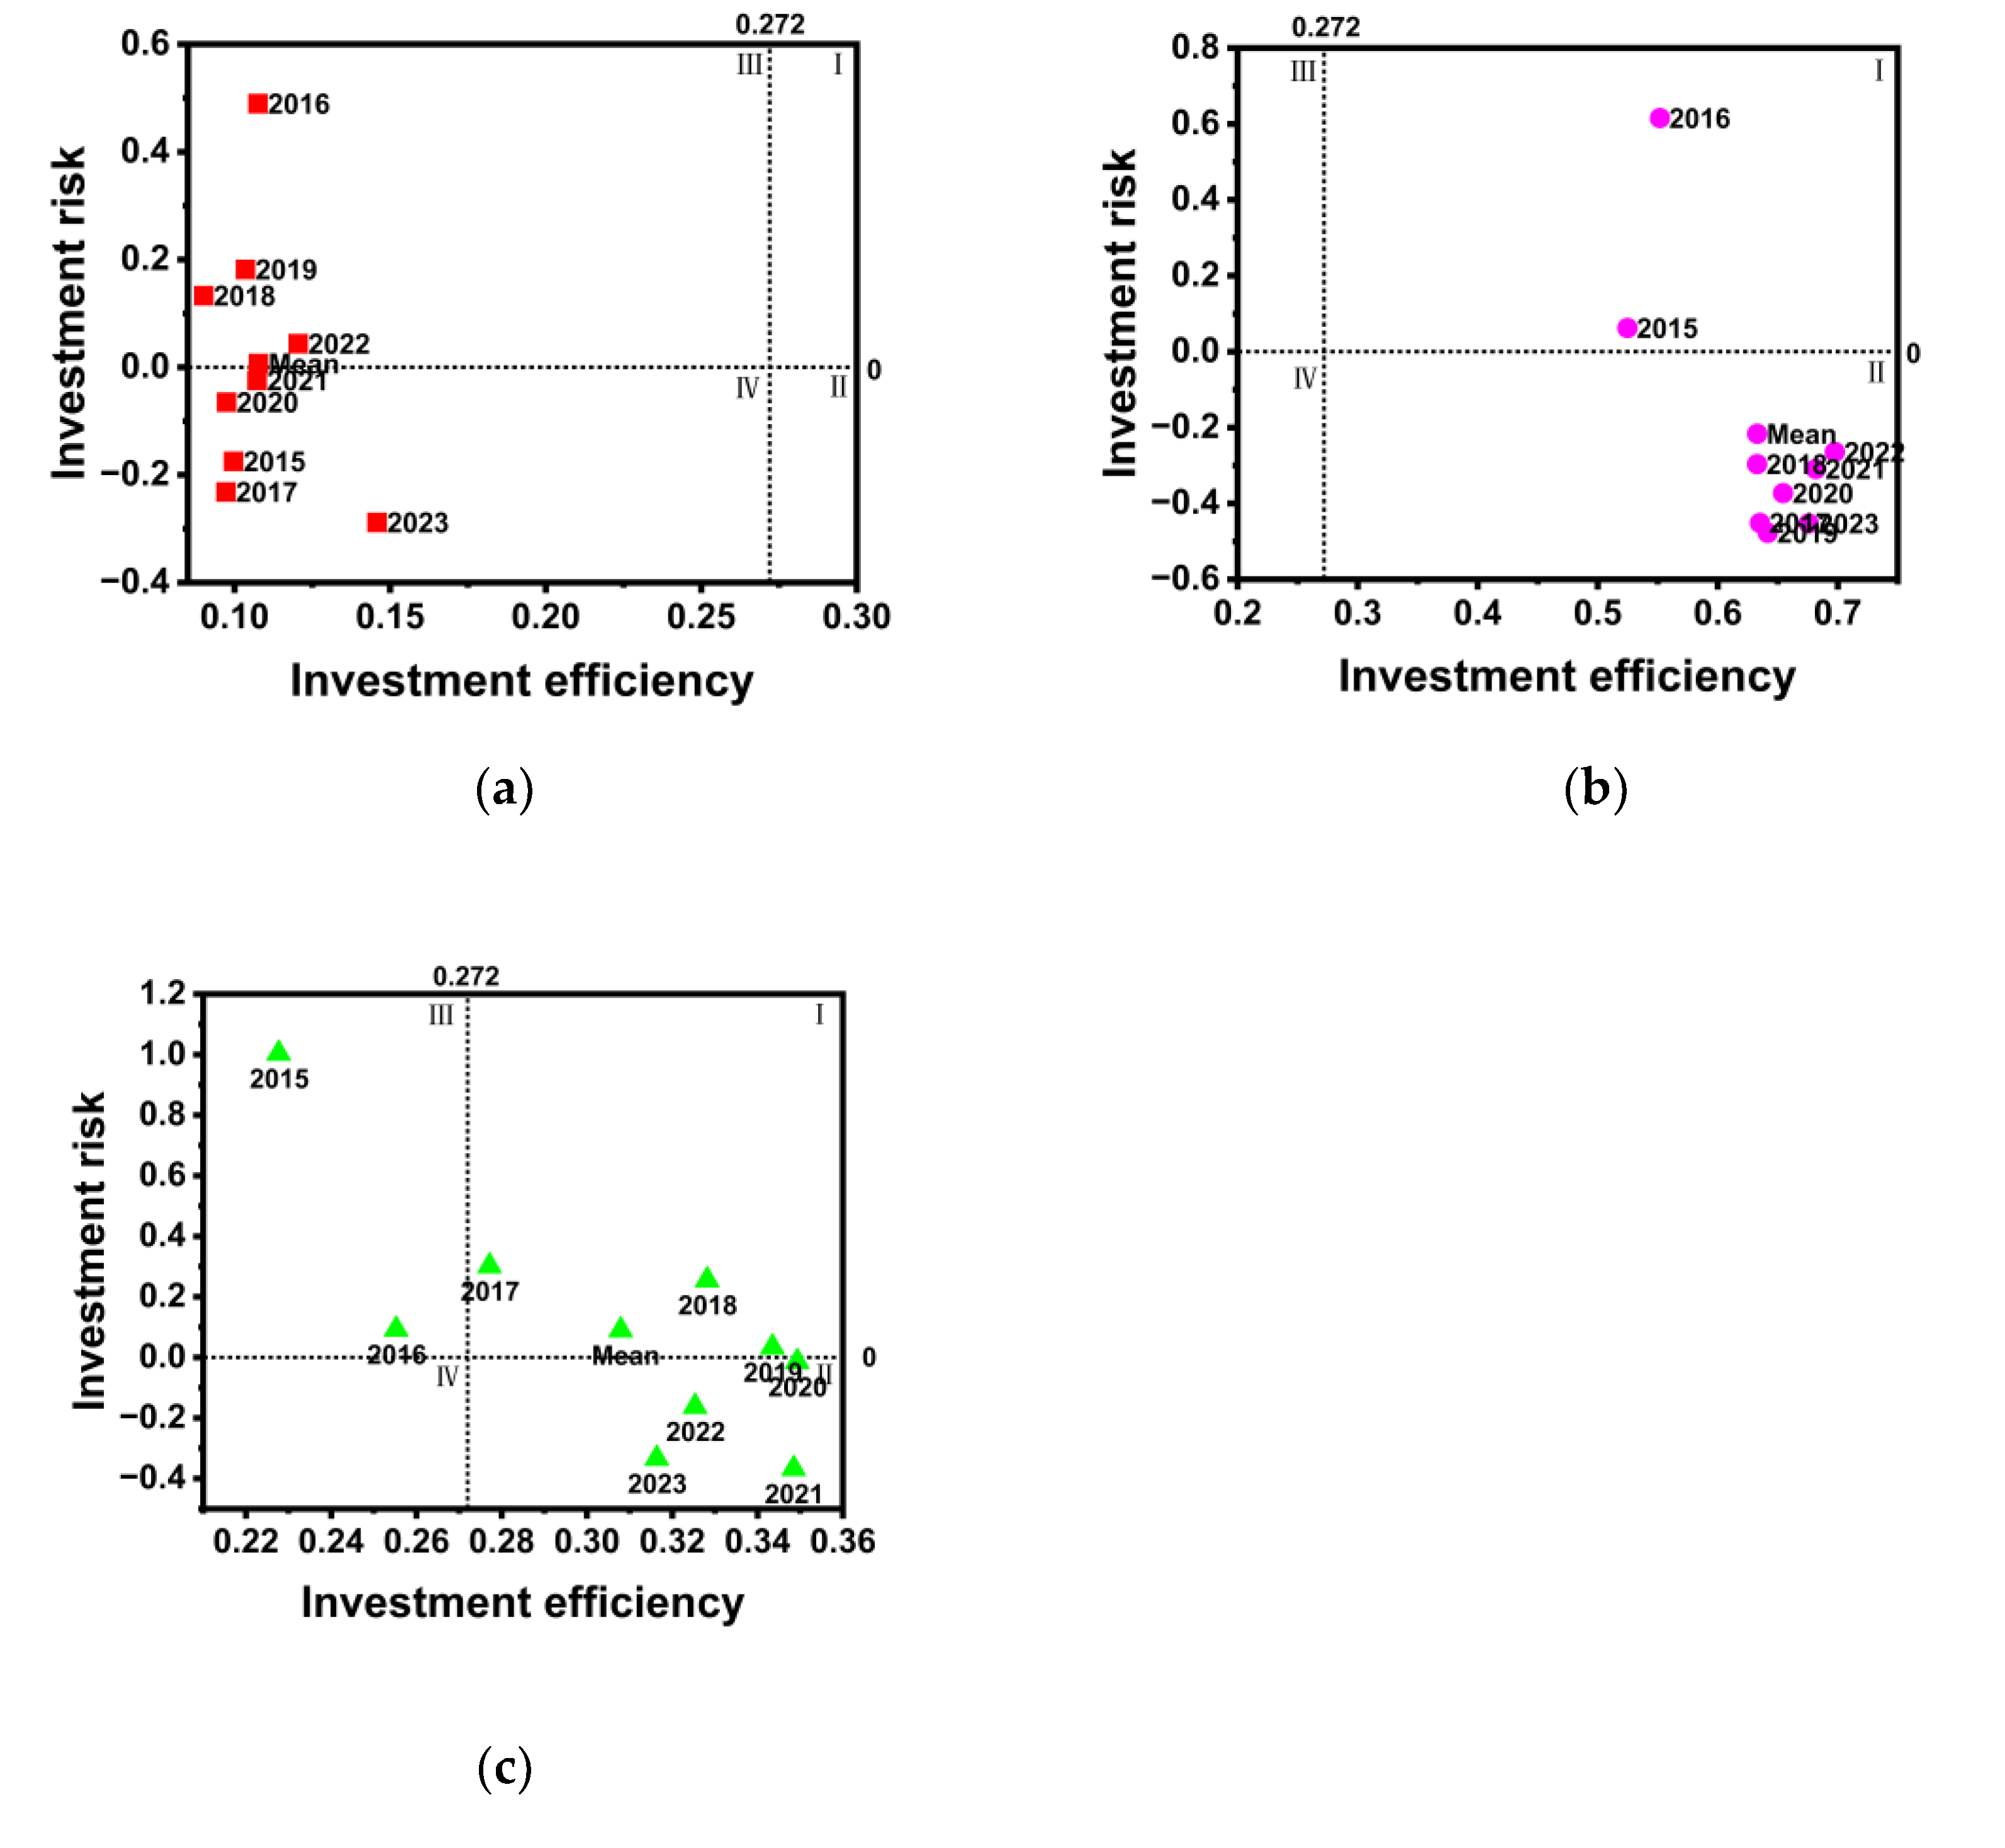

Table 1.
Descriptive Statistics of Main Variables.
| Category | Variable Name | Symbol | Variable Description | Unit | Mean | Sd | Min | Max |
| Input Variables | Capital Investment | CPA | Net fixed assets + capital expenditures | 100 million RMB | 19.203 | 26.009 | 0.875 | 164.014 |
| Operating Cost Investment | OC | Operating revenue × (1 − gross profit margin) | 100 million RMB | 282.152 | 890.018 | 0.902 | 5266.734 | |
| Period Cost Investment | PE | Operating revenue × (operating expense ratio + management expense ratio) | 100 million RMB | 10.370 | 39.094 | 0.001 | 253.652 | |
| Labor Investment | LAB | ln(number of employees) | - | 7.761 | 1.160 | 4.615 | 10.566 | |
| Output Variables | Scale Output | SO | Operating revenue + operating profit | 100 million RMB | 301.003 | 916.158 | -2.202 | 5429.613 |
| Environmental Variables | Firm Size | SIZE | ln(total assets) | - | 22.426 | 1.110 | 20.725 | 25.589 |
| Listing Year | AGE | Current year - year of establishment + 1 | Years | 18.840 | 6.243 | 4.000 | 32.000 | |
| Per Capita GDP | PGDP | Annual per capita GDP of the region | 10,000 RMB | 6.812 | 3.307 | 2.595 | 20.028 | |
| Ownership Concentration | OWNC | Shareholding ratio of the largest shareholder | % | 33.788 | 15.951 | 9.131 | 64.143 | |
| Market Competition Level | HHI | Herfindahl-Hirschman Index of the industry | - | 0.174 | 0.167 | 0.016 | 1.000 | |
| Leverage Risk | Asset liability ratio | Lev | Total debt / total assets | % | 0.481 | 0.214 | 0.059 | 1.290 |
| Equity Multiplier | EM | Total assets / total equity | - | 3.538 | 13.353 | 1.063 | 187.114 | |
| Liquidity Risk | Current Ratio | Liquid | Current assets / current liabilities | - | 1.832 | 1.296 | 0.285 | 9.978 |
| Cash Flow Ratio | CashFl-ow | Cash equivalents / current liabilities | - | 0.072 | 0.069 | 0.000 | 0.528 | |
| Profitability and Volatility Risk | Return on Equity | ROE | Net profit / shareholder equity | % | 0.318 | 3.034 | 0.001 | 45.551 |
| Net Profit Growth Rate | NPG | (Current period net profit - previous period net profit) / previous period net profit | % | 1.836 | 4.896 | 0.004 | 48.322 | |
| Return on Assets | ROA | Net profit / total assets | % | 0.049 | 0.045 | 0.001 | 0.301 | |
| Operational Risk | Accounts Receivable Ratio | Rec | Accounts receivable / operating revenue | % | 0.054 | 0.036 | 0.001 | 0.182 |
| Inventory Ratio | Inv | Inventory / operating revenue | % | 0.207 | 0.112 | 0.022 | 0.484 |
Note: The values in RMB are approximately converted to USD using the exchange rate at the time of publication (1 USD ≈ 6.7 RMB).
Table 2.
The Investment Efficiency of Each Link in the First Stage of the Grain Industry Chain and Its Decomposition Index Values.
Table 2.
The Investment Efficiency of Each Link in the First Stage of the Grain Industry Chain and Its Decomposition Index Values.
| Supply-Chain Segment | Indicator | 2015 | 2016 | 2017 | 2018 | 2019 | 2020 | 2021 | 2022 | 2023 | Mean |
| Upstream | crete | 0.262 | 0.297 | 0.319 | 0.296 | 0.030 | 0.285 | 0.395 | 0.448 | 0.500 | 0.315 |
| vrete | 0.824 | 0.837 | 0.837 | 0.786 | 0.065 | 0.780 | 0.810 | 0.816 | 0.845 | 0.733 | |
| scale | 0.315 | 0.357 | 0.382 | 0.375 | 0.041 | 0.372 | 0.482 | 0.537 | 0.589 | 0.383 | |
| Midstream | crete | 0.302 | 0.356 | 0.401 | 0.482 | 0.528 | 0.570 | 0.608 | 0.569 | 0.553 | 0.485 |
| vrete | 0.789 | 0.789 | 0.801 | 0.779 | 0.736 | 0.790 | 0.814 | 0.785 | 0.802 | 0.787 | |
| scale | 0.362 | 0.434 | 0.482 | 0.573 | 0.652 | 0.663 | 0.701 | 0.672 | 0.633 | 0.575 | |
| Downstream | crete | 0.739 | 0.865 | 0.879 | 0.655 | 0.649 | 0.684 | 0.766 | 0.814 | 0.797 | 0.761 |
| vrete | 1.000 | 0.996 | 0.945 | 0.865 | 0.824 | 0.864 | 0.907 | 0.922 | 0.935 | 0.918 | |
| scale | 0.739 | 0.867 | 0.915 | 0.716 | 0.732 | 0.754 | 0.814 | 0.853 | 0.819 | 0.801 | |
| Overall Mean | crete | 0.434 | 0.506 | 0.533 | 0.478 | 0.402 | 0.513 | 0.590 | 0.610 | 0.617 | 0.520 |
| vrete | 0.472 | 0.553 | 0.593 | 0.555 | 0.475 | 0.596 | 0.666 | 0.687 | 0.680 | 0.586 | |
| scale | 0.871 | 0.874 | 0.861 | 0.810 | 0.542 | 0.811 | 0.844 | 0.841 | 0.861 | 0.813 |
Note: crete denotes investment efficiency, vrete denotes pure technical efficiency, and scale denotes scale efficiency.
Table 3.
Second-Stage SFA Regression Results for Input Slacks.
| Variables |
Input(CPA) Slack |
Input(OC) Slack |
Input(PE) Slack |
Input(LAB) Slack |
| Constant | -86.507*** (-4.86) |
-54.918* (-1.670) |
-0.248 (-0.359) |
-0.407 (-0.208) |
| Env(SIZE) | 3.700*** (4.447) |
2.502 (1.523) |
-0.014 (0.404) |
0.035 (0.365) |
| Env(AGE) | 0.363** (2.4853) |
0.412 (1.4489) |
-0.004 (-0.6732) |
0.060*** (3.7277) |
| Env(PGDP) | -0.000*** (-5.476) |
-0.000*** (-2.696) |
-0.001* (-1.808) |
-0.000*** (-5.211) |
| Env(OWNC) | 26.148*** (5.901) |
18.669* (1.923) |
0.442** (2.342) |
1.996*** (3.351) |
| Env(HHI) | -3.003 (-0.892) |
-5.124 (-0.608) |
-0.123 (-0.703) |
0.031 (0.065) |
| 432.309*** (3.057) |
24810.371*** (52.056) |
34.640*** (3.559) |
5.076*** (3.291) |
|
| 0.962*** (71.687) |
0.991*** (1068.488) |
0.997*** (1232.763) |
0.933*** (44.309) |
|
| Log | -681.153*** | -996.982*** | -127.645*** | -237.825*** |
| LR | 304.022*** | 748.355*** | 860.574*** | 259.669*** |
Notes: Values in parentheses are t-statistics; ***, **, and * denote significance at the 1%, 5%, and 10% levels, respectively.
Table 4.
Investment Efficiency and Its Decomposition across Grain Supply-Chain Segments in the Third Stage.
Table 4.
Investment Efficiency and Its Decomposition across Grain Supply-Chain Segments in the Third Stage.
|
Supply- Chain Segment |
Indicator | 2015 | 2016 | 2017 | 2018 | 2019 | 2020 | 2021 | 2022 | 2023 | Mean |
Change Rate (%) |
| Up- stream |
crete | 0.102 | 0.108 | 0.275 | 0.093 | 0.108 | 0.100 | 0.107 | 0.121 | 0.146 | 0.129 | -59.05 |
| vrete | 0.960 | 0.968 | 0.870 | 0.948 | 0.934 | 0.934 | 0.930 | 0.929 | 0.917 | 0.932 | 27.15 | |
| scale | 0.106 | 0.113 | 0.291 | 0.093 | 0.115 | 0.107 | 0.118 | 0.134 | 0.168 | 0.138 | -63.97 | |
| Mid- stream |
crete | 0.228 | 0.255 | 0.277 | 0.328 | 0.344 | 0.349 | 0.349 | 0.325 | 0.316 | 0.308 | -36.49 |
| vrete | 0.939 | 0.933 | 0.930 | 0.909 | 0.904 | 0.901 | 0.895 | 0.894 | 0.892 | 0.911 | 15.76% | |
| scale | 0.236 | 0.266 | 0.288 | 0.348 | 0.368 | 0.371 | 0.372 | 0.348 | 0.336 | 0.326 | -43.30 | |
| Down- stream |
crete | 0.525 | 0.552 | 0.635 | 0.633 | 0.642 | 0.655 | 0.682 | 0.698 | 0.676 | 0.633 | -16.82 |
| vrete | 0.993 | 1.000 | 0.994 | 1.000 | 0.990 | 0.987 | 0.985 | 0.988 | 0.988 | 0.992 | 8.06 | |
| scale | 0.526 | 0.552 | 0.636 | 0.633 | 0.643 | 0.657 | 0.685 | 0.700 | 0.678 | 0.634 | -20.85 | |
| Overall Mean | crete | 0.285 | 0.305 | 0.396 | 0.351 | 0.365 | 0.368 | 0.379 | 0.381 | 0.379 | 0.357 | -37.45 |
| vrete | 0.964 | 0.967 | 0.931 | 0.952 | 0.943 | 0.941 | 0.937 | 0.937 | 0.932 | 0.945 | 16.99 | |
| scale | 0.289 | 0.310 | 0.405 | 0.358 | 0.375 | 0.378 | 0.392 | 0.394 | 0.394 | 0.366 | -42.71 |
Table 5.
Principal Component Load Matrix, Characteristic Roots and Contribution Rate of Investment Risk Indicators.
Table 5.
Principal Component Load Matrix, Characteristic Roots and Contribution Rate of Investment Risk Indicators.
| Variable | PC1 | PC2 | PC3 | PC4 | PC5 |
| Lev | 0.762 | -0.542 | -0.064 | 0.063 | 0.074 |
| EM | 0.581 | -0.236 | 0.212 | -0.481 | -0.462 |
| Liquid | -0.608 | 0.526 | 0.203 | -0.071 | -0.312 |
| CashFlow | 0.079 | 0.189 | -0.627 | -0.513 | 0.431 |
| ROE | 0.846 | 0.325 | 0.056 | -0.038 | -0.135 |
| NetProfitGrowth | 0.492 | 0.497 | 0.038 | 0.372 | 0.118 |
| ROA | 0.438 | 0.751 | -0.048 | 0.224 | 0.028 |
| Rec | 0.052 | -0.198 | 0.764 | 0.025 | 0.498 |
| Inv | -0.036 | -0.475 | -0.375 | 0.591 | -0.161 |
| Eigenvalue | 2.448 | 1.844 | 1.215 | 1.044 | 0.808 |
| Variance Explained(%) | 27.198 | 20.487 | 13.501 | 11.605 | 8.979 |
| Cumulative Variance Explained(%) | 27.198 | 47.685 | 61.186 | 72.790 | 81.769 |
Notes: PC1–PC5 denote the first five principal components extracted from the nine investment risk indicators.
Disclaimer/Publisher’s Note: The statements, opinions and data contained in all publications are solely those of the individual author(s) and contributor(s) and not of MDPI and/or the editor(s). MDPI and/or the editor(s) disclaim responsibility for any injury to people or property resulting from any ideas, methods, instructions or products referred to in the content. |
© 2026 by the authors. Licensee MDPI, Basel, Switzerland. This article is an open access article distributed under the terms and conditions of the Creative Commons Attribution (CC BY) license (http://creativecommons.org/licenses/by/4.0/).
Copyright: This open access article is published under a Creative Commons CC BY 4.0 license, which permit the free download, distribution, and reuse, provided that the author and preprint are cited in any reuse.


