
Submitted:
30 December 2025
Posted:
31 December 2025
You are already at the latest version
Abstract
Placental abruption is detachment of the placenta before delivery from the implantation site that may have a potential to develop life-threating emergency clinic syptoms. The multifactorial nature of this disorder and no lab testing or procedures that can diagnose placental abruption. makes it difficult to predict. Artificial intelligence (AI) and machine learning (ML) have the potential to enhance clinical decision-making and enable precise assessments. This study purposed on predictive 15 ML models for placental abruption high-lighting input characteristics, performance metrics, and validation. The medical records of 564 patients were analyzed between 2021 and 2025 for studies using AI to develop predictive models for placental abruption. Findings were analyzed with Python software and Pycaret library. The model integrated data for 5 variables (features) for the prediction. Among 15 machine learning algorithms, Logistic regression was chosen as the best model. The performance metrics were determined as follows: accuracy rate of 0.85, AUC of 0.91, recall of 0.85, precision of 0.85, and F1 score of 0.85. In the ranking based on their importance in the classification model, gestational age at delivery was observed to have the highest importance for classification. Twenty-eight unseen cases were utilized for an extra validation step. The model achieved a high accuracy on this set, with 21 cases correctly predicted. The presented 15 ML models in our study had significant accuracy in predicting placental abruption , but these models require further development before they can be applied in a clinical setting.
Keywords:
placental abruption
; automated machine learning
; prediction
1. Introduction
Placental abruption (/PA) was defined as premature separation of the placenta from the uterine wall after 20 weeks’ gestation and before delivery, accompanied by bleeding from the basal decidua [1]. While minor occurrences of placental separation remain asymptomatic, severe cases can precipitate an acute clinical emergency [2]. Key presenting symptoms include vaginal hemorrhage, abdominal pain, heightened uterine contractility, tenderness, and a non-reactive fetal heart tracing [3]. PA that has a multifactorial etiology is a significant contributor to maternal and neonatal morbidity and mortality, particularly when occurring early in the gestation. Research indicates that a placental detachment of 45% or greater is strongly and consistently associated with stillbirth, and is prominently observed in cases of central abruption [2,4,5]. These instances commonly result in both intrauterine hypoxia and subsequent fetal demise. Postnatal fetal mortality is predominantly attributable to prematurity [2]. Furthermore, maternal complications leading to death may include hypovolemic shock, postpartum bleeding, acute renal failure, and Disseminated Intravascular Coagulation (DIC) [6].
Unfortunately there is no diagnose -focused interventions and lab testings for PA. The current information is categorized by excluding other illnesses and providing baseline data [7,8]. Thus, there is a critical need to gather high-quality data on the causes of placental abruption to inform predictive models .
Simple statistical models may be insufficient for modeling complex issues such as placental abruption. Recent advancements in computing power, memory, and storage, along with the widespread availability of rich datasets, have facilitated the use of artificial intelligence (AI) and machine learning (ML) in healthcare to enhance risk prediction. ML can analyze large and diverse datasets to identify patterns and correlations . Thus, ML algorithms can be developed and trained to make classifications or predictions [9,10,11]. It has also the potential to enhance early disease prediction, diagnosis, and treatment in maternal-fetal medicine [12]. Predictive models developed using ML algortihms can aid in clinical decision-making but should not be relied upon for definitive diagnoses. An increasing number of models are being designed to screen and monitor pregnancies, Despite the advancements, there is a current lack of artificial intelligence studies that conduct a comparative analysis of different machine learning models to determine the optimal solution for this domain.
In this study, we aimed to the role of artificial intelligence in assessing PA and machine learning by using some clinical parameters. Our purpose is to distinguish between different machine learning algorthims. Through these aims, the study also seeks to demonstrate the feasibility and potential utility of artificial inteligence with regards to stillbirth research.
2. Materials and Methods
2.1. Patient Selection
The medical records of 564 women who were anonymised were analyzed between 2021 and 2025. Exclusion criteria for this cohort comprised patients who had undergone pregnancy termination, had multifetal gestations, experienced intrapartum mortality, or for whom a record of delivery was unavailable within our clinical system. Cases presenting with any missing data elements were also systematically omitted from the study.
The clinical and demographic dataset was utilized based on parameters identified in previous studies concerning PA [13]. It were analyzed a wide range of factors, including total gravidity and parity counts, incidence of spontaneous abortions, maternal age at delivery, Body Mass Index (BMI) scores, tobacco use, existence of maternal long-term illnesses, delivery timing (gestational weeks), IVF conception methods, and Rhesus incompatibility. Furthermore, sonographic imaging documentation revealed irregularities related to fetal structure, the umbilical connection, or the placental function, alongside deviations in growth progression and amniotic fluid volume. Imaging studies, specifically ultrasound scans, were employed to detect fetal, umbilical cord, or placental anomalies, as well as disturbances in fetal growth and amniotic fluid quantity. To find the best set of features that allows one to build optimized models of studied phenomena, the analysis of these clinical features was conducted using Wrapper methods that is a machine learning methods to sequentially identify best subset of features. This follows a greedy search approach by evaluating all ossible combination of features against the evaluation metrices. Among the Wrapper methods tested, the Backward Elimination technique achieved the top accuracy rate, registering 0.85. The final features selected for the model were maternal age, gestational age at delivery, presence of premature rupture of membranes (PROM), Body Mass Index (BMI), preoperative hemoglobin level, and anticoagulant use (Enoxaparin).
2.2. Statistical Analysis
The acquired data were assessed using the IBM SPSS 22 (Armonk, NY) package program. The descriptive data were expressed as mean . The Kolmogorov–Smirnov test was used to determine if variables are normally distributed. The independent sample t-test analyzed two independent groups with a normal distribution. In contrast, the Mann–Whitney U test was employed to analyze those with a non-normal distribution. For categorical variables, maternal features were analyzed using the Chi-square or Fisher's exact test to compare the groups with and without PA. The results were presented as frequencies [n (%)].To determine the direction and strength of the relationships, an Odds Ratio (OR) was calculated.
2.3. Machine Learning Analysis
A supervised machine learning model, namely binary classification, was used with demographical and clinical datas in dataset (abruptio yes or no). For this purpose, Python 3.11 (Jupyter Notebook, Pycaret Library) was used for data processing and machine learning analysis (Figure 1). PyCaret simplifies processes such as analyzing datasets, automating preprocessing steps, conducting feature engineering, and automatically adjusting model settings, making the modeling process easier and faster. A significant advantage of PyCaret is also its capacity to seamlessly integrate multiple machine learning libraries. Within PyCaret, it can be effortlessly utilized algorithms from scikit-learn and many other libraries without switching environments or writing intricate code (www.pycaret.org).
2.4. Data Preproccesing and Finalize Model
In order to demonstrate the use of the prediction on unseen data, a sample of 28 records (~5%) has been withheld from the original dataset. Categorical variables automatically converted into numeric formats using methods one-hot encoding, ordinal encoding, and others. Data normalization was performed before model develepment with zscore that is a technique often applied as part of data preparation for machine learning. The process of normalization involves re-scaling the values of numeric columns in a dataset while maintaining the integrity of the range differences and associated information. Yeo-Johnson method was used for feature transformation. The primary goal of transformation is to adjust the distributional shape, allowing the data to achieve a normal or satisfactory approximation of normality. The data sets were randomly divided into training and independent testing sets. To avoid overfitting, 5-fold cross-validation was performed during training. Performance visualization for a maching learning understanding of model performance, it was evaluated with the plots of ROC curve, confusion matrix, and classification report. Overall, 15 machine learning (ML) algorithms were used. The area under the curve (AUC), accuracy, recall, precision and F1 scores were compared with the performances of the ML algorithms. The best model for accuracy and AUC was selected and evaluated on the test set. AUC, accuracy, recall, precision, and F1 scores were given by the confusion matrix. To evaluate the contribution and impact of individual clinical features on the model’s predictions, Shapley Additive exPlanations (SHAP) values and feature importance were calculated [14]. The best model was moved forward with finalizing and predicting on unseen
3. Results
3.1. Study Participants
A total of 315 patients were identified with PA, whereas 249 women constituted the group with no abruption. The analysis of the selected integrated continuous features showed as follows: The maternal age was not different between the two group of cases. The mean BMI was 22.18 ± 3.39 SD in the PA cases and 21.65 ± 3.25 SD in the non-PA cases. The difference in BMI between the two groups was not statistically significant (p>0.05). The mean gestational age at delivery in the PA group was significantly lower (31.49±4.55 SD weeks) compared to the non-PA group (37.48± 2.08 SD weeks). The mean preoperative hemoglobin level in the placental abruption group was significantly lower compared to the non-abruption group. A statistically significant association was found between PROM and the presence of placental abruption. The PROM rate was lower in the placental abruption group (27/315) compared to the non-abruption group (40/249). The analysis revealed an Odds Ratio of 0.490 with a 95 % Confidence Interval (CI) of (0.292 – 0.824). A considerable number of Placental Abruption cases (279 out of 315) occurred in patients who did not use Enoxaparin, while 60 patients in the non-abruption group reported Enoxaparin use. The analysis yielded an Odds Ratio of 0.406 with a 95% Confidence Interval (CI) of (0.258 – 0.639) (Table.1).
3.2. Abruptio Prediction
The results of the binary classification models for 15 Machine Learning (ML) algorithms conducted with the PyCaret library. Logistic regression was chosen as the best model. The metrics were determined as follows: accuracy rate of 0.83, AUC of 0.91, recall of 0.83, precision of 0.86, and F1 score of 0.85 (Table 2). It is observed from the confusion matrix plot, 82 women who had PA in true positive group and 61 women who had no PA in true negative group. In the classification report, the measurement metrics are higher for two groups of women. (Figure 2 and Figure 3). The comprehensive analysis of the Receiver Operating Characteristic (ROC) curves yielded an Area Under the Curve (AUC) value of 0.96 for both PA and non-PA classes, as well as for the micro- and macro-average metrics ( Figure 4) . A maximum KS Statistic of 0.73 was observed at a threshold of 0.53, confirming perfect separation between the cumulative distributions of the two classes. The ranking of independent features based on their importance in the classification model gestational age at delivery were observed to have the highest importance for classification (Figure 5). The SHAP summary plot (Figure 6 ) illustrates the global importance and the directional influence of the top features. Primary predictors and directionality gestational age at delivery was identified as the most significant feature influencing the model’s output. High SHAP values were consistently associated with lower gestational ages (represented by blue points). Other variables, including BMI and Maternal Age, demonstrated moderate importance. For BMI, higher values (red points) were generally associated with a positive shift in SHAP values, though the magnitude of this effect was considerably smaller than that of gestational age. Similarly, increased maternal age showed a slight positive correlation with the risk scores. Out of 28 unseen cases, 22 women were accurately predicted (9 without and 13 with PA), yielding an accuracy score of 0.78.
3.3. Figures and Tables
Figure 1.
The classification model framework is structured to process raw data, segment it for rigorous training and evaluation, and execute a binary classification task.
Figure 1.
The classification model framework is structured to process raw data, segment it for rigorous training and evaluation, and execute a binary classification task.
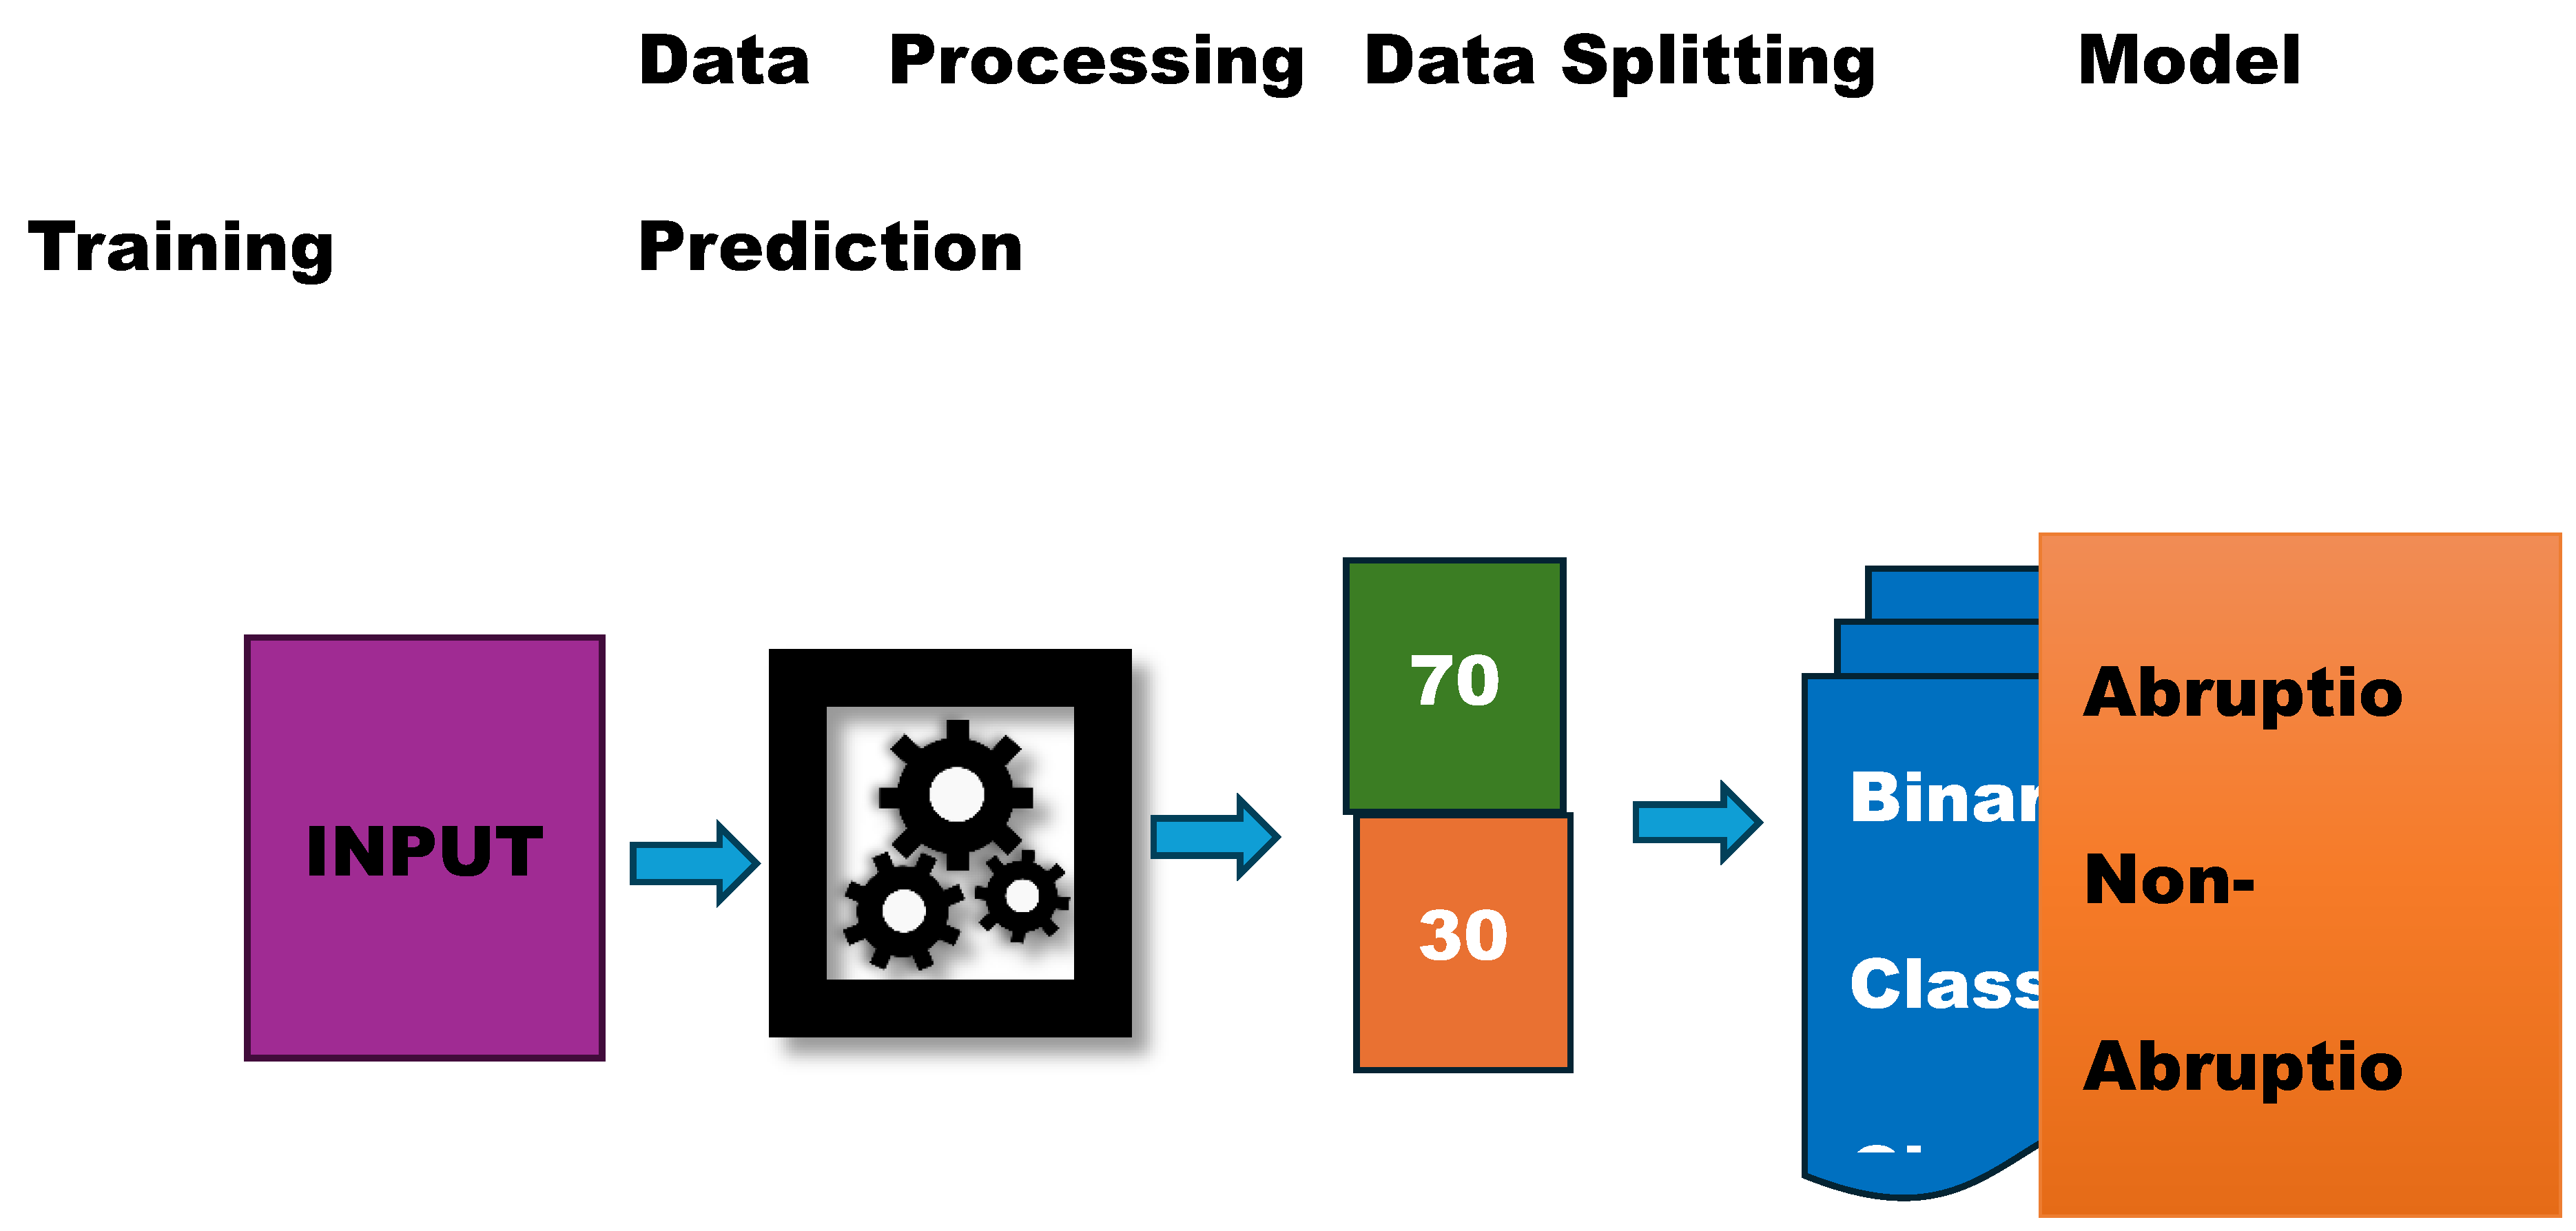

Table 1.
The clinical and sociodemographic characteristics of the study groups.
| Characteristic | Without Placental Abruptio (n=249) | With Placental Abruptio (n=315) | Statistical Test and p-value |
|---|---|---|---|
| Maternal Age (Mean years) | 30,15 | 28,46 | Mann-Whitney U Test p< 0.05 |
| Gestational Age at Delivery (Mean weeks) | 37.48 | 31.49 | Mann-Whitney U Test p< 0.05 |
| Preoperative Blood Hemoglobin Count (Mean gr/L) | 12.23±1,13 SD | 10.59 ±1,13 SD | t-Test p < 0.05 |
| Body Mass Index (BMI) | 21.65 ±3.25 SD | 22.18 ±3.39 SD | t-Test p > 0.05 |
|
Enoxaparin Use Presence (n,%) |
60 (14,9 %) | 36 ( 11 %) | Chi-square, p < 0.05 Odds Ratio:0.40 |
| Premature Membrane Rupture Presence (n, %) | 40 (16%) | 27 (8%) | Chi-square, p <0.05 Odds Ratio: 0.49 |
Figure 2.
Confusion Matrix of Logistic Regression demonstrates the ability of the models to maintain high precision across a wide range of recall values, indicating consistent predictive power for identifying placental abruption (0: Without Placental Abruptio, 1: With Placental Abruptio).
Figure 2.
Confusion Matrix of Logistic Regression demonstrates the ability of the models to maintain high precision across a wide range of recall values, indicating consistent predictive power for identifying placental abruption (0: Without Placental Abruptio, 1: With Placental Abruptio).
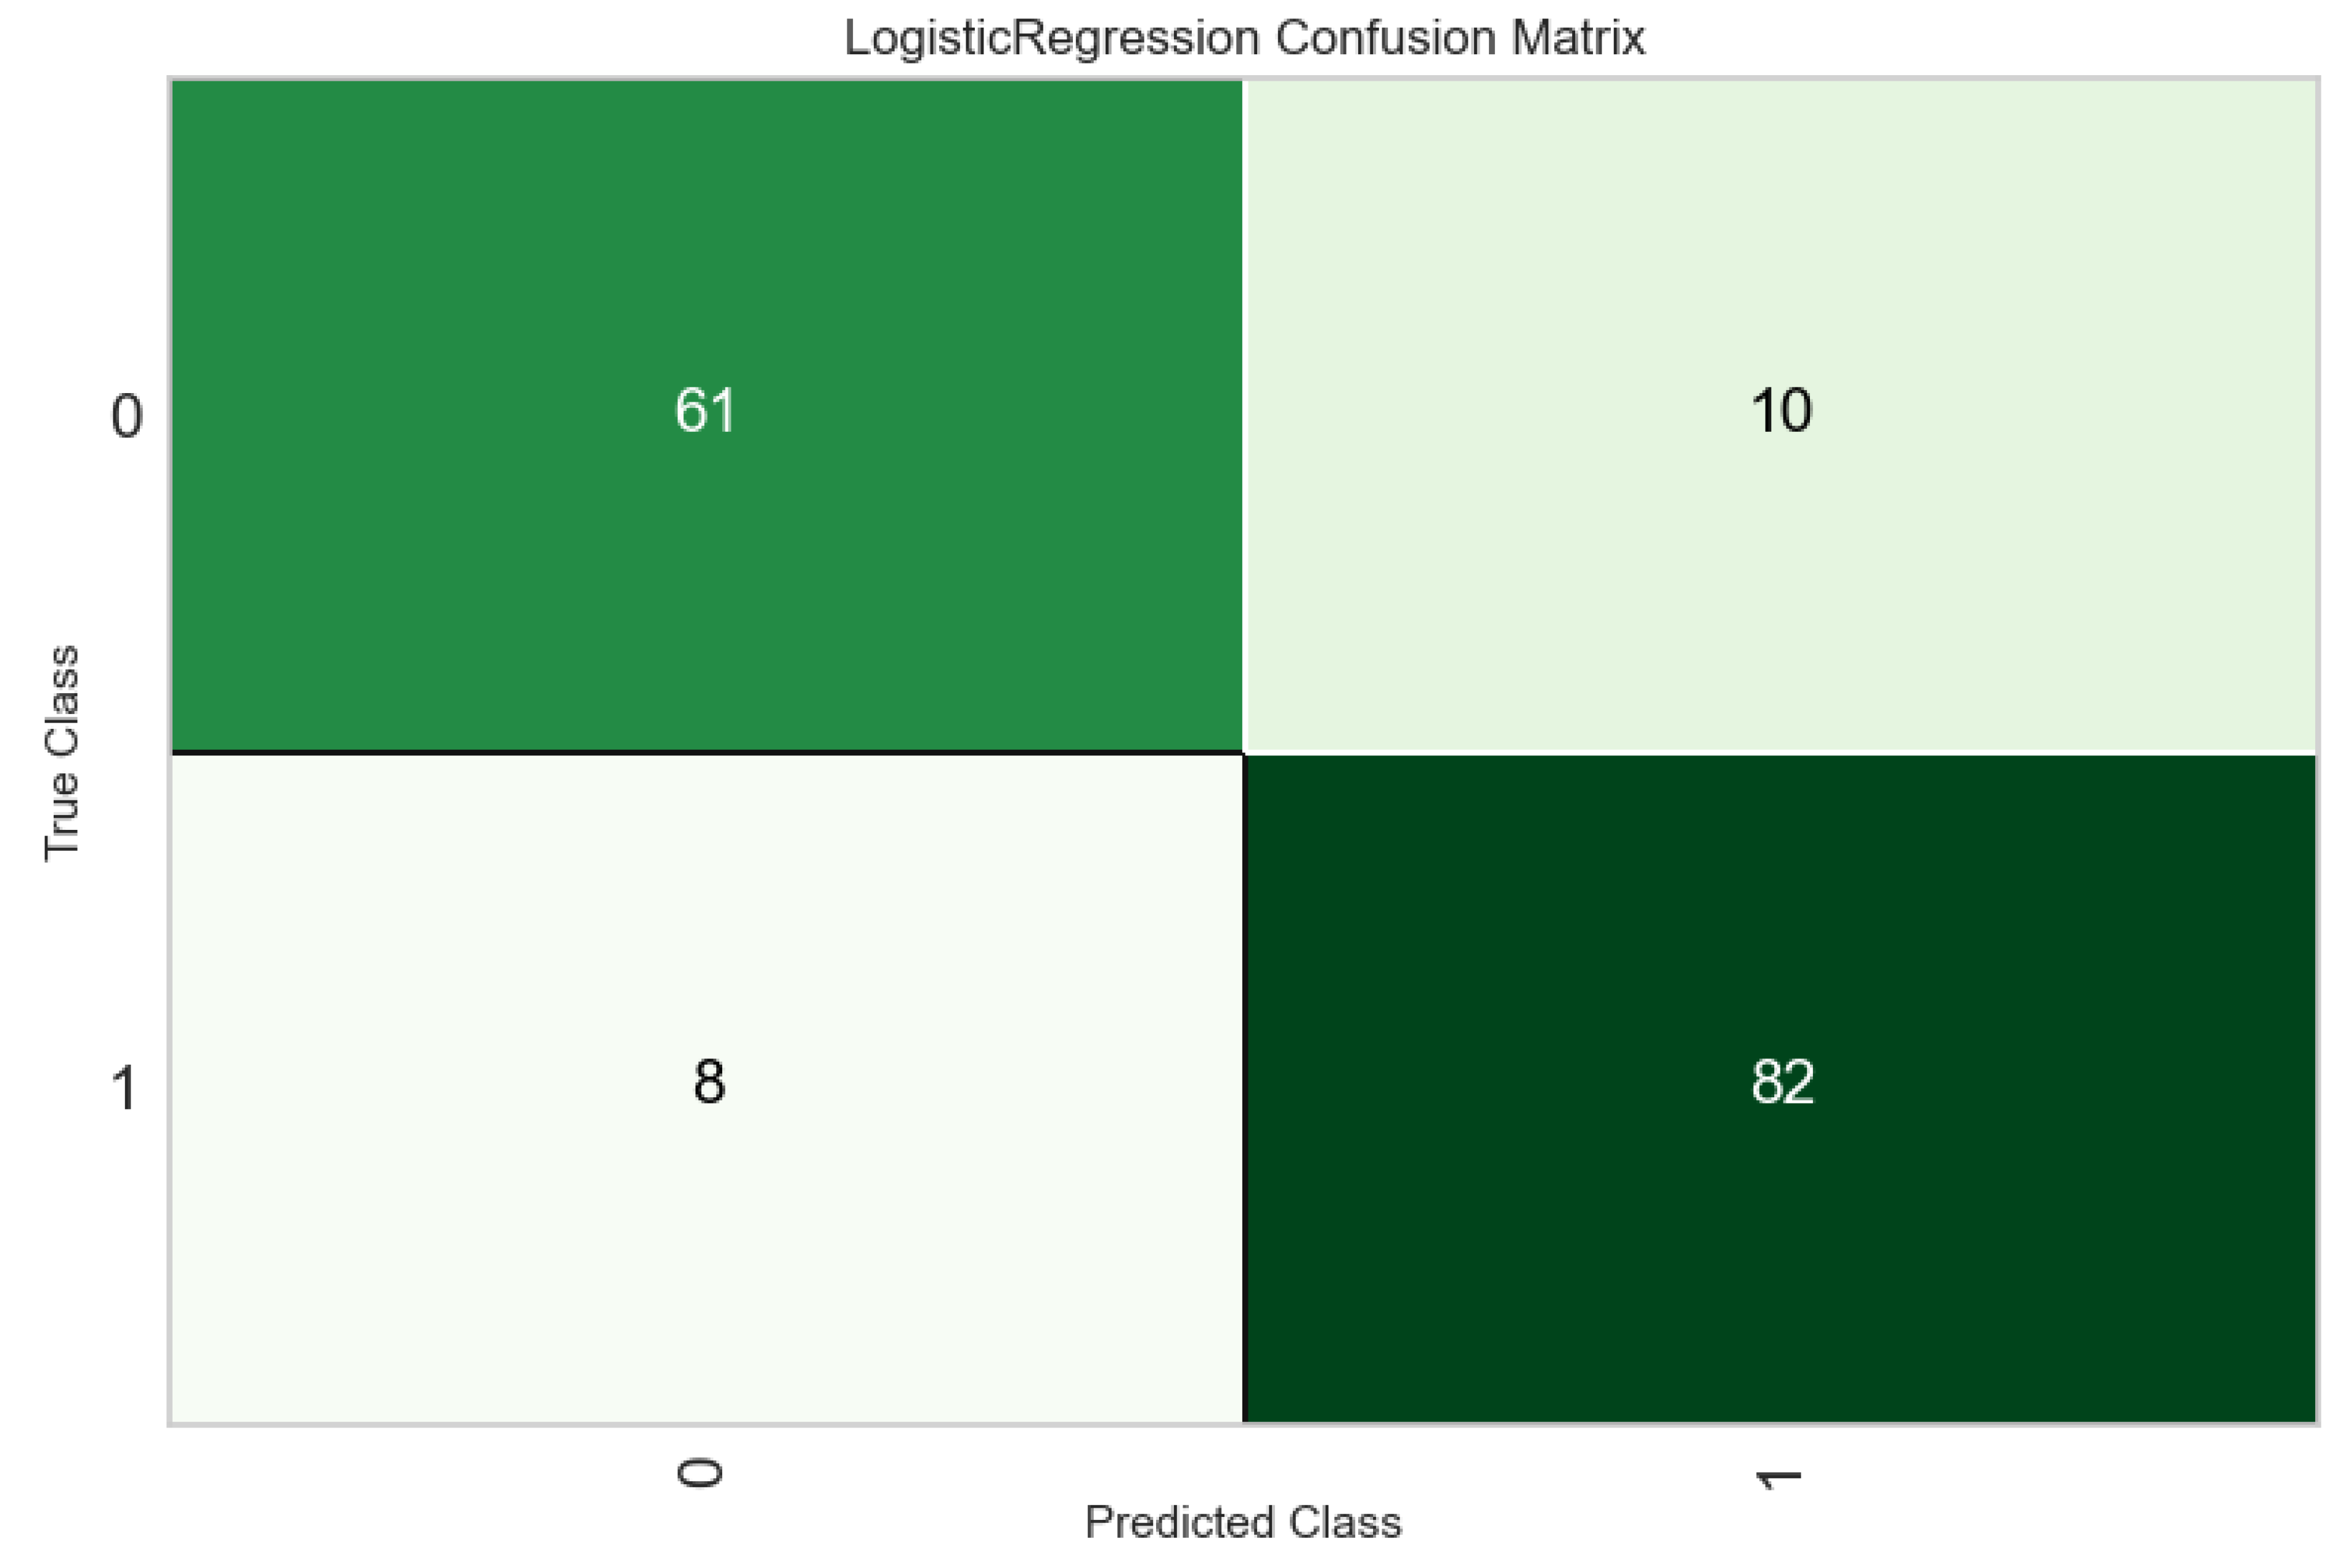
Table 2.
The Machine Learning Metrics of 15 Classificiation Algorithm.
| Model | Accuracy | AUC | Recall | Prec. | F1 Score |
|---|---|---|---|---|---|
| Logistic Regression | 0,8373 | 0,9101 | 0,8372 | 0,8669 | 0,8515 |
| Quadratic Discriminant Analysis | 0,8347 | 0,898 | 0,837 | 0,8648 | 0,8498 |
| Ridge Classifier | 0,832 | 0,9102 | 0,8036 | 0,8845 | 0,8406 |
| Linear Discriminant Analysis | 0,832 | 0,9102 | 0,8036 | 0,8845 | 0,8406 |
| CatBoost Classifier | 0,832 | 0,8967 | 0,8468 | 0,8524 | 0,8492 |
| Naive Bayes | 0,824 | 0,891 | 0,8085 | 0,8711 | 0,8371 |
| Extra Trees Classifier | 0,824 | 0,8836 | 0,8372 | 0,8465 | 0,8414 |
| Ada Boost Classifier | 0,8213 | 0,8683 | 0,8324 | 0,8465 | 0,8382 |
| Gradient Boosting Classifier | 0,8213 | 0,8818 | 0,8326 | 0,851 | 0,8388 |
| Random Forest Classifier | 0,816 | 0,8825 | 0,842 | 0,8338 | 0,8368 |
| K Neighbors Classifier | 0,8107 | 0,8692 | 0,8134 | 0,8421 | 0,8265 |
| Light Gradient Boosting Machine | 0,8027 | 0,8828 | 0,8326 | 0,8199 | 0,8239 |
| SVM - Linear Kernel | 0,7707 | 0,8682 | 0,8135 | 0,7929 | 0,7987 |
| Decision Tree Classifier | 0,7547 | 0,7504 | 0,7897 | 0,7768 | 0,7806 |
| Dummy Classifier | 0,5573 | 0,5 | 1 | 0,5573 | 0,7157 |
Figure 3.
Classification Report of Logistic Regression reveals the distribution of true positive, true negative, false positive, and false negative predictions, showing high classification accuracy (0: Without Placental Abruptio, 1: With Placental Abruptio).
Figure 3.
Classification Report of Logistic Regression reveals the distribution of true positive, true negative, false positive, and false negative predictions, showing high classification accuracy (0: Without Placental Abruptio, 1: With Placental Abruptio).
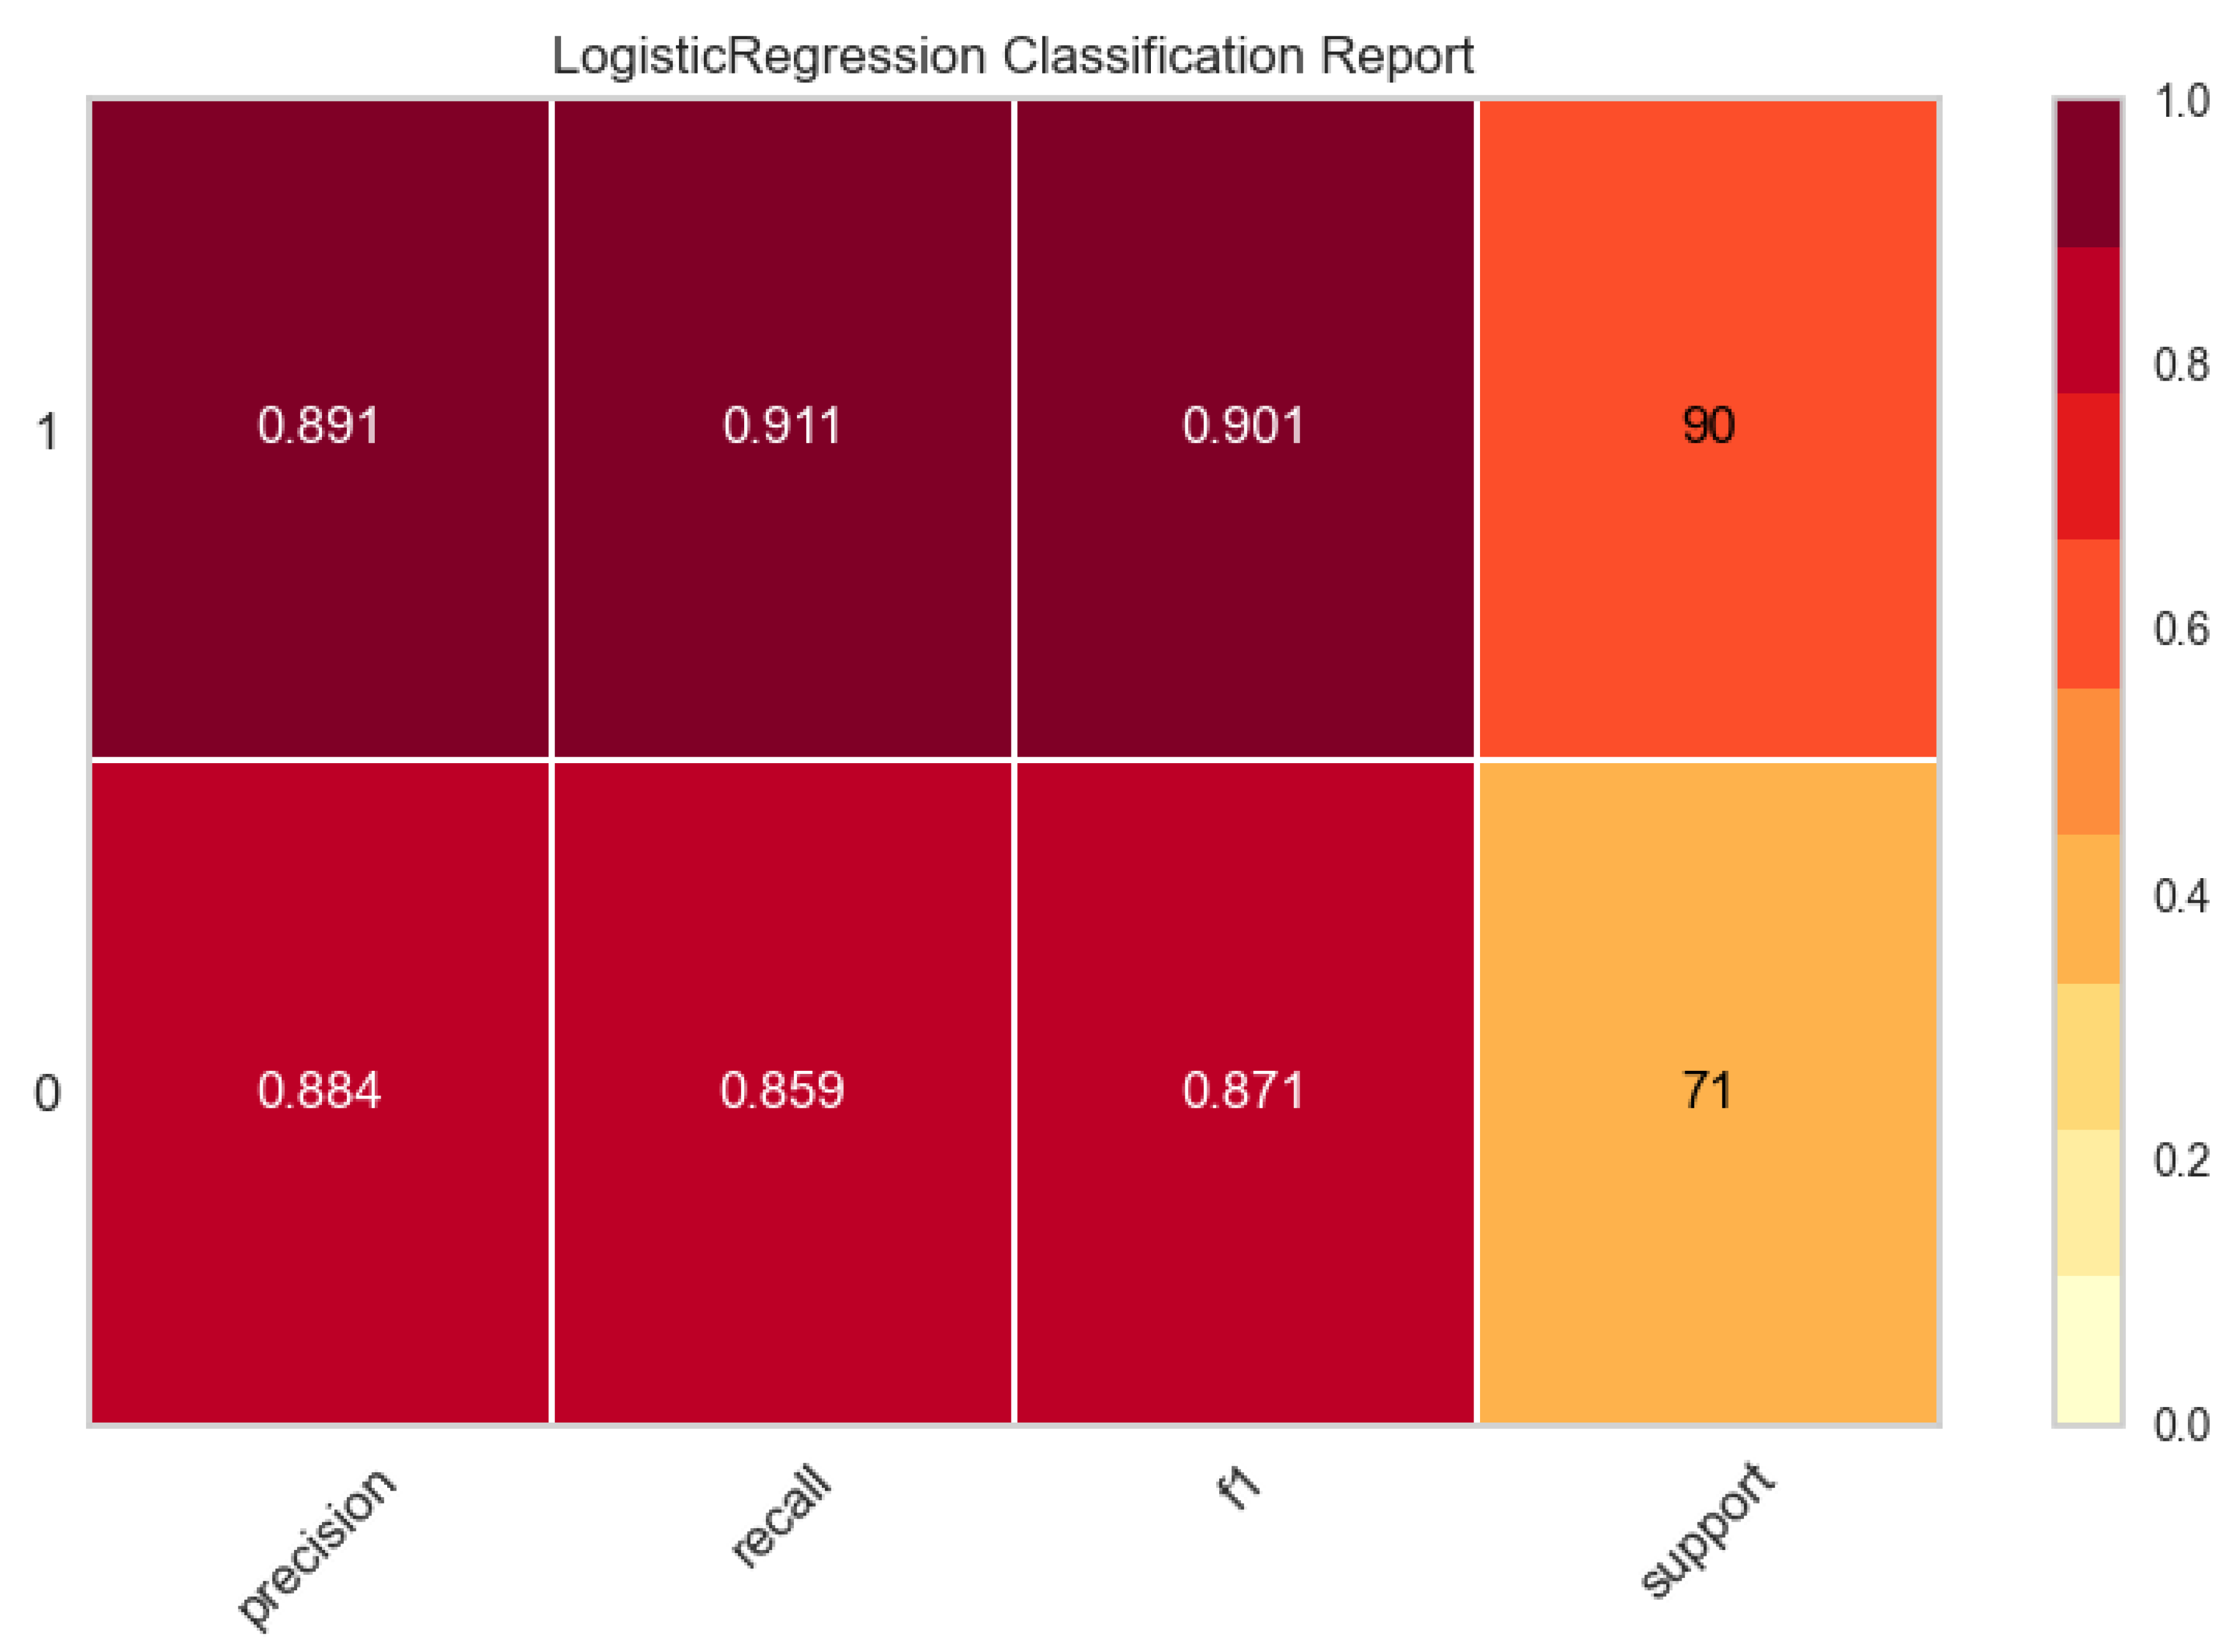
Figure 4.
Receiver Operating Curve (ROC) highlights the strong discriminatory performance of ensemble and linear models, with AUC values of 0.96, confirming excellent separation between abruption and non-abruption cases.
Figure 4.
Receiver Operating Curve (ROC) highlights the strong discriminatory performance of ensemble and linear models, with AUC values of 0.96, confirming excellent separation between abruption and non-abruption cases.
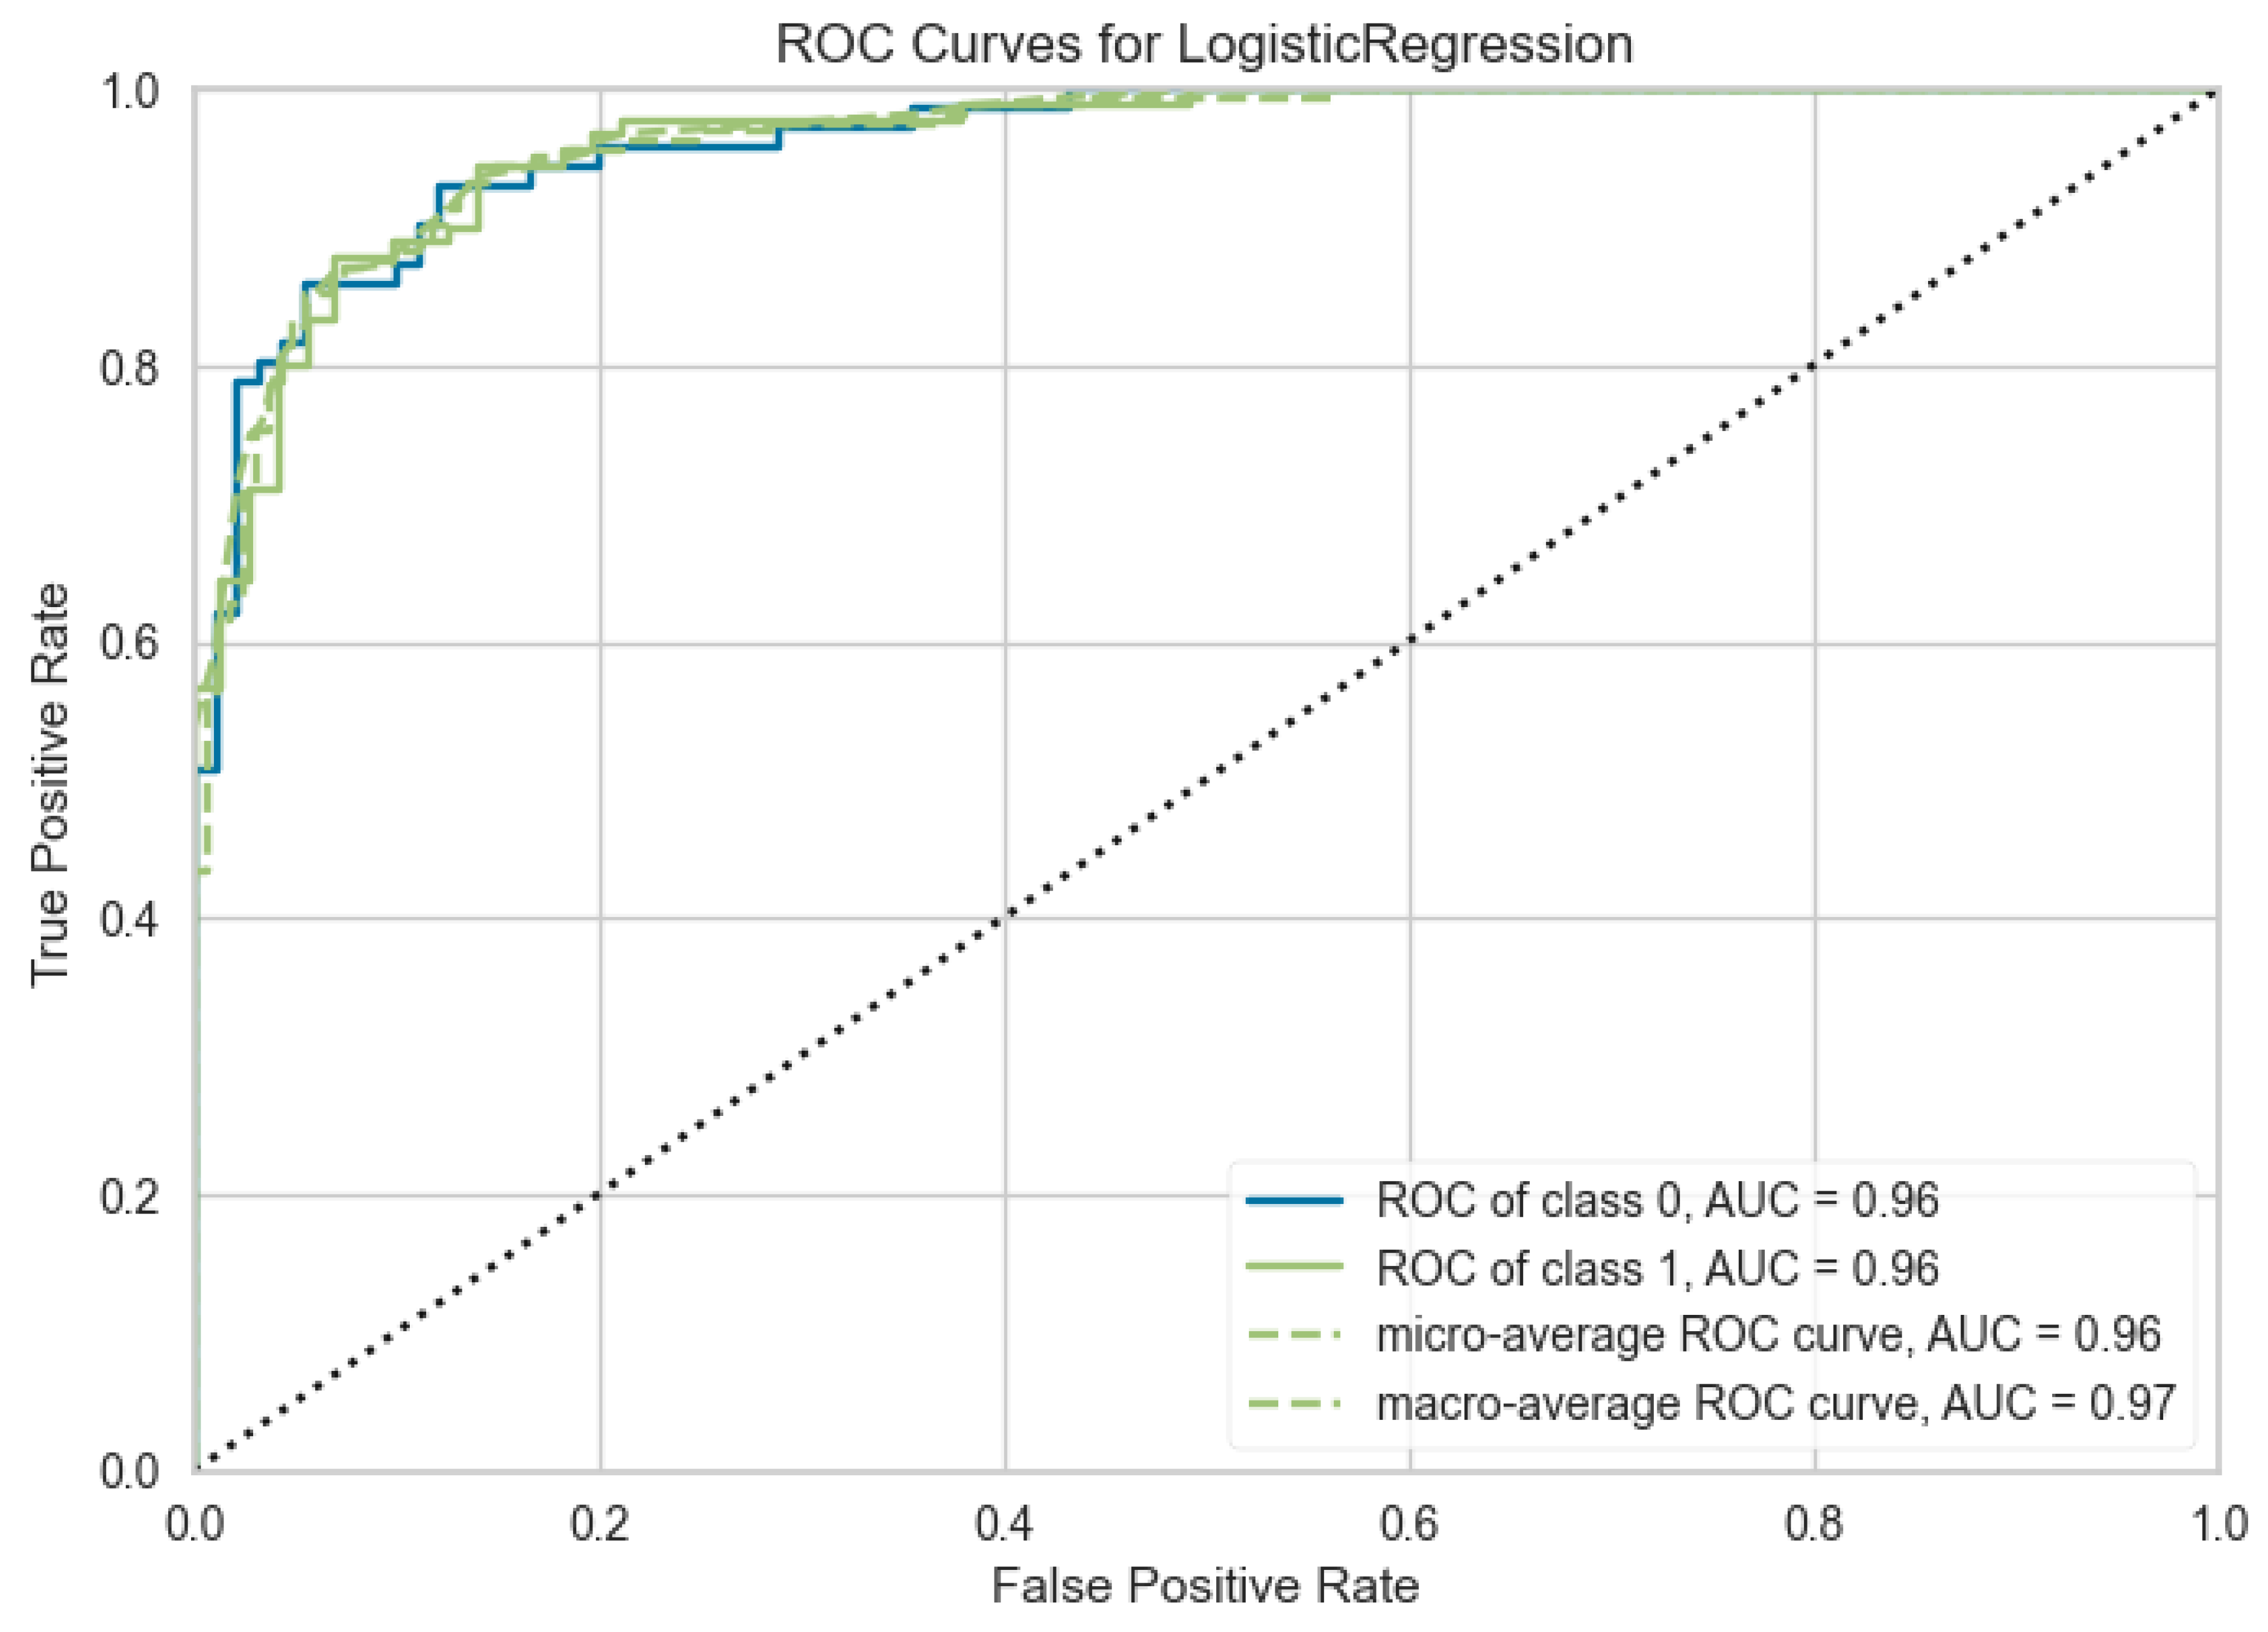
Figure 5.
Variable Importance of Features with Logistic Regression.
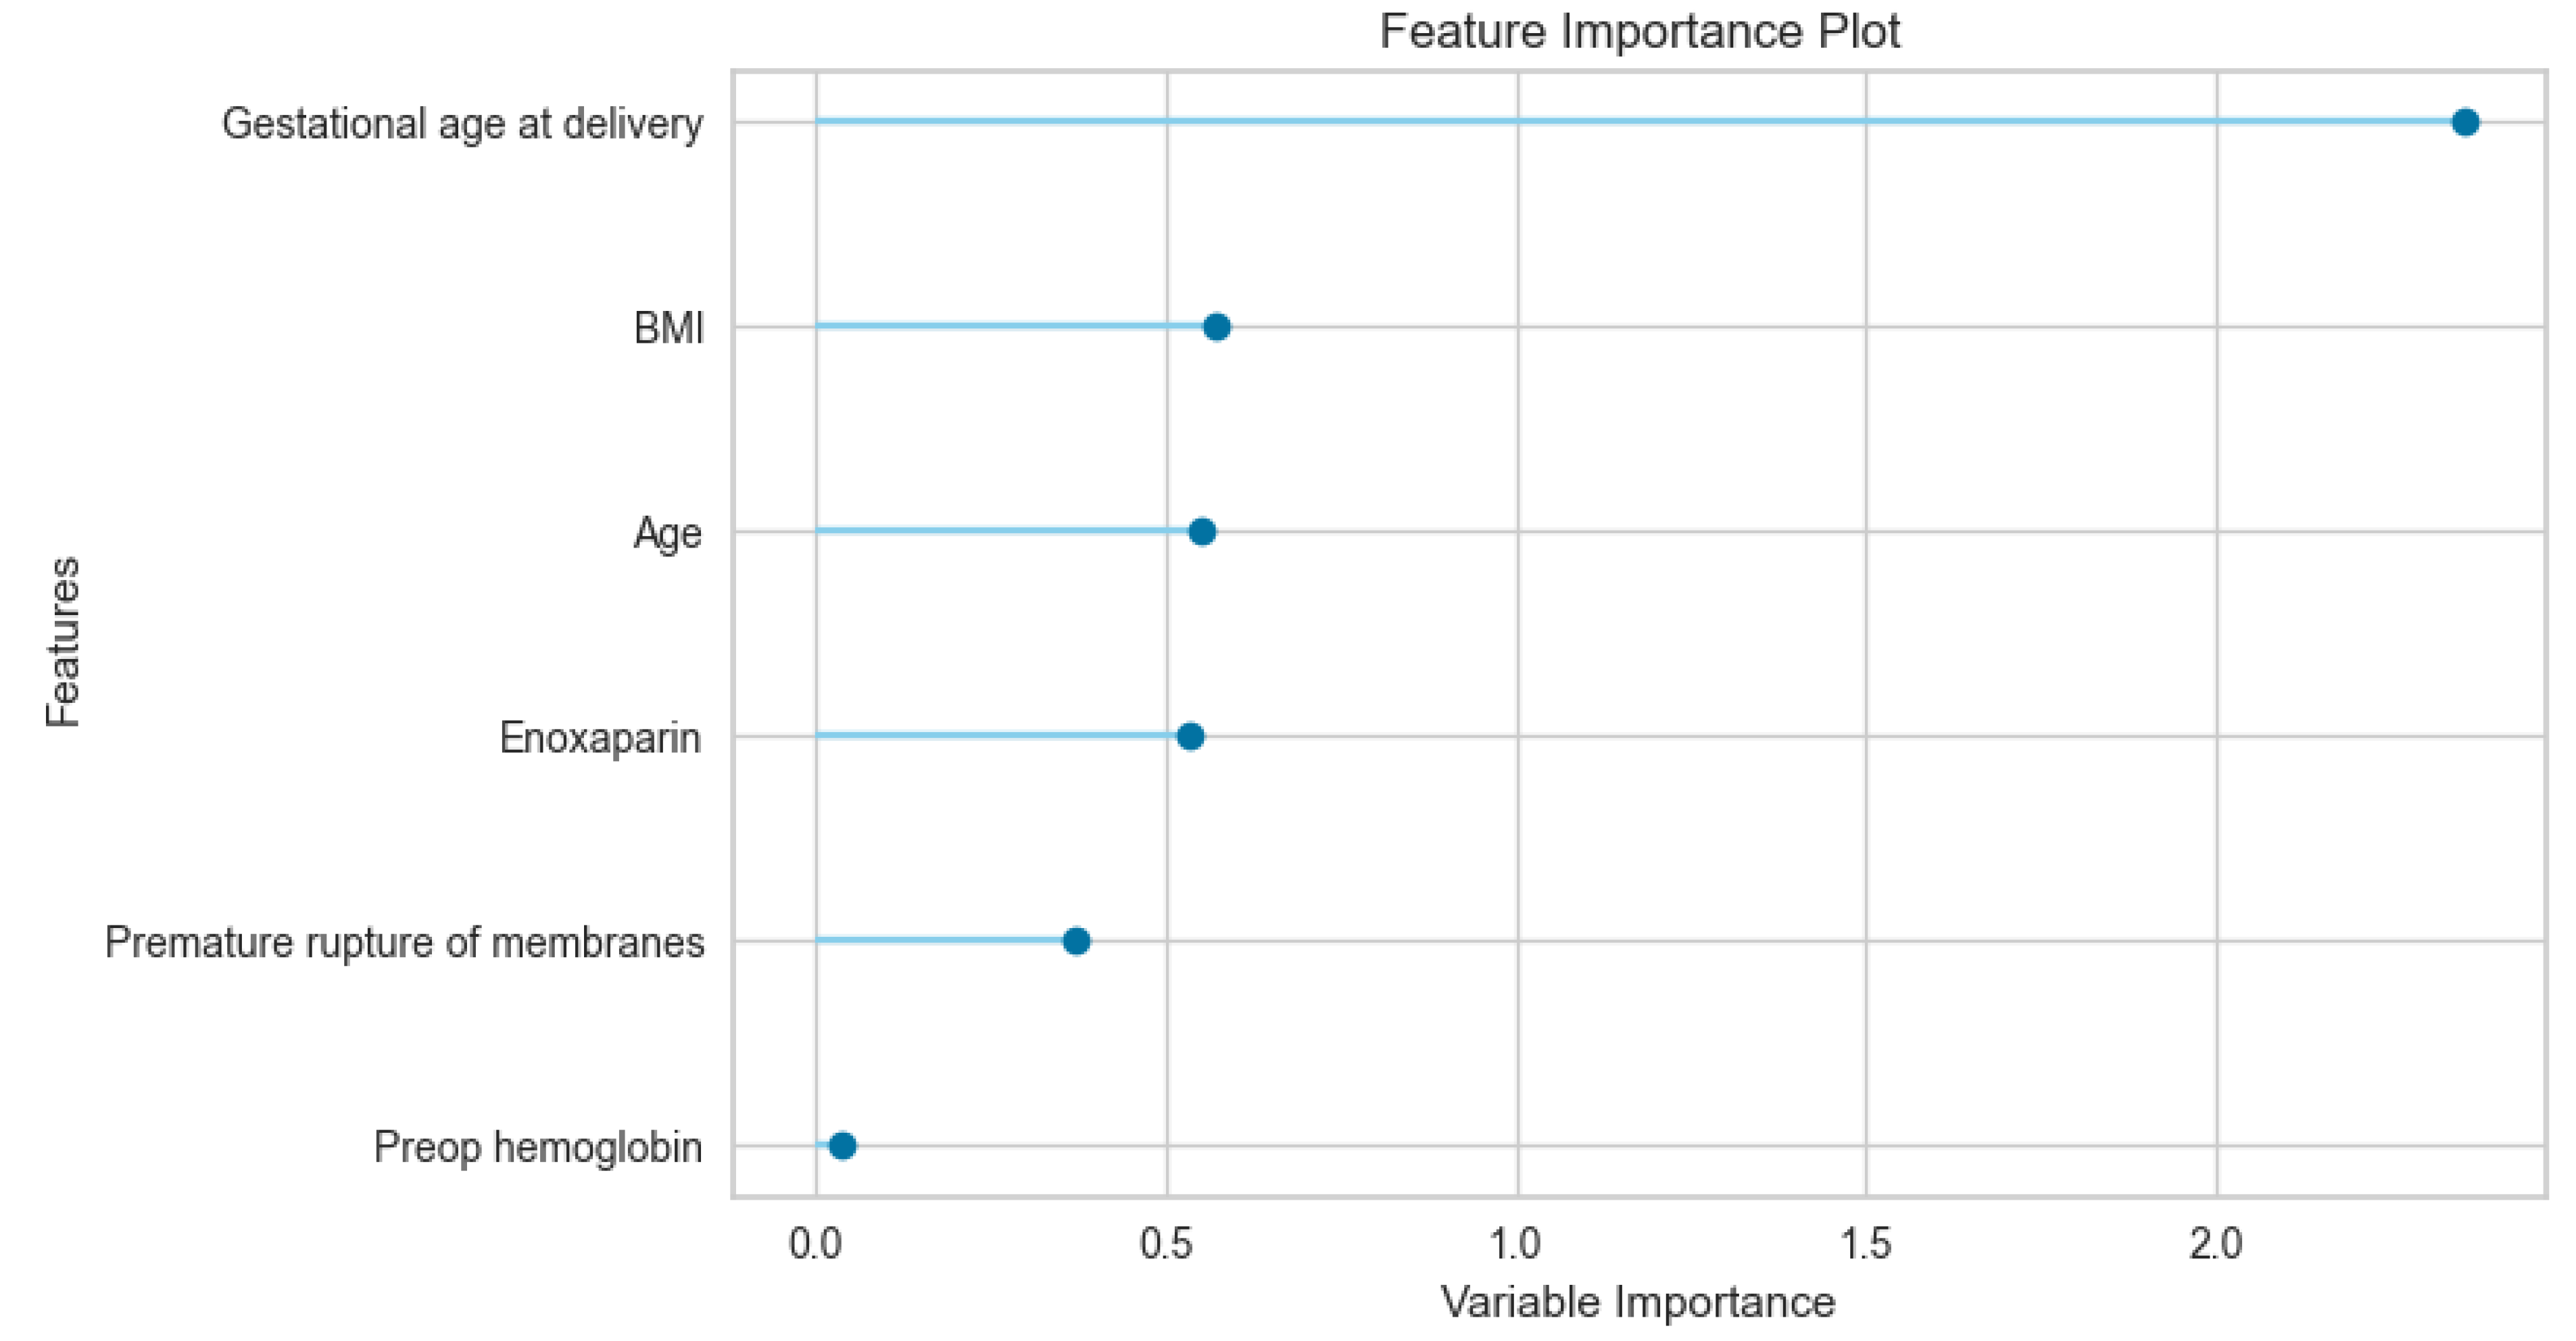
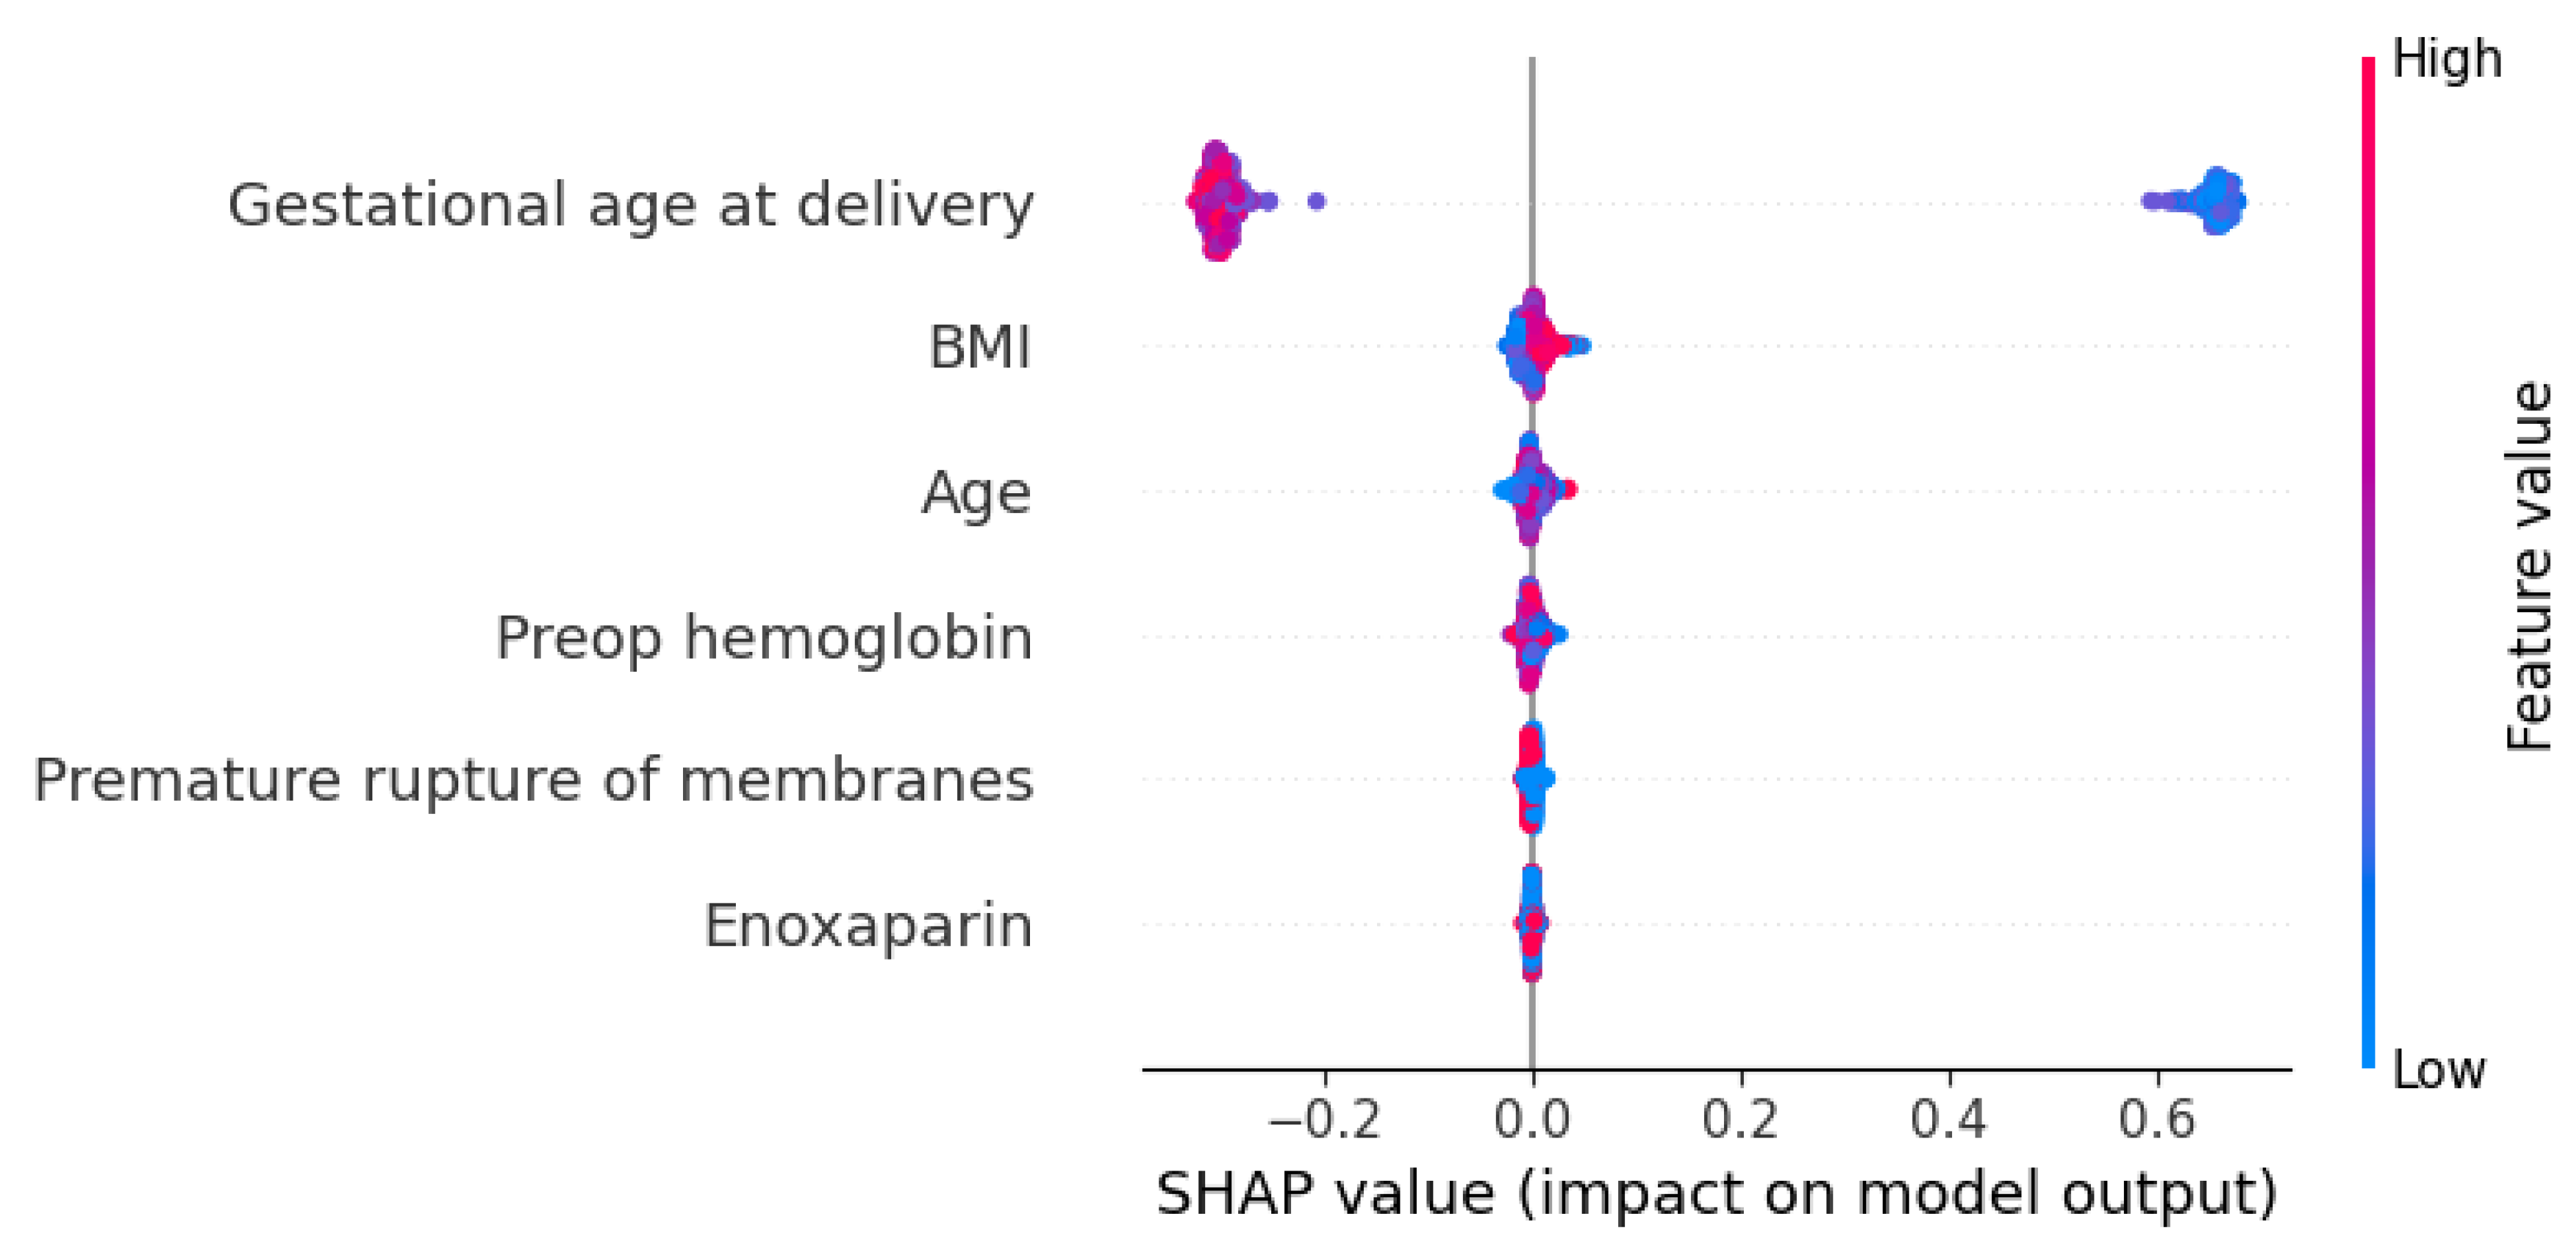
Figure 6.
Visual Representation of the Feature Importance Using Shapley Additive exPlanations (SHAP) Values.
Figure 6.
Visual Representation of the Feature Importance Using Shapley Additive exPlanations (SHAP) Values.
4. Discussion
4.1. The Study’s Main Outcomes
In this study, we evaluated 315 women with PA and 249 women with no PA. The clinical and demographic dataset was used based on parameters identified in previous studies concerning placental abruption We evaluated the potential of a 15 machine learning models for predicting placental abruptio. Logistic regression was the most important algorithm among these algorithms in differentiating completely separating for placental abruptio. The machine learning metrics showed that accuracy, recall, precision, and F1 scores are higher. The majority of the our 15 models (14 models) assessed in this qualitative synthesis had an AUC between 0.78 and 0.83 , with classified as highly discriminative.
4.2. The Analysis of The Maternal and Pregnacy Features As a Risk Factor
Except for BMI, all analyzed maternal and pregnancy characteristics (Preop Hemoglobin, Gestational Age at Delivery, Age, Enoxaparin Use, and PROM) showed a statistically significant association or difference with the presence of Placental Abruption. These findings suggest that multiple factors, particularly maternal age, low Preop Hb levels, and premature delivery, are significantly related to this adverse outcome in the studied population.
The feature importance analysis reveals that gestational age at delivery serves as the predominant predictor within the model, significantly outweighing maternal demographic and clinical factors. The high variable importance score (>2.3) assigned to gestational age underscores its critical role in determining the studied outcome. This finding aligns with established obstetric literature, which consistently identifies the timing of delivery as a primary determinant of neonatal and maternal morbidity [15]. On average, pregnancies complicated by abruption terminate approximately 3 to 4 weeks earlier than pregnancies without this complication [16].
The secondary cluster of predictors—BMI, maternal age, and Enoxaparin administration—demonstrated moderate and relatively uniform importance (ranging between 0.5 and 0.6). The relevance of BMI and age suggests that the model accounts for baseline physiological risks and metabolic profiles, which are known to influence surgical and obstetric trajectories.
The calculated Odds Ratio is significantly less than 1, confirming a strong, statistically significant inverse association between Enoxaparin use and the risk of Placental Abruption. The inclusion of Enoxaparin as a contributing feature may reflect the impact of thromboprophylaxis protocols or the underlying hypercoagulable states on the model's predictive accuracy. It is concluded that Enoxaparin use appears to be associated with a substantial reduction in the incidence of Placental Abruption. This protective effect aligns with findings from a systematic review and metanalysis demonstrating the benefit of low-molecular-weight heparin (LMWH) in improving placental outcomes, particularly in pregnancies complicated by underlying thrombophilias [17].
Interestingly, premature rupture of membranes (PROM) and preoperative hemoglobin yielded the lowest importance scores. However, the OR value, being less than 1, confirms an inverse relationship between the PROM and PA. This finding suggests that the presence of Premature Rupture of Membranes is associated with a reduced risk of Placental Abruption, rather than an increased risk. Specifically, women with PROM had approximately 51% lower odds of developing Placental Abruption compared to women without PROM. Since the 95% CI does not include unity 1, this inverse association is considered statistically significant. The marginal contribution of preoperative hemoglobin is particularly noteworthy, suggesting that within this specific cohort, variations in baseline blood counts were less influential than timing and physical characteristics. Regarding preoperative hemoglobin levels in this investigation, placental abruption group presented with greater anemia, because of a condition attributed to the excessive bleeding volume observed within the detached placental area in line with the literature [18,19].
Feature importance identifies key predictors but fails to define the direction of their relationships or the specific contribution of each parameter. Consequently, we utilized SHAP value analysis to further investigate these effects. This analysis would bridge this gap by showing the directionality (positive or negative correlation) and the magnitude of each feature's impact on individual predictions. The gestational age at delivery exerted the most profound effect on the model output, characterized by a strong negative correlation; specifically, lower gestational ages significantly increased the predictive risk scores. In contrast, maternal demographic factors such as BMI and Age demonstrated only marginal influence, with high values contributing minor positive increments to the model output. These findings suggest that while maternal physiological state provides context, the temporal factor of delivery timing is the primary determinant within our predictive framework.
4.3. The Analysis of our Machine Learning Model for Placental Abruptio
Research addressing the predictive modeling of placental abruption through machine learning frameworks is currently underrepresented in the literature. Most of these studies primarily focus on predicting maternal risk factors [20]. Thus we have developed, with the aid of machine-learning techniques and using commonly available clinical data for prediction PA According to our results, machine learning can be used successfully for prediction of PA. Multiple 15 different machine learning algorithms were used together to distinguish PA which may allow for the selection of the best model. In this respect, it may be one of the unique studies by using automated different machine learning algorithms.Additionally, the cross-validation results we conducted with unseen data were not different from the finalized model that could mitigate overfitting. That is why we reliably ensured extra validation of our modeling. On the other hand, we believe that if independently validated in larger studies, it could be useful to differentiate PA.
4.4. Limitations
Despite the predictive accuracy achieved, this study is limited by its retrospective nature and the reliance on a specific set of clinical features. The data were collected from a single institution, which may reflect specific local clinical practices and demographic characteristics. This limits the external validity of the findings, and the model’s performance in different healthcare settings or geographic regions remains to be validated. While the model incorporates significant clinical and demographic variables, it lacks certain dynamic biomarkers (such as continuous fetal heart rate monitoring data or real-time angiogenic markers) that could potentially enhance predictive accuracy in the immediate pre-abruption period. As noted in our analysis, the current model primarily emphasizes maternal risk factors. The exclusion of detailed neonatal outcome parameters or long-term follow-up data limits the scope of the prediction to the immediate peripartum window
5. Conclusions
In conclusion, using an extensive set of PA , we used machine learning techniques to develop a pilot model with a 91 % AUC to predict PA . The high success rate of PA prediction using maternal, neonatal, and obstetric risk factors is encouraging in terms of reducing PA rates through prenatal care precautions. We believe that the optimization of predictive machine learning models for PA integrating AI-driven predictive tools into obstetric practice has the potential to enhance clinical decision-making and improve maternal-fetal outcomes through earlier intervention. Future multi-center studies are warranted to validate these models across broader populations and to incorporate real-time biomarkers for dynamic risk assessment.
Author Contributions
Conceptualization, Ahmet Serel; methodology, Esin Merve Koç.; software, Ahmet Serel; validation, Ahmet Serel.; formal analysis, Eda Uysal Aydın.; investigation, Oğuz Uğur Aydın,Furkan Umut Kılıç.writing—original draft preparation, Ahmet Serel.; writing—review and editing, Ahmet Serel.; All authors have read and agreed to the published version of the manuscript.”.
Funding
This research received no external funding.
Institutional Review Board Statement
Ethical review and approval were waived for this study due to retrospective study because the data were anonymized.
Informed Consent Statement
Not applicable.
Data Availability Statement
Data are available on request due to privacy/ethical restrictions.
Conflicts of Interest
The authors declare no conflicts of interest.
References
- Maeland, KS; Morken, NH; Schytt, E; et al. Placental abruption in immigrant women in Norway: a population-based study. Acta Obstet Gynecol Scand. 2021, 100(4), 658–65. [Google Scholar] [CrossRef] [PubMed]
- Nkwabong, E; Tiomela, GG. Placenta abruption surface and perinatal outcome. J Matern Fetal Neonatal Med. 2017, 30(12), 1456. [Google Scholar] [CrossRef] [PubMed]
- Mehraban, SS; Lagodka, S; Kydd, J; et al. Predictive risk factors of adverse perinatal outcomes following blunt abdominal trauma in pregnancy. J Matern Fetal Neonatal Med. 2022, 35(25), 8929–35. [Google Scholar] [CrossRef] [PubMed]
- Arlier, S; Adiguzel, C; Yilmaz, ES. The role of mean platelet volume and platelet distribution width in the prediction of placental abruption. J Obstet Gynaecol. 2016, 36(7), 950–3. [Google Scholar] [CrossRef] [PubMed]
- Charbit, B; Mandelbrot, L; Samain, E; et al. The decrease of fibrinogen is an early predictor of the severity of postpartum hemorrhage. J Thromb Haemost. 2007, 5(2), 266–73. [Google Scholar] [CrossRef] [PubMed]
- Hall, DR. Abruptio placentae and disseminated intravascular coagulopathy. Semin Perinatol. 2009, 33(3), 189–95. [Google Scholar] [CrossRef] [PubMed]
- Mei, Y; Lin, Y. Clinical significance of primary symptoms in women with placental abruption. J Matern Fetal Neonatal Med. 2018, 31(18), 2446–9. [Google Scholar] [CrossRef] [PubMed]
- Oyelese, Y; Ananth, CV. Placental abruption. Obstet Gynecol. 2006, 108(4), 1005–16. [Google Scholar] [CrossRef] [PubMed]
- Von Dadelszen, P; Payne, B; Li, J; et al. Prediction of adverse maternal outcomes in pre-eclampsia: development and validation of the fullPIERS model. Lancet 2011, 377, 219–27. [Google Scholar] [CrossRef] [PubMed]
- Marić, I; Tsur, A; Aghaeepour, N; et al. Early prediction of preeclampsia via machine learning. Am J Obstet Gynecol MFM 2020, 2, 100100. [Google Scholar] [CrossRef] [PubMed]
- Jhee, JH; Lee, S; Park, Y; et al. Prediction model development of late-onset preeclampsia using machine learning-based methods. PloS one 2019, 14(8). [Google Scholar] [CrossRef] [PubMed]
- Arain, Z; Iliodromiti, S; Slabaugh; et al. Machine learning and disease prediction in obstetrics. Curr Res Physiol. 2023, 6, 100099. [Google Scholar] [CrossRef] [PubMed]
- Jenabi, E.; Salimi, Z.; Ayubi, E; et al. The environmental risk factors prior to conception associated with PA: an umbrella review. Systematic reviews 2022, 11(1), 55. [Google Scholar] [CrossRef] [PubMed]
- Cao, S.; Hu, Y. Creating machine learning models that interpretably link systemic inflammatory index, sex steroid hormones, and dietary antioxidants to identify gout using the SHAP (SHapley Additive exPlanations) method. Frontiers in immunology 2024, 15, 1367340. [Google Scholar] [CrossRef] [PubMed]
- Ananth, CV; Wilcox, AJ. Placental abruption and perinatal mortality in the United States. Am J Epidemiol. 2001, 153(4), 332–7. [Google Scholar] [PubMed]
- Mei, Y; Lin, Y. Clinical significance of primary symptoms in women with placental abruption. Matern Fetal and Neonatal Med 2018, 31(18), 2446–2449. [Google Scholar] [CrossRef] [PubMed]
- Chen, Y; Wang, T; Liu, X; et al. Low molecular weight heparin and pregnancy outcomes in women with inherited thrombophilia: A systematic review and meta-analysis. The journal of obstetrics and gynaecology research 2022, 48(8), 2134–2150. [Google Scholar] [CrossRef] [PubMed]
- Ananth, CV; Lavery, JA; Vintzileos, AM; et al. Severe placental abruption: clinical definition and associations with maternal complications. Am J Obstet Gynecol. 2016, 214(2), 271. [Google Scholar] [CrossRef] [PubMed]
- Chen, D; Gao, X; Yang, T; et al. Independent risk factors for placental abruption: a systematic review and meta-analysis. BMC Pregnancy Childbirth 2025, 26;25(1), 351. [Google Scholar] [CrossRef]
- Vasudevan, L; Kibria, M; Kucirka, L; et al. Machine Learning Models to Predict Risk of Maternal Morbidity and Mortality From Electronic Medical Record Data: Scoping Review. J Med Internet Res 2025, 14, 27. [Google Scholar] [CrossRef] [PubMed]
Disclaimer/Publisher’s Note: The statements, opinions and data contained in all publications are solely those of the individual author(s) and contributor(s) and not of MDPI and/or the editor(s). MDPI and/or the editor(s) disclaim responsibility for any injury to people or property resulting from any ideas, methods, instructions or products referred to in the content. |
© 2025 by the authors. Licensee MDPI, Basel, Switzerland. This article is an open access article distributed under the terms and conditions of the Creative Commons Attribution (CC BY) license (http://creativecommons.org/licenses/by/4.0/).
Copyright: This open access article is published under a Creative Commons CC BY 4.0 license, which permit the free download, distribution, and reuse, provided that the author and preprint are cited in any reuse.


