
Submitted:
29 December 2025
Posted:
30 December 2025
You are already at the latest version
Abstract
This study proposes an indicator system for evaluating AI-assisted learning in higher education, combining evidence-based indicator development with expert-validated weighting. First, we review recent studies to extract candidate indicators and organize them into coherent dimensions. Next, a Delphi session with domain experts refines the second-order indicators and produces a measurable, non-redundant, implementation-ready index system. To capture interdependencies among indicators, we apply a hybrid Decision-Making Trial and Evaluation Laboratory–Analytic Network Process (DEMATEL–ANP, DANP) approach to derive global indicator weights. The framework is validated through an empirical application and qualitative feedback from academic staff. The results indicate that pedagogical content quality, adaptivity (especially difficulty adjustment), formative feedback quality, and learner engagement act as key drivers in the evaluation network, while ethics-related indicators operate primarily as enabling constraints. The proposed framework provides a transparent and scalable tool for quality assurance in AI-assisted higher education, supporting instructional design, accreditation reporting, and continuous improvement.
Keywords:
AI-assisted higher education
; learning effectiveness
; educational evaluation
; indicator framework
; learner engagement
; ethics and governance in education
; Delphi method
; DEMATEL
; Analytic Network Process (ANP)
; Hybrid DEMATEL–ANP method
1. Introduction
Artificial intelligence (AI), and especially recent generative AI (GAI) models, is rapidly transforming higher education by augmenting learning environments with new capabilities. Integrating AI into Learning Management Systems (LMS) promises more personalized instruction, adaptive assessment, and real-time learning analytics [1]. Numerous studies report that AI-driven tools can enhance student engagement, tailor learning pathways, and improve educational quality and learning outcomes [2,3]. For example, recommender systems and conversational agents embedded in AI-enabled LMS have been shown to increase participation and provide individualized support [4,5]. AI adoption also reflects broader transformations in digital higher education, where algorithmic decision-making and automation increasingly shape instructional design [6], learner support [7], and assessment practices [8].
However, these opportunities are accompanied by significant concerns. Deploying AI in education raises technical and ethical challenges (such as data privacy, algorithmic bias, transparency, etc.) that require explicit governance and oversight [1,9]. UNESCO and other international organizations warn that the rapid, largely unregulated diffusion of generative AI has outpaced institutional readiness; many universities remain “largely unprepared to validate” these tools and ensure safe, equitable use [8]. At the same time, educational technologies evolve quickly, making traditional evaluation designs (e.g., long-term randomized trials) difficult to implement in practice [10]. Consequently, systematic evidence on the effectiveness of AI-assisted learning remains limited [11]. Reviews of LMS and e-learning research also highlight the lack of unified models for assessing teaching quality and learning gains in AI-enhanced environments [12]. This leaves faculty and administrators without robust frameworks to identify which AI features genuinely improve learning and which introduce unacceptable risks.
Despite growing empirical studies on AI-assisted learning, there is still no standardized, causal-aware, and expert-validated indicator system that integrates pedagogical effectiveness, analytics-driven adaptivity, and ethical governance within a single evaluation model. Current evaluation approaches are often fragmented, focusing on isolated dimensions such as usability, engagement, or satisfaction [13], while underestimating the interdependencies among pedagogical, technological, and ethical factors [14,15,16]. In addition, the absence of standardized, empirically grounded indicator systems limits comparability across studies, reduces transparency, and weakens evidence-based decision-making. As AI capabilities diversify, robust multidimensional and methodologically rigorous evaluation tools become essential for responsible integration and for realizing the potential of AI-assisted learning.
To address this gap, the present study develops (i) a comprehensive indicator framework and (ii) a hybrid multi-criteria model combining the Decision-Making Trial and Evaluation Laboratory (DEMATEL) [17] and the Analytical Network Process (ANP) [18] for evaluating AI-assisted learning. We integrate evidence from the literature with expert consensus to define measurable, non-redundant indicator system. DEMATEL is then used to model causal interdependencies among indicators, and ANP is applied to derive weights and aggregate performance by indicators into interpretable score. The result is a systematic and transparent tool for assessing AI-enhanced courses. This contribution aligns with recent calls for standardized quality and transparency in AI-driven education (e.g., initiatives such as “ELEVATE-AI LLMs”) [19], while operationalizing an evaluation approach tailored to higher-education learning contexts.
The aim of this study is to develop a comprehensive indicator framework and a hybrid DEMATEL–ANP (DANP) evaluation model for assessing the effectiveness of AI-assisted learning in a holistic, transparent, and empirically grounded manner. Unlike statistical causal models, which require large datasets and assume stable relationships, the proposed DANP framework is well suited for early-stage, rapidly evolving AI-assisted learning contexts where expert judgment and structural reasoning are critical.
The hybrid DANP approach is selected for weighting indicators because it explicitly models interdependencies among criteria. DEMATEL is first used to identify and quantify cause–effect relationships between indicators, distinguishing driving factors from outcome-oriented effects. This influence structure then informs the ANP network, which derives global weights while accounting for interrelations among criteria, rather than assuming independence. As a result, DANP produces weights that reflect both perceived importance and each criterion’s systemic influence within the AI-assisted learning ecosystem, supporting more realistic and interpretable evaluation outcomes.
The evaluation of AI-assisted learning constitutes an inherently multi-criteria decision problem. It involves simultaneously considering pedagogical effectiveness, learner engagement, personalization and adaptivity, assessment and feedback quality, ethical and governance requirements (including fairness, transparency, and data privacy), as well as organizational and technical constraints. These criteria are heterogeneous in nature, partly qualitative, potentially conflicting, and often characterized by limited or evolving empirical evidence, particularly in the context of rapidly developing generative AI technologies. Under such conditions, traditional single-criterion or purely statistical evaluation approaches are insufficient to capture the complexity of AI-assisted learning environments. A multi-criteria decision-making (MCDM) approach therefore provides an appropriate and systematic framework for integrating expert judgments, combining qualitative and quantitative indicators, and making transparent trade-offs among competing evaluation dimensions when assessing the effectiveness of AI-assisted learning in higher education. In the proposed framework, MCDM serves as the overarching methodological foundation for modeling causal relationships among indicators and aggregating them into composite effectiveness scores through the hybrid DEMATEL–ANP approach.
This study contributes to the emerging field of AI-assisted learning evaluation in several ways. First, it proposes an evidence-based indicator framework derived from a systematic review of current scholarly literature, ensuring alignment with contemporary research and pedagogical challenges. Second, the framework is refined through a Delphi process to ensure practical relevance, measurability, and non-redundancy. Third, the methodological rigor is enhanced by integrating DEMATEL and ANP into a hybrid model that captures both causal structure and relative importance – an approach rarely applied in AI-mediated education. Finally, empirical validation involving academic staff provides further support for the framework’s clarity, relevance, and practical applicability. Collectively, these contributions offer a robust, multidimensional tool to support evidence-based instructional design and quality assurance in AI-assisted learning environments.
The remainder of this article is structured as follows. Section 2 reviews existing evaluation approaches in AI-assisted learning and highlights methodological gaps. Section 3 outlines the research design and methodological procedures. Section 4 presents the proposed indicator system for evaluating AI-based learning, detailing the structure of dimensions and indicators and their conceptual grounding. Section 5 illustrates the practical implementation of the proposed indicator system, including the Delphi refinement of indicators, DE-MATEL modeling of causal relationships, ANP derivation of indicator weights, and the construction of hybrid DANP weights. Section 6 reports the empirical validation based on data collected from academic staff and discusses the findings, implications, and limitations of the study. Finally, the last section concludes and offers directions for future research.
2. Classical and Contemporary Evaluation Models in the Context of AI-Based Learning
Research on program evaluation in higher education and e-learning provides a mature foundation of frameworks and metrics for assessing learning quality and impact. Classic outcome-oriented models, most notably Kirkpatrick’s four-level model [20], assess effectiveness across sequential stages, ranging from learners’ reactions and immediate learning outcomes to behavioral change and organizational results. In technology-mediated instruction, quality is often examined using multidimensional e-learning quality frameworks (e.g., the e-quality framework), which address content and material quality, instructional design, learner support, and technical or usability performance [21]. Additional approaches emphasize design determinants of online course quality, such as structure, presentation, interactivity, and support services [22], as well as curriculum alignment strategies like Backward Design [23,24] and assessment models focusing on academic integrity, feedback quality, and equity [25]. Systems-oriented and operational metrics (such as adoption rates, usage intensity, and course completion) are also widely used to monitor digital learning performance [26]. Collectively, these models define the conventional evaluation landscape for higher education and e-learning.
While these models remain relevant, generative AI (GAI) and other AI-enabled technologies expose structural limitations when classical frameworks are applied to effectiveness evaluation. Many existing approaches assume stable instructional conditions, predefined learning tasks, and transparent pedagogical processes. In contrast, GAI-enabled learning environments are dynamic (frequent tool updates, evolving functionalities) and often opaque (limited insight into algorithmic behavior and decision logic). This creates challenges in evaluating AI-specific dimensions such as fairness, privacy, transparency, and responsible governance, alongside pedagogical impacts of AI-mediated support and automation [1,27]. In practice, common evaluation models often emphasize short-term or easily measurable outcomes (e.g., learner satisfaction), while offering limited support for tracing sustained skill development, behavioral change, or long-term academic impact.
Several well-established models illustrate these challenges. Outcome-driven frameworks such as the Tyler model [28] rely on linear logic and stable objectives – assumptions difficult to maintain amid rapidly evolving AI capabilities and shifting educational competencies [23]. Instructional design models such as ADDIE [29] remain valuable for structured course development but may clash with the iterative, real-time adjustments required by AI-enhanced learning tools. Business-focused models like the Phillips ROI framework [30] promote financial accountability but often overlook core academic goals (e.g., critical thinking, disciplinary mastery) and ethical obligations related to AI use. Technology integration models such as SAMR [31] help categorize digital adoption but lack constructs for evaluating AI-specific risks, governance, or the interplay of pedagogy, adaptivity, and feedback. Competency-oriented frameworks such as Intelligent-TPACK [32,33] focus on educators’ knowledge and readiness but do not offer comprehensive models for assessing student outcomes or institutional oversight.
Across the AI-in-education literature, systematic reviews document a growing body of research on adaptive tutoring systems, personalized learning, intelligent assessment, learning analytics, and administrative automation [34]. In LMS contexts, studies highlight benefits such as automated learner support, content recommendation, instructor dashboards, and conversational agents. However, the evidence base remains fragmented. Many evaluations focus on feasibility, engagement, or perceived utility, and findings are often context-dependent, limiting comparability across institutions, disciplines, and AI implementations [34]. These limitations hinder efforts to identify which AI functionalities reliably improve learning outcomes, particularly when ethical and organizational considerations are involved [1,9].
More targeted evaluations of AI-enhanced learning tend to focus on isolated elements. For example, recent studies propose Delphi- or AHP-based indices for assessing the quality of AI-generated content, emphasizing accuracy and relevance [35]. Other research describes AI-enabled quality assurance systems that automate course review through machine learning or natural language processing [36]. While these approaches illustrate the feasibility of structured, multi-criteria evaluation, they remain limited in scope, addressing either content quality or general quality assurance (QA) processes, without offering an integrated framework for evaluating effectiveness across the full spectrum of AI-assisted learning dimensions (e.g., pedagogy, engagement, assessment, adaptivity, and ethics).
Table 1 synthesizes key classical and contemporary evaluation models, comparing their applicability to higher education and highlighting structural deficiencies in GAI-enabled learning environments. The analysis shows that although existing frameworks offer valuable conceptual tools, they often fall short in addressing the unique demands of AI-assisted learning. Traditional models tend to prioritize immediate perceptions and short-term gains, while overlooking complex, longitudinal outcomes like skill transfer or academic integrity. Curriculum- and process-based models support structured planning but rely on linear assumptions incompatible with evolving AI ecosystems. Business and return on investment (ROI)-oriented models focus on efficiency but fail to address educational ethics and systemic interdependencies. Even comprehensive e-learning quality frameworks frequently treat AI-related factors as peripheral rather than integrated components.
Given these shortcomings, recent scholarship and institutional guidance increasingly call for ethics-aware, system-level evaluation models capable of supporting continuous quality assurance in AI-assisted learning. For instance, Logan-Fleming et al. [37] emphasize that traditional QA cycles cannot keep pace with AI innovation and advocate for curriculum-embedded assurance models incorporating AI literacy and inclusive design. Others have proposed expanding evaluation rubrics to integrate ethical dimensions such as transparency and bias mitigation alongside traditional learning constructs, while practitioner guidance highlights transparency, security, and iterative refinement in LMS-based AI applications [9,27].
Collectively, the literature reveals a persistent gap: higher education lacks a holistic, empirically grounded indicator system that can support comparative assessment of AI-assisted courses and capture the interdependencies among pedagogical, technological, and ethical factors. This gap motivates the current study’s approach – developing a multidimensional, operational indicator framework aligned with the core requirements of AI-assisted learning, combined with a weighting and aggregation model that explicitly captures causal and network-like relationships among evaluation criteria.
3. Research Methodology
This section outlines the research methodology used to develop and validate the proposed evaluation framework for AI-assisted learning in higher education. The study follows a sequential, mixed-methods design that integrates evidence-based indicator construction, expert consensus validation, and network-based multi-criteria decision modeling. Specifically, the methodology combines thematic synthesis of recent literature with a Delphi refinement process and applies a hybrid DEMATEL–ANP (DANP) approach to capture causal interdependencies among indicators and derive robust global weights for course evaluation and benchmarking.
3.1. Research Design Overview
The study employs a multi-stage, expert-based MCDM framework to construct and validate the evaluation model. The unit of analysis is an AI-enabled course or module delivered via a university LMS. The study aims to produce (i) a parsimonious indicator framework and (ii) a set of global indicator weights derived through a hybrid DANP procedure, enabling weighted scoring and comparative assessment of AI-assisted courses.
The methodology unfolds in five sequential phases: (1) evidence-based indicator extraction, (2) construction of new evaluation system, (3) validation of the proposed system, (4) DANP modeling (DEMATEL → ANP), and (5) validation of the proposed framework. The overall process is illustrated in Figure 1, summarizing the key phases, data inputs, intermediate outputs, and final deliverables.
The next subsection details the process of identifying candidate indicators from the literature, structuring them into six evaluation dimensions, and refining them into a set of 18 measurable criteria suitable for expert elicitation and DANP modeling.
3.2. Identifying Evaluation Dimensions and Their Indicators
Indicator identification followed an evidence-driven approach. A structured literature search targeted peer-reviewed publications from 2020 to 2025 on topics including AI in education, AI-enabled LMS, generative AI-supported learning, adaptive learning, learning analytics, AI-driven assessment and feedback, and ethical and responsible AI. Searches were conducted across major academic databases (Scopus, Web of Science, ERIC, IEEE Xplore, ACM Digital Library), using keyword combinations such as generative AI, large language models, adaptive learning, transparency, and fairness.
Studies were included if they: (i) addressed AI-enabled learning processes or tools in higher education or related contexts, (ii) reported evaluative constructs, risks, or outcomes relevant to assessment, and (iii) offered conceptual or empirical grounding for measurable indicators. Exclusions removed purely technical papers, opinion pieces, and studies lacking transferable evaluation criteria.
Candidate indicators were extracted through structured coding of eligible studies, emphasizing recurring evaluative themes and operational constructs. Redundant items were merged to ensure indicators were (a) clearly defined, (b) observable by experts, and (c) non-overlapping across dimensions. The resulting indicators were organized into six dimensions: Pedagogical Design and Content Quality (PD), Learner Engagement and Analytics (LE), Adaptivity and Personalization (AP), Assessment and Feedback (AF), Ethics, Privacy, and Governance (EG), and Technological Infrastructure and Usability (TI).
The initial indicator set comprised 18 indicators (three per dimension): PD1 – Content Quality, PD2 – Instructional Design, PD3 – Alignment with Learning Objectives; LE1 – Interactivity, LE2 – Motivation and Emotional Engagement, LE3 – Collaboration and Social Learning; AP1 – Content Adaptivity, AP2 – Learning Path Personalization, AP3 – Difficulty Adjustment; AF1 – Feedback Quality, AF2 – Assessment Diversity, AF3 – Feedback Timeliness; EG1 – Data Privacy and Security, EG2 – Fairness and Inclusivity, EG3 – Transparency and Accountability; and TI1 – Accessibility and User Experience, TI2 – System Responsiveness and Latency, TI3 – LMS Integration and Interoperability. This preliminary indicator set served as the input for the Delphi-based refinement process described in Section 3.3, where the final indicator system was established.
3.3. Expert Panel and Delphi Refinement
Indicators were retained when they consistently met the predefined consensus criteria, such as high median relevance scores combined with acceptable dispersion. Indicators were revised or removed when they repeatedly failed to achieve agreement or exhibited substantial conceptual overlap with other indicators.
A purposively selected expert panel was assembled to validate the indicator system. Inclusion criteria required demonstrated expertise in at least one relevant domain: higher education pedagogy, educational technology, AI in education (including GAI), learning analytics, assessment design, or AI ethics and governance. All panelists met minimum professional experience requirements and were familiar with course-level evaluation practices.
A multi-round Delphi procedure was implemented to confirm indicator relevance and distinctiveness. In Round 1, experts rated each indicator for clarity, relevance, and conceptual uniqueness, and were invited to suggest revisions or eliminations. In Round 2, they reviewed a revised indicator set with aggregated statistics and anonymized feedback from Round 1. Additional rounds were used only if convergence was not achieved.
Consensus was assessed using standard Delphi metrics, including median scores, interquartile ranges (IQR), percentage agreement above a relevance threshold, and Kendall’s for inter-rater concordance.
Indicators were retained if they consistently met consensus thresholds (e.g., high median ratings with low dispersion). Items with recurring disagreement or conceptual overlap were revised or excluded.
During the Delphi process, particular attention was paid to the conceptual distinctiveness and practical separability of the initially defined dimensions. Expert feedback indicated that indicators within the Technological Infrastructure and Usability dimension exhibited substantial overlap with other dimensions, especially Learner Engagement and Analytics and Ethics, Privacy and Governance, when considered at the course evaluation level. Some of the panelists noted that infrastructure-related aspects, such as system responsiveness, accessibility, and LMS integration, are largely institution-dependent prerequisites rather than course-level design or pedagogical features. As a result, these indicators were judged to have limited discriminative power for evaluating the effectiveness of AI-assisted learning at the course or module level, where instructional design and AI-mediated learning processes are the primary focus.
Based on this feedback and the predefined consensus criteria, the Technological Infrastructure and Usability dimension was removed from the final framework, and its most salient concerns were treated as contextual or boundary conditions rather than core evaluation indicators. This refinement resulted in a more parsimonious and analytically focused framework better aligned with expert judgement and the intended decision-support purpose of the evaluation system.
The final indicator system included 15 indicators across five validated dimensions (PD, LE, AP, AF, EG), each clearly defined for weighting and empirical application.
3.4. DANP Weighting Procedure
To operationalize the indicator framework and derive weights, we apply a hybrid DANP model. DANP is particularly suitable for this context as it captures both (i) causal relationships among indicators and (ii) their relative importance within an interdependent network structure. This section presents the key concepts, modelling logic, and main computational steps of the DANP procedure as implemented in the study, while a detailed, step-by-step description of the methodology, including matrix construction and normalization procedures, is provided in Appendix A.1.
Stage 1: DEMATEL – Causal Influence Modelling
DEMATEL models the direct and indirect influence of each indicator on others based on expert input. Experts rated the influence of indicator on using a 0–4 scale (0 = no influence, 4 = very high influence). Individual direct-relation matrices were aggregated (e.g., arithmetic mean) into a group matrix , which was normalized to form :
; .
The total relation matrix was calculated as:
,
where is the identity matrix.
For each indicator , influence () and dependence () were computed:
; .
Prominence and net causality informed the INRM, forming the input structure for ANP.
Stage 2: ANP – Network-Based Global Weightings
The DEMATEL-derived influence structure defines the ANP network. Unlike hierarchical models, ANP allows feedback and cross-cluster dependence. The unweighted supermatrix is constructed using normalized influence values. If required, cluster weights are applied to create the weighted supermatrix . The limit supermatrix is obtained by powering to convergence:
The stabilized column values of yield the global DANP weights for each indicator , where . These weights reflect both perceived importance and systemic influence.
The DANP model supports informed decision-making by:
- Capturing causal and systemic interdependencies among evaluation criteria;
- Allowing expert judgment to compensate for limited empirical data;
- Producing weights that are realistic, justifiable, and aligned with the complexity of AI-assisted learning ecosystems.
The complete computational procedure and pseudocode are provided in Appendix A.
3.5. Empirical Validation and Decision Usefulness
Validation was conducted through an illustrative application in which experts evaluated multiple AI-supported courses using the finalized indicators and their corresponding DANP-derived weights . Decision usefulness was examined by eliciting expert judgments on whether (i) overall course rankings, (ii) indicator-level contributions, and (iii) dimension-level profiles were plausible, interpretable, and actionable for academic decision-making.
Feedback was collected using structured instruments (e.g., alternatives assessment via real scores in the interval [1,5]) and open-ended comments. The evaluation focused on three criteria:
- Actionability: ability to identify areas for course improvement;
- Interpretability: clarity of indicator contributions and dimension profiles;
- Face validity: alignment between evaluation outcomes and expert judgement regarding course design and AI integration.
Courses were scored using real-valued ratings in the interval [1,5] assigned by experts for each indicator. For each course and indicator , ratings were aggregated to obtain . The overall score for course was computed as a weighted sum of indicator scores:
Dimension-level scores were calculated by summing the weighted scores of the three indicators within each dimension, enabling diagnostic insights alongside the global evaluation. When cross-course or cross-study comparability is required, overall and dimension-level scores can be normalized to the [0, 1] interval using the scale maximum.
Overall, the empirical validation indicates that the proposed framework is not only methodologically coherent but also practically useful for instructional design, quality assurance, and evidence-informed decision-making in AI-assisted higher education.
4. Proposed Indicator System for Evaluation of AI-Based Learning
The proposed framework is a multidimensional system developed to overcome the limitations of traditional instructional assessment models when applied to AI-supported learning. Recent AI-in-education literature highlights quality risks in AI-generated resources, the need for robust personalization and feedback mechanisms, and the centrality of ethical, privacy, and governance safeguards in AI-mediated learning environments. Accordingly, the indicator system, grounded in prior empirical evidence and established evaluation frameworks [35,38,39,40,41,42,43,44,45,46,47,48,49,50] and refined through expert consensus using a Delphi procedure, is organized into five dimensions – Pedagogical Design (PD), Learner Engagement and Analytics (LE), Adaptivity and Personalization (AP), Assessment and Feedback (AF), and Ethics, Privacy and Governance (EG). Each dimension is operationalized through three indicators, resulting in a total of 15 indicators.
4.1. Pedagogical Design and Content Quality (PD)
This dimension assesses whether AI-enabled learning is instructionally sound and aligned with course goals, while accounting for AI-specific failure modes such as hallucinations, inaccuracy, and content drift [35,38,39,41,42,43].
- PD3 – Alignment with Learning Objectives: Extent to which AI-generated content, activities, and resources are mapped to intended learning outcomes/competencies; checks whether AI use remains goal-directed and avoids tangential or mis-leveled outputs [41].
4.2. Learner Engagement and Analytics (LE)
This dimension captures how AI affects learners’ participation and persistence, and whether engagement is supported through meaningful interaction rather than passive reliance on AI [38,39,41,44,45,46,47,48].
4.3. Adaptivity and Personalization (AP)
This dimension evaluates the extent to which AI enables real-time tailoring of learning to individual needs, including what learners study, in what sequence, and at what level of challenge, based on learner data and interaction evidence [38,41,45,46,49,50].
4.4. Assessment and Feedback (AF)
This dimension captures how AI supports the learning loop: measuring learning and providing feedback that enables improvement. It emphasizes quality, diversity, and timeliness of AI-enabled assessment and feedback, while acknowledging risks of inaccurate feedback and integrity issues [39,41,45,46,47,48,49,50].
4.5. Ethics, Privacy, and Governance (EG)
This dimension evaluates whether AI is deployed responsibly and in ways that sustain trust, equity, compliance, and institutional accountability – issues repeatedly emphasized as intrinsic to educational quality in GenAI contexts [38,40,41].
4.6. Comparison to Traditional Evaluation Frameworks
Compared with conventional course evaluation and e-learning quality assurance models, the proposed approach is broader in scope and more explicitly tailored to AI-enabled learning mechanisms. Traditional evaluation systems typically emphasize pedagogical design, general engagement, learner satisfaction, and outcome indicators, often operationalized through surveys, grades, or completion metrics. Personalization is rarely treated as a core quality requirement, while privacy, fairness, and transparency are commonly assumed to be addressed externally through institutional policies rather than evaluated at the level of individual courses or AI-enabled tools. In contrast, the proposed framework makes these previously “background” conditions explicit evaluation criteria, reflecting the fact that AI systems can directly influence learners through data processing, automated decision-making, and opaque content generation processes.
The framework further operationalizes opportunities specific to generative AI as measurable evaluation standards. For example, AI technologies enable near-immediate, individualized feedback and the scalable generation of diverse assessment prompts. Accordingly, the proposed indicator set assesses not only the presence of feedback, but also its timeliness, accuracy, and instructional usefulness (AF1–AF3), as well as the diversity of assessment formats (AF2). Similarly, adaptivity is treated as a first-class requirement (AP1–AP3), allowing evaluators to distinguish between systems that genuinely personalize learning and those that merely automate content delivery.
At the same time, the proposed measurement system entails several practical considerations. First, certain indicators (such as fairness assessment, transparency verification, and adaptivity inspection) may require greater analytical effort than conventional survey-based evaluations. Second, the evaluation dimensions are interdependent in practice – for example, stronger adaptivity often enhances engagement, while weak content quality may undermine motivation and raise ethical concerns. Although the framework separates dimensions for analytical clarity, interpretation should consider cross-dimensional interactions. Moreover, the framework is primarily designed to assess instructional design and process quality and is therefore best applied alongside outcome-based measures (e.g., learning achievement, retention, or skill transfer) to support triangulation and strengthen validation.
The indicator framework is deliberately limited to five dimensions and fifteen indicators to balance parsimony, coverage, and methodological feasibility. Conceptually, these five dimensions span the core stages of the AI-assisted learning cycle: Pedagogical Design (PD), Learner Engagement and Analytics (LE), Adaptivity and Personalization (AP), Assessment and Feedback (AF), and Ethics, Privacy and Governance (EG). Operationally, the fifteen-indicator structure results from an evidence-driven reduction process that eliminates redundancy and avoids indicator proliferation, thereby improving interpretability and reducing respondent burden.
From a methodological perspective, compactness is essential for DEMATEL–ANP-based weighting and interdependency modelling. Large criterion sets substantially increase pairwise judgment demands, expert fatigue, and inconsistency risks. The adopted 5×3 structure preserves multidimensional coverage while maintaining the stability, tractability, and reliability of expert elicitation and subsequent causal and weight estimation.
5. Practical Example of Implementing the Proposed Indicator System
The objective of this practical example is to compute (i) the cluster-level influence weights and (ii) the global (indicator-level) weights that account for interdependencies among criteria. The DANP procedure is performed in two stages. First, DEMATEL is applied to the aggregated expert direct-influence judgments (0–4 scale) to obtain the normalized direct-relation matrix, the total-relation matrix, and the prominence and causal degree measures, which support interpretation of the cause–effect structure among indicators. Second, the ANP stage transforms the DEMATEL-derived interdependencies into a supermatrix model; the unweighted supermatrix is constructed by block-wise column normalization, then weighted using cluster-level influence coefficients to obtain the weighted supermatrix, which is iterated to convergence to yield the limit supermatrix and the final DANP global weights.
5.1. DEMATEL Analysis
Three domain experts evaluated the direct influence of each indicator on every other using a five-point scale. Their individual matrices were aggregated using the arithmetic mean to form the group direct-influence matrix (Table 2). Diagonal elements were set to zero by definition.
The normalized direct-relation matrix was derived, followed by the total-relation matrix , which captures both direct and indirect influences (Table 3).
From this, we calculated the influence degree (), dependence degree (), prominence , and causal degree , presented in Table 4. The resulting cause–effect map (Figure 2) identifies Content Quality and Difficulty Adjustment as the most influential indicators, followed by Interactivity and Feedback Quality. These core drivers exert upstream control over more dependent criteria such as Content Adaptivity, Data Privacy, and Assessment Diversity.
Indicators with high prominence but negative causal degree, such as Learning Path and Instructional Alignment, appear central but function primarily as outcomes of upstream mechanisms. The causal structure suggests strategic interventions should focus on highly prominent causal indicators.
In Table 4 and Figure 2, the DEMATEL results reveal a clear cause–effect structure among the 15 indicators. Indicators with positive causal degree () form the driving set, led by Content Quality (PD1; = 1.403) and Difficulty Adjustment (AP3; 1.269), followed by Interactivity (LE1; 0.869) and Feedback Quality (AF1; 0.744). This pattern inricates that system effectiveness is primarily pushed by the quality of instructional content and by adaptive, interactive, feedback-intensive learning processes, which then propagate improvements through the broader network. A second tier of drivers – Fairness (EG2; 0.219), Motivation (LE2; 0.153) and Collaboration (LE3; 0.113) – suggests that engagement and governance-related factors contribute as supportive causes, but with weaker net influence. In contrast, indicators with negative causal degree are positioned as dependent outcomes, most notably Content Adaptivity (AP1; −1.345), Data Privacy (EG1; −0.819), and Assessment Diversity (AF2; −0.750), implying that these elements are shaped by upstream design and interaction mechanisms rather than driving the system directly.
Prominence () further highlights centrality: Motivation (LE2; = 5.117) is the most connected indicator, while (AP3; 4.666), (PD1; 4.570), (AP2; 4.485) and (AF1; 4.431) also show high system embeddedness, reinforcing their diagnostic value. Overall, the joint reading of causal degree and prominence suggests that the most effective intervention points are those that combine high connectivity with net causality (particularly PD1 and AP3) whereas highly prominent but net-effect criteria (e.g., AP2 and PD3) function more as performance outcomes that improve indirectly when upstream drivers are strengthened.
5.2. DANP Weight Derivation
Before deriving the global ANP priorities, we first estimated the relative importance of the main clusters (PD, LE, AP, AF, and EG). The matrix was then column-normalized to produce the cluster weight matrix. These cluster weights capture the comparative role of each cluster within the interdependent system and were subsequently used to weight the corresponding blocks of the ANP supermatrix. The final cluster weight matrix is presented in Table 5.
The normalized coefficients quantify how the total influence originating from a source cluster (column) is distributed across target clusters (rows). Several dependency patterns emerge.
- Pedagogical Design (PD) primarily feeds Learner Engagement (LE): PD→LE is the largest entry in the PD column ( = 0.229), indicating that instructional structure and content decisions propagate most strongly into interactivity and motivation. PD’s remaining influence is distributed across AP ( = 0.213, PD itself ( = 0.208), AF ( = 0.174), and EG ( = 0.175), suggesting PD acts as a broad upstream contributor rather than a single-direction lever.
- Learner Engagement (LE) most strongly supports Pedagogical Design (PD): LE→PD is the dominant linkage from LE ( = 0.231), followed closely by LE→LE ( = 0.221) and LE→AP ( = 0.193). This pattern is consistent with engagement traces (interaction intensity, persistence) informing instructional adjustments and refinements more directly than they drive assessment routines (LE→AF is the weakest, = 0.159.
- Adaptivity and Personalisation (AP) most strongly drives Learner Engagement (LE): AP→LE is the largest entry in the AP column ( = 0.237), with additional spillovers toward PD ( = 0.217) and AF ( = 0.196). This aligns with the role of adaptive sequencing and difficulty control in sustaining participation and shaping subsequent learning activities.
- Assessment and Feedback (AF) channels its largest share toward Pedagogical Design (PD): AF→PD is the strongest outgoing flow from AF ( = 0.225), followed by AF→LE ( = 0.209) and AF→AP ( = 0.205). This suggests that assessment evidence and feedback loops mainly feed back into pedagogical redesign and interaction patterns, rather than remaining confined within the AF cluster: AF→AF ( = 0.173).
- Ethics and Governance (EG) primarily conditions PD and LE: EG→PD and EG→LE are tied as the two largest entries in the EG column ( = 0.221; = 0.221), followed by EG→AF ( = 0.184). This indicates that privacy, fairness, and transparency considerations act chiefly through course structuring and learners’ willingness to participate, while EG’s direct influence on adaptivity is comparatively smaller: EG→AP ( = 0.193).
- Diagonal values are not dominant (≈ 0.173 – 0.221): within-cluster self-reinforcement is comparable to, and often weaker than, several cross-cluster flows. This confirms that the evaluation system is governed primarily by cross-dimensional interactions, supporting the use of a network-based weighting approach (DANP) rather than independence-assuming weighting.
In sum, the matrix highlights strong couplings along the pathways PD → LE, AP → LE, and AF → PD, with EG exerting its main influence through PD and LE. This structure is consistent with AI-assisted learning settings in which instructional design shapes engagement, adaptivity sustains participation, assessment evidence feeds back into redesign, and governance conditions both participation and course organization.
The DEMATEL-derived reachability matrix was used to define the network structure of the ANP model. Links were established between indicators based on their reachability, and the total-relation matrix was normalized by columns to create the unweighted supermatrix. Cluster-level influence weights were then elicited from experts and used to weight the supermatrix blocks, producing the weighted supermatrix (Table 6).
The weighted supermatrix was powered to convergence, producing the limit supermatrix (Table 7). Global DANP weights were extracted from this limit matrix (Table 8).
According to the obtained DANP weights (Table 8), the highest global priorities are concentrated in Pedagogical Design, Adaptivity and Personalization, and Learner Engagement, with Assessment and Feedback also prominent. The top-weighted indicators are Content Quality (PD1, = 0.095) and Difficulty Adjustment (AP3, = 0.092), followed by Motivation (LE2, = 0.082), Feedback Quality (AF1, = 0.081), and Interactivity (LE1, = 0.077). Overall, the pattern indicates that, within the interdependent DANP structure, perceived effectiveness is driven primarily by the quality of instructional content and the system’s capacity to adapt task demands and sustain active engagement, while other features play more supporting roles.
- Content Quality (PD1, = 0.095) ranks first, implying that the overall perceived strength of AI-assisted learning depends most on the accuracy, clarity, relevance, and completeness of instructional content. Even when engagement and adaptivity mechanisms are strong, weak or unreliable content constrains learning value, explaining PD1’s dominant position.
- Difficulty Adjustment (AP3, = 0.092) and Learning Path Personalization (AP2, = 0.064) receive comparatively high weights, highlighting adaptive control of challenge level and sequencing as key leverage points. Practically, this emphasizes the importance of matching task complexity to learner ability and guiding progression coherently through the curriculum.
- In Assessment & Feedback, Feedback Quality (AF1, = 0.081) is weighted more strongly than Feedback Timeliness (AF3, = 0.059) and Assessment Diversity (AF2, = 0.037). This suggests that, in the network, what feedback communicates (accuracy, specificity, actionability) contributes more to perceived impact than speed or variety alone.
- In Learner Engagement, Motivation (LE2, = 0.082) and Interactivity (LE1, = 0.077) are both highly ranked, indicating that engagement is driven mainly by active learner–system exchange and motivational support. Collaboration (LE3, = 0.065) remains meaningful but appears secondary to these more direct engagement mechanisms.
- The lowest weights are assigned to Assessment Diversity (AF2, = 0.037) and Content Adaptivity (AP1, = 0.042), with Data Privacy (EG1, = 0.051) also in the lower range. This does not imply these aspects are negligible; rather, within the estimated interdependency structure they act more as enablers or constraints and/or their influence is partly mediated through higher-priority drivers such as content quality, adaptive difficulty control, and feedback quality.
The DANP results imply that improvement efforts should primarily target high-quality content, adaptive difficulty and sequencing, actionable feedback, and motivating interactive learning experiences, while ethics and governance and broader assessment features function mainly as essential supporting conditions in the current network.
Additional computational details for this practical example are reported in Appendix A.
These hybrid DANP-derived weights are practically plausible for AI-based learning contexts because they prioritize factors that most directly determine whether AI support translates into substantive learning gains, rather than merely increased “AI activity.” In contrast, lower weights are assigned to criteria that primarily function as baseline requirements or enabling conditions, whose effects on learning outcomes are typically indirect and mediated through stronger upstream drivers.
Highest weights (core drivers of learning value)
Content Quality (PD1, = 0.095) is the top weight, which is consistent with practice: if AI-generated/explained content is unclear, inaccurate, or misaligned, it undermines everything else – engagement, feedback, and adaptivity become irrelevant or even harmful (e.g., “confidently wrong” explanations). In AI-based courses, content quality is also directly tied to hallucination control, prompt/scaffold quality, and instructor curation.
Difficulty Adjustment (AP3, = 0.092) being nearly as high is also expected: one of AI’s distinctive advantages is maintaining an appropriate challenge level in real time (hints, scaffolding, step decomposition, stretching advanced learners). This is a high-leverage mechanism for both learning efficiency and motivation.
Motivation (LE2, = 0.082) and Interactivity (LE1, = 0.077) being high reflects a common reality: AI tools deliver value when students actively engage (question–answer loops, iterative refinement, practice with feedback). Motivation is especially central because AI can either support persistence (micro-successes, personalized pacing) or cause disengagement (over-reliance, passive copying).
Feedback Quality (AF1, = 0.081) is correctly prioritized: in AI-supported learning, the usefulness and correctness of feedback typically matters more than speed. Poor feedback scales harm fast; high-quality feedback scales benefit fast.
Middle weights (important, but usually mediated)
Collaboration (LE3, = 0.065) is meaningful but slightly lower than interactivity/motivation – often because collaboration depends on course orchestration and assessment design, not only on the AI tool itself.
Learning Path (AP2, = 0.064) aligns with many university contexts: macro-level sequencing is valuable, but many courses still constrain path flexibility (syllabus structure), so its incremental effect can be smaller than real-time difficulty control.
Instructional Design (PD2, = 0.062) and Alignment with learning objectives (PD3, = 0.062) are mid-range, which is plausible when experts view them as embedded through PD1 and through the course design itself. In other words, if content is high-quality and the course is competently designed, marginal differences in “alignment” may not dominate the network.
Lower weights (often “must-have” constraints or downstream effects)
Fairness (EG2, = 0.072) is relatively high within ethics, which makes sense: bias and unequal performance across groups directly damages legitimacy and learning outcomes, and it can also reduce engagement and trust.
Transparency (EG3, = 0.058) and Privacy (EG1, = 0.051) being lower does not mean they are unimportant; it often means they behave like threshold criteria in higher education: institutions expect a minimum compliance baseline (policies, consent, GDPR practices). Once that baseline is met, differences may be perceived as less performance-driving than content, adaptivity, engagement, and feedback.
Feedback timeliness (AF3, = 0.059) being below AF1 matches practice: “instant but wrong/vague” is worse than “slightly slower but precise and actionable”.
Content adaptivity (AP1, = 0.042) and Assessment diversity (AF2, = 0.037) being lowest is plausible for two reasons: (i) they are harder to implement robustly (true content adaptation and varied authentic assessment), and (ii) their effects are frequently indirect, working through difficulty adjustment, feedback quality, and engagement – so the network weighting can push their global contribution downward.
As a practical profile for AI-based learning, this weighting pattern is coherent: it emphasizes (1) trustworthy instructional content, (2) adaptive challenge control, (3) sustained interactive engagement, and (4) high-quality feedback, while treating ethics and governance as essential enablers and giving less relative priority to features whose benefits are more context-dependent (assessment diversity, fine-grained content adaptivity).
Overall, the obtained DANP weights indicate that perceived effectiveness of AI-based learning is driven primarily by content quality (PD1), adaptive difficulty regulation (AP3), and actionable feedback and engagement mechanisms (AF1, LE2, LE1), whereas the remaining indicators play comparatively more supportive/enabling roles within the interdependent evaluation network.
6. Empirical Application
To validate the practical applicability of the proposed evaluation framework, three experts assessed four GAI-based courses using the final indicator system and the derived DANP weights. The evaluated courses were: Electronic Government, Digital Marketing, Management Information Systems (MIS), and Internet Technologies in Tourism.
6.1. Aggregation of Expert Evaluations
The experts evaluated each course using 15 indicators, assigning real-valued scores on a scale from 1 to 5. Table 9 presents the average rating for each indicator and course.
The results exhibit a clear pattern across the four courses:
E-Government excels in Pedagogical Design (PD1–PD3) and Ethics & Governance (EG1–EG3) but is weaker in Adaptivity & Personalization (AP1–AP3).
Digital Marketing scores highest in Engagement & Learning Analytics (LE1–LE3) and Adaptivity & Personalization.
MIS shows moderate, balanced performance across all dimensions.
Internet Technologies in Tourism scores highly in Engagement & Learning Analytics and Assessment & Feedback, with solid results in Pedagogical Design.
6.2. Weighted Contributions and Total Course Scores
Each indicator score was multiplied by its DANP weight to compute weighted contributions and overall course scores (Table 10).
The obtained overall course ranking is:
- 1)
- Digital Marketing – 4.185;
- 2)
- Internet Technologies in Tourism – 3.955;
- 3)
- E-Government – 3.807;
- 4)
- MIS – 3.765.
In this ranking, E-Government and MIS remain very close; Tourism sits clearly between Digital Marketing and the other two.
6.3. Dimension-Level View
Indicators were grouped by their framework dimensions, and weighted contributions were summed per dimension (Table 11):
Digital Marketing records the strongest results in Engagement & Learning Analytics (LE = 1.032) and Adaptivity & Personalization (AP = 0.888), while also maintaining solid performance in Pedagogical Design (PD = 0.884) and Assessment & Feedback (AF = 0.764). Its weakest dimension is Ethics & Governance (EG = 0.617).
E-Government demonstrates its main advantage in Pedagogical Design (PD = 0.995) and performs well in Ethics & Governance (EG = 0.816). However, it is comparatively weaker in Adaptivity & Personalization (AP = 0.553) and Assessment & Feedback (AF = 0.658), which reduces its overall standing relative to the highest-performing course.
MIS shows a relatively even profile across dimensions, particularly LE (0.820), AP (0.717), and EG (0.688), but does not reach the top score in any single dimension, indicating consistent but not dominant performance within the proposed evaluation framework.
6.4. Discussion
The weighted course results yield a clear and interpretable ranking of the four AI-based courses. Digital Marketing achieves the highest total score (4.185), followed by Internet Technologies in Tourism (3.955), E-Government (3.807), and MIS (3.765) (Table 10). While the gap between E-Government and MIS is marginal, the dimension-level decomposition (Table 11) reveals meaningfully different performance profiles that align with the courses’ stated design emphases and delivery formats (e.g., lecture/seminar balance and overall contact hours).
E-Government (Total = 3.807) performs strongest in Pedagogical Design (PD = 0.995) and Ethics & Governance (EG = 0.816) (Table 11). At the indicator level, this is reflected in high weighted contributions for PD1 (0.439) and EG2 (0.333), alongside consistently strong PD2–PD3 and EG1–EG3 terms (Table 10). In contrast, Adaptivity & Personalization is its weakest dimension (AP = 0.553), with comparatively low contributions across AP1–AP3 (notably AP1 = 0.125) (Table 10). Overall, the course appears methodologically robust and governance-oriented, while offering relatively limited AI-enabled individualized support.
Digital Marketing (Total = 4.185) leads primarily due to its top scores in Engagement & Learning Analytics (LE = 1.032) and Adaptivity & Personalization (AP = 0.888), supported by solid Assessment & Feedback (AF = 0.764) and strong Pedagogical Design (PD = 0.884) (Table 11). This pattern is also visible at the indicator level, with large contributions for LE2 (0.386), LE1 (0.355), and AP3 (0.425) (Table 10). The main relative limitation is Ethics & Governance (EG = 0.617), the lowest EG score among the four courses, suggesting that governance-related elements are present but less emphasized than in E-Government (Table 11).
MIS (Total ≈ 3.765) shows a comparatively even profile across dimensions: PD = 0.917, LE = 0.820, AP = 0.717, AF = 0.624, EG = 0.688, without a single dominant peak (Table 11). Table 10 similarly shows mid-range contributions across most indicators (e.g., PD1 = 0.411, LE2 = 0.295, AP3 = 0.333, EG2 = 0.275), indicating consistent performance but limited specialization. In other words, MIS is “good overall”, yet its AI-related strengths are not as sharply differentiated as those of Digital Marketing (LE/AP) or E-Government (PD/EG).
Internet Technologies in Tourism (Total = 3.955) ranks second overall and is characterized by strong Engagement & Learning Analytics (LE = 0.958) and solid Pedagogical Design (PD = 0.907), together with comparatively strong Assessment & Feedback (AF = 0.705) (Table 11). This is supported by high indicator contributions such as LE2 = 0.353, LE1 = 0.340, and AF1 = 0.323 (Table 10). Its AP (0.717) and EG (0.670) scores are moderate rather than leading, suggesting clear opportunities to further strengthen adaptive support and to embed governance and privacy considerations more systematically within the course context (Table 11).
Taken together, Table 10 and Table 11 show that combining expert ratings with DANP weights produces a coherent and diagnostically useful narrative: Digital Marketing excels in engagement, analytics and personalization; E-Government leads in pedagogy and governance; Internet Technologies in Tourism is particularly strong in engagement and feedback; and MIS remains broadly consistent but less distinctive in any single framework dimension.
7. Conclusions
This study developed and validated a comprehensive evaluation framework for assessing the effectiveness of AI-assisted learning in higher education. The framework conceptualizes effectiveness across five dimensions: Pedagogical Design and Content Quality (PD), Learner Engagement and Analytics (LE), Assessment and Feedback (AF), Adaptivity and Personalization (AP), and Ethics, Privacy, and Governance (EG). These dimensions are operationalized through 15 indicators, whose relative importance was determined using a hybrid DANP approach that accounts for causal relationships and interdependencies among criteria. The framework was empirically tested through expert-based evaluation of four GAI-supported university courses: Electronic Government, Digital Marketing, Management Information Systems (MIS), and Internet Technologies in Tourism.
The evaluation framework demonstrated its ability to capture key effectiveness factors emphasized in both research and policy discourses. The DEMATEL analysis revealed interpretable causal structures, distinguishing systemic drivers (e.g., pedagogical design, engagement, adaptivity) from more outcome-oriented indicators (e.g., feedback quality, perceived transparency). These insights informed the construction of global DANP weights, which were then applied to expert ratings to produce a consistent course ranking, Digital Marketing Internet Technologies in Tourism E-Government MIS, and diagnostic profiles reflecting each course’s strengths and limitations.
The inclusion of the Internet Technologies in Tourism course, delivered as a compact 15-hour Master’s module, provided an important validation test. It demonstrated the framework’s capacity to differentiate performance across both disciplinary boundaries and instructional formats. Notably, this course scored highly in engagement and feedback despite its brevity, suggesting that short, intensive courses can achieve high effectiveness when AI tools are tightly integrated into active learning and formative assessment processes. At the same time, its moderate performance in personalization and governance dimensions highlighted actionable opportunities, especially in managing ethical risks related to data use and recommender systems in tourism education.
Theoretically, the study contributes in three key ways. First, it advances a multidimensional evaluation model that incorporates AI-specific features such as advanced analytics, adaptivity, and governance considerations – areas often underrepresented in traditional e-learning frameworks. Second, it extends the application of the DANP method to the domain of higher education, showing how expert knowledge and systemic interdependencies can be formalized in a transparent weighting model. Third, it reframes AI-based course evaluation as a socio-technical system problem, moving beyond checklist-based models toward a nuanced analysis that recognizes how pedagogical, technical, and ethical components interact.
Practically, the framework offers concrete benefits for multiple stakeholders:
- For instructors and instructional designers, it provides a structured lens for reviewing and refining course design. For example, while the E-Government course was strong in pedagogy and ethics, it underutilized AI for personalization. Digital Marketing, conversely, leveraged AI for engagement and adaptivity but showed gaps in ethical scaffolding. The Tourism course balanced engagement and feedback well but would benefit from greater emphasis on transparency and privacy.
- For programme coordinators and academic leaders, the indicator-weighting combination enables comparative assessment across courses and supports prioritization of course improvements, staff development, or investment in learning technologies.
- For IT units and technology vendors, the framework clarifies which AI features contribute not just to functionality, but to pedagogical quality and ethical acceptability, guiding procurement, customization, and governance.
- For policy makers and quality assurance bodies, the framework offers a transparent and multidimensional reference for articulating expectations about responsible and effective AI integration in higher education.
Based on the findings, several stakeholder-oriented recommendations can be made:
- Instructors and designers can use the framework for self-assessment and as a design checklist when integrating AI. Compact modules should emphasize high-leverage features such as AI-driven feedback and concise ethics components tied to applied cases.
- Programme coordinators can apply the framework in program-level reviews to ensure systematic AI integration and use DANP weights to identify the most impactful intervention points.
- Teaching and learning centers can embed the indicators into peer-review tools and provide targeted training for weaker dimensions such as feedback, adaptivity, and governance.
- Institutional leaders can incorporate the framework into broader AI governance policies to align educational and ethical criteria with decision-making around AI use.
Nonetheless, several limitations should be acknowledged. The indicator weights and validation were based on a small expert sample and applied to four courses within specific disciplinary and institutional contexts, limiting generalizability. The expert ratings are subjective, and while the DANP procedure structures these inputs, it cannot eliminate interpretive variation. The study focused primarily on methodological development and illustrative validation; broader psychometric validation and large-scale deployment were beyond scope.
These limitations suggest several directions for future research. First, the framework should be tested across diverse disciplines, institutions, and national contexts to assess the robustness of the indicator set and the stability of the DANP weights. Second, survey instruments based on the indicators could enable large-scale quantitative studies linking framework scores to learning outcomes and engagement metrics. Third, additional dimensions, such as organizational readiness or infrastructure, could be integrated, and student-designed indicators may improve relevance. Fourth, comparative studies using other weighting techniques (e.g., Best–Worst Method, fuzzy MCDM) could refine the methodological toolkit. Finally, the framework could be embedded into digital dashboards or decision support tools that visualize trade-offs and track progress over time.
In conclusion, the proposed multidimensional framework and DANP-based weighting model provide a theoretically grounded, methodologically rigorous, and practically usable approach for evaluating AI-assisted learning. By explicitly modeling causal and interdependent relationships, the framework supports informed decision-making that is pedagogically meaningful, ethically robust, and contextually adaptable across a range of disciplines, delivery formats, and institutional settings.
Supplementary Materials
No supplementary materials are available for this article.
Author Contributions
Framework, G.I., T.Y, M.R. and S.K.-B.; validation, T.Y.; formal analysis, G.I., T.Y., M.R. and S.K.-B.; resources, G.I. and T.Y.; writing—original draft preparation, G.I., T.Y.; writing—review and editing, G.I., T.Y., M.R. and S.K.-B.; visualization, T.Y.; supervision, G.I.; project administration, T.Y.; funding acquisition, G.I., T.Y., M.R. and S.K.-B. All authors have read and agreed to the published version of the manuscript.
Funding
This research was partially supported by Project BG16RFPR002-1.014-0013-C01, “Digitization of the Economy in a Big Data Environment”, under the “Research, Innovation and Digitalization for Smart Transformation” Program 2021–2027, and co-financed by Project FP25-FISN-012, “StuEDU: An integrated approach and intelligent system for assessing key skills and student profile”, funded by the Research Fund of Plovdiv University “Paisii Hilendarski”.
Data Availability Statement
The data supporting the findings of this study are contained within the article and no additional datasets were generated or analyzed.
Acknowledgments
The authors thank the academic editor and anonymous reviewers for their insightful comments and suggestions.
Conflicts of Interest
The authors declare no conflict of interest. The funders had no role in the design of the study; in the collection, analyses, or interpretation of data; in the writing of the manuscript; or in the decision to publish the results.
Appendix A.
Hybrid DANP Procedure for Criteria Weighting
The task is to prioritize the evaluation criteria and obtain data-driven weights for subsequent alternative scoring. We first specify the evaluation structure by defining the indicator groups (clusters) and the complete set of indicators , where is the number of groups and is the total number of indicators. Next, we establish the expert panel of size , where experts are indexed by .
This appendix describes the hybrid DEMATEL–ANP (DANP) procedure used to (i) model interdependencies among criteria and (ii) derive global priority weights for the subsequent evaluation and ranking of alternatives. DEMATEL is used to obtain the total-relation matrix and the cause–effect structure, while ANP converts the DEMATEL dependency structure into a supermatrix to compute global weights under interdependence and feedback.
Appendix A.1
DEMATEL Technique
DEMATEL method [17] models and visualizes cause–effect interdependencies in complex systems. Based on experts’ pairwise judgements of direct influences, DEMATEL produces a total-relation matrix that separates criteria into driving (cause) and dependent (effect) groups and quantifies each criterion’s overall prominence. DEMATEL is well suited for structured causal mapping; however, its application becomes more demanding as the number of criteria increases because the elicitation and processing of pairwise influence assessments scales quickly with problem size.
The method consists of the following steps:
Step 1. Elicit individual direct-influence matrices
Each expert fills in the values of the alternative-criteria direct-influence matrix where expresses the perceived influence of criterion on criterion (typically using a bounded scale, e.g., 0–4), and .
Step 2. Aggregate expert judgements
The group direct-influence matrix , is obtained by averaging
Step 3. Normalize the direct-influence martix
Define the normalization constant s:
Then the normalized direct-influence matrix is:
Step 4. Compute the total relation matrix
The total-relation matrix is defined by the convergent series:
When the series converges, it has the closed form:
where and I is the identity matrix.
Convergence note: The series in (4) converges and is invertible when , where denotes the spectral radius. In DEMATEL, the scaling in (2)–(3) ensures that the maximum row and column sums of are ≤1, which implies . To guarantee strict convergence in applications, it is sufficient that is strictly sub-stochastic in at least one row or column (i.e., at least one row/column sum is strictly less than 1) and the influence network is not degenerate; in practice, if needed, a small can be used by scaling with to ensure . Under , and (5) is well-defined.
Step 5. Compute prominence and relation vectors
Let:
and
where is the dispatching (row-sum) vector and is the receiving (column-sum) vector. Then for each criterion :
Prominence: (overall involvement or importance of criterion in the system;
Relation: (net causal role). If , criterion is in the cause group; if , it is in the effect group. Plotting the points with coordinates forms a cause-effect diagram that facilitates interpretation.
Step 6. Cause–effect diagram
Plot the points to obtain the DEMATEL cause–effect diagram, supporting interpretation of driving versus dependent criteria.
Appendix A.2
ANP Technique
After that, ANP [18], a network generalization of Analytical Hierarchy Process (AHP) is utilized for deriving global priorities when mutual dependencies and feedback exist among criteria and clusters.
To complement the causal mapping obtained from DEMATEL, we apply ANP, which converts the interdependencies into a network-based weighting scheme and yields global priorities under feedback and mutual influence among criteria and clusters. The ANP stage uses the DEMATEL total relation matrix for the criteria set . Optionally, criteria are grouped into clusters .
Step 7. Construct the unweighted supermatrix (column-stochastic).
First, compute the column-normalized influence coefficients:
Reorder rows and columns according to the cluster structure to obtain the block-form unweighted supermatrix:
where block contains the column-normalized influences from cluster (source) to (target).
Step 8. Compute the cluster influence matrix and its normalized form (if clusters are used).
Aggregate to the cluster level to obtain :
Column normalize to obtain distributions from each source cluster :
Step 9. Construct the weighted supermatrix Weight each block in by the corresponding cluster-level coefficient (source cluster → target cluster ):
With block-column-stochastic and column-stochastic, the resulting is column-stochastic.
Step 10. Find limit supermatrix and global priorities
Raise to sufficiently high powers until convergence:
All columns of coincide and give the global priority vector of the criteria:
Under regularity (e.g., primitivity), all columns of become identical. The global priority vector of criteria is obtained from any column:
Step 11. Prioritize alternatives (optional)
If alternatives are included in the ANP network, their local priority vectors (with respect to each criterion) are appended as additional blocks in the supermatrix and Steps 8–10 are repeated; the corresponding entries in then yield the global alternative priorities. Alternatively (and commonly in DANP applications), the DANP-derived criterion weights are used in a separate ranking method (e.g., TOPSIS) for alternative evaluation.
Step 12. Results diagnostics and notes
Before column-normalizing , ensure that no column sum is zero. After constructing and , verify that column sums are (numerically) equal to 1. If convergence is slow or reducibility is suspected, a damping/teleportation variant may be applied, e.g.
where is the all-ones vector.
Sensitivity can be examined by perturbing (e.g., ±5%) and observing changes in .
In summary, DEMATEL provides the dependency structure (via ), while ANP operationalizes these dependencies through the supermatrix and extracts stable global weights via the limit supermatrix. The pseudocode of the implemented DANP procedure is provided in the next section.
Appendix A.3
Pseudocode of the Hybrid DANP Algorithm for Criteria Weighting
In this section, we present pseudocode for program implementation of DANP.
Algorithm А1. DANP pseudocode
Input:
Criteria C[1..N]
Experts k = 1..K
Clusters G[1..p] (each G[a] is a set of criterion indices)
Output:
DANP global weights wDANP[1..N]
------------------------------------------------------------
DEMATEL part
------------------------------------------------------------
Step 1: Problem setup
Define criteria C[1..N] // N criteria (indicators)
Define number of experts K // K experts
Step 2: Collect experts’ direct-influence matrices D(k)
for k in {1..K}
for i in {1..N}
for j in {1..N}
if i == j then
D(k)[i,j] ← 0 // no self-influence
else
D(k)[i,j] ← ExpertScore(k, C[i] → C[j]) // e.g., 0..4: 0=no influence, 4=very high influence of i on j
endif
endfor
endfor
endfor
Step 3: Aggregation of expert judgements to group direct influence matrix D
for i in {1..N}
for j in {1..N}
sum ← 0
for k in {1..K}
sum ← sum + D(k)[i,j]
endfor
D[i,j] ← sum / K // D = (1/K) * Σk D(k) Eq. (1)
endfor
endfor
Step 4: Normalization of D P (normalized direct-influence matrix)
// sNorm = max{ max row sum of D , max column sum of D }
maxRowSum ← 0
for i in {1..N}
rowSum ← 0
for j in {1..N}
rowSum ← rowSum + D[i,j]
endfor
if rowSum > maxRowSum then maxRowSum ← rowSum endif
endfor
maxColSum ← 0
for j in {1..N}
colSum ← 0
for i in {1..N}
colSum ← colSum + D[i,j]
endfor
if colSum > maxColSum then maxColSum ← colSum endif
endfor
sNorm ← max(maxRowSum, maxColSum) // Eq. (2)
for i in {1..N}
for j in {1..N}
P[i,j] ← D[i,j] / sNorm // Eq. (3)
endfor
endfor
Step 5: Computation of total-relation matrix T
// T = P * (I − P)(-1)
I ← IdentityMatrix(N)
A ← I − P
Ainv ← Inverse(A)
T ← Multiply(P, Ainv) // Eq. (5)
Step 6: Computation of row/column sums of T and prominence/relation
r ← ZeroVector(N) // r[i] = Σj T[i,j]
sVec ← ZeroVector(N) // sVec[j] = Σi T[i,j]
// row sums
for i in {1..N}
sumRow ← 0
for j in {1..N}
sumRow ← sumRow + T[i,j]
endfor
r[i] ← sumRow // Eq. (6)
endfor
// column sums
for j in {1..N}
sumCol ← 0
for i in {1..N}
sumCol ← sumCol + T[i,j]
endfor
sVec[j] ← sumCol // Eq. (7)
endfor
prominence ← ZeroVector(N)
relation ← ZeroVector(N)
for i in {1..N}
prominence[i] ← r[i] + sVec[i] // overall involvement
relation[i] ← r[i] − sVec[i] // >0 cause, <0 effect
endfor
// ANP part of DANP
//ANP pseudocode is based on DEMATEL total-relation matrix T
// Map criteria to clusters
for a in {1..P}
for each i in G[a]
clusterOf[i] ← a
endfor
endfor
Step 7: Construct the unweighted supermatrix Wu from T (cluster/block normalization)
Wu ← ZeroMatrix(N,N)
for b in {1..p} // source cluster
for each j in G[b] // source criterion j
for a in {1..p} // target cluster
denom ← 0
for each i in G[a]
denom ← denom + T[i,j]
endfor
if denom > 0 then
for each i in G[a]
Wu[i,j] ← T[i,j] / denom // Eq. (9)
endfor
else
for each i in G[a]
Wu[i,j] ← 0
endfor
endif
endfor
endfor
endfor
// Note: Wu is block-column-normalized (each block column sums to 1 when denom>0),
// not necessarily globally column-stochastic.
Step 8: Compute cluster influence matrix Q and its column-normalized form Qhat
Q ← ZeroMatrix(p,p)
for a in {1..p} // target cluster
for b in {1..p} // source cluster
sumAB ← 0
for each i in G[a]
for each j in G[b]
sumAB ← sumAB + T[i,j]
endfor
endfor
Q[a,b] ← sumAB // Eq. (10)
endfor
endfor
Qhat ← ZeroMatrix(P,P)
for b in {1..P}
colSum ← Σa Q[a,b]
if colSum > 0 then
for a in {1..P}
Qhat[a,b] ← Q[a,b] / colSum // Eq. (11)
endfor
else
for a in {1..P}
Qhat[a,b] ← 0
endfor
endif
endfor
Step 9: Construct weighted supermatrix W
W ← ZeroMatrix(N,N)
for b in {1..P} // source cluster
for each j in G[b]
for a in {1..P} // target cluster
for each i in G[a]
W[i,j] ← Qhat[a,b] * Wu[i,j] // Eq. (12)
endfor
endfor
endfor
endfor
// Under typical DEMATEL conditions (T positive/connected), W becomes column-stochastic.
// If some denom=0 occurs in practice, consider damping or renormalization.
Step 10: Limit supermatrix and global priorities
Input: maxIter, eps
Wk ← W
for iter in {1..maxIter}
Wnext ← Multiply(Wk, W) // standard power iteration: W^(K+1) – Eq. (13)
if MaxAbs(Wnext − Wk) < eps then break endif
Wk ← Wnext
endfor
Winfty ← Wk
wDANP ← Column(Winfty, 1) // under primitivity/regularity – Eq. (14)
wDANP ← wDANP / Sum(wDANP)
Notes: If clusters are not used (), then the cluster matrix reduces to , and Step 10 yields . The block-wise normalization in Step 8, together with the column-stochastic cluster weights from Step 9, ensures that the resulting weighted supermatrix W in Step 10 is column-stochastic, as required in ANP.
(Reason: for any column and so ).
Appendix A.4
Practical Example in Step-by-Step Mode
In this section, we present the step-by-step DANP computation for determining the importance of the proposed indicator system, using expert evaluation matrices (with compared criterion pairs) and the cluster matrix , derived from the total relation matrix .
Decision making problem formulation
Given the following:
- Criteria (N = 15), where PD1 is Content Quality, PD2 – Instructional Design, PD3 – Alignment with Learning Objectives, LE1 – Interactivity, LE2 – Motivation, LE3 – Collaboration, AP1 – Content Adaptivity, AP2 – Learning Path, AP3 – Difficulty Adjustment, AF1 – Feedback Quality, AF2 – Assessment Diversity, AF3 – Feedback Timeliness, EG1 – Data Privacy, EG2 – Fairness, and EG3 – Transparency.
- Clusters (P = 5):
- Pedagogical Design PD = {PD1, PD2, PD3}
- Learner Engagement LE = {LE1, LE2, LE3}
- Adaptivity and Personalization AP = {AP1, AP2, AP3}
- Assessment and Feedback AF = {AF1, AF2, AF3}
- Ethics and Governance EG = {EG1, EG2, EG3}
- Three experts (K = 3) with expertise in AI-based learning
To find: the relative importance of each criteria using DANP method.
Step 1. Input data
Each expert completes the criterion–criterion direct-influence matrix
.
Step 2. Compute the group direct-influence matrix The individual assessment matrices are averaged by arithmetic mean to obtain the group direct-influence matrix using Eq. (1) (Table 2).
Step 3. Normalize to obtain the direct-relation matrix Compute DEMATEL normalization constant as the maximum of (1) the largest row sum and (ii) the largest column sum of using Eq. (3) (Table 3).
In our case:
maximum row sum = 39.010 (row AP3)
maximum column sum = 38.000 (column AP1), thus s = 39.010.
Then, using Eq. (2), . For example, , as reported in Table 3.
Step 4. Compute the total relation matrix Using the standard DEMATEL closed-form solution in Eq. (5), the total-relation matrix is obtained (Table A1).

Table A1.
Total relation matrix .
| PD1 | PD2 | PD3 | LE1 | LE2 | LE3 | AP1 | AP2 | AP3 | AF1 | AF2 | AF3 | EG1 | EG2 | EG3 | |
|---|---|---|---|---|---|---|---|---|---|---|---|---|---|---|---|
| PD1 | 0.099 | 0.244 | 0.200 | 0.195 | 0.256 | 0.147 | 0.237 | 0.210 | 0.152 | 0.215 | 0.217 | 0.190 | 0.258 | 0.156 | 0.211 |
| PD2 | 0.099 | 0.099 | 0.184 | 0.073 | 0.187 | 0.119 | 0.209 | 0.163 | 0.069 | 0.079 | 0.147 | 0.135 | 0.145 | 0.163 | 0.160 |
| PD3 | 0.122 | 0.166 | 0.105 | 0.074 | 0.159 | 0.175 | 0.171 | 0.205 | 0.074 | 0.113 | 0.164 | 0.085 | 0.166 | 0.103 | 0.116 |
| LE1 | 0.093 | 0.151 | 0.234 | 0.090 | 0.197 | 0.172 | 0.213 | 0.208 | 0.193 | 0.158 | 0.113 | 0.198 | 0.157 | 0.192 | 0.134 |
| LE2 | 0.123 | 0.210 | 0.231 | 0.122 | 0.142 | 0.176 | 0.187 | 0.169 | 0.177 | 0.177 | 0.116 | 0.217 | 0.223 | 0.150 | 0.215 |
| LE3 | 0.106 | 0.106 | 0.196 | 0.149 | 0.186 | 0.090 | 0.117 | 0.192 | 0.173 | 0.086 | 0.089 | 0.098 | 0.112 | 0.147 | 0.152 |
| AP1 | 0.093 | 0.062 | 0.117 | 0.090 | 0.072 | 0.121 | 0.078 | 0.116 | 0.074 | 0.054 | 0.123 | 0.058 | 0.146 | 0.063 | 0.064 |
| AP2 | 0.162 | 0.149 | 0.176 | 0.116 | 0.163 | 0.085 | 0.162 | 0.111 | 0.109 | 0.086 | 0.188 | 0.114 | 0.173 | 0.084 | 0.120 |
| AP3 | 0.124 | 0.217 | 0.249 | 0.153 | 0.163 | 0.192 | 0.267 | 0.246 | 0.107 | 0.201 | 0.176 | 0.227 | 0.233 | 0.225 | 0.187 |
| AF1 | 0.146 | 0.204 | 0.164 | 0.112 | 0.214 | 0.106 | 0.241 | 0.211 | 0.171 | 0.103 | 0.190 | 0.189 | 0.194 | 0.131 | 0.211 |
| AF2 | 0.049 | 0.063 | 0.064 | 0.044 | 0.112 | 0.052 | 0.149 | 0.160 | 0.045 | 0.093 | 0.059 | 0.058 | 0.169 | 0.048 | 0.111 |
| AF3 | 0.082 | 0.168 | 0.160 | 0.065 | 0.172 | 0.075 | 0.109 | 0.121 | 0.137 | 0.143 | 0.107 | 0.092 | 0.101 | 0.177 | 0.094 |
| EG1 | 0.058 | 0.128 | 0.090 | 0.082 | 0.122 | 0.124 | 0.188 | 0.087 | 0.064 | 0.109 | 0.086 | 0.160 | 0.083 | 0.118 | 0.157 |
| EG2 | 0.129 | 0.155 | 0.122 | 0.174 | 0.197 | 0.123 | 0.177 | 0.119 | 0.091 | 0.157 | 0.133 | 0.203 | 0.165 | 0.104 | 0.188 |
| EG3 | 0.101 | 0.168 | 0.153 | 0.094 | 0.142 | 0.127 | 0.172 | 0.169 | 0.063 | 0.069 | 0.117 | 0.083 | 0.149 | 0.157 | 0.090 |
Step 5. Calculate the dispatching and receiving vectors, and derive prominence and relation
Using Eq. (6) and Eq. (7), compute the row sum vector and the column sum vector from the total relation matrix . The derive, for each criterion , the prominence vector and the relation vectors indicators (Table 4).
Step 6. Analyze key cause–effect patterns from Based on the relation values , criteria are partitioned into net causes () and net effects which are visualized in the cause-effect diagram (Figure 2).
For our data, the strongest net causes (largest ()) are:
- PD1 (+1.403)
- AP3 (+1.269)
- LE1 (+0.869)
- AF1 (+0.744).
The strongest net effects (most negative () include:
- AP1 (−1.345)
- EG1 (−0.819)
- AF2 (−0.750).
Step 7. Build the unweighted supermatrix Because we use clusters, we normalize within each block column (Eq. (8), Table A2).
Because the criteria are grouped into clusters, is normalized within each block column to form the unweighted supermatrix (Eq. (8), Table A2).
Table A2.
Unweighted supermatrix .
| PD1 | PD2 | PD3 | LE1 | LE2 | LE3 | AP1 | AP2 | AP3 | AF1 | AF2 | AF3 | EG1 | EG2 | EG3 | |
|---|---|---|---|---|---|---|---|---|---|---|---|---|---|---|---|
| PD1 | 0.310 | 0.480 | 0.409 | 0.571 | 0.425 | 0.334 | 0.384 | 0.364 | 0.516 | 0.528 | 0.411 | 0.463 | 0.453 | 0.369 | 0.433 |
| PD2 | 0.309 | 0.194 | 0.377 | 0.214 | 0.311 | 0.269 | 0.338 | 0.281 | 0.235 | 0.193 | 0.279 | 0.329 | 0.255 | 0.386 | 0.328 |
| PD3 | 0.381 | 0.326 | 0.214 | 0.216 | 0.264 | 0.396 | 0.278 | 0.355 | 0.250 | 0.278 | 0.311 | 0.208 | 0.292 | 0.244 | 0.238 |
| LE1 | 0.289 | 0.323 | 0.354 | 0.250 | 0.375 | 0.392 | 0.412 | 0.365 | 0.355 | 0.376 | 0.354 | 0.386 | 0.319 | 0.393 | 0.268 |
| LE2 | 0.382 | 0.449 | 0.350 | 0.338 | 0.271 | 0.402 | 0.362 | 0.296 | 0.326 | 0.420 | 0.366 | 0.424 | 0.454 | 0.306 | 0.429 |
| LE3 | 0.329 | 0.227 | 0.296 | 0.412 | 0.354 | 0.206 | 0.226 | 0.338 | 0.319 | 0.204 | 0.280 | 0.190 | 0.227 | 0.301 | 0.303 |
| AP1 | 0.245 | 0.145 | 0.215 | 0.251 | 0.181 | 0.304 | 0.154 | 0.245 | 0.254 | 0.159 | 0.253 | 0.145 | 0.264 | 0.169 | 0.173 |
| AP2 | 0.427 | 0.348 | 0.325 | 0.324 | 0.410 | 0.214 | 0.319 | 0.234 | 0.378 | 0.252 | 0.385 | 0.285 | 0.313 | 0.226 | 0.324 |
| AP3 | 0.328 | 0.506 | 0.460 | 0.425 | 0.409 | 0.482 | 0.527 | 0.521 | 0.368 | 0.589 | 0.362 | 0.570 | 0.423 | 0.606 | 0.503 |
| AF1 | 0.527 | 0.468 | 0.423 | 0.508 | 0.431 | 0.456 | 0.482 | 0.429 | 0.485 | 0.303 | 0.533 | 0.559 | 0.418 | 0.368 | 0.506 |
| AF2 | 0.175 | 0.145 | 0.166 | 0.199 | 0.224 | 0.222 | 0.299 | 0.325 | 0.126 | 0.275 | 0.166 | 0.170 | 0.364 | 0.135 | 0.267 |
| AF3 | 0.298 | 0.387 | 0.412 | 0.293 | 0.345 | 0.323 | 0.219 | 0.246 | 0.388 | 0.421 | 0.301 | 0.271 | 0.218 | 0.497 | 0.227 |
| EG1 | 0.200 | 0.285 | 0.246 | 0.235 | 0.264 | 0.331 | 0.350 | 0.233 | 0.293 | 0.325 | 0.256 | 0.359 | 0.209 | 0.312 | 0.361 |
| EG2 | 0.450 | 0.343 | 0.335 | 0.497 | 0.427 | 0.329 | 0.330 | 0.317 | 0.418 | 0.469 | 0.396 | 0.455 | 0.416 | 0.275 | 0.432 |
| EG3 | 0.350 | 0.372 | 0.419 | 0.268 | 0.308 | 0.340 | 0.320 | 0.451 | 0.288 | 0.207 | 0.348 | 0.185 | 0.375 | 0.413 | 0.206 |
Step 8. Compute the normalized cluster influence matrix (Table 5).
Step 9. Construct the weighted supermatrix Using Eq. (12), the weighted supermatrix was calculated (Table 6).
Step 10. Obtain the limit supermatrix W(∞)and DANP global weights
The weighted supermatrix was iterated to convergence using Eq. (13) (Table 7). Under the regularity condition, the columns of W(∞) converge to the same priority vector . The resulting global DANP weights (descending order) are: PD1 = 0.095, AP3 = 0.092, LE2 = 0.082, AF1 = 0.081, LE1= 0.077, EG2= 0.072, LE3 = 0.065, AP2 = 0.064, PD3 = 0.062, PD2 = 0.062, AF3 = 0.059, EG3 = 0.058, EG1 = 0.051, AP1= 0.042, AF2 = 0.037.
Here are the dimension totals (sum of global DANP indicator weights) for our proposed framework for AI-based learning evaluation:
- Learner Engagement (LE): 0.224
- Pedagogical Design (PD): 0.220
- Adaptivity & Personalization (AP): 0.198
- Ethics & Governance (EG): 0.181
- Assessment & Feedback (AF): 0.1775
In ranking terms: LE > PD > AP > EG > AF, indicating that (in the final interdependent DANP priorities) engagement-related indicators collectively carry the largest share, closely followed by pedagogical design, with assessment & feedback receiving the smallest overall share among the five dimensions.
References
- Alotaibi, N.S. The Impact of AI and LMS Integration on the Future of Higher Education: Opportunities, Challenges, and Strategies for Transformation. Sustainability 2024, 16, 10357. [Google Scholar] [CrossRef]
- Crompton, H.; Burke, D. Artificial Intelligence in Higher Education: The State of the Field. Int. J. Educ. Technol. High. Educ. 2023, 20, 22. [Google Scholar] [CrossRef]
- Batista, J.; Mesquita, A.; Carnaz, G. Generative AI and Higher Education: Trends, Challenges, and Future Directions from a Systematic Literature Review. Information 2024, 15, 676. [Google Scholar] [CrossRef]
- Saifullah, S.; Yawan, H.; Syafitri, N.; Nurhaliza, S. Integrating AI Chatbot into Learning Management System: Enhancing Student Engagement and Learning Outcomes. Dharmas Educ. J. 2024, 5, 1346–1359. [Google Scholar] [CrossRef]
- Jdidou, Y.; Aammou, S. Transforming Education with AI: The Role of Recommendation Systems in Personalized Learning. Proceedings of EDULEARN24: International Conference on Education and New Learning Technologies, Palma de Mallorca, Spain, 1–3 July 2024; pp. 7662–7669. [Google Scholar] [CrossRef]
- Chng, L.K. How AI Makes Its Mark on Instructional Design. Asian J. Distance Educ. 2023, 18, 32–41. Available online: http://asianjde.com/ojs/index.php/AsianJDE/article/view/740 (accessed on 25 December 2025).
- Rodríguez-Ortiz, M.Á.; Santana-Mancilla, P.C.; Anido-Rifón, L.E. Machine Learning and Generative AI in Learning Analytics for Higher Education: A Systematic Review of Models, Trends, and Challenges. Appl. Sci. 2025, 15, 8679. [Google Scholar] [CrossRef]
- Huber, E.; Harris, L.; Wright, S.; White, A.; Raduescu, C.; Zeivots, S.; Brodzeli, A. Towards a Framework for Designing and Evaluating Online Assessments in Business Education. Assess. Eval. High. Educ. 2024, 49, 102–116. [Google Scholar] [CrossRef]
- UNESCO. Guidance for Generative AI in Education and Research. Available online: https://www.unesco.org/en/articles/guidance-generative-ai-education-and-research (accessed on 9 December 2025).
- Li, Y.; Xie, M. Navigating International Challenges of Quality Assurance in Higher Education: A Synergy of Gen-AI and Human-Made Solutions. GBP Proc. Ser. 2025, 3, 186–192. Available online: https://www.gbspress.com/index.php/GBPPS/article/view/177 (accessed on 9 December 2025). [CrossRef]
- Basri, W.S. Effectiveness of AI-Powered Tutoring Systems in Enhancing Learning Outcomes. Eurasian J. Educ. Res. 2024, 110, 33–52. [Google Scholar] [CrossRef]
- Juárez Santiago, B.; Olivares Ramírez, J.M.; Rodríguez-Reséndiz, J.; Dector, A.; García García, R.; González-Durán, J.E.E.; Ferriol Sánchez, F. Learning Management System-Based Evaluation to Determine Academic Efficiency Performance. Sustainability 2020, 12, 4256. [Google Scholar] [CrossRef]
- Almulla, M.A. Investigating Influencing Factors of Learning Satisfaction in AI ChatGPT for Research: University Students Perspective. Heliyon 2024, 10, e32220. [Google Scholar] [CrossRef]
- Kakhkharova, M.; Tuychieva, S. AI-Enhanced Pedagogy in Higher Education: Redefining Teaching-Learning Paradigms. In Proceedings of the 2024 International Conference on Knowledge Engineering and Communication Systems (ICKECS), Chikkaballapur, India, 18–19 April 2024; pp. 1–6. [Google Scholar]
- McGinty, J.; Murray-Johnson, K. Ethical Frameworks of Artificial Intelligence for Faculty: Upholding Academic Integrity and Authenticity. In New Dir. Adult Contin. Educ.; 2025. [Google Scholar] [CrossRef]
- Li, Z.; Dhruv, A.; Jain, V. Ethical Considerations in the Use of AI for Higher Education: A Comprehensive Guide. In Proceedings of the 2024 IEEE 18th International Conference on Semantic Computing (ICSC), Laguna Hills, CA, USA, 5–7 February 2024; pp. 218–223. [Google Scholar]
- Gabus, A.; Fontela, E. World Problems, an Invitation to Further Thought within the Framework of DEMATEL; Battelle Geneva Research Center: Geneva, Switzerland, 1972; pp. 12–14. [Google Scholar]
- Saaty, T.L. Decision Making with Dependence and Feedback: The Analytic Network Process; RWS Publications: Pittsburgh, PA, USA, 1996. [Google Scholar]
- The ELEVATE-AI LLMs Framework: An Evaluation Framework for Use of Large Language Models in HEOR: An ISPOR Working Group Report. Available online: https://warwick.ac.uk/fac/cross_fac/eduport/edufund/projects/yang/projects/the-elevate-ai-llms-framework-an-evaluation-framework-for-use-of-large-language-models-in-a16e6d/ https://arxiv.org/pdf/2501.12394v1 (accessed on 9 December 2025).
- Kirkpatrick, D.L. Evaluating Training Programs: The Four Levels; Berrett-Koehler Publishers: San Francisco, CA, USA, 1994. [Google Scholar]
- Masoumi, D.; Lindström, B. Quality in E-Learning: A Framework for Promoting and Assuring Quality in Virtual Institutions. J. Comput. Assist. Learn. 2012, 28, 27–41. [Google Scholar] [CrossRef]
- Konstantinidou, A.; Zorkadis, V.; Koutsopoulos, K. Assuring the Quality of Online Learning in Higher Education. Australas. J. Educ. Technol. 2022, 38, 68–83. [Google Scholar] [CrossRef]
- Dazeley, R.; Goriss-Hunter, A.; Meredith, G.; Sellings, P.; Firmin, S.; Burke, J.; Panther, B. Agile Backward Design: A Framework for Planning Higher Education Curriculum. Aust. Educ. Res. 2025, 52, 1489–1508. [Google Scholar] [CrossRef]
- Wiggins, G.; McTighe, J. Understanding by Design, Expanded, 2nd ed.; ASCD: Alexandria, VA, USA, 2005. [Google Scholar]
- Ross, J.; Curwood, J.S.; Bell, A. A Multimodal Assessment Framework for Higher Education. e-Learn. Digit. Media 2020, 17, 290–306. [Google Scholar] [CrossRef]
- Graham, C.R.; Woodfield, W.; Harrison, J.B. A Framework for Institutional Adoption and Implementation of Blended Learning in Higher Education. Internet High. Educ. 2013, 18, 4–14. [Google Scholar] [CrossRef]
- Council of Europe. Artificial Intelligence and Education: Regulating the Use of AI Systems in Education. Available online: https://rm.coe.int/prems-019925-gbr-2511-artificial-intelligence-and-education-a4-web-bat/1680b6c970 (accessed on 9 December 2025).
- Tyler, R.W. Basic Principles of Curriculum and Instruction; University of Chicago Press: Chicago, IL, USA, 2013. [Google Scholar] [CrossRef]
- Branson, R.K. The Interservice Procedures for Instructional Systems Development. Educ. Technol. 1978, 18, 11–14. Available online: https://www.jstor.org/stable/44418942 (accessed on 25 December 2025).
- Phillips, J.J. Return on Investment in Training and Performance Improvement Programs; Routledge: New York, NY, USA, 2012. [Google Scholar] [CrossRef]
- Blundell, C.N.; Mukherjee, M.; Nykvist, S. A Scoping Review of the Application of the SAMR Model in Research. Comput. Educ. Open 2022, 3, 100093. [Google Scholar] [CrossRef]
- Çelik, İ. Towards Intelligent-TPACK: An Empirical Study on Teachers’ Professional Knowledge to Ethically Integrate AI-Based Tools into Education. Comput. Hum. Behav. 2023, 138, 107468. [Google Scholar] [CrossRef]
- Al-Abdullatif, A.M. Modeling Teachers’ Acceptance of Generative Artificial Intelligence Use in Higher Education: The Role of AI Literacy, Intelligent TPACK, and Perceived Trust. Educ. Sci. 2024, 14, 1209. [Google Scholar] [CrossRef]
- Wang, S.; Wang, F.; Zhu, Z.; Wang, J.; Tran, T.; Du, Z. Artificial Intelligence in Education: A Systematic Literature Review. Expert Syst. Appl. 2024, 252, 124167. [Google Scholar] [CrossRef]
- Huang, Q.; Lv, C.; Lu, L.; Tu, S. Evaluating the Quality of AI-Generated Digital Educational Resources for University Teaching and Learning. Systems 2025, 13, 174. [Google Scholar] [CrossRef]
- Myrick, J. Integrating AI into Course Quality Assurance Processes. In Proceedings of the 8th International Academic Conference on Education, Teaching and Learning (IACETL), Helsinki, Finland, 10–12 July 2025; Available online: https://www.dpublication.com/wp-content/uploads/2025/06/19-4196.pdf (accessed on 25 December 2025).
- Logan-Fleming, D.; Thakkar, M.; Martinez Pacheco, S.; Jones, H.; Parrish, D. Assurance of Learning in the Age of AI: A Sector Scan and Future-Focused Call to Action. ASCILITE 2025 Conference Proceedings, Adelaide, Australia, 30 November–3 December 2025. [Google Scholar]
- Yu, H.; Guo, Y. Generative Artificial Intelligence Empowers Educational Reform: Current Status, Issues, and Prospects. Front. Educ. 2023, 8, 1183162. [Google Scholar] [CrossRef]
- Kestin, G.; Miller, K.; Klales, A.; Milbourne, T.; Ponti, G. AI Tutoring Outperforms In-Class Active Learning: An RCT Introducing a Novel Research-Based Design in an Authentic Educational Setting. Sci. Rep. 2025, 15, 17458. [Google Scholar] [CrossRef]
- García-López, I.M.; Trujillo-Liñán, L. Generative Artificial Intelligence in Education: Ethical Challenges, Regulatory Frameworks and Educational Quality in a Systematic Review of the Literature. Front. Educ. 2025, 10, 1565938. [Google Scholar] [CrossRef]
- Verhoeven, B.; Hor, T. A Framework for Human-Centric AI-First Teaching. AACSB Insights 2025. Available online: https://www.aacsb.edu/insights/articles/2025/02/a-framework-for-human-centric-ai-first-teaching (accessed on 25 December 2025).
- Chng, L.K. How AI Makes Its Mark on Instructional Design. Asian J. Distance Educ. 2023, 18, 32–41. Available online: https://asianjde.com/ojs/index.php/AsianJDE/article/view/740 (accessed on 25 December 2025).
- Schleiss, J.; Laupichler, M.C.; Raupach, T.; Stober, S. AI Course Design Planning Framework: Developing Domain-Specific AI Education Courses. Educ. Sci. 2023, 13, 954. [Google Scholar] [CrossRef]
- Wang, F.; Cheung, A.C.; Chai, C.S.; Liu, J. Development and Validation of the Perceived Interactivity of Learner–AI Interaction Scale. Educ. Inf. Technol. 2025, 30, 4607–4638. [Google Scholar] [CrossRef]
- Kovari, A. A Systematic Review of AI-Powered Collaborative Learning in Higher Education: Trends and Outcomes from the Last Decade. Soc. Sci. Humanit. Open 2025, 11, 101335. [Google Scholar] [CrossRef]
- Sajja, R.; Sermet, Y.; Cikmaz, M.; Cwiertny, D.; Demir, I. Artificial Intelligence-Enabled Intelligent Assistant for Personalized and Adaptive Learning in Higher Education. Information 2024, 15, 596. [Google Scholar] [CrossRef]
- Zheng, L.; Fan, Y.; Gao, L.; Huang, Z.; Chen, B.; Long, M. Using AI-Empowered Assessments and Personalized Recommendations to Promote Online Collaborative Learning Performance. J. Res. Technol. Educ. 2025, 57, 727–753. [Google Scholar] [CrossRef]
- Zheng, L.; Fan, Y.; Chen, B.; Huang, Z.; LeiGao; Long, M. An AI-Enabled Feedback–Feedforward Approach to Promoting Online Collaborative Learning. Educ. Inf. Technol. 2024, 29, 11385–11406. [Google Scholar] [CrossRef]
- Karoglou, M.; Ghergulescu, I.; Stramarkou, M.; Boukouvalas, C.; Krokida, M. Building an Adaptive AI-Powered Higher Education Class for the Future of Engineering: A Case Study from NTUA. Appl. Sci. 2025, 15, 8524. [Google Scholar] [CrossRef]
- Naseer, F.; Khan, M.N.; Tahir, M.; Addas, A.; Aejaz, S.M.H. Integrating Deep Learning Techniques for Personalized Learning Pathways in Higher Education. Heliyon 2024, 10, e32628. [Google Scholar] [CrossRef] [PubMed]
Figure 1.
Figure 1. Methodological workflow of the proposed evaluation framework for AI-based learning. Note: INRM denotes the Influential Network Relation Map.
Figure 1.
Figure 1. Methodological workflow of the proposed evaluation framework for AI-based learning. Note: INRM denotes the Influential Network Relation Map.
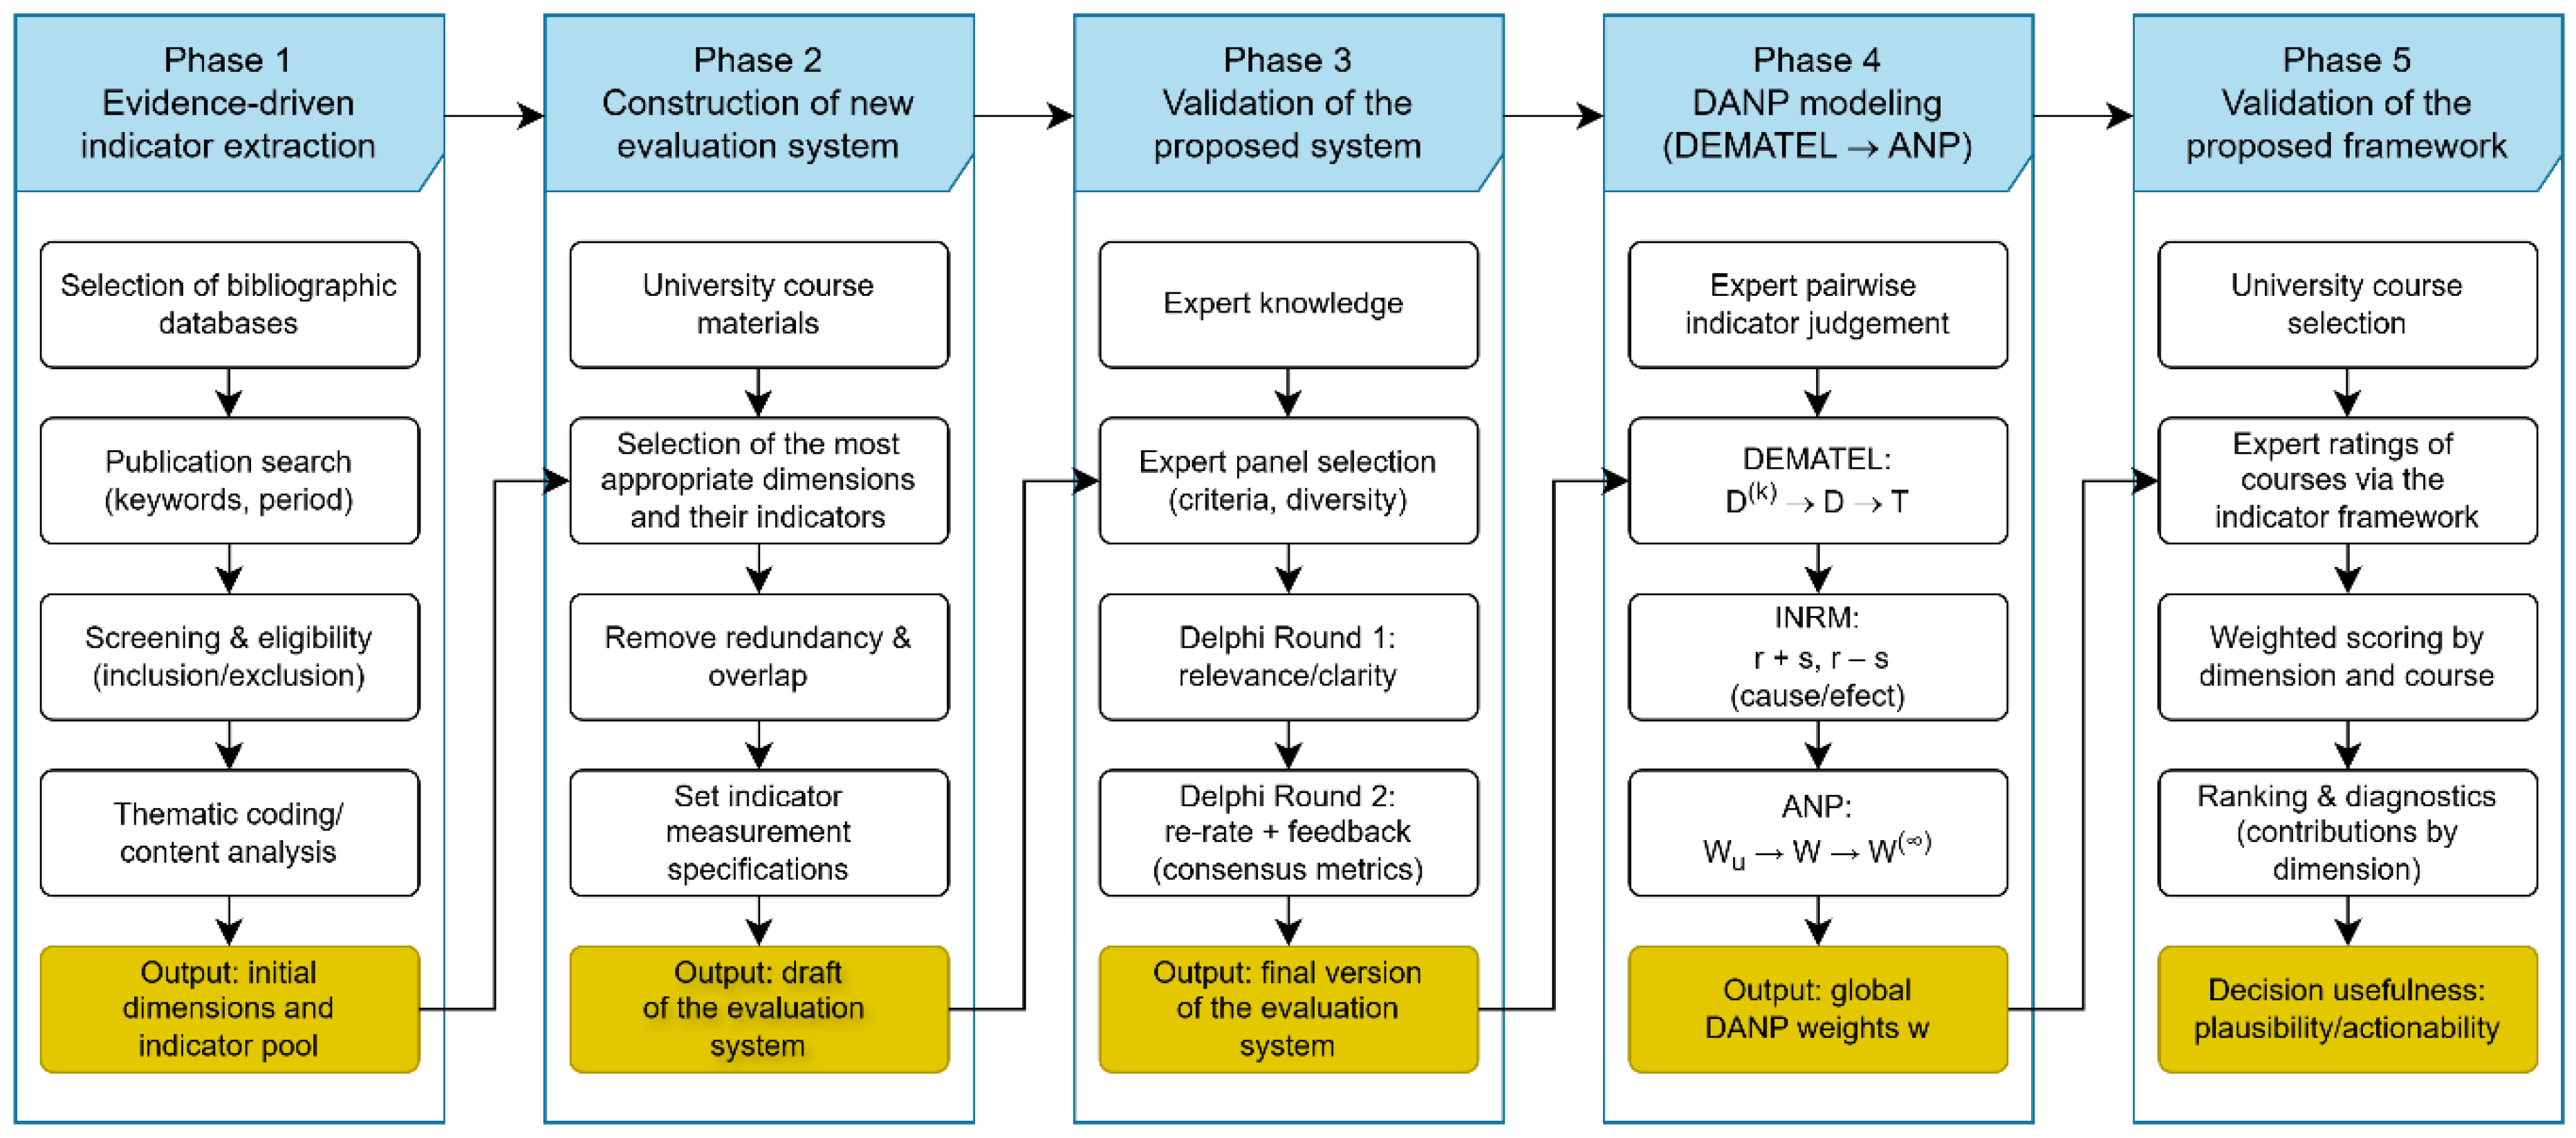
Figure 2.
Cause–effect mapping of indicators, based on prominence () and relation (), plotted on the x and y axes, respectively.
Figure 2.
Cause–effect mapping of indicators, based on prominence () and relation (), plotted on the x and y axes, respectively.
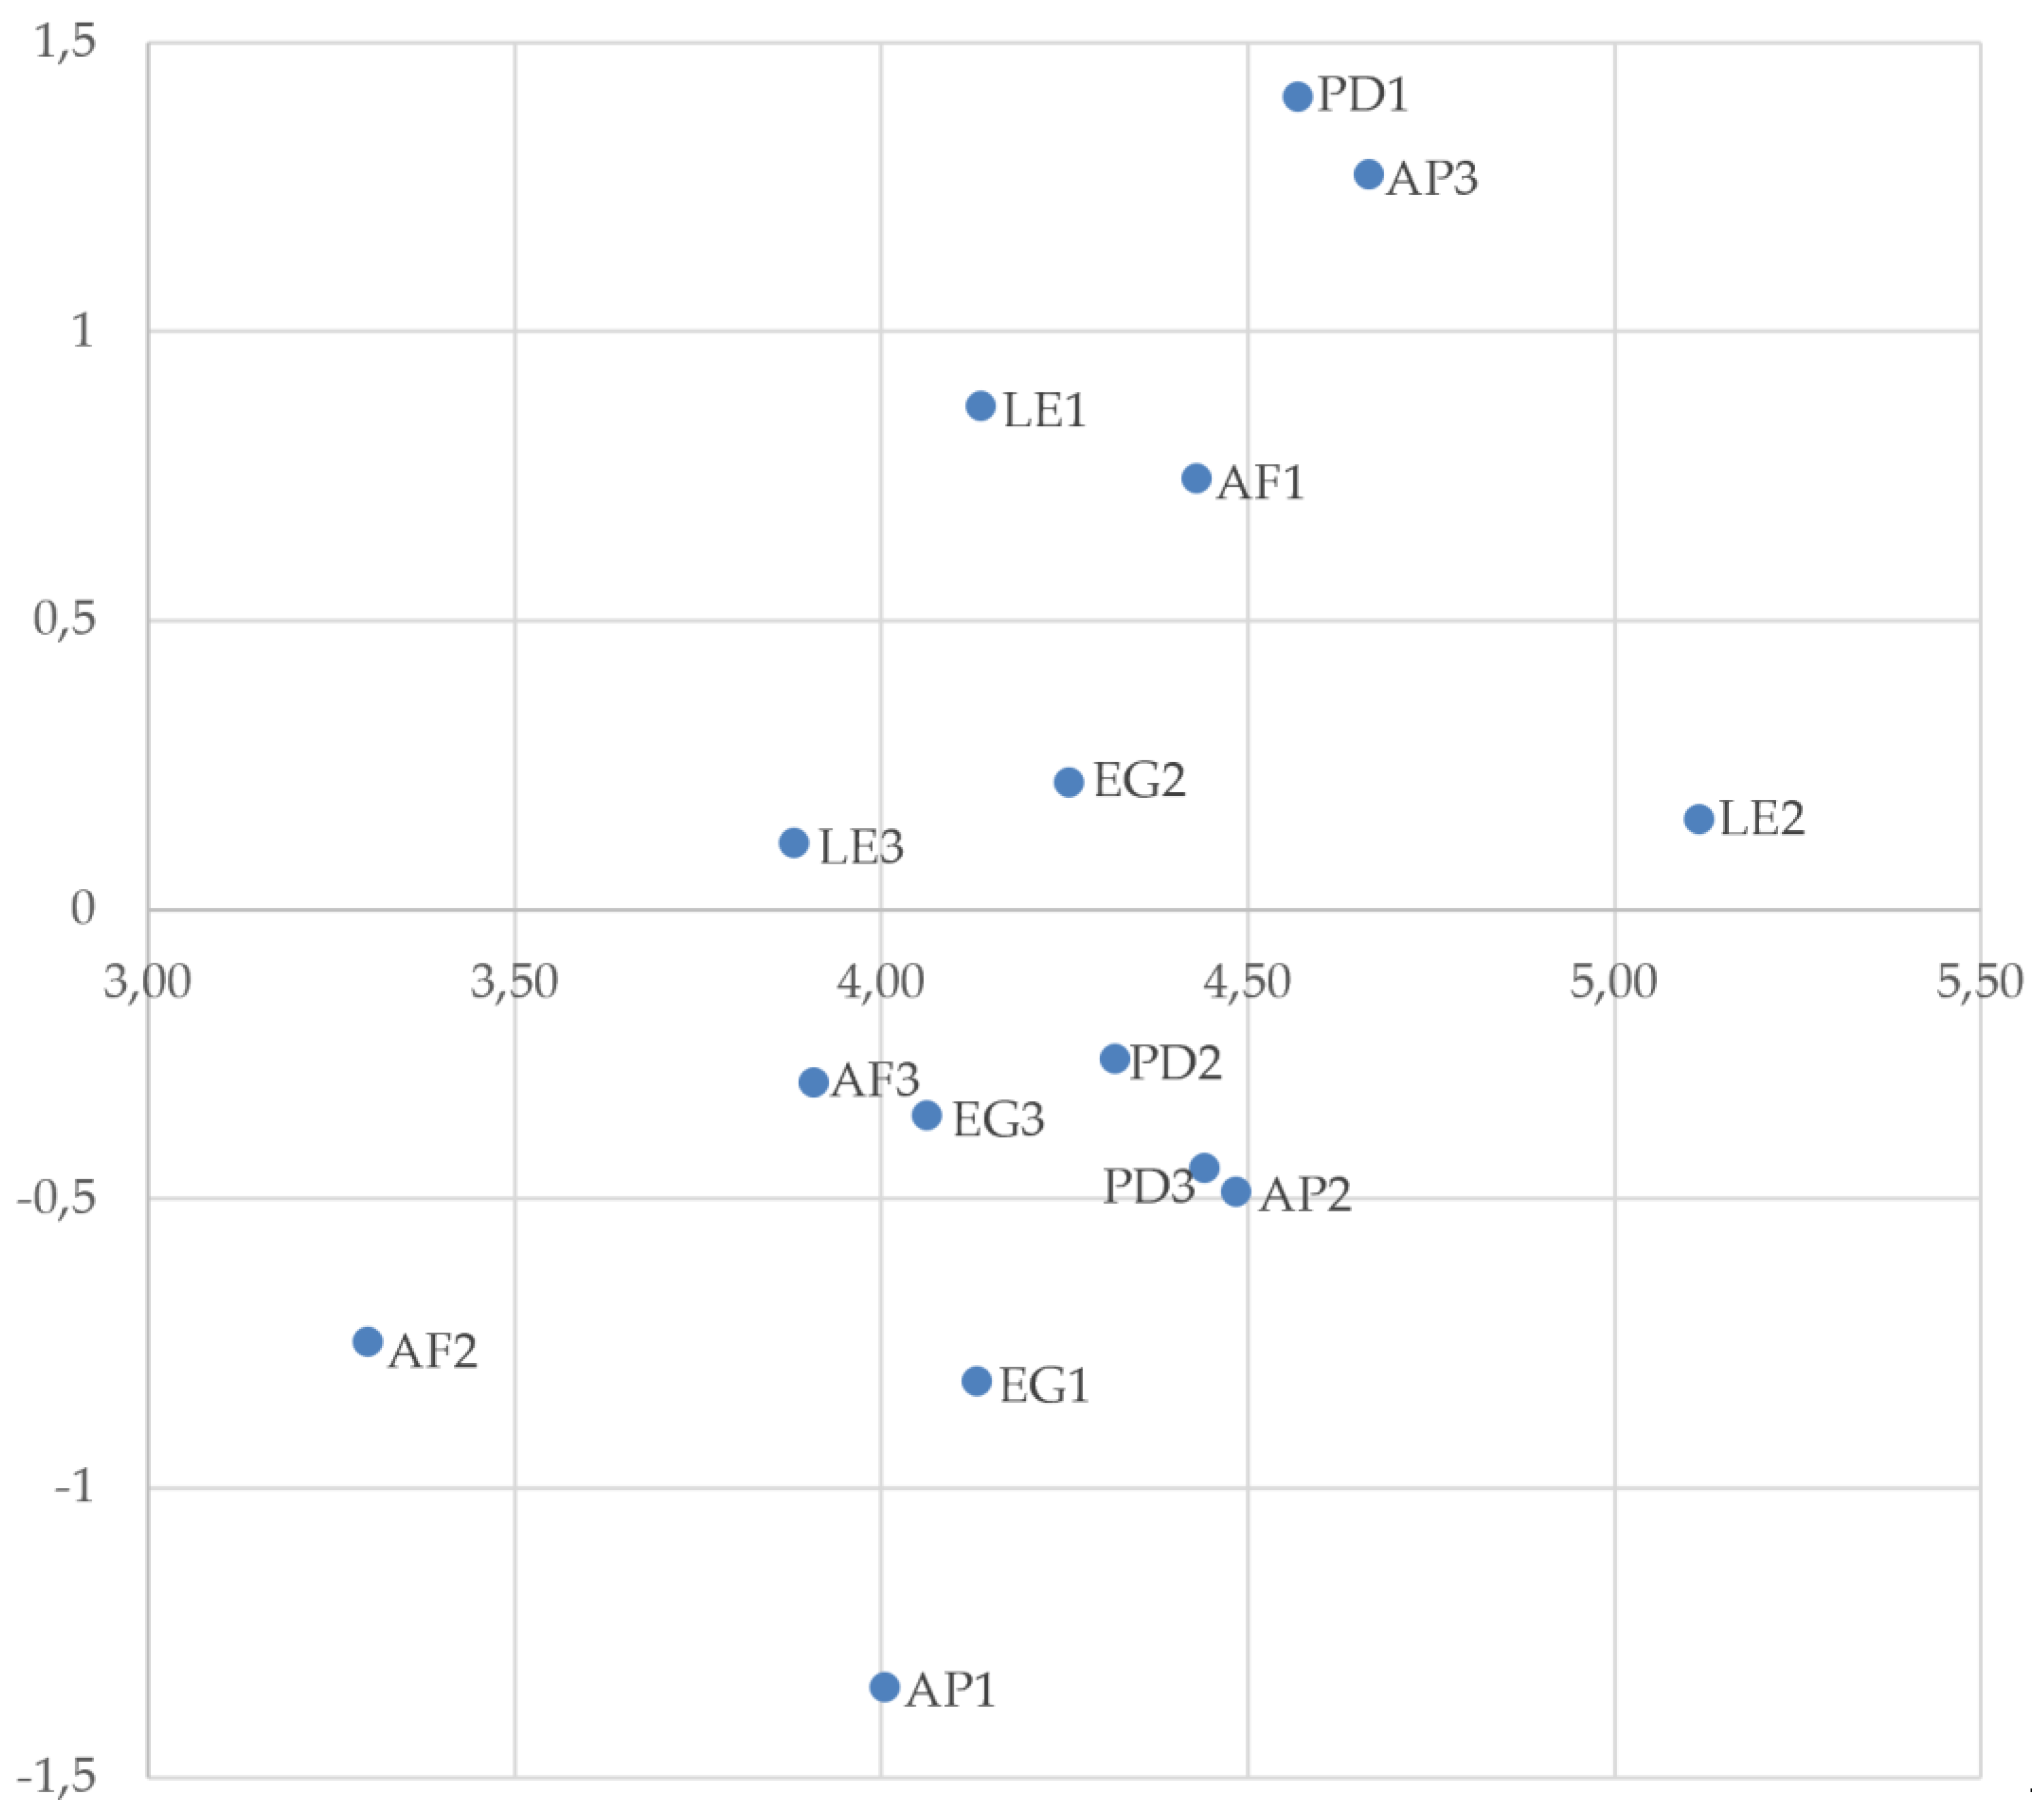
Table 1.
Comparison of evaluation models and their limitations in GAI-enabled higher education.
| Model/ Approach |
Primary Evaluation Focus |
Typical Application in Higher Education |
Key Limitation in GAI-Enabled Learning |
|---|---|---|---|
| Kirkpatrick’s model [20] |
Reactions, learning, behavior, results |
Training and post-hoc evaluation |
Assumes stable interventions; limited support for continuous or ethics-aware evaluation |
| Tyler model [28] | Alignment of objectives, instruction, outcomes | Curriculum design | Linear logic unsuited to dynamic GAI learning |
| ADDIE [29] | Systematic instructional design | Course and program development |
Staged phases incompatible with iterative AI updates |
| Phillips ROI [30] | Financial return on education |
Resource planning | Prioritizes cost metrics; overlooks academic integrity and impact |
| SAMR [31] | Technology integration levels | Digital innovation mapping |
Lacks pedagogical depth and AI risk constructs |
| TPACK/ iTPACK [32] |
Educator competence/readiness | Faculty development | Omits student outcomes and governance effectiveness |
| E-learning quality frameworks [21] | Multidimensional online learning quality | QA in digital learning | Treat AI as peripheral; don’t model interdependencies |
| Backward Design [23] |
Constructive alignment | Curriculum and Course planning |
Destabilized by AI authorship and adaptive content |
| AI content indices (Delphi-AHP) [35] | Content accuracy/ relevance |
AI-generated resource evaluation |
Narrow scope; omits systemic impact |
| AI-supported QA workflows [36] | Automation/ scalability |
Course monitoring | Emphasize efficiency over pedagogy and causality |
Note: Limitations in the last column reflect the authors’ synthesis of how these frameworks align with the structural demands of generative AI in higher education.
Table 2.
Direct influence matrix .
| PD1 | PD2 | PD3 | LE1 | LE2 | LE3 | AP1 | AP2 | AP3 | AF1 | AF2 | AF3 | EG1 | EG2 | EG3 | |
| PD1 | 0 | 4 | 1.67 | 4 | 4 | 1 | 2.33 | 2 | 1.67 | 4 | 3.67 | 2 | 4 | 1 | 2.67 |
| PD2 | 1 | 0 | 3.33 | 0 | 3.33 | 1.33 | 4 | 2.33 | 0 | 0 | 2.33 | 2 | 1.33 | 3.33 | 2.67 |
| PD3 | 2 | 3 | 0 | 0 | 2 | 4 | 2.33 | 4 | 0 | 1.67 | 3 | 0 | 2.33 | 1 | 0.67 |
| LE1 | 0 | 1 | 4 | 0 | 2.67 | 2.67 | 3 | 3 | 4 | 2.33 | 0 | 3.33 | 1 | 3.33 | 0.67 |
| LE2 | 1.33 | 3 | 3.67 | 1.33 | 0 | 2.67 | 1.33 | 1 | 3.33 | 3 | 0 | 4 | 3.67 | 1 | 3.67 |
| LE3 | 1.33 | 0 | 3.33 | 3 | 3.33 | 0 | 0 | 3.33 | 4 | 0 | 0 | 0 | 0 | 2.33 | 2.33 |
| AP1 | 2 | 0 | 2 | 1.67 | 0 | 2.67 | 0 | 1.67 | 1 | 0 | 2.67 | 0 | 3 | 0.33 | 0 |
| AP2 | 4 | 2 | 3 | 2 | 2.33 | 0 | 1.67 | 0 | 1.67 | 0 | 4 | 1 | 2.33 | 0 | 1 |
| AP3 | 0.67 | 3 | 4 | 2 | 0 | 3 | 4 | 3.67 | 0 | 3.67 | 1.67 | 4 | 3.33 | 4 | 2 |
| AF1 | 2.33 | 3 | 1 | 1 | 3.33 | 0 | 3.67 | 3 | 3.33 | 0 | 3 | 3 | 2 | 0.67 | 3.67 |
| AF2 | 0 | 0 | 0 | 0 | 2 | 0 | 3 | 4 | 0 | 2 | 0 | 0 | 4 | 0 | 2 |
| AF3 | 0.67 | 3 | 2.67 | 0 | 3 | 0 | 0 | 1 | 3 | 2.67 | 1 | 0 | 0 | 4 | 0 |
| EG1 | 0 | 2 | 0 | 1 | 1.33 | 2.33 | 4 | 0 | 0 | 2 | 0.67 | 3.67 | 0 | 1.67 | 3.33 |
| EG2 | 2.33 | 1.67 | 0 | 4 | 3 | 1.33 | 2 | 0 | 0 | 2.67 | 1.67 | 4 | 2 | 0 | 3.33 |
| EG3 | 1.33 | 3.33 | 2.33 | 1 | 1.67 | 2 | 2.67 | 3 | 0 | 0 | 1.33 | 0 | 2 | 3.33 | 0 |
Table 3.
Total-relation matrix T (comprehensive influence matrix).
| PD1 | PD2 | PD3 | LE1 | LE2 | LE3 | AP1 | AP2 | AP3 | AF1 | AF2 | AF3 | EG1 | EG2 | EG3 | |
| PD1 | 0.099 | 0.244 | 0.200 | 0.195 | 0.256 | 0.147 | 0.237 | 0.210 | 0.152 | 0.215 | 0.217 | 0.190 | 0.258 | 0.156 | 0.211 |
| PD2 | 0.099 | 0.099 | 0.184 | 0.073 | 0.187 | 0.119 | 0.209 | 0.163 | 0.069 | 0.079 | 0.147 | 0.135 | 0.145 | 0.163 | 0.160 |
| PD3 | 0.122 | 0.166 | 0.105 | 0.074 | 0.159 | 0.175 | 0.171 | 0.205 | 0.074 | 0.113 | 0.164 | 0.085 | 0.166 | 0.103 | 0.116 |
| LE1 | 0.093 | 0.151 | 0.234 | 0.090 | 0.197 | 0.172 | 0.213 | 0.208 | 0.193 | 0.158 | 0.113 | 0.198 | 0.157 | 0.192 | 0.134 |
| LE2 | 0.123 | 0.210 | 0.231 | 0.122 | 0.142 | 0.176 | 0.187 | 0.169 | 0.177 | 0.177 | 0.116 | 0.217 | 0.223 | 0.150 | 0.215 |
| LE3 | 0.106 | 0.106 | 0.196 | 0.149 | 0.186 | 0.090 | 0.117 | 0.192 | 0.173 | 0.086 | 0.089 | 0.098 | 0.112 | 0.147 | 0.152 |
| AP1 | 0.093 | 0.062 | 0.117 | 0.090 | 0.072 | 0.121 | 0.078 | 0.116 | 0.074 | 0.054 | 0.123 | 0.058 | 0.146 | 0.063 | 0.064 |
| AP2 | 0.162 | 0.149 | 0.176 | 0.116 | 0.163 | 0.085 | 0.162 | 0.111 | 0.109 | 0.086 | 0.188 | 0.114 | 0.173 | 0.084 | 0.120 |
| AP3 | 0.124 | 0.217 | 0.249 | 0.153 | 0.163 | 0.192 | 0.267 | 0.246 | 0.107 | 0.201 | 0.176 | 0.227 | 0.233 | 0.225 | 0.187 |
| AF1 | 0.146 | 0.204 | 0.164 | 0.112 | 0.214 | 0.106 | 0.241 | 0.211 | 0.171 | 0.103 | 0.190 | 0.189 | 0.194 | 0.131 | 0.211 |
| AF2 | 0.049 | 0.063 | 0.064 | 0.044 | 0.112 | 0.052 | 0.149 | 0.160 | 0.045 | 0.093 | 0.059 | 0.058 | 0.169 | 0.048 | 0.111 |
| AF3 | 0.082 | 0.168 | 0.160 | 0.065 | 0.172 | 0.075 | 0.109 | 0.121 | 0.137 | 0.143 | 0.107 | 0.092 | 0.101 | 0.177 | 0.094 |
| EG1 | 0.058 | 0.128 | 0.090 | 0.082 | 0.122 | 0.124 | 0.188 | 0.087 | 0.064 | 0.109 | 0.086 | 0.160 | 0.083 | 0.118 | 0.157 |
| EG2 | 0.129 | 0.155 | 0.122 | 0.174 | 0.197 | 0.123 | 0.177 | 0.119 | 0.091 | 0.157 | 0.133 | 0.203 | 0.165 | 0.104 | 0.188 |
| EG3 | 0.101 | 0.168 | 0.153 | 0.094 | 0.142 | 0.127 | 0.172 | 0.169 | 0.063 | 0.069 | 0.117 | 0.083 | 0.149 | 0.157 | 0.090 |
Table 4.
Influence degree, dependence degree, prominence, and causal degree.
| PD1 | 2.987 | 1.583 | 4.570 | 1.403 |
| PD2 | 2.031 | 2.291 | 4.321 | –0.260 |
| PD3 | 1.997 | 2.446 | 4.443 | –0.449 |
| LE1 | 2.503 | 1.634 | 4.137 | 0.869 |
| LE2 | 2.635 | 2.482 | 5.117 | 0.153 |
| LE3 | 1.998 | 1.885 | 3.883 | 0.113 |
| AP1 | 1.331 | 2.676 | 4.007 | –1.345 |
| AP2 | 1.998 | 2.487 | 4.485 | –0.489 |
| AP3 | 2.968 | 1.699 | 4.666 | 1.269 |
| AF1 | 2.588 | 1.844 | 4.431 | 0.744 |
| AF2 | 1.276 | 2.026 | 3.302 | –0.750 |
| AF3 | 1.804 | 2.104 | 3.909 | –0.300 |
| EG1 | 1.656 | 2.475 | 4.131 | –0.819 |
| EG2 | 2.239 | 2.020 | 4.258 | 0.219 |
| EG3 | 1.853 | 2.211 | 4.064 | –0.358 |
Table 5.
Cluster weight matrix.
| PD | LE | AP | AF | EG | |
| PD | 0.208 | 0.231 | 0.217 | 0.225 | 0.221 |
| LE | 0.229 | 0.221 | 0.237 | 0.209 | 0.221 |
| AP | 0.213 | 0.193 | 0.185 | 0.205 | 0.193 |
| AF | 0.174 | 0.159 | 0.196 | 0.173 | 0.184 |
| EG | 0.175 | 0.197 | 0.165 | 0.187 | 0.181 |
Table 6.
Weighted supermatrix.
| PD1 | PD2 | PD3 | LE1 | LE2 | LE3 | AP1 | AP2 | AP3 | AF1 | AF2 | AF3 | EG1 | EG2 | EG3 | |
|---|---|---|---|---|---|---|---|---|---|---|---|---|---|---|---|
| PD1 | 0.065 | 0.100 | 0.085 | 0.132 | 0.098 | 0.077 | 0.083 | 0.079 | 0.112 | 0.119 | 0.092 | 0.104 | 0.100 | 0.082 | 0.096 |
| PD2 | 0.064 | 0.040 | 0.079 | 0.049 | 0.072 | 0.062 | 0.073 | 0.061 | 0.051 | 0.044 | 0.063 | 0.074 | 0.056 | 0.085 | 0.072 |
| PD3 | 0.079 | 0.068 | 0.045 | 0.050 | 0.061 | 0.091 | 0.060 | 0.077 | 0.054 | 0.063 | 0.070 | 0.047 | 0.064 | 0.054 | 0.053 |
| LE1 | 0.066 | 0.074 | 0.081 | 0.055 | 0.083 | 0.086 | 0.098 | 0.087 | 0.084 | 0.079 | 0.074 | 0.081 | 0.070 | 0.087 | 0.059 |
| LE2 | 0.088 | 0.103 | 0.080 | 0.074 | 0.060 | 0.089 | 0.086 | 0.070 | 0.077 | 0.088 | 0.077 | 0.089 | 0.100 | 0.068 | 0.095 |
| LE3 | 0.075 | 0.052 | 0.068 | 0.091 | 0.078 | 0.045 | 0.054 | 0.080 | 0.076 | 0.043 | 0.059 | 0.040 | 0.050 | 0.066 | 0.067 |
| AP1 | 0.052 | 0.031 | 0.046 | 0.048 | 0.035 | 0.059 | 0.028 | 0.045 | 0.047 | 0.033 | 0.052 | 0.030 | 0.051 | 0.033 | 0.033 |
| AP2 | 0.091 | 0.074 | 0.069 | 0.062 | 0.079 | 0.041 | 0.059 | 0.043 | 0.070 | 0.052 | 0.079 | 0.059 | 0.060 | 0.044 | 0.063 |
| AP3 | 0.070 | 0.108 | 0.098 | 0.082 | 0.079 | 0.093 | 0.097 | 0.096 | 0.068 | 0.121 | 0.074 | 0.117 | 0.082 | 0.117 | 0.097 |
| AF1 | 0.092 | 0.082 | 0.074 | 0.081 | 0.068 | 0.072 | 0.095 | 0.084 | 0.095 | 0.052 | 0.092 | 0.097 | 0.077 | 0.068 | 0.093 |
| AF2 | 0.031 | 0.025 | 0.029 | 0.032 | 0.036 | 0.035 | 0.059 | 0.064 | 0.025 | 0.048 | 0.029 | 0.029 | 0.067 | 0.025 | 0.049 |
| AF3 | 0.052 | 0.067 | 0.072 | 0.046 | 0.055 | 0.051 | 0.043 | 0.048 | 0.076 | 0.073 | 0.052 | 0.047 | 0.040 | 0.092 | 0.042 |
| EG1 | 0.035 | 0.050 | 0.043 | 0.046 | 0.052 | 0.065 | 0.058 | 0.038 | 0.048 | 0.061 | 0.048 | 0.067 | 0.038 | 0.056 | 0.065 |
| EG2 | 0.079 | 0.060 | 0.058 | 0.098 | 0.084 | 0.065 | 0.054 | 0.052 | 0.069 | 0.088 | 0.074 | 0.085 | 0.075 | 0.050 | 0.078 |
| EG3 | 0.061 | 0.065 | 0.073 | 0.053 | 0.061 | 0.067 | 0.053 | 0.074 | 0.047 | 0.039 | 0.065 | 0.035 | 0.068 | 0.075 | 0.037 |
Table 7.
Limit supermatrix.
| PD1 | PD2 | PD3 | LE1 | LE2 | LE3 | AP1 | AP2 | AP3 | AF1 | AF2 | AF3 | EG1 | EG2 | EG3 | |
| PD1 | 0.095 | 0.095 | 0.095 | 0.095 | 0.095 | 0.095 | 0.095 | 0.095 | 0.095 | 0.095 | 0.095 | 0.095 | 0.095 | 0.095 | 0.095 |
| PD2 | 0.062 | 0.062 | 0.062 | 0.062 | 0.062 | 0.062 | 0.062 | 0.062 | 0.062 | 0.062 | 0.062 | 0.062 | 0.062 | 0.062 | 0.062 |
| PD3 | 0.062 | 0.062 | 0.062 | 0.062 | 0.062 | 0.062 | 0.062 | 0.062 | 0.062 | 0.062 | 0.062 | 0.062 | 0.062 | 0.062 | 0.062 |
| LE1 | 0.077 | 0.077 | 0.077 | 0.077 | 0.077 | 0.077 | 0.077 | 0.077 | 0.077 | 0.077 | 0.077 | 0.077 | 0.077 | 0.077 | 0.077 |
| LE2 | 0.082 | 0.082 | 0.082 | 0.082 | 0.082 | 0.082 | 0.082 | 0.082 | 0.082 | 0.082 | 0.082 | 0.082 | 0.082 | 0.082 | 0.082 |
| LE3 | 0.065 | 0.065 | 0.065 | 0.065 | 0.065 | 0.065 | 0.065 | 0.065 | 0.065 | 0.065 | 0.065 | 0.065 | 0.065 | 0.065 | 0.065 |
| AP1 | 0.042 | 0.042 | 0.042 | 0.042 | 0.042 | 0.042 | 0.042 | 0.042 | 0.042 | 0.042 | 0.042 | 0.042 | 0.042 | 0.042 | 0.042 |
| AP2 | 0.064 | 0.064 | 0.064 | 0.064 | 0.064 | 0.064 | 0.064 | 0.064 | 0.064 | 0.064 | 0.064 | 0.064 | 0.064 | 0.064 | 0.064 |
| AP3 | 0.092 | 0.092 | 0.092 | 0.092 | 0.092 | 0.092 | 0.092 | 0.092 | 0.092 | 0.092 | 0.092 | 0.092 | 0.092 | 0.092 | 0.092 |
| AF1 | 0.081 | 0.081 | 0.081 | 0.081 | 0.081 | 0.081 | 0.081 | 0.081 | 0.081 | 0.081 | 0.081 | 0.081 | 0.081 | 0.081 | 0.081 |
| AF2 | 0.037 | 0.037 | 0.037 | 0.037 | 0.037 | 0.037 | 0.037 | 0.037 | 0.037 | 0.037 | 0.037 | 0.037 | 0.037 | 0.037 | 0.037 |
| AF3 | 0.059 | 0.059 | 0.059 | 0.059 | 0.059 | 0.059 | 0.059 | 0.059 | 0.059 | 0.059 | 0.059 | 0.059 | 0.059 | 0.059 | 0.059 |
| EG1 | 0.051 | 0.051 | 0.051 | 0.051 | 0.051 | 0.051 | 0.051 | 0.051 | 0.051 | 0.051 | 0.051 | 0.051 | 0.051 | 0.051 | 0.051 |
| EG2 | 0.072 | 0.072 | 0.072 | 0.072 | 0.072 | 0.072 | 0.072 | 0.072 | 0.072 | 0.072 | 0.072 | 0.072 | 0.072 | 0.072 | 0.072 |
| EG3 | 0.058 | 0.058 | 0.058 | 0.058 | 0.058 | 0.058 | 0.058 | 0.058 | 0.058 | 0.058 | 0.058 | 0.058 | 0.058 | 0.058 | 0.058 |
Table 8.
Indicator weights.
| PD1 | PD2 | PD3 | LE1 | LE2 | LE3 | AP1 | AP2 | AP3 | AF1 | AF2 | AF3 | EG1 | EG2 | EG3 | |
|---|---|---|---|---|---|---|---|---|---|---|---|---|---|---|---|
| W | 0.095 | 0.062 | 0.062 | 0.077 | 0.082 | 0.065 | 0.042 | 0.064 | 0.092 | 0.081 | 0.037 | 0.059 | 0.051 | 0.072 | 0.058 |
Table 9.
Mean expert ratings for each framework indicator (transposed).
| Indicator |
E- Government |
Digital Marketing |
MIS |
Internet Tech in Tourism |
| PD1 | 4.6 | 4.1 | 4.3 | 4.2 |
| PD2 | 4.4 | 3.9 | 4.0 | 4.0 |
| PD3 | 4.5 | 4.0 | 4.1 | 4.1 |
| LE1 | 3.6 | 4.6 | 3.7 | 4.4 |
| LE2 | 3.5 | 4.7 | 3.6 | 4.3 |
| LE3 | 3.4 | 4.5 | 3.7 | 4.1 |
| AP1 | 3.0 | 4.2 | 3.7 | 3.6 |
| AP2 | 2.8 | 4.5 | 3.6 | 3.8 |
| AP3 | 2.7 | 4.6 | 3.6 | 3.5 |
| AF1 | 3.8 | 4.4 | 3.5 | 4.0 |
| AF2 | 3.6 | 4.2 | 3.5 | 3.8 |
| AF3 | 3.7 | 4.3 | 3.6 | 4.1 |
| EG1 | 4.5 | 3.4 | 3.9 | 3.8 |
| EG2 | 4.6 | 3.5 | 3.8 | 3.7 |
| EG3 | 4.4 | 3.3 | 3.7 | 3.6 |
Table 10.
Weighted contributions and total course scores.
| Indicator (weight) | E- Government |
Digital Marketing |
MIS | Internet Tech in Tourism |
|---|---|---|---|---|
| PD1 (0.095) | 0.439 | 0.391 | 0.411 | 0.401 |
| PD2 (0.062) | 0.275 | 0.243 | 0.250 | 0.250 |
| PD3 (0.062) | 0.281 | 0.250 | 0.256 | 0.256 |
| LE1 (0.077) | 0.278 | 0.355 | 0.286 | 0.340 |
| LE2 (0.082) | 0.287 | 0.386 | 0.295 | 0.353 |
| LE3 (0.065) | 0.220 | 0.291 | 0.239 | 0.265 |
| AP1 (0.042) | 0.125 | 0.176 | 0.155 | 0.151 |
| AP2 (0.064) | 0.178 | 0.287 | 0.229 | 0.242 |
| AP3 (0.092) | 0.250 | 0.425 | 0.333 | 0.324 |
| AF1 (0.081) | 0.306 | 0.355 | 0.282 | 0.323 |
| AF2 (0.037) | 0.135 | 0.157 | 0.131 | 0.142 |
| AF3 (0.059) | 0.217 | 0.252 | 0.211 | 0.240 |
| EG1 (0.051) | 0.229 | 0.173 | 0.199 | 0.194 |
| EG2 (0.072) | 0.333 | 0.253 | 0.275 | 0.268 |
| EG3 (0.058) | 0.254 | 0.191 | 0.214 | 0.208 |
| TOTAL | 3.807 | 4.185 | 3.765 | 3.955 |
Note: The calculations used the values of the weighting coefficients with high accuracy, without rounding to the 3rd digit, as published in Table 8.
Table 11.
Dimension-level weighted scores (PD, LE, AP, AF, EG) by course and total.
| Course | E- Government |
Digital Marketing |
MIS | Internet Tech in Tourism |
|---|---|---|---|---|
| PD (PD1–3) | 0.995 | 0.884 | 0.917 | 0.907 |
| LE (LE1–3) | 0.785 | 1.032 | 0.82 | 0.958 |
| AP (AP1–3) | 0.553 | 0.888 | 0.717 | 0.717 |
| AF (AF1–3) | 0.658 | 0.764 | 0.624 | 0.705 |
| EG (EG1-3) | 0.816 | 0.617 | 0.688 | 0.670 |
Disclaimer/Publisher’s Note: The statements, opinions and data contained in all publications are solely those of the individual author(s) and contributor(s) and not of MDPI and/or the editor(s). MDPI and/or the editor(s) disclaim responsibility for any injury to people or property resulting from any ideas, methods, instructions or products referred to in the content. |
© 2026 by the authors. Licensee MDPI, Basel, Switzerland. This article is an open access article distributed under the terms and conditions of the Creative Commons Attribution (CC BY) license.
Copyright: This open access article is published under a Creative Commons CC BY 4.0 license, which permit the free download, distribution, and reuse, provided that the author and preprint are cited in any reuse.


