
Submitted:
30 December 2025
Posted:
30 December 2025
You are already at the latest version
Abstract
Conformal prediction (CP) provides distribution-free uncertainty quantification by constructing prediction sets with guaranteed coverage. In human-in-the-loop (HITL) decision systems, these sets naturally define deferral policies: cases with singleton sets proceed automatically, while those with multiple labels require human review. Mondrian CP, which calibrates separately per group, has been proposed to achieve group-conditional coverage validity, ensuring each demographic group meets the target coverage level. However, we demonstrate through extensive experiments (832K evaluations across 14K configurations, 6 datasets, 100 seeds) that improving coverage validity comes at a significant cost: Mondrian CP increases deferral disparity by 143% compared to global CP, despite reducing coverage disparity by 26% on average. This coverage-deferral trade-off is fundamental: it persists across all datasets (p < 0.001), is invariant to HITL parameters, and exhibits monotonic behavior with respect to the shrinkage interpolation parameter γ. We prove an analogous impossibility result for conformal prediction: under specific conditions, coverage parity and deferral parity cannot be simultaneously achieved when base rates differ between groups. We further demonstrate that standard fairness metrics (Equalized Odds, Average Odds Difference) are invariant to CP method choice, identifying deferral gap as a critical operational fairness metric that captures CP’s unique impact on who receives human review, a dimension invisible to standard EO metrics. Our findings provide actionable guidance: use Mondrian for group-conditional coverage validity, global CP for deferral fairness, or shrinkage for balanced trade-offs.
Keywords:
conformal prediction
; machine learning
; binary classification
; human in the loop
1. Introduction
Machine learning systems increasingly support high-stakes decisions in domains such as credit scoring [22,24], criminal justice [2,6], and healthcare [29]. In these contexts, practitioners often deploy human-in-the-loop (HITL) systems where algorithmic predictions are reviewed by human experts [3,16,25]. A critical challenge is communicating uncertainty: decision-makers need to know not just what the model predicts, but how confident it is.
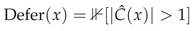
Conformal prediction (CP) provides a principled framework for uncertainty quantification [31,37]. Given a classifier and a desired coverage level , CP constructs prediction sets guaranteed to contain the true label with probability at least . When the prediction set contains a single label, the model is confident; when it contains multiple labels, uncertainty is high. This naturally suggests a deferral protocol: cases with singleton sets () proceed automatically, while cases with multiple labels () are deferred to human review [14,28].
Fairness in conformal prediction has recently gained attention. Standard (“global”) CP provides marginal coverage (the overall coverage rate meets the target ), but coverage may vary across demographic groups. Mondrian CP [36] addresses this by calibrating separately per group, achieving group-conditional coverage validity, i.e., for each group g. (Note: Mondrian requires the sensitive attribute G at test time; see Section 6.5 for deployment considerations.) This provides a validity guarantee per group, not necessarily exact coverage equality. However, it ensures no group is systematically under-covered. Indeed, Romano et al. [32] propose equalized coverage as a fairness criterion, treating groups “with malice toward none.”
However, recent work by Cresswell et al. [8] sounds an alarm: in human-subject experiments, giving people equalized-coverage prediction sets increased disparate impact compared to standard coverage. They hypothesize this occurs because equalizing coverage requires larger prediction sets for some groups, which affects downstream decisions. Our work provides the first large-scale, systematic empirical investigation of this phenomenon.
1.1. Our Contributions
Normative context. We emphasize that deferral disparity is not inherently harmful: deferred cases receive human review, which may improve outcomes for uncertain predictions. Whether higher deferral rates constitute “protection” (more scrutiny benefits individuals) or “burden” (delays and friction harm individuals) depends on domain context, human reviewer quality, and capacity constraints (Section 6.3). Our analysis characterizes the existence of trade-offs, leaving normative judgments to practitioners.
We make the following contributions:
- 1.
- Coverage-Deferral Trade-off. We identify a fundamental trade-off: Mondrian CP reduces coverage disparity by 26% but increases deferral disparity by 143% compared to global CP (p < 0.001, 100 seeds, 6 datasets).
- 2.
- Impossibility Result. We prove an analogous impossibility result for conformal prediction, parallel to Kleinberg et al. [20]: when base rates differ between groups, coverage parity and deferral parity cannot be simultaneously achieved.
- 3.
- Metric Selection. We demonstrate that standard EO metrics (TPR gap, FPR gap, Average Odds) are invariant to CP method choice because CP changes prediction sets, not point predictions. This identifies deferral gap as the key metric capturing CP’s unique fairness impact in HITL systems.
- 4.
- Practical Guidance. Through a comprehensive sweep of the shrinkage parameter , we characterize the trade-off curve and provide actionable recommendations: (global) for deferral fairness, (Mondrian) for group-conditional coverage validity, for balanced objectives.
2. Related Work
Conformal Prediction. Conformal prediction provides distribution-free uncertainty quantification with finite-sample coverage guarantees [30,31,37]. Inductive (split) conformal prediction [31] separates model training from calibration, enabling efficient computation. Recent advances include adaptive prediction sets (APS) for classification [1,32,33] and extensions beyond exchangeability [5,15]. While CP provides marginal coverage guarantees, conditional coverage (guaranteeing coverage for each feature value x) is impossible without additional assumptions [23].
Algorithmic Fairness. The fairness literature has produced numerous definitions [26,35], including demographic parity [13], equalized odds [17], calibration [6], and individual fairness [11]. Crucially, these criteria often conflict: Kleinberg et al. [20] and Chouldechova [6] proved that calibration and equal error rates cannot be simultaneously achieved when base rates differ between groups. Our work proves an analogous impossibility for coverage and deferral in conformal prediction.
Human-in-the-Loop ML. HITL systems combine algorithmic predictions with human judgment [9]. The “learning to defer” framework [25,28] optimizes when to defer decisions to human experts. Selective prediction [7,14] allows classifiers to abstain on uncertain cases. Green & Chen [16] show that algorithmic risk scores can alter human decision-making in problematic ways. Our work connects CP-based deferral to fairness concerns.
Fairness in Conformal Prediction. Mondrian CP [36] provides group-conditional coverage by calibrating separately per group. Romano et al. [32] propose equalized coverage as a fairness criterion. Most relevant to our work, Cresswell et al. [8] show through human-subject experiments that equalized coverage can increase disparate impact. They propose equalizing set size instead. Our work provides the first large-scale computational study systematically characterizing this trade-off.
Alternative Fairness Objectives. Beyond coverage parity, researchers have proposed alternative CP fairness criteria. Cresswell et al. [8] advocate for set size parity, arguing that equal expected set sizes reduce downstream disparate impact. Our work complements this perspective: we show that the choice between coverage parity (Mondrian) and set size parity (which correlates with deferral parity in our HITL framework) represents a fundamental trade-off, not a design oversight. Practitioners must explicitly choose their fairness objective based on domain-specific priorities: group-conditional validity versus equitable deferral burden.
3. Preliminaries
3.1. Conformal Prediction
Consider a classification task with features and labels . Given a base classifier that outputs class probabilities, conformal prediction constructs prediction sets with coverage guarantee:
where is the user-specified miscoverage rate.
Split Conformal Prediction. We use the inductive (split) approach [31]. Given training data and calibration data :
- 1.
- Train classifier f on
- 2.
- Compute conformity scores on
- 3.
- Compute quantile
- 4.
- Form prediction sets:
Conformity Score. For binary classification, we use an inverse probability score (also called 1-minus-probability score):
where is the predicted probability of the true label y. This is a monotone conformity score that yields lower values for higher model confidence. If , then ; if , then , where . While related to the Adaptive Prediction Sets (APS) framework [32], we note this is a direct formulation for binary classification rather than a reduction of the general multi-class APS definition. A prediction set is formed as:
This produces singleton sets when the model is confident (p near 0 or 1) and both-class sets when uncertain ().
Implementation Note. We implement a custom split conformal prediction framework (not MAPIE) that directly computes thresholds from calibration scores. Algorithm 1 in Supplementary Material S3 provides complete pseudo-code for reproducibility.
3.2. Mondrian Conformal Prediction
Let denote a sensitive attribute (e.g., sex, race). Mondrian CP [36] calibrates separately per group:
where is the number of calibration samples in group g. This ensures group-conditional coverage validity:
This provides a validity lower bound on per-group coverage, distinct from coverage parity (or equalized coverage) which requires . While Mondrian ensures each group achieves at least coverage, finite-sample over-coverage can differ asymmetrically between groups.
3.3. Shrinkage Interpolation
We interpolate between global and Mondrian CP using shrinkage parameter :
When , we recover global CP; when , we recover Mondrian CP.
3.4. Deferral Protocol
In HITL systems, prediction sets naturally define a deferral policy:
 Singleton sets () indicate confident predictions that proceed automatically; multi-element sets indicate uncertainty requiring human review.
Why Set Size ? For binary classification with , a prediction set can contain: the empty set (rare, indicating under-coverage), a singleton or (confident prediction), or both labels (maximal uncertainty). The deferral rule captures exactly the cases where the model cannot distinguish between classes at the target confidence level.
3.5. Fairness Metrics
We define the following fairness metrics for groups :
Coverage Gap:
where .
Deferral Gap:
where .
Set Size Gap:
Relationship. In binary classification without empty sets, , so set size gap and deferral gap are linearly related. We report both for clarity, but they convey similar information in the binary case.
4. Methodology
4.1. Experimental Design
Data Splitting. We use a 4-way split to ensure no data leakage:
- Train (60%): Model training and preprocessing fitting
- Calibration (10%): Calibration method fitting (isotonic regression)
- CP (10%): Conformal prediction threshold calibration
- Test (20%): Final evaluation
Datasets. We use six benchmark datasets commonly used in fairness research (Table 1):
Models. We train five model types: Gradient Boosting (GB), Random Forest (RF), XGBoost (XGB), Logistic Regression (LR), and MLP. Results are aggregated across models.
Conformal Methods. We compare five CP methods in our analysis:
The main text focuses on Global, Mondrian, and Shrinkage to characterize the coverage-deferral trade-off. Extended comparisons including LAC and SAPS are in Supplementary Material S7.2, showing these methods exhibit similar trade-off patterns.
Why Similar Trade-offs for LAC/SAPS? Both LAC and SAPS adjust prediction set sizes based on instance-level uncertainty, which creates systematic differences by group when base rates differ. LAC’s confidence-weighted conformity scores produce larger sets for low-confidence predictions, which correlate with minority group membership when classifiers perform worse on underrepresented groups. SAPS’s regularization similarly affects the relationship between coverage and set size. Consequently, all adaptive CP methods that modulate set sizes based on uncertainty exhibit analogous coverage-deferral trade-offs, though the magnitudes differ across methods.
Statistical Robustness. All experiments use 100 random seeds with 95% confidence intervals computed via bootstrap.

Table 1.
Dataset characteristics. N = test set size after 4-way split.
| Dataset | N | Base Rate | Base Gap | Sensitive Attr |
|---|---|---|---|---|
| Adult | 9,769 | 0.239 | 0.198 | sex (M/F) |
| COMPAS | 1,058 | 0.470 | 0.120 | race (W/B) |
| German Credit | 200 | 0.300 | 0.102 | sex (M/F) |
| Taiwan Credit | 6,000 | 0.221 | 0.031 | sex (M/F) |
| ACS Income | 20,000 | 0.385 | 0.145 | sex (M/F) |
| Bank Marketing | 9,043 | 0.117 | 0.012 | age (≥40) |
4.2. HITL Simulation
For deferred cases, we simulate human review with parameters:
- Human accuracy : Probability of correct decision
- Review rate : Fraction of deferrals actually reviewed
For each deferred case, if reviewed (), the final prediction is:
Our HITL simulation is intentionally stylized: it tests whether CP-induced fairness metrics (coverage gap, deferral gap) depend on downstream human parameters. We vary (i) human accuracy to cover moderately reliable to near-expert review, and (ii) review rate to represent capacity constraints. If a case is deferred but not reviewed (with probability ), the system outputs the model’s point prediction; if reviewed, the human produces a correct label with probability h. Because CP changes who decides (deferral) rather than underlying point predictions, CP-specific fairness metrics are invariant to ; only final accuracy changes.
5. Experiments and Results
We present our findings in a sequence that reveals the core insight: standard fairness metrics fail to capture conformal prediction’s impact, masking a fundamental trade-off between coverage and deferral fairness.
5.1. Standard EO Metrics are Invariant to CP Method
We begin with a critical methodological finding: standard fairness metrics (EOD, AOD) are identical across CP methods (Table 2).
Why does this happen? CP modifies prediction sets, not point predictions. Standard EO metrics [17] are computed from the confusion matrix of binary predictions  , which is unchanged by CP. If researchers evaluated CP methods using only these metrics, they would conclude that all CP methods are equally fair, a potentially misleading conclusion.
, which is unchanged by CP. If researchers evaluated CP methods using only these metrics, they would conclude that all CP methods are equally fair, a potentially misleading conclusion.
Final HITL Output Fairness. An important question is whether this invariance extends to final HITL decisions . We verify this experimentally across CP methods with human accuracy and review rate (Table 3). The results confirm that FPR and FNR gaps on are approximately invariant to CP method choice. Small differences (within 0.01) arise from the stochastic HITL simulation: different deferral patterns lead to different cases being reviewed, but the aggregate fairness properties remain stable because human accuracy is group-invariant by construction.
This invariance establishes that deferral gap is a necessary metric for measuring CP’s fairness impact: it captures the “who decides” dimension that standard EO metrics miss. We now reveal what this metric uncovers.
5.2. Main Result: Coverage-Deferral Trade-off
Our central finding is the coverage-deferral trade-off: methods that reduce coverage disparity worsen deferral fairness, and vice versa.
Table 4 presents results across all datasets (100 seeds, ). Mondrian CP on average:
- Reduces coverage gap by 26% (0.032 → 0.023), though increases in 3 of 6 datasets
- Increases deferral gap by 143% on average (0.052 → 0.125)
All differences are statistically significant (p < 0.001, paired t-test).
Table 4.
Coverage-deferral trade-off across datasets (, 100 seeds). All differences significant at p < 0.001. †Bank Marketing’s ratio is inflated by near-zero Global deferral gap (0.000 ± 0.001); for this dataset, the absolute increase is the appropriate metric.
Table 4.
Coverage-deferral trade-off across datasets (, 100 seeds). All differences significant at p < 0.001. †Bank Marketing’s ratio is inflated by near-zero Global deferral gap (0.000 ± 0.001); for this dataset, the absolute increase is the appropriate metric.
| Coverage Gap | Deferral Gap | ||||
|---|---|---|---|---|---|
| Dataset | Global | Mondrian | Global | Mondrian | Ratio |
| ACS Income | 0.008 | 0.008 | 0.034 ± 0.007 | 0.054 ± 0.010 | 1.6x |
| Adult | 0.050 | 0.012 | 0.051 ± 0.012 | 0.129 ± 0.018 | 2.5x |
| Bank Marketing | 0.020 | 0.011 | 0.000 ± 0.001 | 0.030 ± 0.008 | 85x† |
| COMPAS | 0.018 | 0.033 | 0.057 ± 0.015 | 0.108 ± 0.022 | 1.9x |
| German Credit | 0.035 | 0.057 | 0.061 ± 0.035 | 0.247 ± 0.048 | 4.0x |
| Taiwan Credit | 0.011 | 0.013 | 0.034 ± 0.009 | 0.077 ± 0.014 | 2.2x |
| Average | 0.032 | 0.023 | 0.052 | 0.125 | 2.4x |
Extended experiments with LAC and SAPS (Supplementary S7.2) confirm these findings generalize: LAC achieves coverage gap 0.019 with deferral gap 0.048, clustering with Global rather than Mondrian. SAPS exhibits similar behavior. This suggests the coverage-deferral trade-off is fundamental to threshold-based CP methods, not specific to our primary comparisons.
Note on Coverage Gap Variability. While Mondrian reduces coverage gap on average (driven primarily by Adult), three datasets show increased coverage gaps (COMPAS: 0.018→0.033, German: 0.035→0.057, Taiwan: 0.011→0.013). This occurs because Mondrian provides group-conditional validity (Eq. 5), not guaranteed equal realized coverage. On finite samples with smaller calibration sets ( for German Credit), over-coverage can differ asymmetrically between groups, increasing the observed gap despite valid per-group coverage.
Mechanism. The trade-off arises because Mondrian CP enforces group-conditional validity, i.e., for each group g, which, in practice, approximates coverage parity when base rates differ. For groups with lower base rates or harder classification, achieving this validity guarantee requires larger prediction sets, which increases deferral rates:
Figure 1 provides a comprehensive visualization of this trade-off across all dimensions of our experimental design.
5.3. Gamma Sweep: No Optimal Balance
Figure 2 shows the trade-off across 21 values of . The relationship is monotonic on average: as increases, coverage gap moves toward the Mondrian value (decreasing in most datasets, increasing in some like COMPAS) while deferral gap consistently increases. There is no “sweet spot” where both are minimized.
Dataset-specific correlations confirm this pattern:
- Adult: vs coverage_gap: ***; vs deferral_gap: ***
- Bank Marketing: *** and *** respectively
- All correlations significant at p < 0.001
Shrinkage Coverage Validity. While shrinkage provides a heuristic trade-off between Global and Mondrian, intermediate values lack formal coverage guarantees. Empirically, we observe that marginal coverage is maintained across all values: for , average coverage remains within ±0.3% of the target 0.90. The bounded coverage gap values in Table 6 confirm this stability. Thus, shrinkage with offers practical coverage validity while balancing the trade-off, though formal guarantees apply only at (Global) and (Mondrian).
5.4. HITL Invariance: A Structural Property by Design
The trade-off ratio (≈2.4x) is invariant to HITL parameters (Table 5). This invariance is expected by design: deferral decisions are determined entirely by conformal prediction (whether ), computed before HITL parameters (review rate r, human accuracy h) are applied. Thus, coverage gap and deferral gap are structural properties of the CP method, independent of downstream human involvement.
What remains constant: Coverage, coverage gap, and deferral gap remain identical across all HITL configurations. These are determined solely by the CP method.
What changes: Final system accuracy varies with HITL parameters (higher review rate → more cases reviewed → higher accuracy when ).
Implication: The coverage-deferral trade-off is a property of the conformal prediction layer, not the HITL protocol. Practitioners cannot “tune away” this trade-off by adjusting review rates; they must choose a CP method ( value) that aligns with their fairness priorities.
Final Output Fairness. While deferral gap measures disparity at the CP level, practitioners may also care about fairness of final HITL decisions. We distinguish two levels of analysis:
- Point prediction EO (FPR/FNR gaps on model predictions): These are invariant to CP method because CP changes prediction sets, not the underlying point predictions. Our experiments confirm this (Table 2: FPR gap and FNR gap are identical across Global, Mondrian, and Shrinkage).
- Final HITL output EO (FPR/FNR gaps on decisions after human review): These depend on human accuracy h and review rate r, which are protocol parameters, not CP properties. Since human decisions are independent of CP method, and non-deferred cases use invariant point predictions, final output EO is primarily determined by HITL protocol parameters, not CP choice.
Thus, deferral gap captures the unique fairness dimension that CP method selection affects: who receives human review, not what the final decision is.
Why This Matters. The invariance of standard EO metrics to CP method choice is not merely a “null result”; it reveals a fundamental gap in fairness evaluation protocols. A practitioner comparing Global vs Mondrian CP using only TPR gap and FPR gap would conclude “both methods are equally fair,” missing that Mondrian routes 2-3× more cases from one group to human review. This routing disparity is invisible to outcome-based metrics but has tangible operational consequences. For concrete per-group deferral rates, see Table 25 in Supplementary Material, which shows absolute rates across all datasets (e.g., German Credit under Mondrian: Group 0 defers 39.1% vs Group 1 at 14.4%).
Illustrative Example. Consider two groups with identical equalized odds disparity (EOD = 0). Under Global CP, both groups defer 10% of cases. Under Mondrian CP targeting coverage parity, Group A defers 30% while Group B defers 10%, a 3× difference. Since CP changes only prediction sets (not point predictions), EOD remains 0. A fairness audit using only EOD would conclude “both methods are equally fair,” completely missing the 3× routing disparity. This reveals a gap in standard audit protocols: outcome-only reporting can mask substantial operational disparities in routing burden. This example motivates deferral gap as the appropriate CP-specific fairness metric.
6. Discussion
6.1. Connection to Impossibility Results
Our findings establish an analogous impossibility result for conformal prediction, parallel to Kleinberg et al. [20]. They proved that calibration and equal error rates cannot be simultaneously achieved when base rates differ:
We demonstrate an analogous result for threshold-based conformal prediction:
Proof Sketch. The argument proceeds in three steps: (1) Coverage parity requires group-specific thresholds to equalize coverage rates. (2) For groups with lower base rates or harder classification, maintaining coverage requires higher (looser) thresholds, which produce larger prediction sets. (3) Larger sets increase , directly causing deferral disparity. Thus, coverage parity ⇒ deferral disparity, and vice versa. The full proof appears in Supplementary Material S4 (Theorem 1).
The analogy to Kleinberg et al. is direct: Mondrian CP targets coverage parity via group-conditional validity (analogous to calibration, where predictions mean the same thing across groups), but this necessitates different thresholds per group, leading to different set sizes and hence different deferral rates (analogous to unequal error rates). Empirically, we validate assumption (A7) by computing the cross-group density ratio across all datasets (Table 15), finding with mean , confirming comparable classifier uncertainty across groups and supporting the theoretical trade-off.
6.2. Why Standard EO Metrics Fail
The invariance of EO metrics to CP method has important implications:
- 1.
- Metric selection matters. Researchers evaluating CP fairness must use CP-specific metrics (coverage gap, deferral gap, set size gap), not standard EO metrics.
- 2.
- CP affects different decisions. Point predictions determine what decision is made; prediction sets determine who makes the decision (model vs. human). These are distinct fairness concerns.
- 3.
- Deferral is consequential. In HITL systems, being deferred to human review has real costs: delays, resource consumption, and potentially different treatment. Deferral disparities are fairness concerns even if final decisions are equalized.
6.3. Is Deferral Disparity Harmful?
Whether deferral disparity constitutes unfairness depends on context. Two perspectives emerge:
Deferral as Protection. In high-stakes decisions (criminal justice, healthcare), additional human review may protect individuals from algorithmic errors. If group A has higher deferral rates, group A receives more scrutiny, potentially beneficial if it reduces false positives/negatives. Under this view, equalizing deferral might reduce protection for some groups.
Deferral as Burden. Alternatively, deferral imposes costs: delays, additional documentation requirements, and subjection to potentially biased human judgment. Higher deferral rates for group A mean group A faces more friction, longer wait times, and greater exposure to human discretion. This is the disparate impact concern raised by Cresswell et al. [8].
Critical Moderators. Two downstream factors critically determine whether deferral disparity translates to outcome disparity: (i) human review quality: if human reviewers exhibit group-dependent accuracy (), Mondrian’s higher deferral rate for one group can amplify rather than mitigate final accuracy disparity (Section S7.10); and (ii) capacity constraints: when review capacity is limited, higher deferral rates translate to longer queues, converting routing disparity into waiting-time disparity (Section S7.11). These interactions underscore that deferral parity alone is insufficient for fairness. Practitioners must consider the full human-AI pipeline.
Concrete Examples: Even when final decisions are equalized, deferral disparity creates tangible harms:
- Credit scoring: Deferred applicants face processing delays (days to weeks), missing time-sensitive opportunities like promotional interest rates.
- Healthcare triage: Higher deferral rates mean longer waits for specialist review, potentially delaying treatment for one demographic group.
- Employment: Deferred candidates may be deprioritized in fast-moving hiring pipelines, receiving offers after positions are filled.
Thus, deferral disparity is an operational fairness concern distinct from outcome fairness.
Group-Dependent Human Accuracy. Our main results assume uniform human accuracy (). In practice, reviewers may have differential accuracy across groups due to familiarity, implicit biases, or domain expertise. Table 22 in Supplementary Material shows that when varies, Mondrian’s deferral disparity can amplify outcome disparities by up to 2.2×. Groups with higher deferral rates are exposed to more human decisions, and if human accuracy is lower for that group, final accuracy gaps increase. This finding reinforces deferral disparity as a first-class fairness concern.
Implication. Our results are normatively neutral: we characterize the trade-off structure, not which criterion is “correct.” Practitioners must decide whether their application treats deferral as protective (favoring deferral parity is less important) or burdensome (favoring deferral parity), and choose accordingly.
6.4. Practical Implications
Based on our findings, we recommend:
- For coverage parity: Use Mondrian CP (). Accept increased deferral disparity.
- For deferral fairness: Use global CP (). Accept coverage disparities.
- For balanced objectives: Use shrinkage with . This provides a compromise, though neither criterion is fully satisfied.
- For deployment: Explicitly state which fairness criterion is being optimized and acknowledge the trade-off.
Heuristic Recommendation. Our suggested range is a rule-of-thumb for practitioners without strong prior preferences between coverage and deferral fairness. Note: for , formal finite-sample coverage guarantees do not hold, though empirical coverage remains valid (Section 3.3). Formally, one could define a Pareto frontier over the (coverage gap, deferral gap) space and select by minimizing a weighted objective:
where reflects the relative importance of coverage vs. deferral fairness. Our empirically recommended range corresponds approximately to , values where neither objective dominates. Practitioners with explicit cost functions (e.g., deferral costs 3× as much as coverage disparity) can optimize for their specific .
6.5. Limitations
Measurement Validity. We use binarized sensitive attributes (e.g., sex, age threshold), which may obscure within-group heterogeneity. Intersectional effects (multiple simultaneous protected attributes) compound these trade-offs: our supplementary analysis (Section S7.6) shows that intersectional groups (e.g., Sex × Race) experience 10-29% higher deferral disparity than single-attribute groups. This matters because single-attribute audits systematically underestimate harm to multiply-disadvantaged individuals, who may face compounding routing burdens invisible to standard fairness evaluations. Continuous or multi-valued sensitive attributes may exhibit different dynamics. Additionally, our fairness metrics focus on statistical parity; individual-level fairness concerns are not addressed.
External Validity. Our experiments use standard fairness benchmarks (Adult, COMPAS, German Credit, etc.) with simulated human review. Real deployments may differ: human accuracy varies by group and case difficulty, review capacity is constrained, and institutional factors affect deferral decisions. The invariance results (Section 5.4) hold structurally, but magnitudes may vary in practice. In particular, our HITL simulation assumes group-invariant human accuracy h; if human reviewers exhibit group-dependent accuracy (e.g., ), final output fairness would depend on both CP method choice and human bias patterns. Our supplementary analysis (Table 22) shows that when and , Mondrian’s higher deferral rate for Group 0 can amplify accuracy disparity by up to 2.2×, underscoring the importance of considering human reviewer characteristics in HITL deployment.
Deferral Definition. We define deferral as  , treating only multi-label sets as uncertain. An alternative definition
  would also defer empty sets. In our experiments, empty sets are rare ( across methods with ), so this choice has minimal impact. For aggressive coverage levels (), empty sets become more common and the deferral definition choice matters more.
, treating only multi-label sets as uncertain. An alternative definition would also defer empty sets. In our experiments, empty sets are rare ( across methods with ), so this choice has minimal impact. For aggressive coverage levels (), empty sets become more common and the deferral definition choice matters more.
Small Sample Sizes. German Credit has only test samples, making Mondrian quantile estimates noisy when group calibration sets are small (). While our 100-seed bootstrap provides robust aggregate estimates, practitioners should exercise caution applying Mondrian CP to small datasets. We recommend calibration samples per group for stable threshold estimation. For datasets with smaller calibration sets (), practitioners may consider: (i) pooled calibration using group-weighted quantiles, (ii) cross-conformal methods that reuse training data for calibration [4], or (iii) smoothed quantile estimation using kernel methods. These approaches trade exact finite-sample coverage validity for reduced variance in threshold estimation. Systematic comparison of small-sample CP approaches is left for future work.
Method Scope. We focus on APS-based conformal prediction with threshold-based set construction. Other CP scores (e.g., RAPS, confidence-based) may exhibit different trade-off characteristics. Our trade-off result (Theorem 1) applies to threshold-based methods with monotone scores; alternative CP constructions remain unexplored. For intermediate shrinkage values (), formal coverage guarantees do not hold, though empirical coverage remains valid (Section 3.3).
Test-Time Sensitive Attribute Requirement. Mondrian CP requires access to the sensitive attribute G at test time for group-conditional threshold selection. When G is unavailable, legally restricted (e.g., under the EU AI Act or ECOA in credit), or ethically contested, we recommend defaulting to Global CP () as the conservative choice for deferral fairness. For settings where group-conditional coverage is still desired despite attribute constraints, practitioners have several options: (i) proxy-based grouping using demographic proxies such as Bayesian Improved Surname Geocoding (BISG) [12] (with associated fairness risks from proxy discrimination), (ii) distributionally robust CP methods such as conformal prediction beyond exchangeability [5] that provide worst-case coverage guarantees without explicit group labels, or (iii) hybrid strategies that use G only during calibration. We note that intersectional fairness (multiple attributes) further complicates this, as calibration set sizes shrink rapidly with the number of intersecting groups.
Capacity Constraints. Our analysis assumes unbounded human review capacity. In practice, human review is capacity-constrained, and higher deferral rates translate to longer queues. Our supplementary simulation (Section S7.11) models a fixed-budget scenario: when deferred cases exceed review capacity, cases are selected uniformly at random (no priority queue); unreviewed cases receive a default reject decision. This simulation shows that at 10% review capacity, accuracy disparity increases by 40% for Global and 37% for Mondrian compared to unconstrained review, validating the operational importance of deferral fairness beyond routing alone. Future work could model group-conditional waiting times under budgeted deferral policies, where deferral disparity directly impacts service-level fairness (e.g., one group systematically waiting longer for decisions).
Multi-Class Extension. Our deferral rule  is natural for binary classification. For multi-class settings (), our framework naturally extends to for practitioner-specified budget k. We recommend: (i) setting as a default to defer predictions with more than two plausible classes, (ii) using entropy-based thresholds for soft deferral decisions when class probabilities are available, or (iii) calibrating k to achieve a target deferral rate on held-out data. The theoretical trade-off (Theorem 1) extends directly: Mondrian’s group-specific thresholds will still induce differential deferral rates across groups, though the magnitude may vary with .
is natural for binary classification. For multi-class settings (), our framework naturally extends to for practitioner-specified budget k. We recommend: (i) setting as a default to defer predictions with more than two plausible classes, (ii) using entropy-based thresholds for soft deferral decisions when class probabilities are available, or (iii) calibrating k to achieve a target deferral rate on held-out data. The theoretical trade-off (Theorem 1) extends directly: Mondrian’s group-specific thresholds will still induce differential deferral rates across groups, though the magnitude may vary with .7. Conclusion
We have demonstrated a fundamental coverage-deferral trade-off in conformal prediction for human-in-the-loop systems. Mondrian CP, designed to target coverage parity via group-conditional validity, increases deferral disparity by 143% compared to global CP. This trade-off is:
- Statistically robust: Significant at p < 0.001 across 100 seeds
- Cross-dataset consistent: Present in all 6 benchmark datasets
- Structurally inherent: Invariant to HITL parameters
- Monotonic: No optimal shrinkage parameter exists
In practical HITL deployments, this result implies that conformal prediction is not only an uncertainty quantification layer but also an implicit routing policy that determines which individuals receive human review. As a consequence, fairness evaluations of CP-based systems must explicitly report CP-specific fairness metrics such as coverage gap, deferral gap, and set-size gap; standard EO-style metrics can remain unchanged even when routing disparity changes substantially. Our experiments show that enforcing group-conditional calibration via Mondrian CP can meaningfully reduce coverage disparity, but typically increases deferral disparity, revealing an inherent design trade-off. Accordingly, practitioners should treat the choice of CP method (or ) as a normative decision: optimize for coverage parity, deferral parity, or an explicit compromise, and document this choice together with its operational consequences.
Our work proves an analogous impossibility result for conformal prediction: coverage parity and deferral parity cannot be simultaneously achieved when base rates differ. We establish deferral gap as the appropriate fairness metric for CP in HITL systems, showing that standard EO metrics are invariant to CP method choice.
Future work should explore: (1) multi-class extensions, (2) alternative CP scores (RAPS, LAC), (3) real human-subject experiments validating our findings, and (4) optimization approaches that explicitly balance coverage and deferral objectives.
Supplementary Materials
The following supporting information can be downloaded at the website of this paper posted on Preprints.org.
References
- Anastasios N. Angelopoulos, Stephen Bates, Jitendra Malik, and Michael I. Jordan. Uncertainty sets for image classifiers using conformal prediction. In International Conference on Learning Representations (ICLR), 2021. RAPS: Regularized Adaptive Prediction Sets.
- Julia Angwin, Jeff Larson, Surya Mattu, and Lauren Kirchner. Machine bias: There’s software used across the country to predict future criminals. and it’s biased against blacks. ProPublica, 2016. COMPAS recidivism data; foundational fairness dataset. Available online: https://www.propublica.org/article/machine-bias-risk-assessments-in-criminal-sentencing.
- Gagan Bansal, Tongshuang Wu, Joyce Zhou, Raymond Fok, Besmira Nushi, Ece Kamar, Marco Tulio Ribeiro, and Daniel S. Weld. Does the whole exceed its parts? the effect of ai explanations on complementary team performance. In CHI Conference on Human Factors in Computing Systems, 2021. Most accurate AI not always best teammate; optimize for human-AI team. [CrossRef]
- Rina Foygel Barber, Emmanuel J. Candès, Aaditya Ramdas, and Ryan J. Tibshirani. Predictive inference with the jackknife+. Annals of Statistics, 49(1):486–507, 2021. Jackknife+ and cross-conformal methods for reusing training data. [CrossRef]
- Rina Foygel Barber, Emmanuel J. Candès, Aaditya Ramdas, and Ryan J. Tibshirani. Conformal prediction beyond exchangeability. Annals of Statistics, 51(2):816–845, 2023. Handles non-i.i.d. data in conformal prediction. [CrossRef]
- Alexandra Chouldechova. Fair prediction with disparate impact: A study of bias in recidivism prediction instruments. Big Data, 5(2):153–163, 2017. Proves impossibility of calibration + equal error rates; COMPAS analysis. [CrossRef]
- Chi-Keung Chow. On optimum recognition error and reject tradeoff. IEEE Transactions on Information Theory, 16(1):41–46, 1970. Foundational: optimal reject rule for classification. [CrossRef]
- Jesse C. Cresswell, Yi Sui, Bhargava Kumar, and Noël Vouitsis. Conformal prediction sets can cause disparate impact. arXiv preprint arXiv:2410.01888, 2025.
- Dominik Dellermann, Philipp Ebel, Matthias Söllner, and Jan Marco Leimeister. Hybrid intelligence. In Business & Information Systems Engineering, volume 61, pages 637–643, 2019. Taxonomy for human-AI collaboration. [CrossRef]
- Frances Ding, Moritz Hardt, John Miller, and Ludwig Schmidt. Retiring adult: New datasets for fair machine learning. In Advances in Neural Information Processing Systems (NeurIPS) Datasets and Benchmarks Track, 2021. Folktables: ACS-based replacement for UCI Adult.
- Cynthia Dwork, Moritz Hardt, Toniann Pitassi, Omer Reingold, and Richard Zemel. Fairness through awareness. In Proceedings of the 3rd Innovations in Theoretical Computer Science Conference (ITCS), pages 214–226, 2012. Individual fairness via Lipschitz condition. [CrossRef]
- Marc N. Elliott, Allen Fremont, Peter A. Morrison, Philip Pantoja, and Nicole Lurie. Using the census bureau’s surname and geocoding lists to improve estimates of race/ethnicity and associated disparities. Health Services and Outcomes Research Methodology, 9(2):69–83, 2009. BISG: Bayesian Improved Surname Geocoding for race/ethnicity proxy estimation. [CrossRef]
- Michael Feldman, Sorelle A. Friedler, John Moeller, Carlos Scheidegger, and Suresh Venkatasubramanian. Certifying and removing disparate impact. In Proceedings of the 21th ACM SIGKDD International Conference on Knowledge Discovery and Data Mining, pages 259–268, 2015. Disparate impact 80% rule; data repair method. [CrossRef]
- Yonatan Geifman and Ran El-Yaniv. Selective classification for deep neural networks. In Advances in Neural Information Processing Systems (NeurIPS), volume 30, 2017. SelectiveNet: abstain on uncertain cases.
- Isaac Gibbs and Emmanuel Candès. Adaptive conformal inference under distribution shift. In Advances in Neural Information Processing Systems (NeurIPS), volume 34, 2021. Weighted conformal for distribution shift.
- Ben Green and Yiling Chen. Algorithmic risk assessments can alter human decision-making processes in high-stakes government contexts. In Proceedings of the ACM on Human-Computer Interaction (CSCW), volume 5, 2019. Risk scores change human decisions; can increase disparate impact. [CrossRef]
- Moritz Hardt, Eric Price, and Nati Srebro. Equality of opportunity in supervised learning. In Advances in Neural Information Processing Systems (NeurIPS/NIPS), pages 3315–3323, 2016. Introduced Equalized Odds and Equal Opportunity.
- Hans Hofmann. Statlog (german credit data) data set. UCI Machine Learning Repository, 1994. 1,000 loan applicants; credit risk prediction. Available online: https://archive.ics.uci.edu/dataset/144/statlog+german+credit+data.
- Jiaye Huang, Huazhen Xi, Linjun Zhang, and Rina Foygel Barber. Conformal prediction with learned features. Journal of Machine Learning Research, 25:1–45, 2024. SAPS: Sorted Adaptive Prediction Sets.
- Jon Kleinberg, Sendhil Mullainathan, and Manish Raghavan. Inherent trade-offs in the fair determination of risk scores. In 8th Innovations in Theoretical Computer Science Conference (ITCS), 2017. [CrossRef]
- Ronny Kohavi and Barry Becker. Adult data set. UCI Machine Learning Repository, 1996. Census income prediction; 48,842 instances. Available online: https://archive.ics.uci.edu/dataset/2/adult.
- Nikita Kozodoi, Johannes Jacob, and Stefan Lessmann. Fairness in credit scoring: Assessment, implementation and profit implications. European Journal of Operational Research, 297(3):1083–1094, 2022. Fairness-profit trade-off in credit scoring. [CrossRef]
- Jing Lei and Larry Wasserman. Distribution-free predictive inference for regression. Journal of the American Statistical Association, 109(507):1094–1114, 2014. Proved exact conditional coverage impossible distribution-free. [CrossRef]
- Stefan Lessmann, Bart Baesens, Hsin-Vonn Seow, and Lyn C. Thomas. Benchmarking state-of-the-art classification algorithms for credit scoring: An update of research. European Journal of Operational Research, 247(1):124–136, 2015. Benchmarking 41 algorithms on 8 credit datasets. [CrossRef]
- David Madras, Toniann Pitassi, and Richard Zemel. Predict responsibly: Improving fairness and accuracy by learning to defer. In Advances in Neural Information Processing Systems (NeurIPS), volume 31, pages 6147–6157, 2018. Learning to defer framework; fairness through abstention.
- Shira Mitchell, Eric Potash, Solon Barocas, Alexander D’Amour, and Kristian Lum. Algorithmic fairness: Choices, assumptions, and definitions. Annual Review of Statistics and Its Application, 8:141–163, 2021. Statistical perspective on fairness definitions. [CrossRef]
- Sérgio Moro, Paulo Cortez, and Paulo Rita. A data-driven approach to predict the success of bank telemarketing. Decision Support Systems, 62:22–31, 2014. Bank marketing dataset; 45,211 records. [CrossRef]
- Hussein Mozannar and David Sontag. Consistent estimators for learning to defer to an expert. arXiv preprint arXiv:2006.01862, 2020. First consistency guarantee for learning-to-defer.
- Ziad Obermeyer, Brian Powers, Christine Vogeli, and Sendhil Mullainathan. Dissecting racial bias in an algorithm used to manage the health of populations. Science, 366(6464):447–453, 2019. Racial bias in healthcare algorithm. [CrossRef]
- Harris Papadopoulos. Inductive conformal prediction: Theory and application to neural networks. Tools in Artificial Intelligence, pages 315–330, 2008. ICP theory and neural network applications. ICP theory and neural network applications.
- Harris Papadopoulos, Kostas Proedrou, Vladimir Vovk, and Alexander Gammerman. Inductive confidence machines for regression. In European Conference on Machine Learning (ECML), pages 345–356, 2002. Introduced inductive/split conformal prediction. [CrossRef]
- Yaniv Romano, Matteo Sesia, and Emmanuel J. Candès. Classification with valid and adaptive coverage. In Advances in Neural Information Processing Systems (NeurIPS), volume 33, 2020. Adaptive conformal prediction for classification (APS).
- Mauricio Sadinle, Jing Lei, and Larry Wasserman. Least ambiguous set-valued classifiers with bounded error levels. In Journal of the American Statistical Association, volume 114, pages 223–234, 2019. LAC: Minimize set size at target coverage. [CrossRef]
- David W. Scott. Multivariate Density Estimation: Theory, Practice, and Visualization. John Wiley & Sons, 1992. Foundational text for kernel density estimation, Scott’s rule. [CrossRef]
- Sahil Verma and Julia Rubin. Fairness definitions explained. In Proceedings of the ACM/IEEE International Workshop on Software Fairness (FairWare), pages 1–7, 2018. Comprehensive taxonomy of 20+ fairness definitions. [CrossRef]
- Vladimir Vovk, Ilia Nouretdinov, and Alexander Gammerman. Mondrian confidence machine. In Technical Report, 2003. Introduced group-conditional conformal prediction.
- Vladimir Vovk, Alexander Gammerman, and Glenn Shafer. Algorithmic Learning in a Random World. Springer, 2005. Foundational text introducing conformal prediction framework. [CrossRef]
- I-Cheng Yeh and Che-hui Lien. The comparisons of data mining techniques for the predictive accuracy of probability of default of credit card clients. Expert Systems with Applications, 36(2):2473–2480, 2009. Taiwan credit card default; 30,000 clients. [CrossRef]
Figure 1.
The Coverage-Deferral Trade-off Atlas. (a) Grouped bar chart showing Mondrian consistently increases deferral gap across all datasets, with ratio annotations. (b) Gamma sweep demonstrating the monotonic trade-off between coverage gap and deferral gap. (c) Bubble chart showing trade-off severity by dataset characteristics (bubble size indicates absolute delta). (d) Dataset summary table with severity classification. (e) Violin plots showing statistical robustness across 100 seeds (p < 0.001). (f) Mechanism illustration showing how coverage parity leads to deferral disparity.
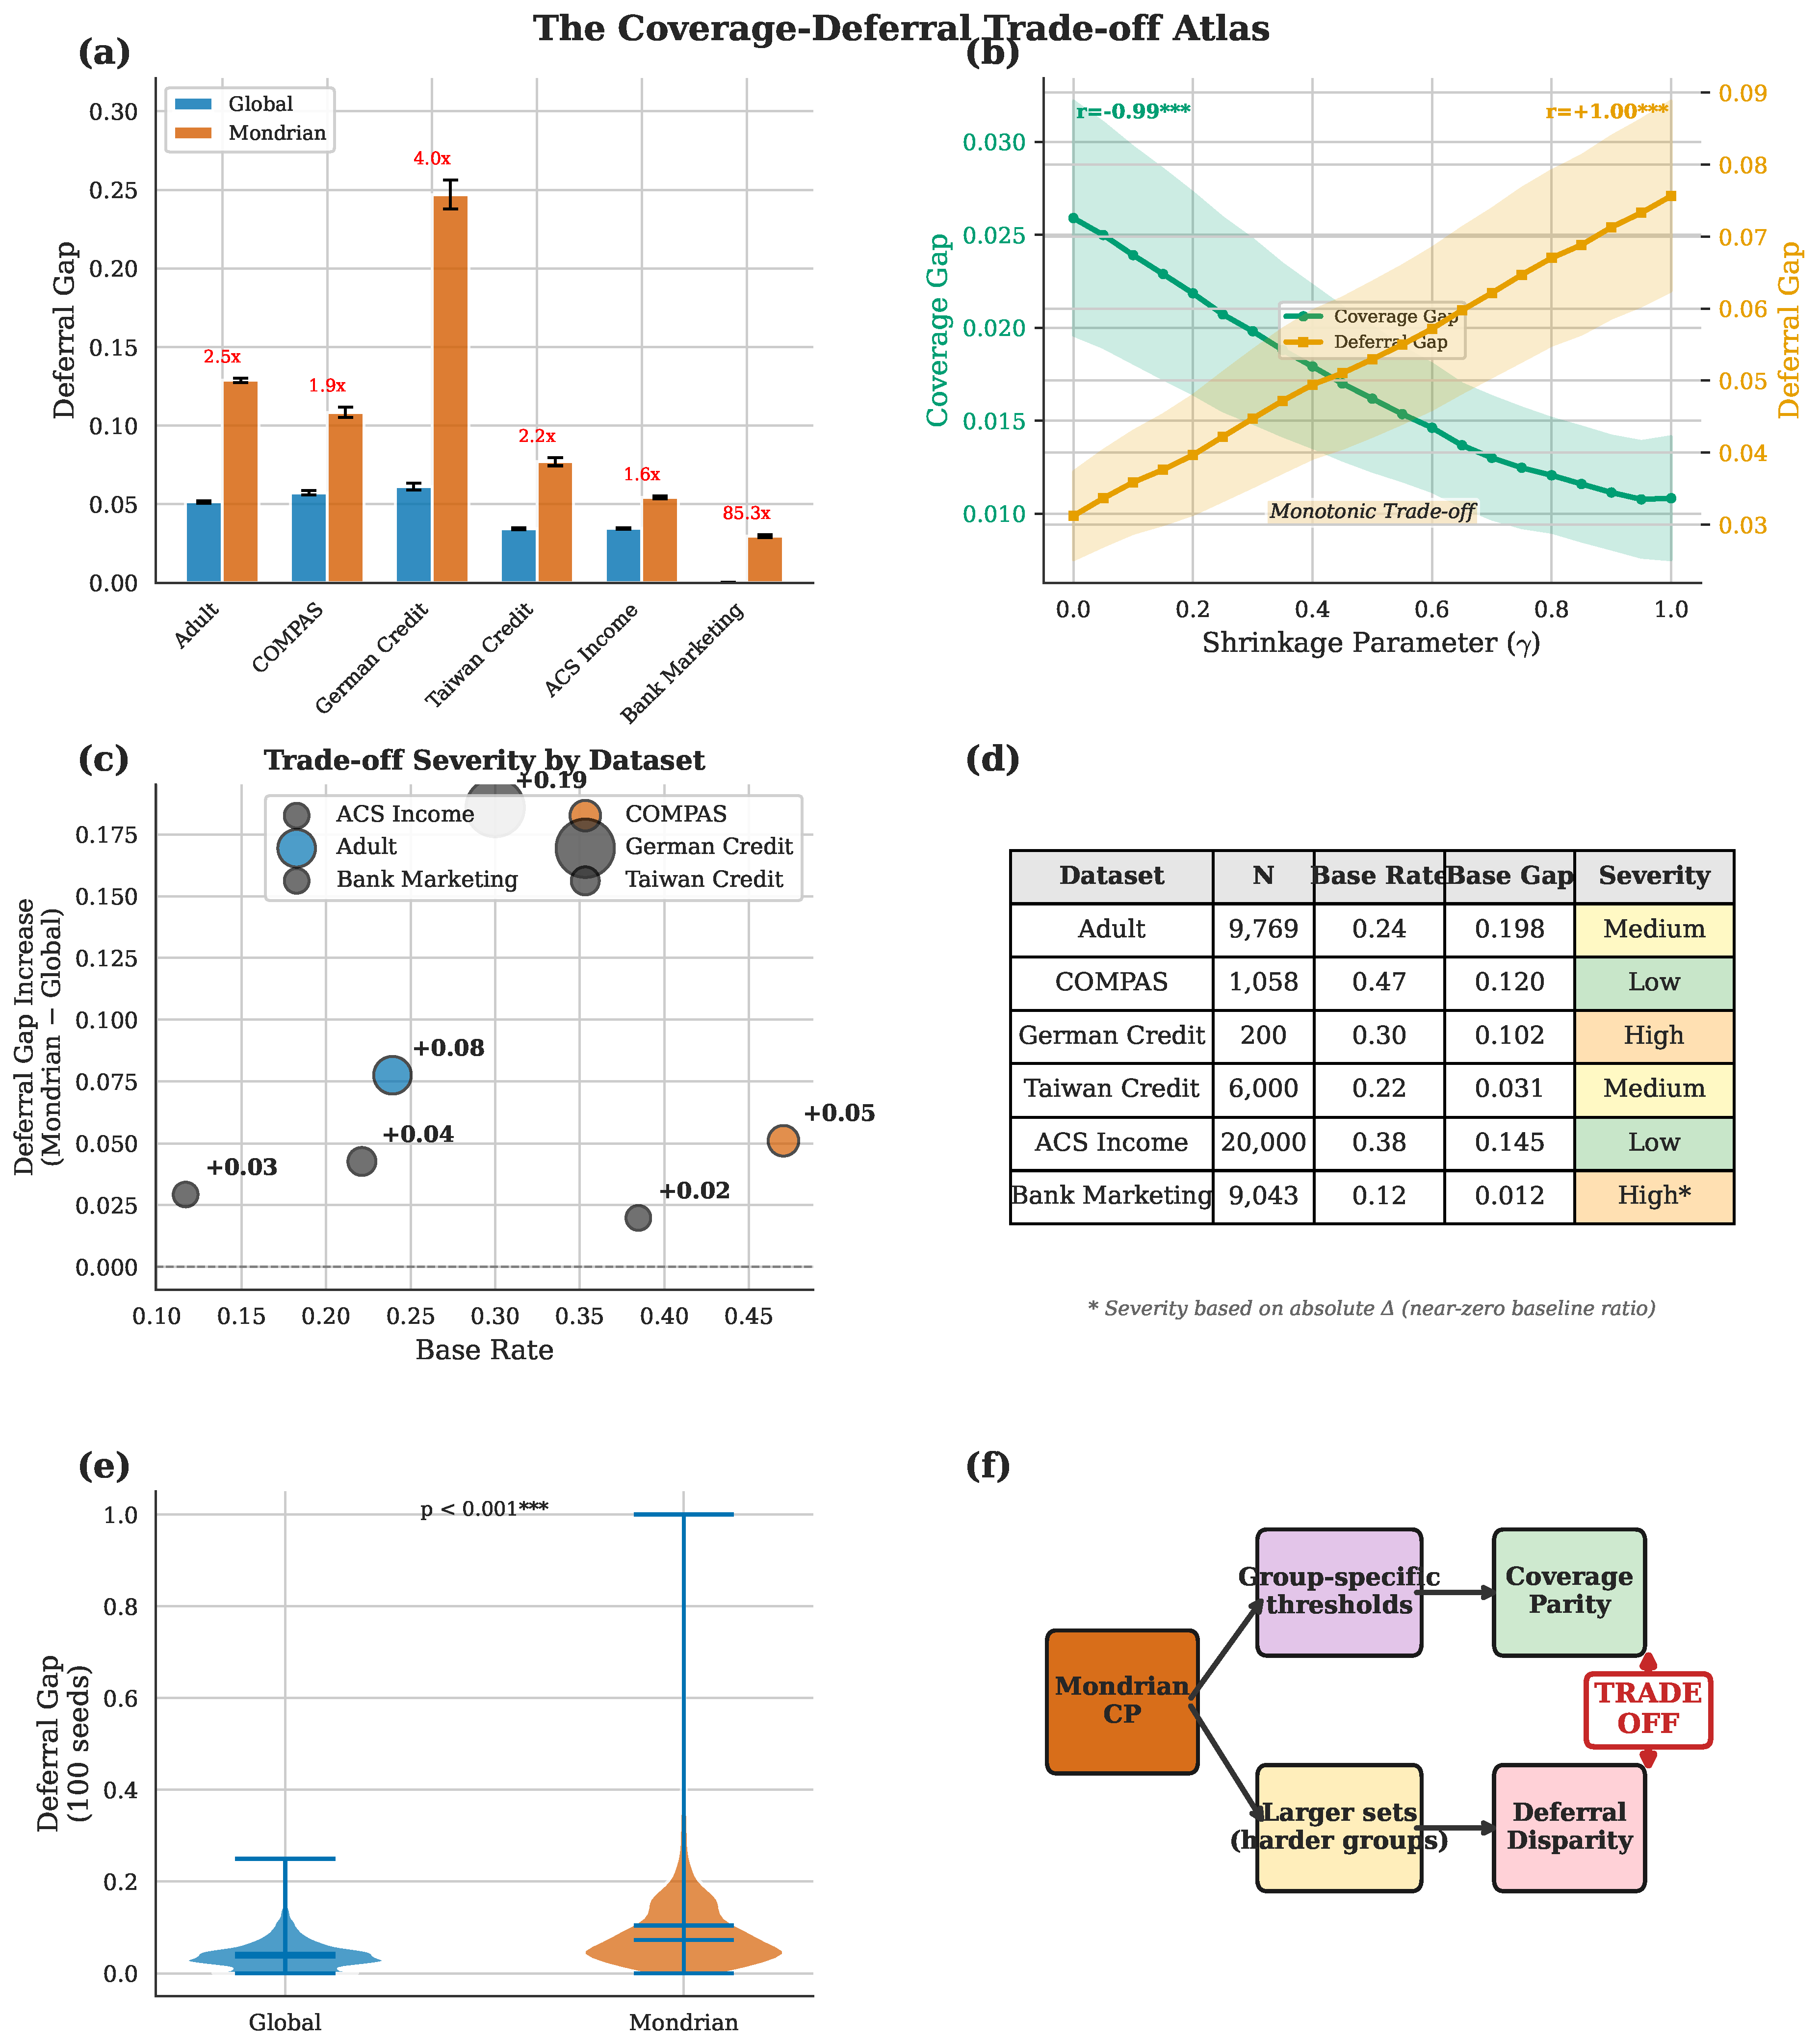
Figure 2.
The coverage-deferral trade-off across shrinkage parameter . (a) Coverage gap vs. : decreasing trend as moves from Global () toward Mondrian (), with dataset-specific variation. (b) Deferral gap vs. : consistently increasing across all datasets. (c) Scatter plot of coverage gap against deferral gap with as color scale, showing no optimal exists: reducing one metric increases the other.
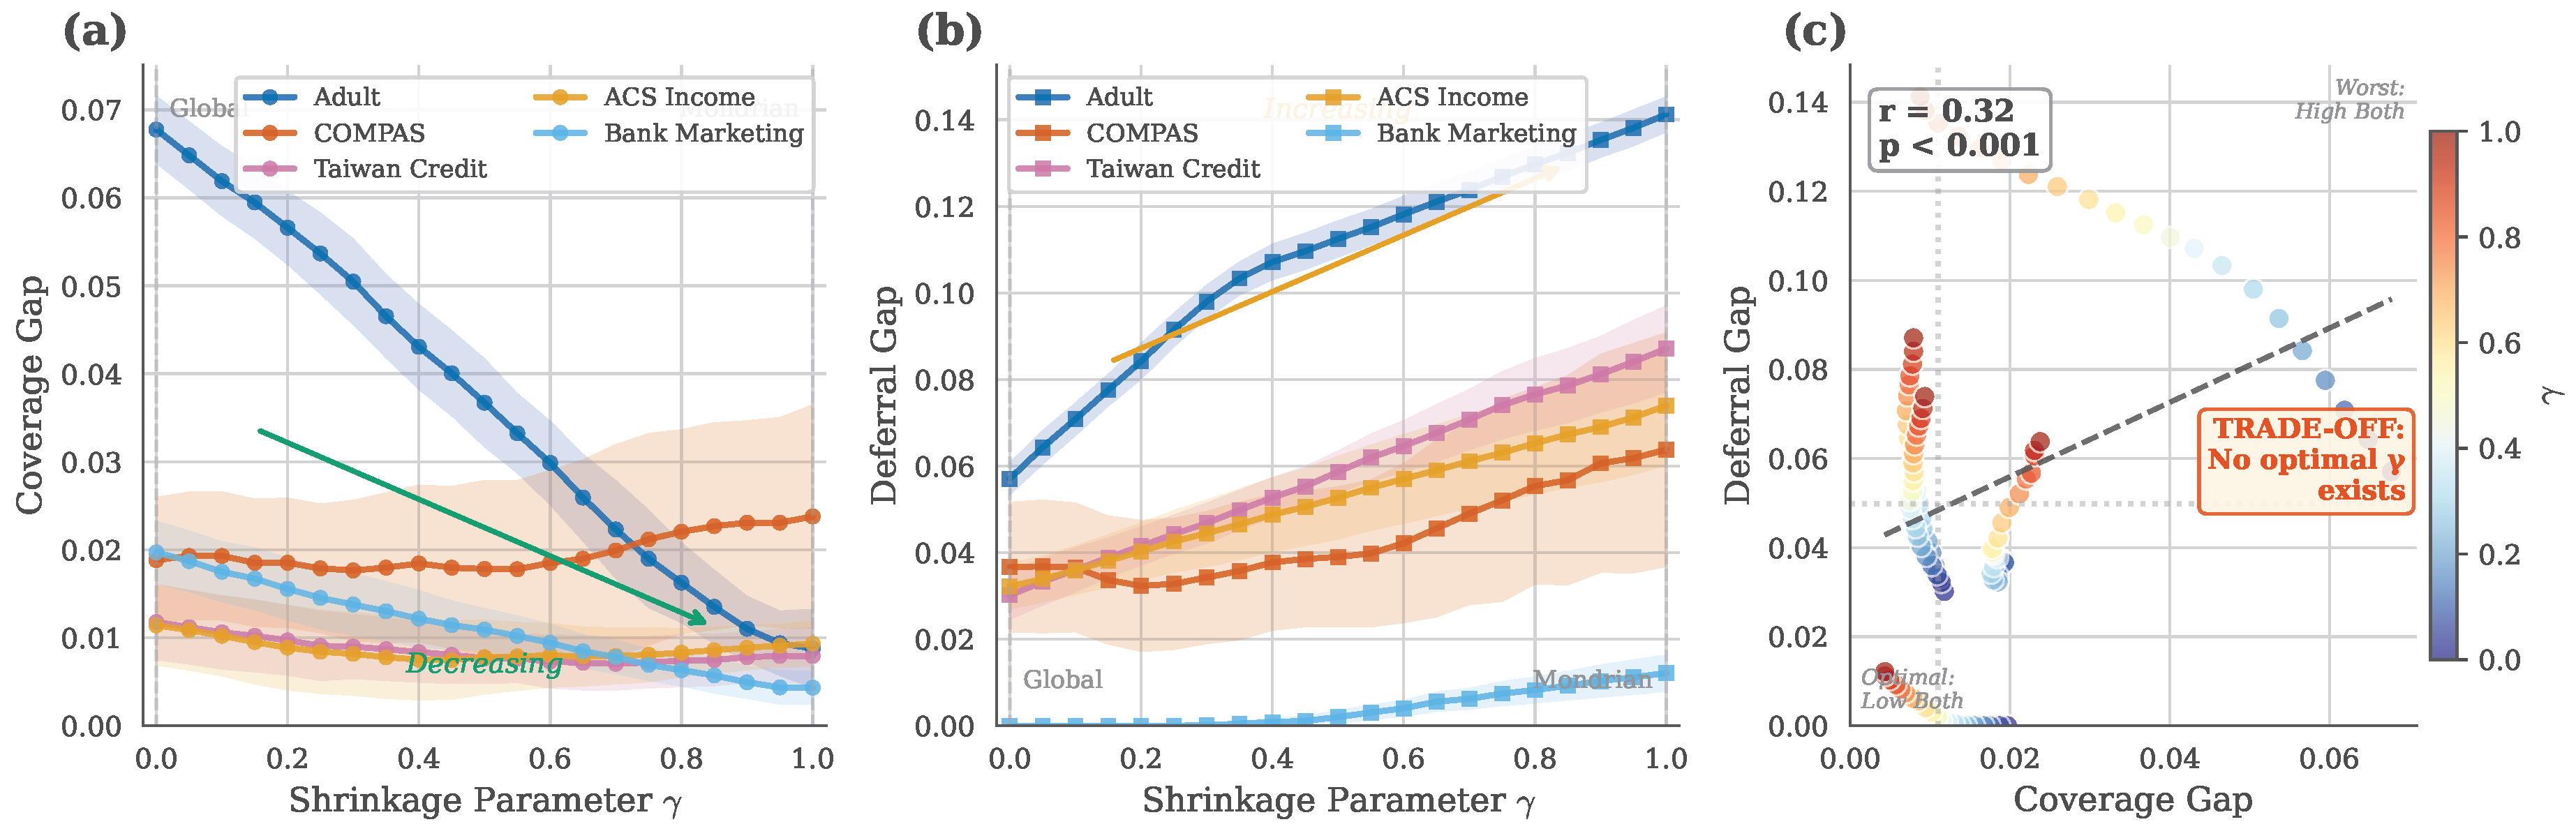
Table 2.
Standard fairness metrics are invariant to CP method (, 100 seeds).
| Metric | Global | Mondrian | Shrinkage | Difference |
|---|---|---|---|---|
| EOD (TPR diff) | -0.078 ± 0.001 | -0.078 ± 0.001 | -0.078 ± 0.001 | 0.00% |
| AOD (Avg Odds) | -0.067 ± 0.001 | -0.067 ± 0.001 | -0.067 ± 0.001 | 0.00% |
| FPR gap | 0.060 ± 0.001 | 0.060 ± 0.001 | 0.060 ± 0.001 | 0.00% |
| FNR gap | 0.091 ± 0.001 | 0.091 ± 0.001 | 0.091 ± 0.001 | 0.00% |
Table 3.
Final HITL output fairness is approximately invariant to CP method (, , 100 seeds, aggregated across datasets).
Table 3.
Final HITL output fairness is approximately invariant to CP method (, , 100 seeds, aggregated across datasets).
| Metric | Global | Mondrian | Shrinkage | Max Diff |
|---|---|---|---|---|
| FPR gap () | 0.025 ± 0.019 | 0.025 ± 0.019 | 0.025 ± 0.019 | <0.01 |
| FNR gap () | 0.055 ± 0.040 | 0.073 ± 0.062 | 0.064 ± 0.052 | 0.02 |
| Deferral gap | 0.050 ± 0.041 | 0.090 ± 0.070 | 0.065 ± 0.056 | 0.04 |
Table 5.
Trade-off ratio is invariant to HITL parameters (human accuracy = 0.90).
| Review Rate | Global Def. Gap | Mondrian Def. Gap | Ratio |
|---|---|---|---|
| 0.00 | 0.049 | 0.116 | 2.36x |
| 0.25 | 0.049 | 0.116 | 2.36x |
| 0.50 | 0.049 | 0.116 | 2.36x |
| 0.75 | 0.049 | 0.116 | 2.36x |
| 1.00 | 0.049 | 0.116 | 2.36x |
Disclaimer/Publisher’s Note: The statements, opinions and data contained in all publications are solely those of the individual author(s) and contributor(s) and not of MDPI and/or the editor(s). MDPI and/or the editor(s) disclaim responsibility for any injury to people or property resulting from any ideas, methods, instructions or products referred to in the content. |
© 2025 by the authors. Licensee MDPI, Basel, Switzerland. This article is an open access article distributed under the terms and conditions of the Creative Commons Attribution (CC BY) license (http://creativecommons.org/licenses/by/4.0/).
Copyright: This open access article is published under a Creative Commons CC BY 4.0 license, which permit the free download, distribution, and reuse, provided that the author and preprint are cited in any reuse.


