
Submitted:
27 December 2025
Posted:
29 December 2025
You are already at the latest version
Abstract
Effective mitigation of urban flash floods under extreme rainfalls requires integrated hydrologic monitoring and rapid-response mechanisms. The study presents an adaptive flood response framework. It combines real-time rainfall forecasting, CCTV-based flood image classification, drainage network water level monitoring, pumping machinery operations, and automated response controls. The adaptive strategy is structured into three phases to support real-time decision-making: (1) atmospheric sensing and pre-alert actions, (2) subsurface drainage system monitoring and alert activation, and (3) surface run-off detection and response. During a three-year implementation period, the approaches successfully resolved of inundation events after severe rainfall subsides. By integrating ensemble modeling, remote sensing, and decision-support tools, the platform transforms climate-induced flood risks into opportunities for resilience.
Keywords:
pluvial flood forecasting
; adaptive decision making
; service oriented architecture (soa)
; artificial intelligence (ai)
; internet of things (iot)
; cnn (convolutional neural network) models
; drainage networks
; pumping machinery management
1. Introduction
Urban flood-related losses have escalated significantly in recent years, primarily due to extreme rainfall events, insufficient drainage infrastructure, and rapid urbanization [1,2,3]. Climate change has intensified the frequency and severity of extreme weather, with torrential rainfalls increasingly becoming the norm in urban areas [4]. In many regions, existing drainage standards and system capacities are inadequate to cope with such events, rendering urban flooding an unavoidable risk. Consequently, the design and optimization of urban drainage infrastructure that incorporates climate change adaptation has become critical for sustaining livable cities [5]. However, incremental upgrades to legacy systems are no longer sufficient to meet the urgency of these challenges.
To address this need, an interactive, web-based, multi-stage flood informatics plat-form has been developed and deployed in New Taipei City. The system leverages Ser-vice Oriented Architecture (SOA), the Internet of Things (IoT), Artificial Intelligence (AI), and Edge Computing [6], interconnected via Internet and 4G/5G networks. It integrates heterogeneous hazard data sources, machine learning models, and tools for real-time data processing, forecasting, and visualization [7,8,9,10,11].
This research emphasizes the importance of resilient urban planning and the integration of green infrastructure as part of climate adaptation strategies [12]. It also explores the application of advanced technologies—including AI algorithms, remote sensing, im-age-based flood classification, and predictive modeling of drainage pipe flow depths—to enhance flood forecasting, monitoring, and response capabilities [4]. Field responses have included real-time traffic control and mobile pump deployment by flood management personnel.
The study implements an ensemble of technical solutions: (1) machine learning based flood image classification using CCTV feeds [13]; (2) a real-time, multi-layered autonomous pumping control and management system [14,15,16], and (3) SOBEK-based hydraulic modeling [17] for predicting drainage pipe flow depths and identifying potential flash flood events in New Taipei City. The overall architecture of the study is presented in Figure 1. The adaptive approaches and deployed techniques are detailed in the subsequent sections.
2. Methodologies and Implementations
As indicated previously, the study aims to investigate potential methodologies, i.e., flooding image classification remotely to mitigate effects of extreme rainfalls and their influences on the drainage infrastructure in New Taipei City in real-time [18].
2.1. Flooding Image Classification Approach
The Convolutional Neural Network (CNN) is one of the most powerful and widely used deep learning architectures, known for its ability to automatically and accurately classify images. This study focuses on leveraging CNN models to classify CCTV images, specifically aiming to detect urban flash floods. By analyzing the features within an image, the CNN models determine whether flooding has occurred [19,20,21,22,23,24,25,26,27].
The study has been carried out by aggregating CCTV videos from the Department of Transportation, New Taipei City and later converted them into individual images by the members of the DPWE (Disaster Prevention and Water Environment) Research Center, National Yang-Ming Chiao-Tung University. The image classifiers rely on pre-trained Convolutional Neural Networks with specified backbones including VGG19, Resnet-101V2, InceptionV3, and InceptionResnetV2 respectively adapting hyperparameters accordingly as indicated in Figure 2 [28,29,30,31].
2.1.1. Computer Platform and Environment Configuration
In this experiment, CNN training was performed on the software and hardware platforms detailed in Table 1. The system configuration includes specifications for the operating system, processor, memory, and programming environment used during the experiment.
The CNN model training process involves several key steps. It begins with dataset preparation, followed by the selection of suitable backbone architectures for image classification. Hyperparameters are then fine-tuned to optimize performance. Lastly, the results are analyzed, emphasizing important metrics such as accuracy and generalization [32,33].
2.1.2. Datasets Preparation
The first and essential step in the CNN training process is dataset preparation, which involves gathering a comprehensive collection of images with corresponding labels. As introduced previously, the experiment utilized a dataset of 15,662 images derived from the Department of Transportation CCTV videos. Members of the Research Center preprocessed these videos into individual labeled images. During data preprocessing, outliers or anomalies in CCTV images are manually detected and removed. This process identifies image regions that deviate from expected patterns or predefined classes [34].
The dataset was designed to capture a diverse range of environmental and lighting conditions relevant to flash floods detection, comprising six distinct image categories:
- Dry day: 3,411 images
- Dry night: 3,436 images
- Wet day: 3,251 images
- Wet night: 3,535 images
- Flood day: 1,482 images
- Flood night: 547 images
This diversity enables the CNN to learn robust features for flood detection across different scenarios and times of day. The dataset was split into training, validation, and testing sets, with 80% (12,580 images) allocated for training, 10% (1,529 images) for validation, and 10% (1,553 images) for testing. All images were resized to 150 × 150 pixels to standardize input size, ensuring compatibility with the CNN architecture and reducing computational complexity. To mitigate overfitting and increase dataset diversity, data augmentation techniques like 45-degree rotations and horizontal flips were applied, enhancing image variety during training.
2.1.3. Tuning Model Configuration
After preparing the dataset, the next step involved configuring and fine-tuning the CNN models. This study evaluated several well-established CNN architectures, including VGG-19, ResNet101v2, InceptionV3, and InceptionResNetV2. The features of these backbone models are illustrated in Table 2, i.e., CNN model backbones [35,36]. These models, pre-trained on large datasets like ImageNet, offer a robust foundation for transfer learning, enabling fine-tuning for the flood detection task.
To ensure a fair comparison among the CNN models, consistent hyperparameters were applied across all architectures. The fine-tuning hyperparameters used during training are summarized below with further illustrations: (1) optimizer: Adam, (2) number of epochs: 30, (3) dropout probability: 0.4, (4) pre-trained weights: True (ImageNet), (5) learning rate: 0.0001, (6) batch size: 32, and (7) early stopping: False.
- (1)
- Pre-trained models leverage knowledge from large datasets (e.g., ImageNet), providing strong initialization, faster convergence, and improved performance on flood detection tasks, especially with limited data.
- (2)
- Adam optimizer is selected for its adaptive learning rate adjustment, enhancing convergence speed and robustness in training deep networks.
- (3)
- Setting 30 epochs balances sufficient training time to learn meaningful features and prevents overfitting while allowing performance monitoring via validation loss.
- (4)
- Dropout rate of 0.4 mitigates overfitting by randomly deactivating 40% of neurons during training, encouraging the network to learn robust features.
- (5)
- Learning rate of 0.0001 ensures controlled convergence, avoiding overshooting while fine-tuning pre-trained models by enabling gradual weight updates.
- (6)
- Batch size of 32 balances memory efficiency and convergence stability, providing accurate gradient estimation within memory constraints.
- (7)
- No early stopping is used, allowing models to train fully across all epochs for comprehensive performance evaluation and future adjustments.
2.2. Pumping Machinery Approach
To prompt response to the pluvial flood impacts, reducing the magnitude of peak flows in affected catchments is crucial. Therefore, a pumping machinery cyberinfrastructure application is established. In the study, it focuses on developing a real-time solution by integrating Artificial Intelligence with Smart IoT devices to control peak flows proactively [1,4].
2.2.1. Pumping Machinery Application/Service
The pumping machinery control and management application is deployed and implemented as a Service (or a Program) in an Application Server of the Platform [11]. It utilizes the IoT sensors/gateway components, device interfaces, protocol stack, loosely coupled communication mechanism among the modules provided by the Platform. In addition, the Program includes location-based service integrating Global Positioning System (GPS) satellites, cellular tower pings and short-range positioning beacons, to provide dynamic allocating of pumping machinery geographical location. Employing these methods, the pumping machinery application can dynamically locate, allocate, and operate static/mobile pumping machines in real-time. Furthermore, the application also involves value added services, for example, emergency routing instruction or consultation for evacuation during flood (or warning) incidences.
The Service contains front-end sensors, embedded system of gateway, back-end data center as well as communication mechanism including protocol stacks and message exchange among the involved components as depicted in Figure 3. The concepts and technologies applying to the Service are demonstrated and illustrated as follows:
In the diagram, the GPS (Global Positional System) via cell phone or satellite accessibility of location base service to register and track the pumping machinery (equipment) location. The IoT gateway contains multiple communication capabilities to the back-end server or data center. The gateway can include LoRa communication module [37,38] and/or NB-IoT module [39] depending on the gateway, i.e., embedded microcontroller, available communication interfaces/pins and the communication protocol(s). If the microcontroller communication pins are sufficiently enough, it can include both LoRa and NB-IoT modules. The communication protocols of the modules follow the data format of LoRa standard or/and NB-IoT AT commands via Ethernet UDP socket APIs. Occasionally, the LoRa enabled-module is integrated in a gateway to provide low power, long range data transmitting across the network to accommodate environmental limitations in the fields.
In summary, the New Taipei City pumping machine control and management application (or Service) encompasses three modules: (1) the pumping machine location identification module based upon cell phone GPS (Global Position Service) tracking capabilities; (2) surface runoff water level monitoring IoT module including LoRa-based (and/or NB-IoT) Data Logger/Gateway integrated with multisensory of pipe flow depths in the drainage networks; (3) the aggregated data of pipe flow depths are propagated to the Data Center, i.e., Azure Clouds, and (4) Clients apply web services RESTful (HTTP) [40,41] requests/responses to obtain the data from the Data Center. The sensors monitoring pipe flow depths in stormwater/rainwater drainage networks are installed at the entrance of manholes.
2.2.2. Simulation Modeling of Drainage Network Pipeline Water Depth
This study employs the SOBEK (including hydrological–hydraulic model) to simulate urban drainage flow in a district of New Taipei City. Rainwater is collected through roadside ditches and conveyed into the stormwater drainage system via connecting pipes. Model parameters are defined based on local drainage characteristics, including permeable and impermeable surfaces (e.g., rooftops, pavements, slopes), with rainfall–runoff delay incorporated into runoff volume estimation.
The model couples hydrological and hydraulic components—such as rivers, rainwater sewers, ditches, gates, and pumps—to simulate and forecast drainage water levels, which are linked to alert thresholds for pumping station operations. Catchment areas and surface characteristics are derived from land-use and GIS (Geographic Information System) data at the block scale.
This AI-based stormwater simulation platform is tailored to reflect the short concentration time and operational features of urban drainage systems. Using data from roadside ditches near stormwater drains, the SOBEK model generates past and forecasted water-level trends for real-time management. The key SOBEK model parameters of the study are listed and illustrated briefly as follows:
Key model configurations:
- Downstream boundary: Water levels from the Tamsui River system.
- Upstream boundary: Rainfall inputs combining six-hour observations with one-hour QPESUMS forecasts [11].
- Calibration: Model outputs validated against observed water levels to refine forecasts and define warning thresholds.
- Forecast delivery: Water-level predictions updated every 10 min via API and visualized on a monitoring platform.
- Integration: Results transmitted to the Smart Flood Prevention Platform New Taipei City Case for real-time decision support.
Figure 4(a)–(d) illustrate the SOBEK-simulated and forecasted drainage pipe flow depths under different rainfall scenarios in Yonghe District, New Taipei City. Figure 4(a) shows the subsurface drainage network, with the green line indicating the pipeline segment selected for water depth simulation. Figure 4b demonstrates the effect of pre-draining the network six hours before rainfall, which increases system’s detention capacity and enhances flood response efficiency. Figure 4c presents the simulated pipe flow depths under a normal rainfall scenario, while Figure 4d displays that, under an extreme rainfall scenario, pump activation is triggered once the simulated water level reaches the critical threshold.
3. Results
In response to the growing uncertainty of extreme rainfall events driven by climate change, this study integrates machine learning–based CCTV image classification for real-time surface flood detection with adaptive subsurface drainage pipeline depths prediction and pumping equipment operations. The proposed approach aims to enhance urban flood resilience through intelligent monitoring and dynamic system management. The corresponding results and discussions are illustrated in the subsequent sections.
3.1. Machine Learning Results
The outcomes of the CCTV-based image classification, along with a user-friendly interactive application developed for image dataset visualization and analysis, are presented in the following sections.
3.1.1. Training and Validation Results
Following the training of the CNN models on the flood image classification task, the results offered valuable insights into their performance across key metrics, including accuracy, precision, recall, and loss. These metrics were evaluated for both the training and validation datasets, enabling a thorough analysis of each model’s generalization capability.
The accuracy and loss curves for each model in the study, along with the training and validation datasets, are shown in Figure 6. Table 3 summarizes the training results for each Convolutional Neural Network (CNN) backbone, highlighting the accuracy and loss rates for both training and validation phases.
2.2.3. Artificial Intelligence Algorithm for Controlling Pumping Machinery Operations
The strategy for managing, maintaining, and operating the multi-layer pumping machinery application is straightforward. It follows a “centralized management and decentralized control” mechanism. The Platform centralizes the management of the pumping machinery, and the individual affected regions decentralizes the control of pumping equipment allocation and operating. This approach has proven to be both effective and efficient in the field of automation and control [14].
The automated pumping machinery and AI-based algorithms, including various scenarios, are described as follows:
(1) The rainfalls, collected from rainfall monitoring stations or rain gauges, and the floods warning thresholds are the two inputs into the pumping machinery application/service initially.
(2) The pumping machinery application has been developed as an autonomous service that integrates ensemble techniques [7] to remotely manage pumping machines’ operation. It automatically retrieves relevant surface water levels and nearby CCTV images, if available. In essence, the application utilizes four parameters—rainfalls, thresholds, surface water levels, and CCTV video images—to predict, control, distribute, allocate, and operate pumping machinery both statically and dynamically in flood-prone regions under real time.
“Note: Cases of extremely severe flooding are excluded from the scope of this study.”
(3) If the stormwater/rainwater pipe locates at an outlet, normally to the very end of a drainage network, i.e., at a conjunction of either a river system or an ocean, the application checks and evaluates the tidal reach influences.
(i) if not affected by tidal effects, the application will move on to step (4).
(ii) if affected by tidal effects, the application automatically indicates to check the blockage statuses of the outlets; if the outlet is clogged, workers need to remove the debris manually in order to maintain, advance and accelerate pipe-flows at the conjunction smoothly. The program will forward to the next step, i.e., step (4).
(4) If no surface runoff, the surface water level is not over the value of flooding warming threshold. It indicates that either the weather is stable, no precipitation, over the catchment, or the pumping machinery in the region has been running normally; there is no flooding incidence or potential flooding occurrence in the near future. The program iterates back to step (4). The application continues monitoring the pipe flow depths from the sensors as well.
(5) If having surface runoff, the surface water level is over the value of flooding warming threshold, the application will automatically retrieve the pipe/channel flow depths from the sensors in stormwater/rainwater drainage networks. The sensors are installed at the manhole of the drainage system in order to monitor the flow depths in the pipes. The pipe flow depths are calculated according to Manning Equation [44] of partially full pipe flow with pipe parameters, e.g., pipe diameter and constructed material coefficient.
(i) If the pipe flow depth is less than half full, the application automatically indicates to check the blockage statuses at the entrance(s) of stormwater/rainwater drainage systems; if the entrance is clogged, workers need to remove the debris manually in order to maintain, advance and accelerate street streams into the drainage network smoothly. The program iterates to step (4).
(ii) If the pipe flow depth is half full or higher, the application will automatically identify the designated locations of pumping machinery in the potential flood zones. The additional mobile pumping machines need to be positioned or moved to the designated locations manually. The program will activate both static and mobile pumping machinery and start pumping operations remotely. The program iterates back to step (4)
(iii)If the pipe flow depth reaches 2/3 full or over, the program will issue emergent activities to allocate and activate both static and mobile pumping machinery and start pumping operations immediately. The program iterates back to step (4).
(iv)If the pipe flow depth reaches full, the program checks and evaluates tidal reach inferences:
(a)If not affected by tidal effects, the application automatically indicates to check the blockage status of the outlet of stormwater/rainwater drainage systems at the conjunction of river systems or an ocean; if the outlet is clogged, workers need to remove the debris manually in order to maintain, advance and accelerate the drainage network flows smoothly into the river or the ocean. The program will iterate to step (4).
(b)If flooded and affected by tidal effects, the program will issue emergent activities to allocate and activate both static and mobile pumping machinery and start pumping operations immediately. The program iterates back to step (4).
(6) If having surface runoff, the street/surface water level does not reach the values of flooding warming thresholds. The application automatically indicates to check the blockage statuses at the entrance(s) of stormwater/rainwater drainage systems. If the entrance is clogged, workers need to remove the debris manually in order to maintain surface water flows into the drainage networks smoothly. The program iterates back to step (4).
(7) If flooded, according to CCTV image classification, retrieve and check sensors’ water levels in the stormwater/rainwater drainage system; if sensors having high water levels, the application will automatically seek pumping stations’ locations and their operating statuses; if a pumping machine is nearby, and it is inactive, the application will activate the pumping machinery and start pumping operation; otherwise, maintain and continue machineries’ pumping operation. Afterwards, the program will iterate back to step (4).
If flooded and if the sensors having low water levels, it indicates drainage system may be blocked with debris. The application automatically indicates to check the blockage statuses at the entrance(s) of stormwater/rainwater drainage systems. If the entrance is clogged, workers need to remove the debris manually in order to maintain surface water flows into the drainage networks smoothly. The program iterates back to step (4).
The intelligent algorithms of pump operations and scenarios are summarized in Figure 5.
Sensors used to monitor pipe flow depths within stormwater/rainwater drainage networks are typically installed at the inlets of manholes. These sensors estimate flow depth for partially filled conduits based on the Manning equation, incorporating two principal parameters: (1) pipe diameter (m) and (2) a concrete-steel roughness coefficient of 0.011. Under low-flow conditions, monitoring data are transmitted at 10-min intervals. As flow depth increases, the transmission frequency is automatically elevated to one-minute intervals to ensure prompt detection and response to hydrodynamic variations. This adaptive transmission strategy facilitates continuous operation of pumping systems and enables the pre-emptive activation of standby machinery. When floodplain sluice gates are closed, the standby units respond immediately, initiating pumping operations. Consequently, the urban stormwater drainage network functions temporarily as a detention basin, accommodating excess runoff and thereby mitigating the risk of surface flooding in the New Taipei City.
3.1.2. Comparison Backbone Training Accuracy and Loss
In the diagram, VGG-19 achieves notable improvements in training accuracy during Epochs 1–8, followed by a slower convergence phase after Epoch 8, culminating in a final accuracy of 99.13%. The training loss steadily decreases, stabilizing at 0.029, highlighting the model’s slower optimization due to its sequential architecture and high parameter count.
ResNet101V2 demonstrates rapid training accuracy improvement during Epochs 1–4, converging by Epoch 9 with a final accuracy of 99.74%. The training loss declines sharply in the initial epochs and stabilizes at a minimal value of 0.0073. This performance is driven by residual connections, which facilitate efficient gradient flow and enable rapid, stable optimization in the deep network.
InceptionV3 shows rapid accuracy improvement during Epochs 1–4 and converges by Epoch 9, achieving a final accuracy of 99.74%, comparable to ResNet101V2. The training loss decreases sharply and stabilizes at 0.0089, slightly higher than ResNet101V2. Its strong performance is attributed to the Inception module, which enhances feature learning and generalization through multi-scale processing.
InceptionResNetV2 exhibits steady accuracy improvement during Epochs 1–6, converging after Epoch 10 with a final accuracy of 98.83%. The training loss decreases steadily but stabilizes at a higher final loss of 0.034 compared to other models. This reflects challenges inherent to its hybrid architecture, which integrates Inception modules and residual connections. While this design enhances feature learning, its complexity introduces optimization difficulties. The slower convergence and higher final loss indicate the need for additional training epochs or fine-tuning to fully optimize its parameters.
The classification accuracy and loss of each model are presented in Table 3. The table indicates that InceptionV3 achieves the highest training and validation accuracy, along with the lowest loss rates. Detailed analyses of the individual model outcomes are illustrated as below.
VGG-19: VGG-19’s deep, straightforward architecture enables detailed pattern learning but risks overfitting due to its many parameters. It achieved 99.12% training accuracy, 97.84% validation accuracy, and losses of 0.0290 (training) and 0.1009 (validation), indicating limited generalization compared to models like InceptionV3.
ResNet101V2: ResNet101V2 employs residual connections to mitigate vanishing gradients, enabling efficient learning. It achieved 99.74% training accuracy, 98.29% validation accuracy, and losses of 0.0113 (training) and 0.0878 (validation). These connections enhance generalization and reduce overfitting, outperforming VGG-19 in both accuracy and validation loss.
Inception-V3: Inception-V3 uses multi-scale processing via Inception modules to capture diverse features and enhance generalization. It achieved 99.74% training accuracy, 98.82% validation accuracy, and losses of 0.0089 (training) and 0.0501 (validation), demonstrating strong generalization and minimal overfitting.
Inception-ResNetV2: Inception-ResNetV2 integrates Inception modules with residual connections but can be challenging to train effectively. It achieved 98.83% training accuracy, 96.99% validation accuracy, and losses of 0.0343 (training) and 0.1337 (validation). The higher validation loss suggests potential overfitting or suboptimal generalization in this case.
In summary, all CNN backbones achieved high accuracy, with Inception-V3 excelling in both training and validation. Low loss rates across models indicate effective learning and minimal overfitting, though higher validation losses in VGG-19 and Inception-ResNetV2 suggest room for optimization to improve generalization [19,45,46,47,48].
3.1.3. Training Times of Models
The evaluation compares the training times of CNN backbones over 30 epochs, revealing distinct durations. As indicated in Figure 7, VGG-19 required 19,625.35 s (~5.45 h) with an average of 654.17 s per epoch, while ResNet101v2 took 20,874.47 s (~5.79 h), averaging 695.81 s per epoch. Inception-V3 trained significantly faster, completing in 6,802.93 s (~1.88 h) with 226.75 s per epoch. Inception-ResNetV2 recorded a total time of 9,586.96 s (~2.66 h), averaging 319.56 s per epoch.
Overall, InceptionV3 proved to be the most effective model, demonstrating rapid convergence, high accuracy, and low loss, closely followed by ResNet101V2. In contrast, VGG-19 and InceptionResNetV2 faced optimization challenges, evident in their slower convergence and higher loss values. These findings highlight the critical role of model architecture and initialization strategies in achieving optimal training and validation performance [20].
During the training process, each backbone model typically utilized 100% of the CPU and approximately 88% of the memory, with an average training duration of 7-8 min. However, the ResNet-101v2 model required more time to train due to its increased depth.
Inception-V3 demonstrated the highest training efficiency, followed by Inception-ResNetV2. The longer durations for VGG-19 and ResNet101v2 reflect their higher complexity, highlighting the trade-off between model complexity and training efficiency. Selecting an appropriate backbone depends on project requirements [35,36,42].
3.1.4. Testing Results
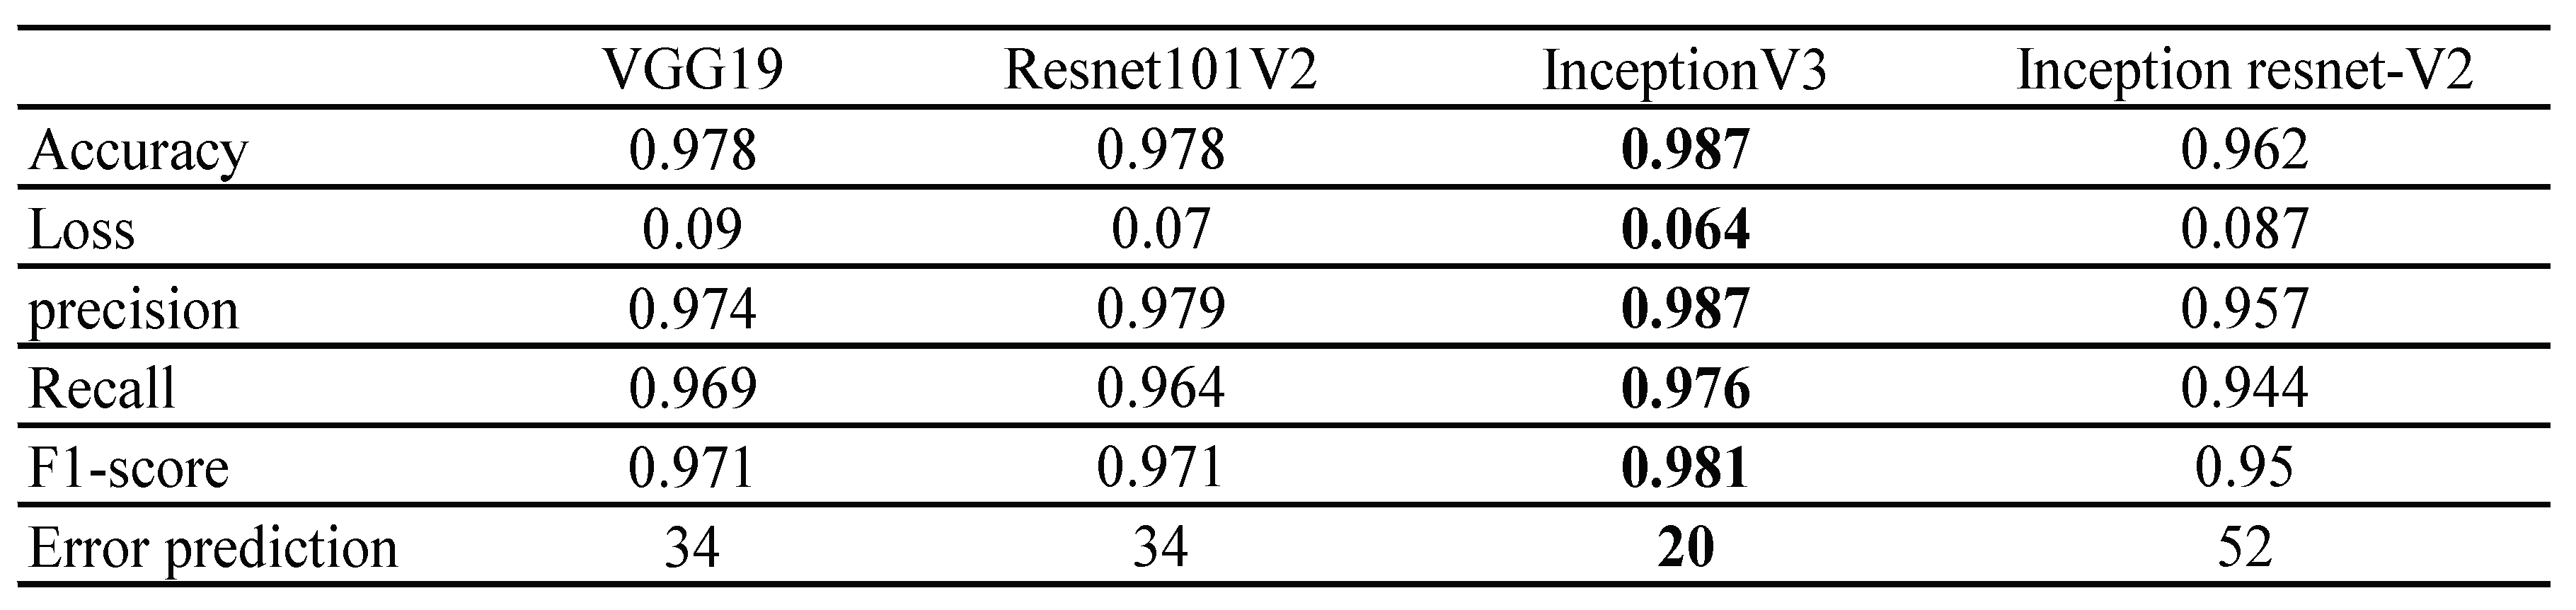
The classification performance on the test datasets is evaluated using confusion matrices, highlighting the prediction accuracy across six classes for the specified backbone model. Figure 8 provides an example of test results for the Inception V3 model. Table 4 summarizes the testing outcomes for each backbone model, including metrics such as accuracy, loss, precision, recall, F1 score, and error analysis.
The individual element of a backbone model, as illustrated in the diagram, is described in detail in Figure 13a–d. In Table 4, it indicates that the Inception V3 backbone achieved the highest performance across all categories, with the lowest loss and error rates. This confirms that the Inception V3 model demonstrates superior accuracy in correctly identifying the target classes.
The findings of the study differ from those reported by Szegedy et al. [49] and He et al. [46]. Their works investigated whether combining the Inception architecture with residual connections offers any performance advantage. They provided clear empirical evidence that incorporating residual connections significantly accelerates the training of Inception networks. Furthermore, their results indicated that residual Inception networks may outperform comparably complex Inception models without residual connections, albeit by a narrow margin.
3.1.5. CCTV Flood Detection Application with Web Interactive Accessibilities
Real-time access to environmental visuals is a key component of flood monitoring. This study developed a user-friendly desktop-based Flood Detection Application [11] with interactive accessibilities. The application encompasses four items: (1) Live View; (2) Weather Forecast; (3) Periodical Prediction, and (4) Training Model, as presented in Figure 9. These real-time items and the live camera views provide immediate insights into current conditions, such as surface runoff water levels, weather conditions and other critical flood indicators, particularly in flood-prone areas. Moreover, the application continuously integrates newly collected datasets into trained CNN models to improve prediction accuracy. Therefore, the application provides real-time road condition, updates to assist in preventing traffic congestion and supports proactive decision-making while flooding occurs [20,25,50].
In Figure 9, the operational procedures of the application are illustrated as a flow chart. It includes the key features of the application and its accessing control flows.
- Live View: Simultaneously viewing multiple camera feeds in real-time as indicated in Figure 10.
Users can view up to six camera feeds simultaneously and switch between feeds by selecting an available address from a combo box in each view. To ensure smooth performance, the application employs separate threads to handle each camera feed, preventing interference between streams.
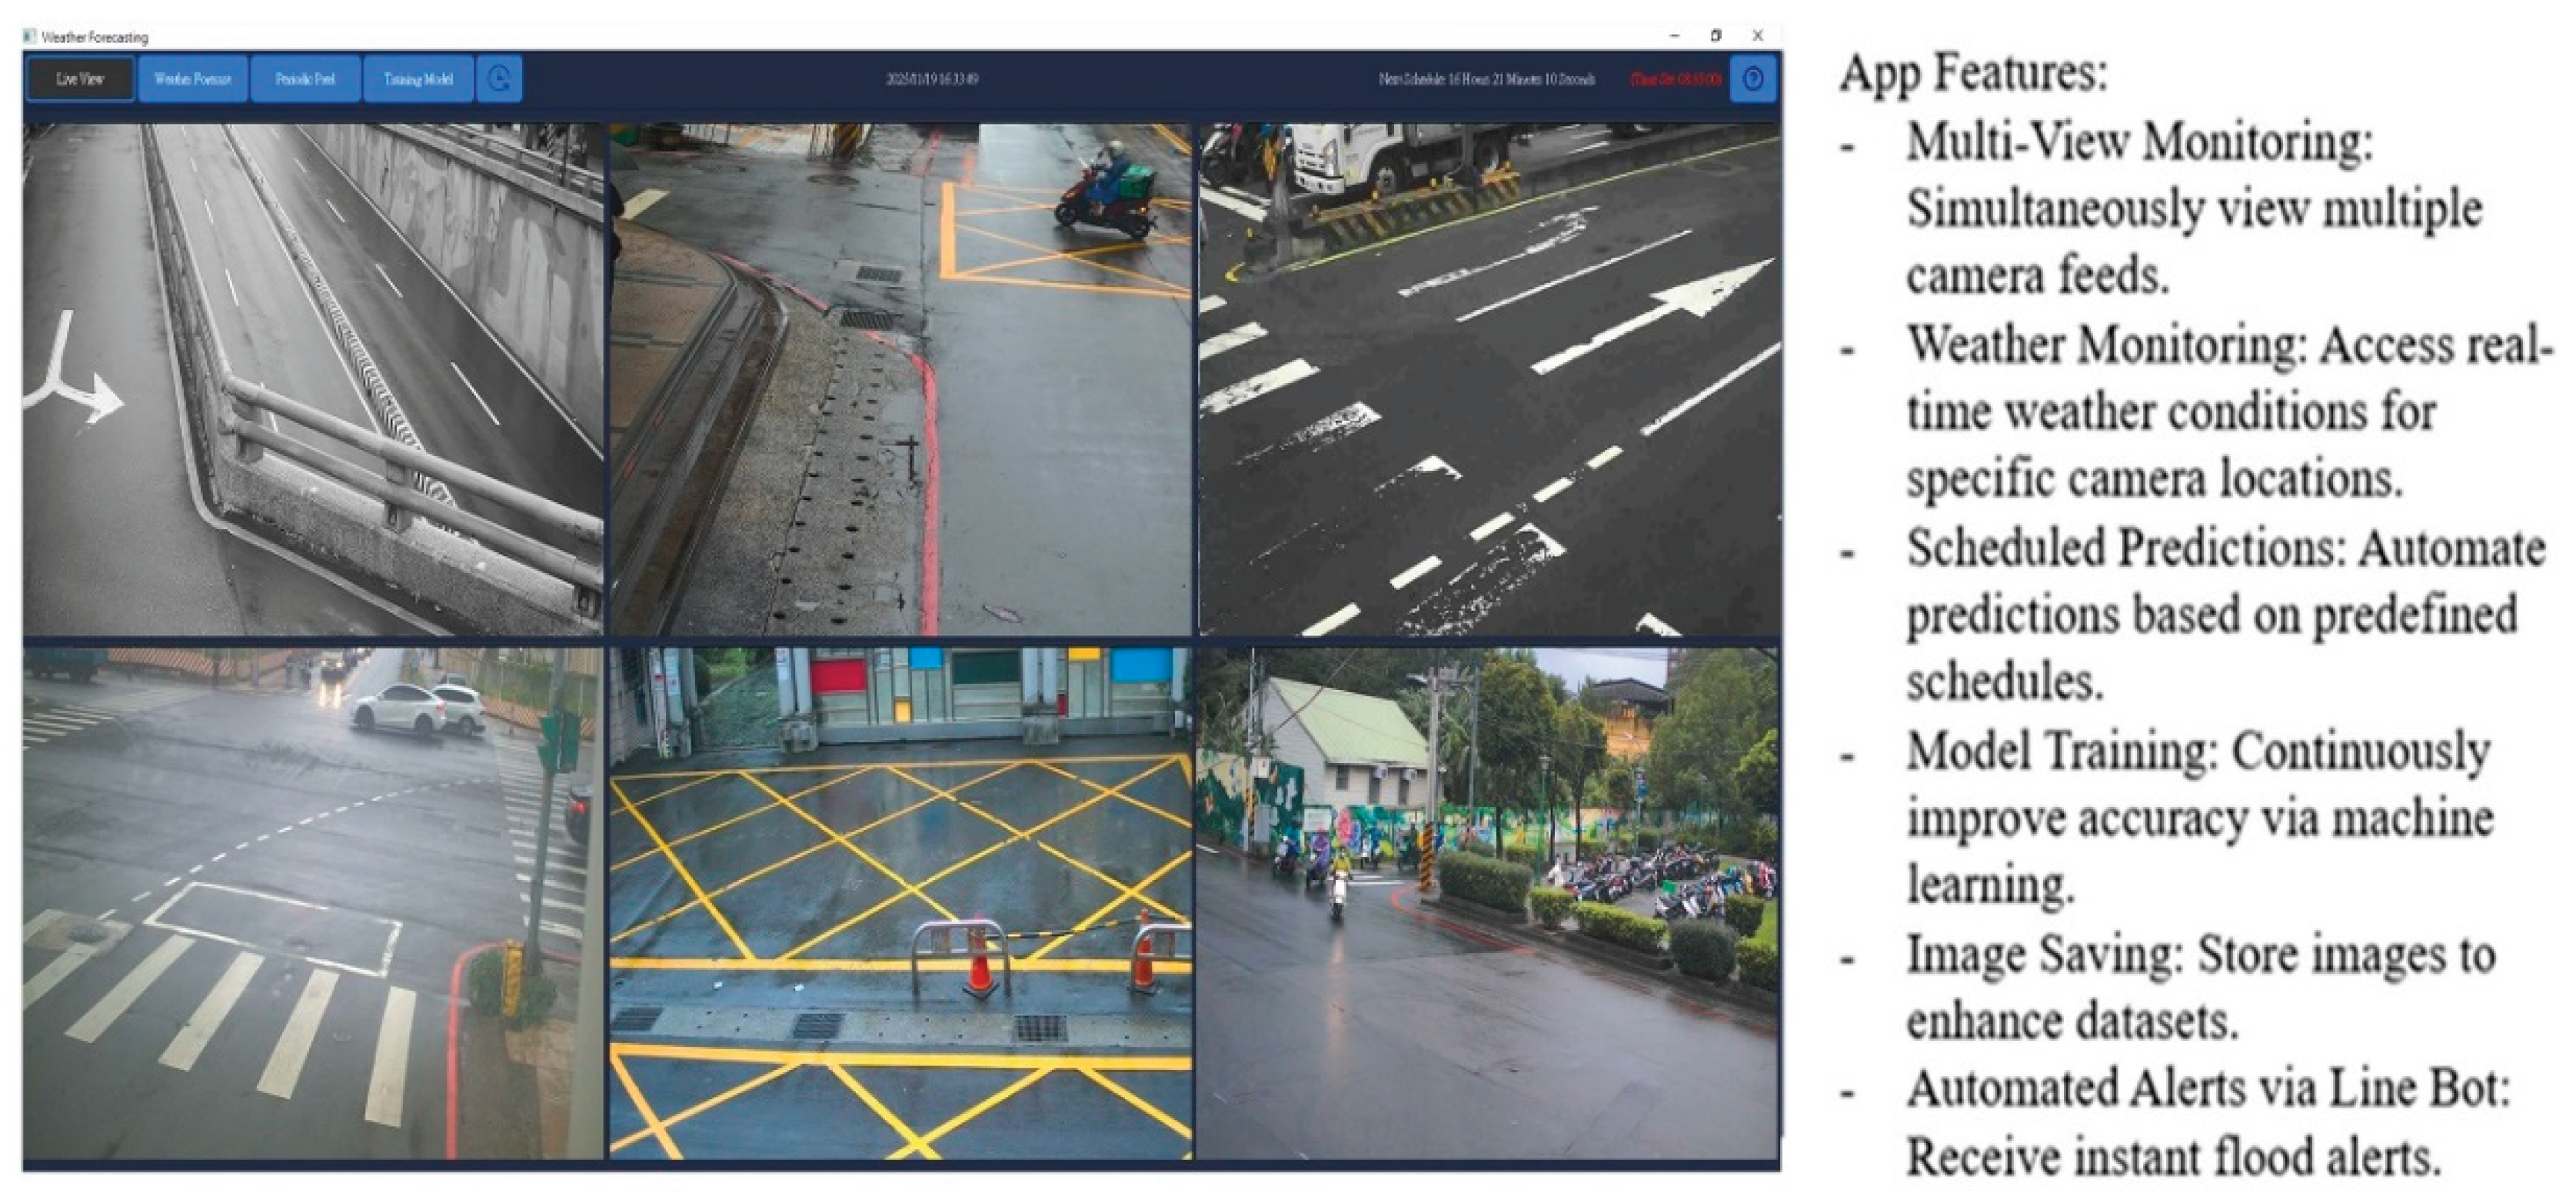
Figure 10.
Real-Time CCTV monitoring with support for up to 6 channels.
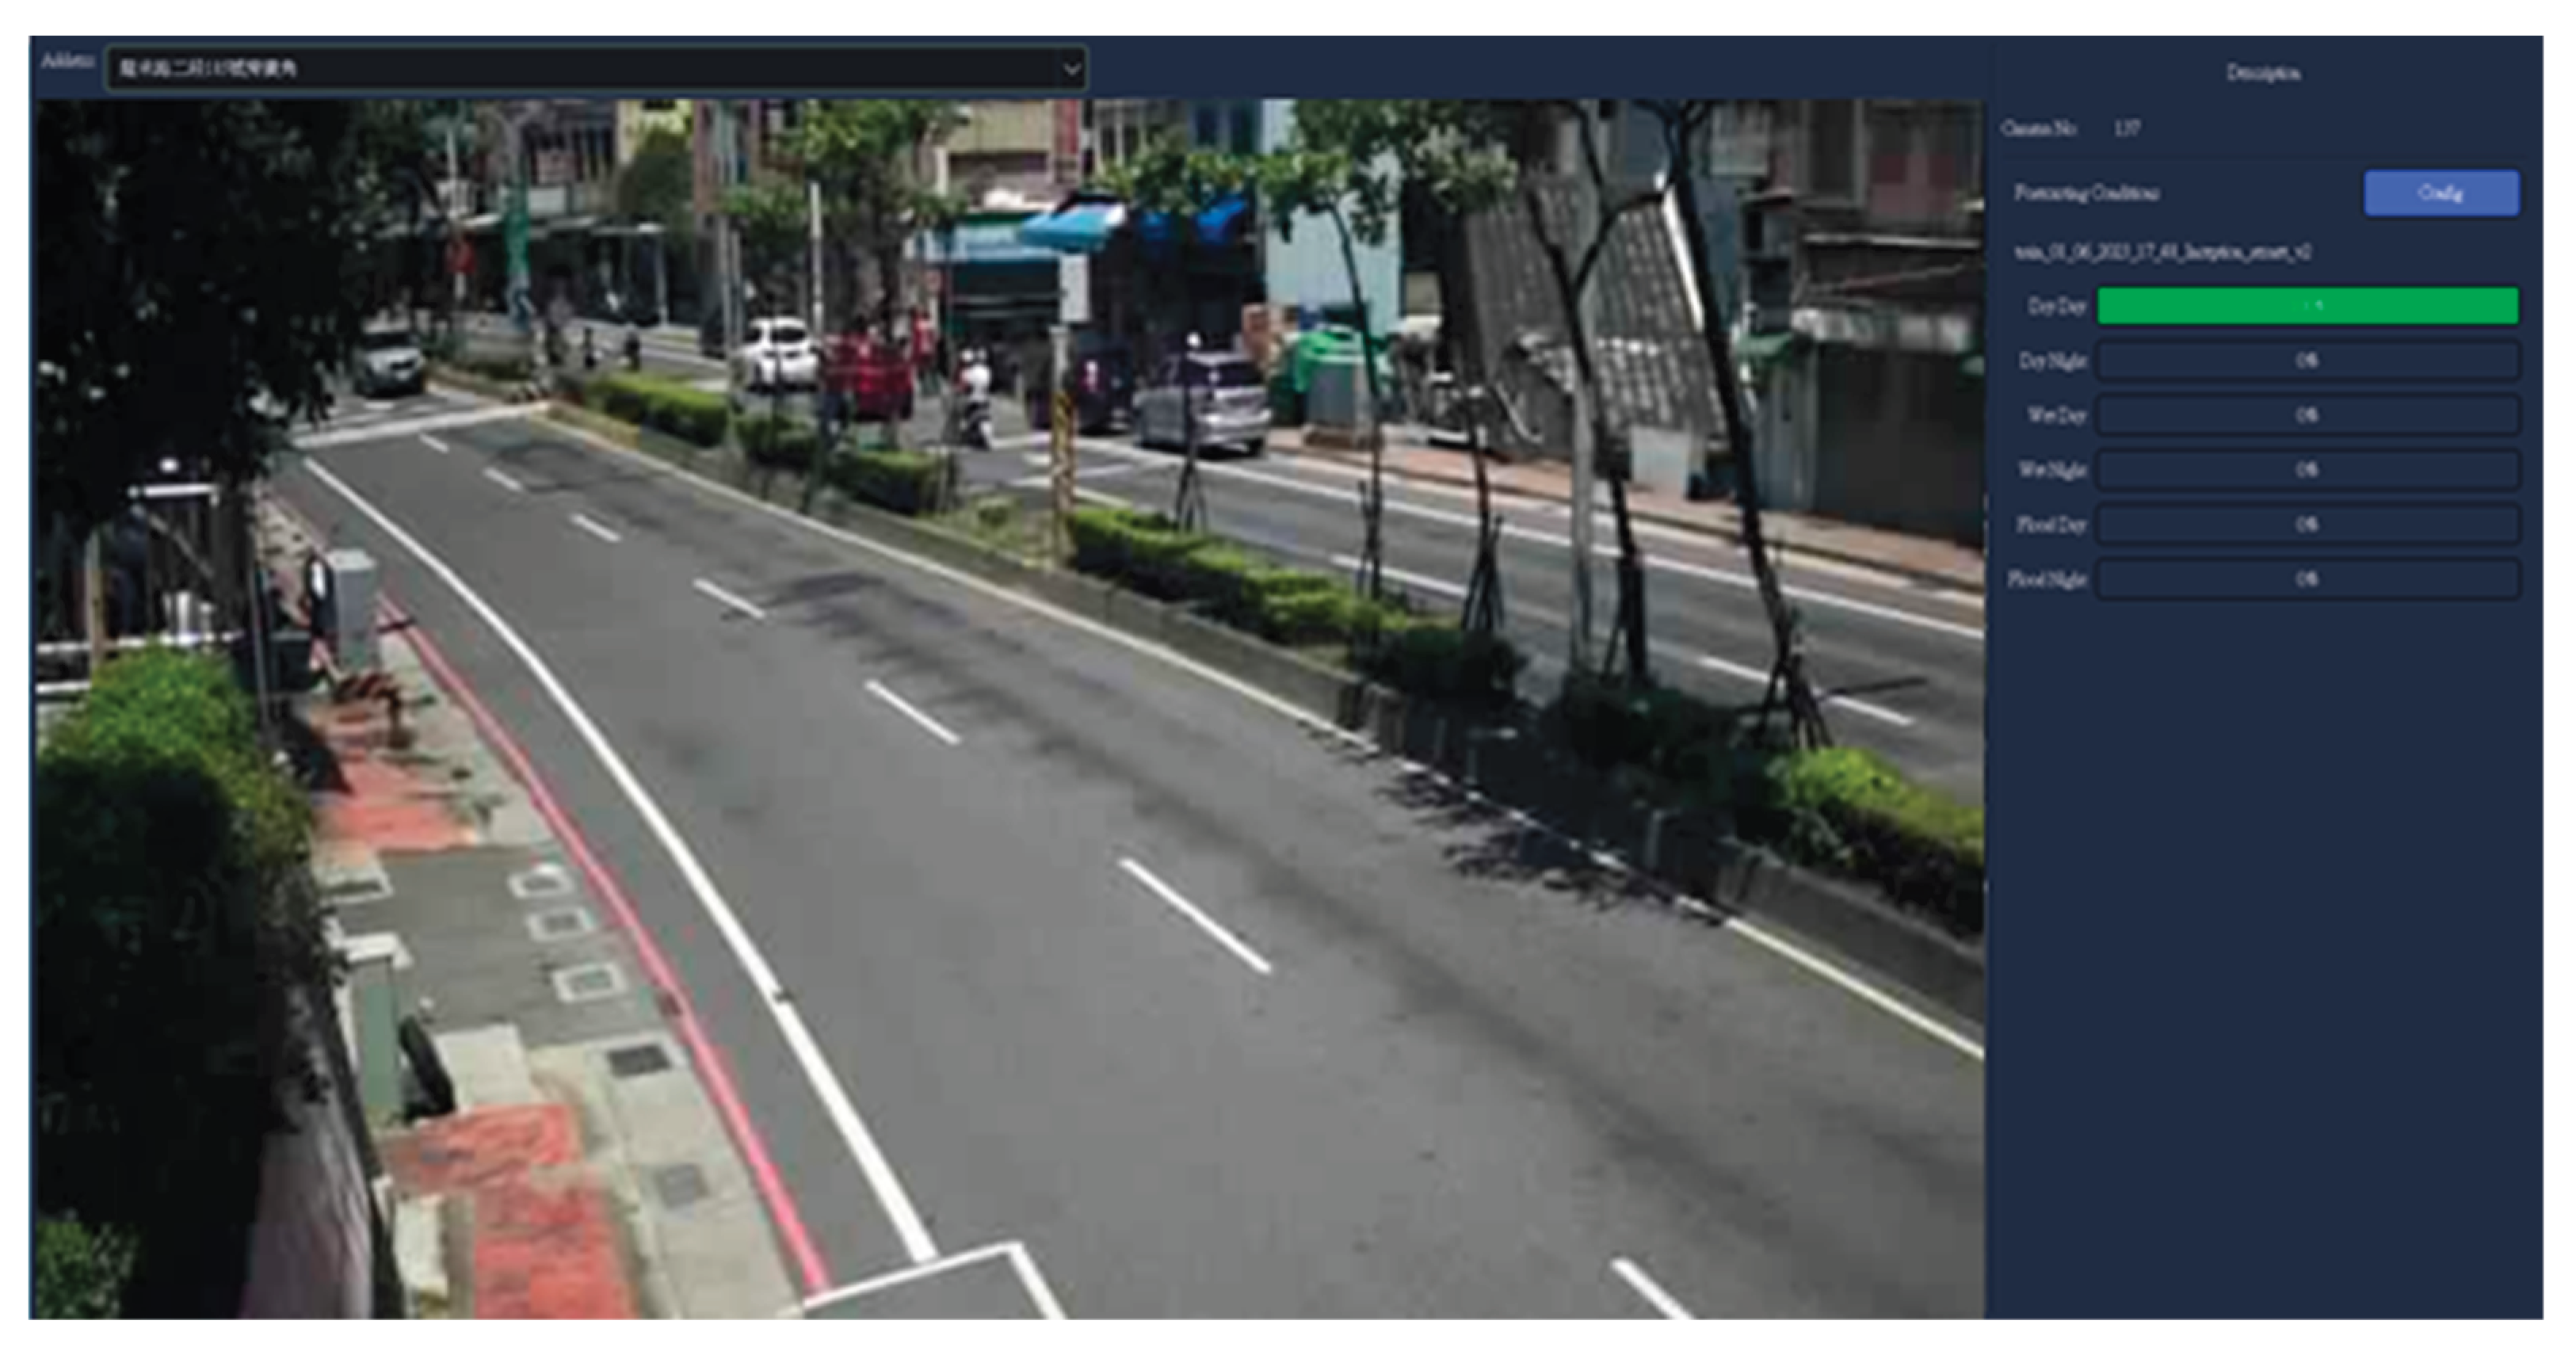
- Weather Forecast: Accessing real-time weather conditions presented in six distinct, classified image categories (refer to Section 2.1.2) for a specific camera location, as indicated in Figure 11.
Figure 11.
Real-time weather forecast presented in six categories at a specified location.
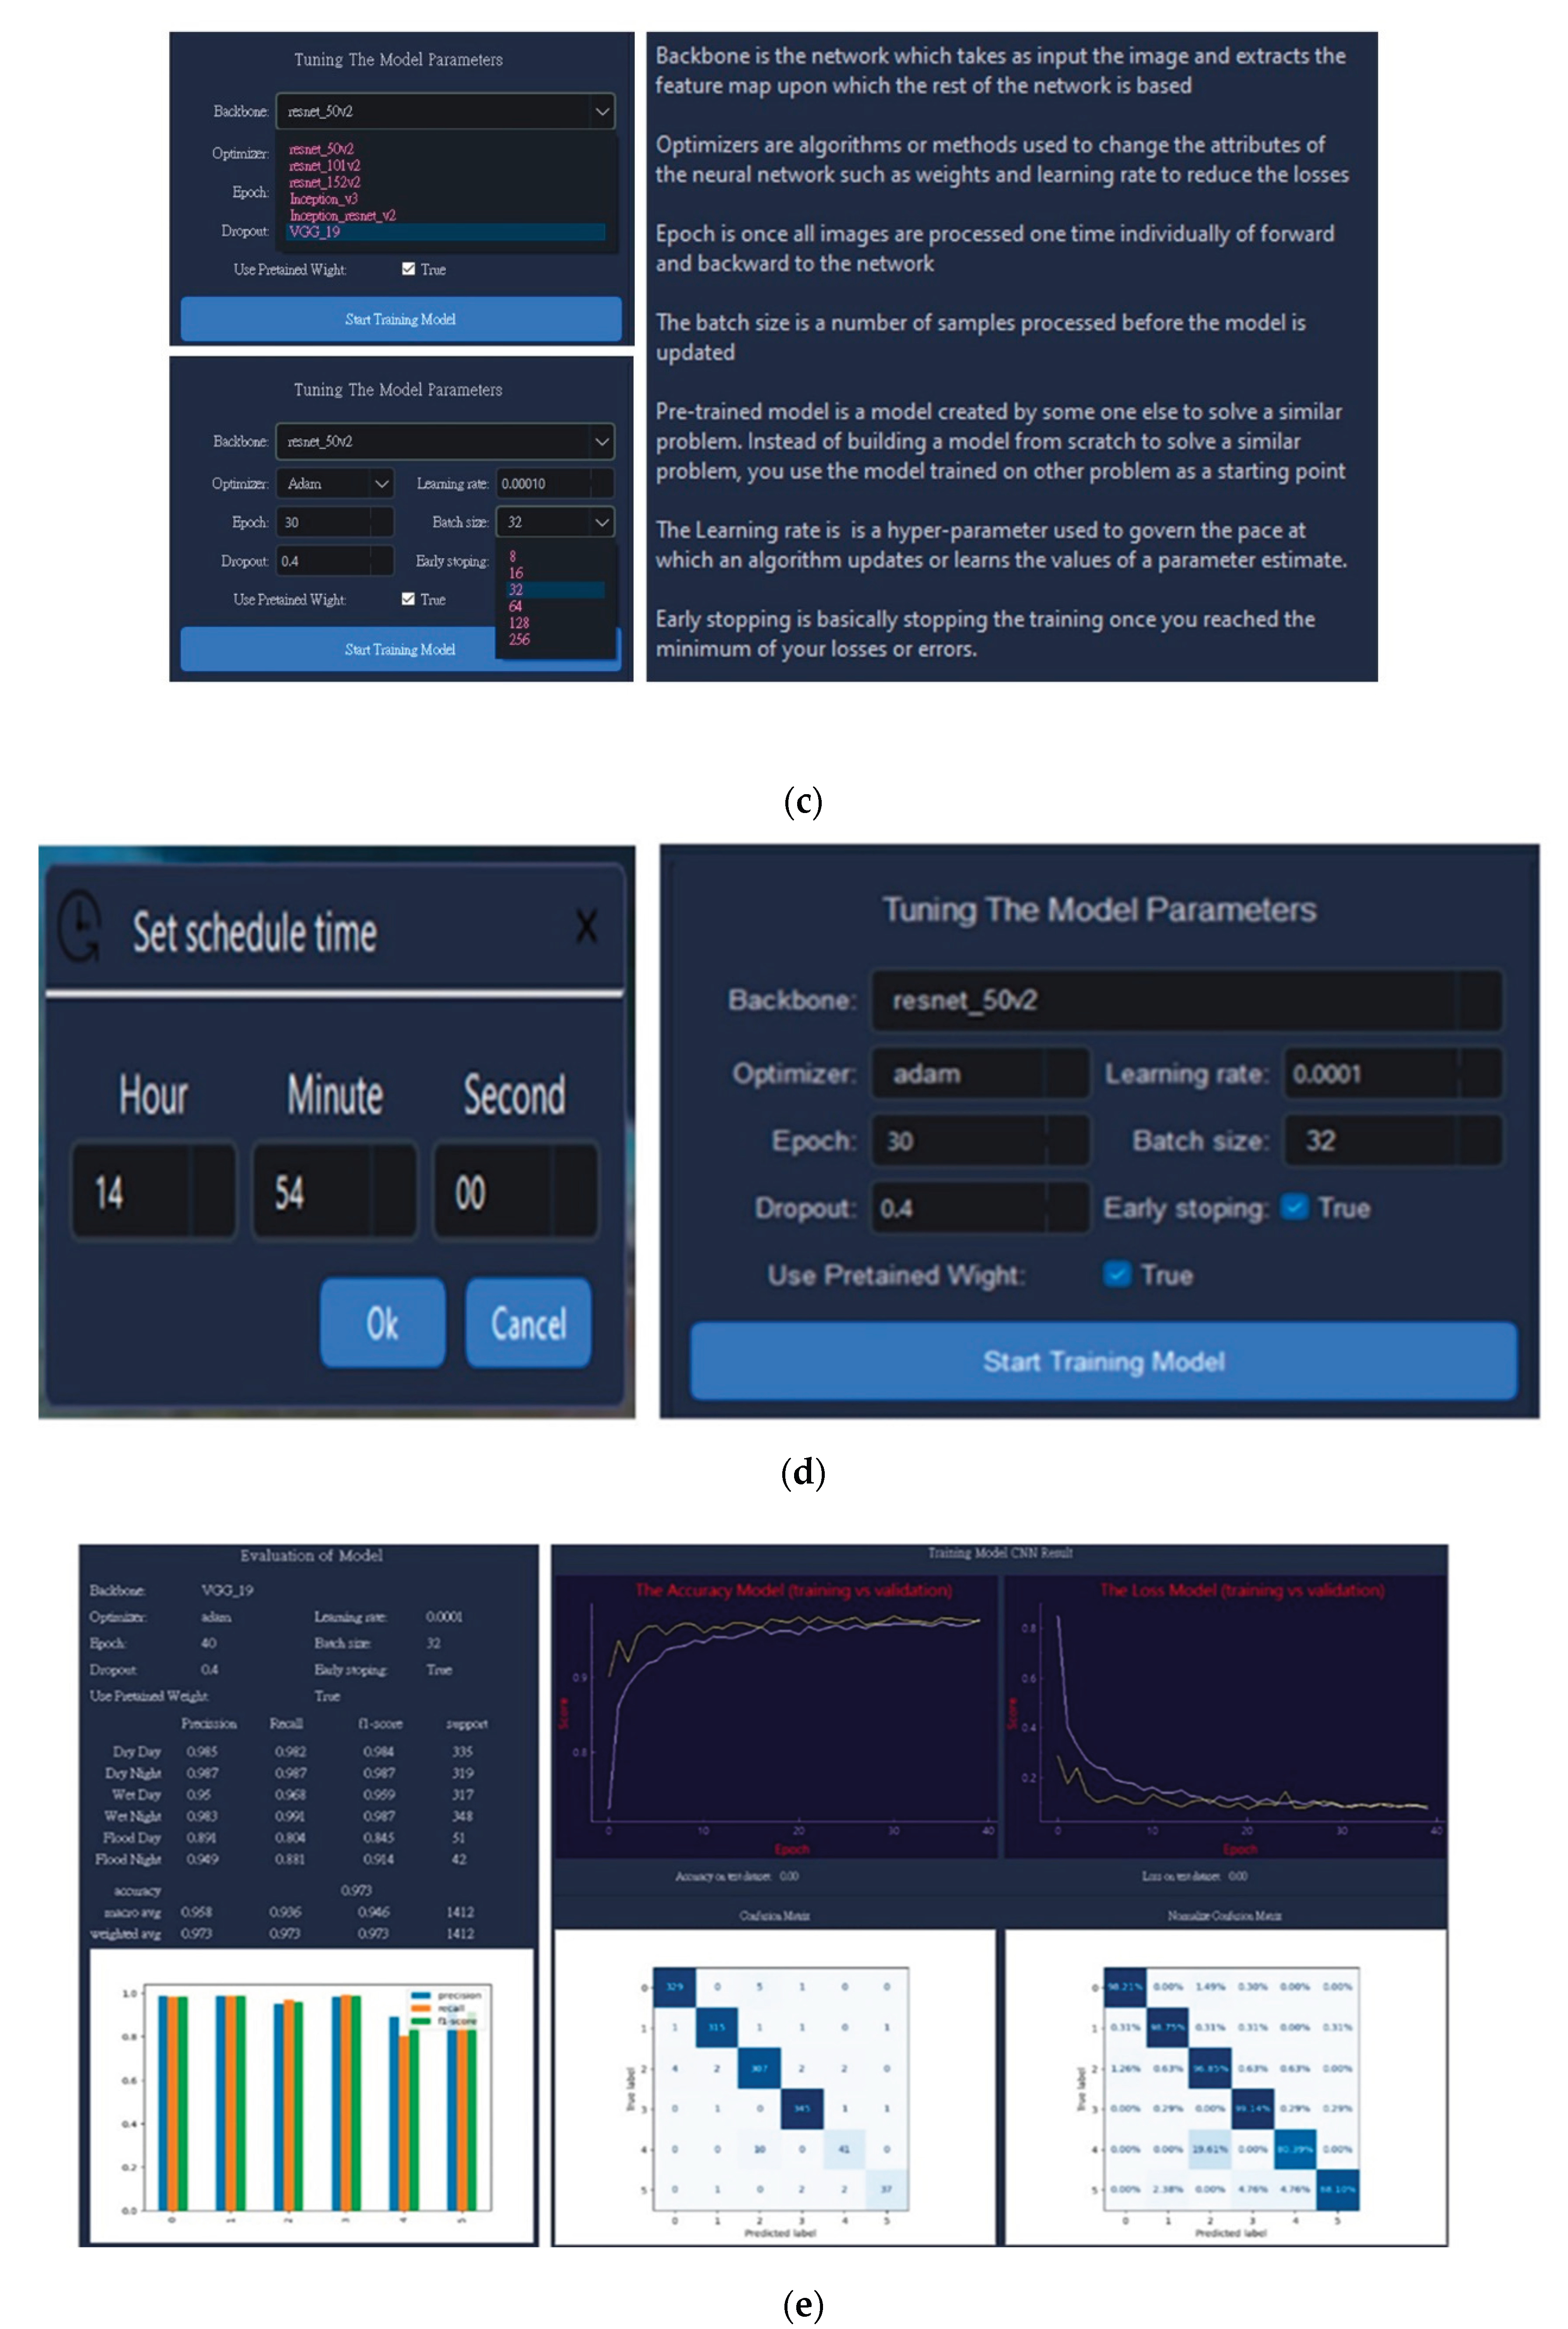
- Periodical Predictions: Automated daily scheduling for flood predictions can be configured using a manually defined timer. As shown in Figure 13d, the system allows users to set up a flood prediction process and adjust hyperparameters to run automatically according to a predefined schedule. For instance, the diagram illustrates how daily flood predictions can be scheduled to start automatically at 14:54:00, with the corresponding hyperparameters specified in the configuration.
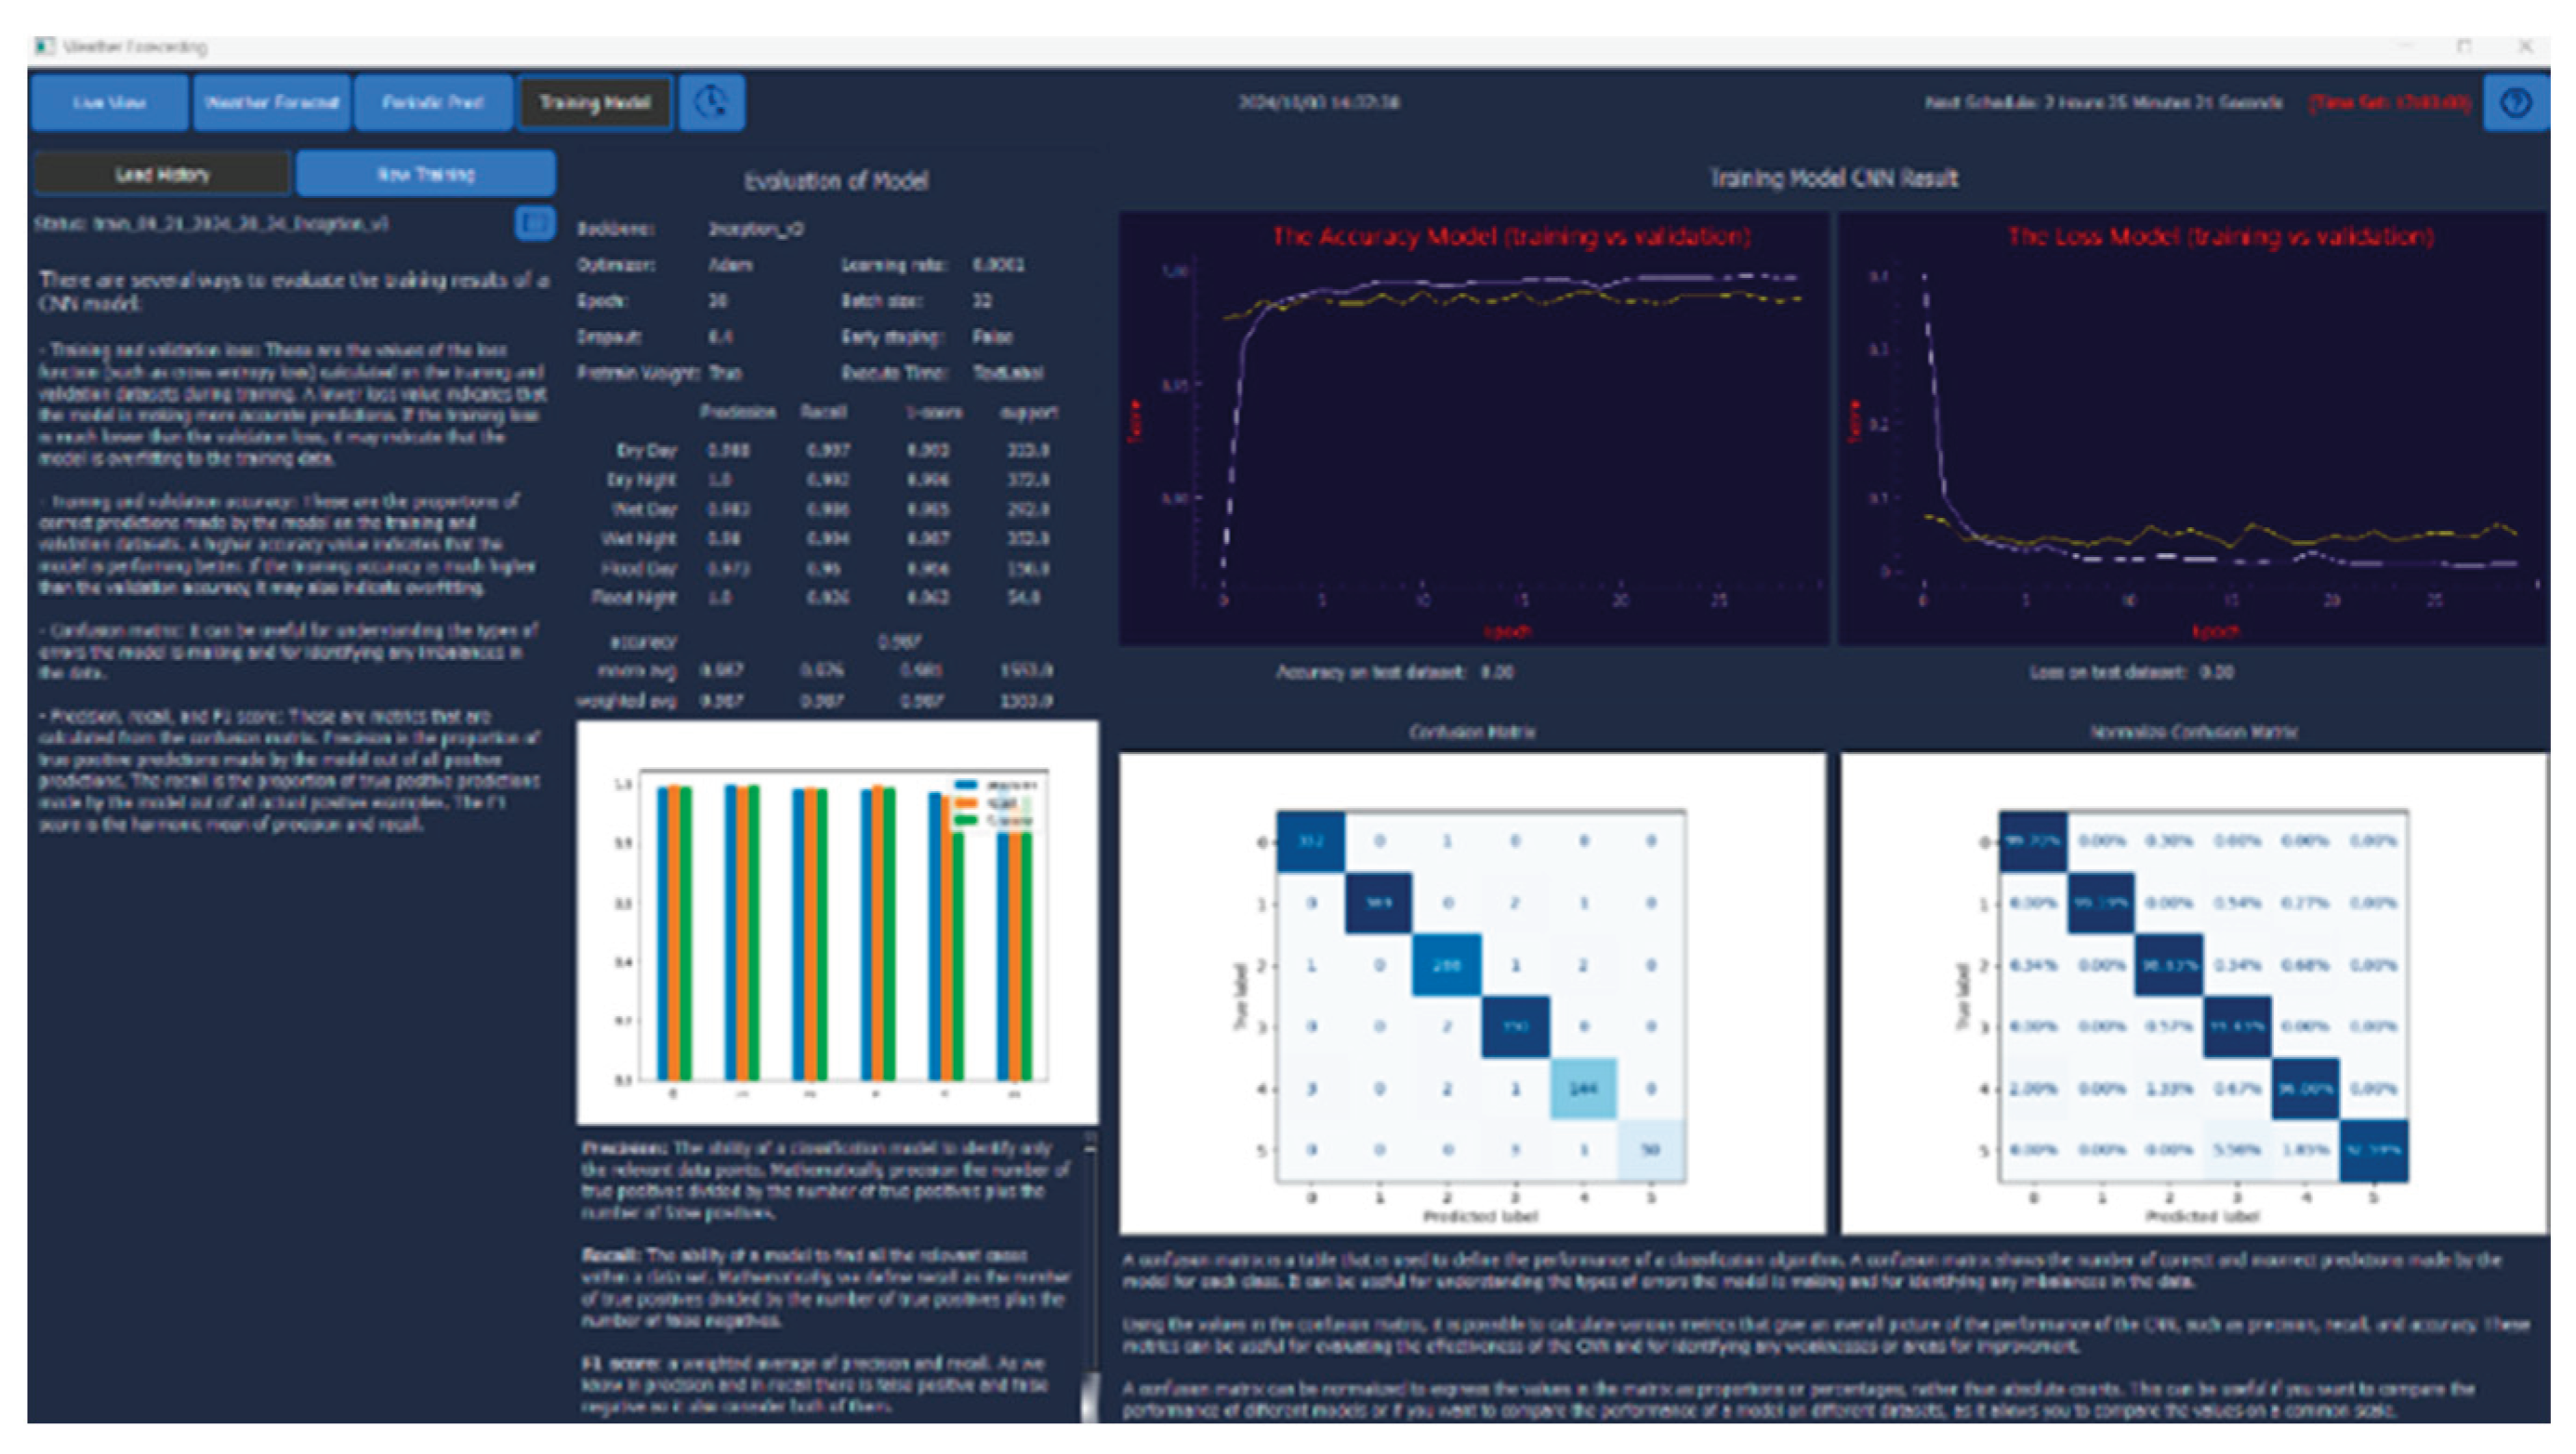
- Model Training: Continuously improve accuracy through machine learning. The Train Model offers two primary modes: “Load History” and “New Training”. The Load History mode, as indicated in Figure 12, allows users to review previous classification results, such as Inception V3, which previously demonstrated superior performance. The mode also includes key performance metrics such as accuracy, loss per epoch, precision, recall, F1 score, and confusion matrix, along with model’s configurations and its corresponding hyperparameter settings.
Figure 12.
The Load History mode reviews historical classification outcomes—Inception V3 as the results.
Figure 12.
The Load History mode reviews historical classification outcomes—Inception V3 as the results.
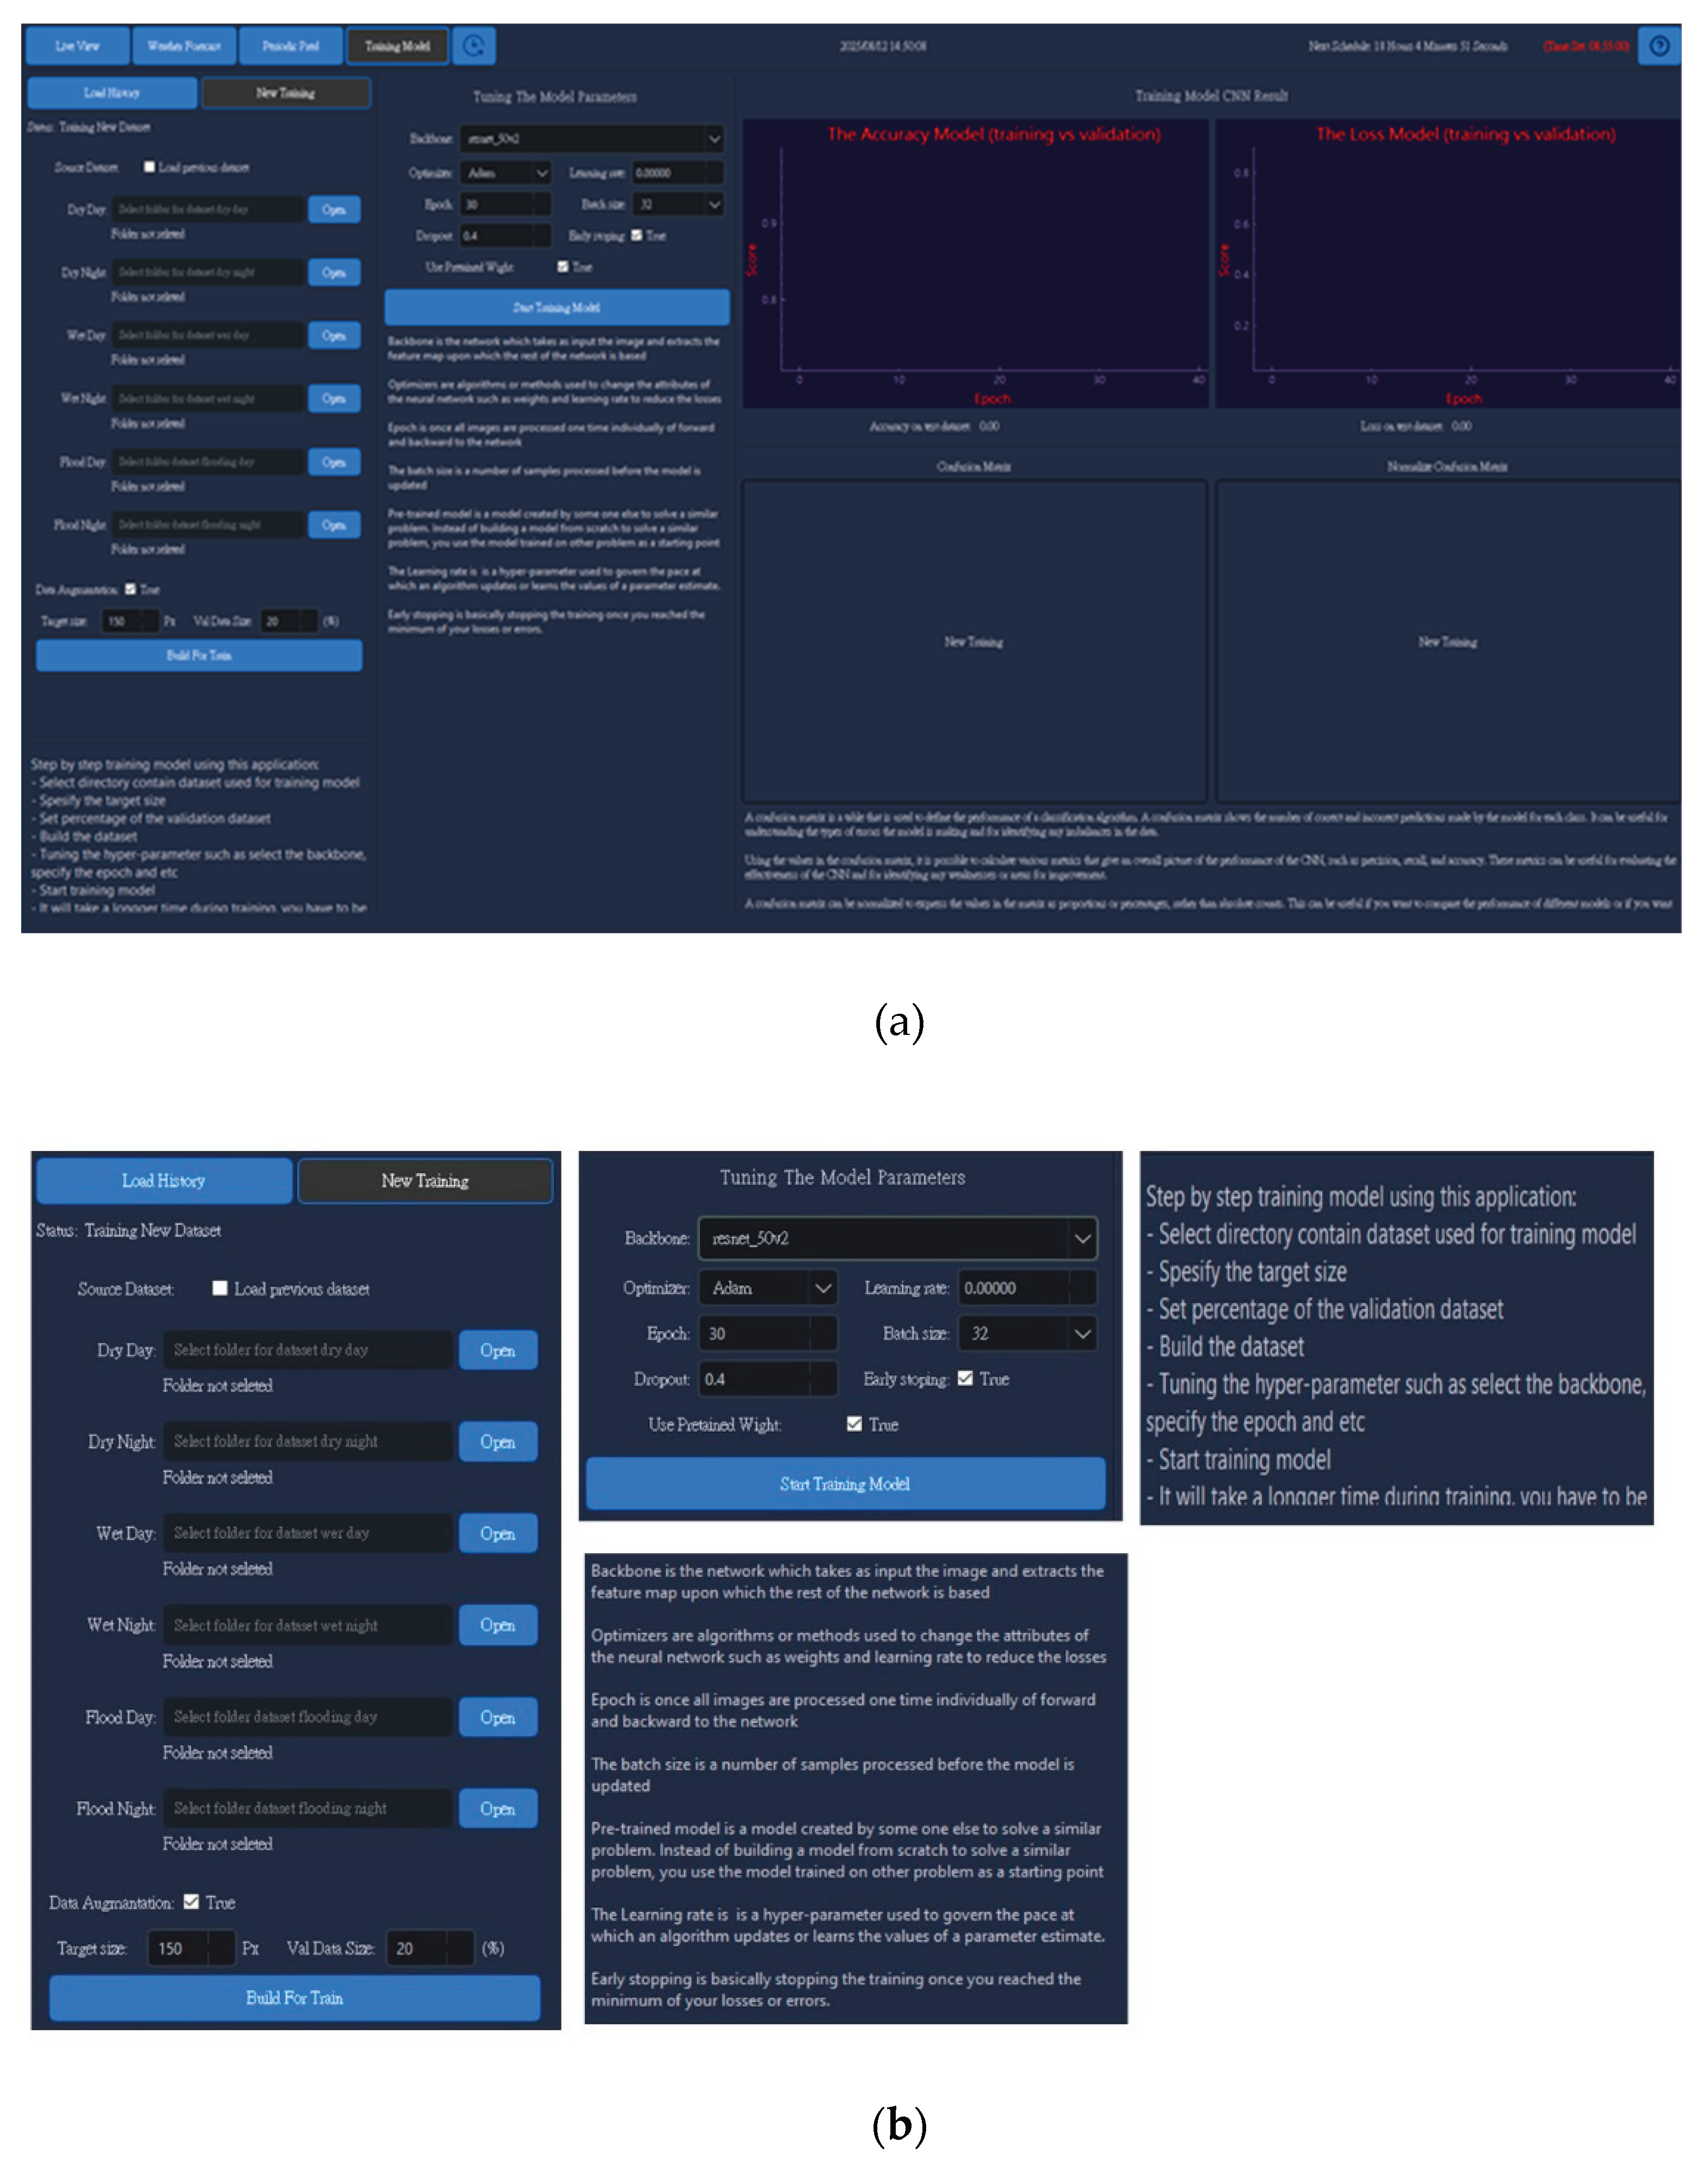
The New Training mode supports two functions: (i) training CNN backbone models (e.g., ResNet, VGG19, InceptionNet, InceptionResNet) from scratch, and (ii) fine-tuning the existing model, such as Inception V3, which previously demonstrated superior performance. Both functions apply complete datasets—including newly aggregated and historical data.
(1) Training CNN backbone models from scratch, as illustrated in Figure 13a, begins with constructing and organizing datasets into six categories. Next, a backbone model is selected (e.g., ResNet-50v2), followed by configuring the corresponding hyperparameters with appropriate data splitting for training, validation, and testing. The training process is then initiated. For clarity, each procedure is visually demonstrated with self-explanatory steps in Figure 13b–e. Detailed methodologies are described in Section 2.1.2 (Preparing Datasets) and Section 2.1.3 (Training Model Configuration).
(2) The fine-tuning process enables incremental updates using the complete datasets, allowing the model to adapt to evolving environmental conditions and thereby improve prediction accuracy. This procedure is similar to the New Training mode, but it is applied to an existing model with previously demonstrated superior performance, such as Inception V3.
In this time-stepping data assimilation procedure [51], each cycle involves comparing the previous model forecast with newly received observations, updating the model state accordingly, and then initiating a new forecast.
Figure 13.
(a) New Training workflow: dataset construction (six categories), backbone selection (e.g., ResNet-50v2), hyperparameter setup with proper data splitting, and training initiation. (b) Dataset preparation, backbone selection, and hyperparameter tuning with step-by-step CNN classification guidance. (c) Backbone selection and hyperparameter tuning with illustration; details in Section 2.1.3. (d) Scheduling and hyperparameter tuning for automated training and prediction. (e) Results of the newly trained model from scratch using ResNet-50v2.
This flexible design enables users to select optimal modeling strategies according to resource availability and performance goals. This flood detection application includes a dataset collection tool that enhances forecasting accuracy by automatically saving newly captured images during periodic condition assessments. These images are organized into six classes along with their capture dates, enriching the dataset with more diverse samples. As the dataset grows, the model benefits from exposure to varied conditions, leading to improved training accuracy and stronger classification performance. By continuously updating the trained model with new images, the application adapts to changing environmental conditions, thereby delivering more reliable and accurate predictions [51].
Additionally, the prediction results are seamlessly integrated with the Line API, enabling this social media platform to share real-time information about flood-affected areas as indicated in Figure 14. It allows people to plan evacuations, take early preventive measures, or avoid traffic disruptions caused by flooding.
3.2. Pumping Machinery Results
To prevent urban inundation, the adaptive pumping strategy is structured into a three-phase framework that supports real-time decision-making based on rainfall progression and drainage system response. This AI-based approach integrates atmospheric monitoring, subsurface hydrological alerts, and surface flooding assessments, enabling timely and site-specific interventions.
In Figure 15, it depicted the adaptive pumping strategies for New Taipei City flood mitigation. The three phases of operations are illustrated clearly as follows:
Phase 1: Atmospheric Monitoring and Forecasting
Early rainfall awareness is achieved through the integration of three key data sources: (1) 6-h cumulative rainfall forecasts offer preliminary indications of potential events, (2) radar composite reflectivity enables real-time tracking of large-scale systems (e.g., typhoons, Meiyu fronts), and (3) ground-based rain gauges provide high-resolution precipitation data. Rainfall exceeding 10 mm in 10-min signals heightened alert, while >20 mm/10 min—especially in urban or upstream mountainous areas—triggers pumping equipment readiness protocols.
Decision-making diverges by system type:
- With Downstream Pump Stations: Drainage operation is guided by tidal conditions. Rising tides prompt early closure of floodgates and pump activation, converting drainage systems into temporary detention spaces. Falling tides allow gravity drainage.
- Without Pump Stations: Gravity-drained systems rely on real-time water level trends from sensors. If flooding risk is detected, mobile pumps are pre-deployed for rapid response.
This phase is underpinned by automated rolling monitoring updated every 10 min, ensuring near real-time situational awareness.
Phase 2: Subsurface Hydrological Response and Alert Activation
As rainfall transitions to runoff, stormwater enters drainage systems, triggering real-time hydrological monitoring. The urban flash flood management platform with intelligent alerts and warnings for New Taipei City [11] assess sensor data against predefined thresholds.
Alert levels include:
- Half-Full Pipe: Indicates increasing rainfall intensity. Pump stations are activated, and monitoring frequency is increased to 1-min intervals.
- Full Pipe: Signals pressurized flow; overflow is imminent. Pump stations operate at maximum capacity, or local authorities are notified for field response.
- Surface Overflow: Triggers immediate traffic control for public safety.
In regional drainage channels, alert thresholds prompt pump activation if available. If overtopping is projected or occurs, residents are evacuated to higher ground or upper floors.
Phase 3: Surface-Level Flooding Response
When surface inundation is detected via flood sensors and intersection CCTV cameras, localized response is coordinated by community leaders. The platform rapidly distinguishes between two scenarios:
- Localized Flooding with Available Capacity: Indicates inlet blockage or temporary accumulation. Water recedes post-rainfall or can be cleared manually.
- Flooding with Saturated Drainage: Confirms system overload. On-site teams manage traffic and report conditions to the platform for system-wide diagnostics.
This three-phase framework provides a scalable, data-driven approach to urban flood management, integrating fore-casting, real-time monitoring, and operational response to minimize flood risk and impact.
4. Discussion
The study implements an ensemble of technical solutions to identify potential flash flood events: (1) machine learning-based flood image classification using CCTV feeds, and (2) a real-time, multi-layered autonomous pumping equipment control and management system with predicting of drainage pipe flow depths. The discussion is structured into two parts, beginning with the machine learning method, followed by the pumping machinery approach.
4.1. Machine Learning Discussion
During experimentation, dataset collection and image classification errors were occasionally observed due to obstructions such as tree leaves, glass reflections, wet surfaces, and image blurriness caused by moisture, which some-times led to false flood detections. To enhance model robustness, images were collected from diverse scenarios featuring multiple flood-related characteristics, such as vehicle-induced water ripples and raindrop patterns. An iterative refinement process was adopted, in which misclassified or undetected images from each flooding event were incorporated into the training dataset for retraining. This adaptive learning approach progressively improved the model’s recognition accuracy and stability in real-time flood detection applications. In this time-stepping data assimilation procedure [51], each cycle involves comparing the previous model forecast with newly received observations, updating the model state accordingly, and then initiating a new forecast.
4.2. Pumping Machinery Discussion
In New Taipei City, a distinctive regional feature of its flood control infrastructure is the widespread installation of sliding floodgates (“horizontal gates”) at low-lying areas and key building entrances. This design is particularly suited to addressing the sudden flooding risks caused by heavy rainfall or typhoons in urban areas. It also takes into account the city’s densely packed spaces and numerous underground facilities, offering a more efficient flood prevention mechanism. These sliding gate systems are often integrated with automated sensors and remote-control functions, enhancing real-time responsiveness. As a result, they have become a unique urban flood prevention strategy in New Taipei City, showcasing a site-specific approach for highly urbanized regions facing extreme climate challenges.
Based on its terrain and urban development characteristics, New Taipei City has established a distributed drainage and pumping network densely across flood-prone hotspots, effectively reducing emergency response time. Particularly along the Tamsui River, Xindian River, and in areas such as Banqiao, Zhonghe, and Sanchong, the city has constructed smart pumping stations equipped with real-time rainfall and water level sensors, as well as electric control systems for automated operation. These stations are integrated into the “New Taipei City Smart Flood Prevention Platform”, allowing for remote monitoring and automatic activation, significantly improving drainage efficiency during short-duration intense rainfall events. Additionally, some pumping stations are combined with retention ponds located in underpasses and low-lying areas, serving dual functions of water detention and pumping. This demonstrates greater resilience and flexibility compared to traditional pumping facilities, making New Taipei City a leading example of smart pumping strategies in Taiwan.
In terms of the drainage system, New Taipei City’s approach involves guiding rainfall from the surface through roadside gutters and connecting pipes into the stormwater drainage network, and ultimately discharging it via pumping stations into the Tamsui River system. Since these pumping stations are affected by the tides of the Tamsui River, a combined floodgate and pump operation system has been developed to coordinate with tidal water levels. This differs from other regions, where rainwater is typically drained directly into rivers via roadside gutters or after passing through the stormwater drainage infrastructure.
Furthermore, New Taipei City implements localized pumping wells to alleviate flooding in low-lying areas. To ad-dress frequent water accumulation during sudden heavy rainfall in the areas such as Nanzai Ditch, the New Taipei City Water Resources Department has implemented a localized pumping well strategy that enhances drainage through mechanical assistance combined with gravity flow (URL: https://news.ltn.com.tw/news/life/breakingnews/4715776, accessed on 15 November 2025 in Traditional Chinese). Three flood-prone sites were each equipped with a pumping well and five mechanical-assisted gravity pumps, providing a total drainage capacity of 1 cms (equivalent to one ton of water per second).
By integrating mechanical pumping with gravity-based drainage, the new system significantly strengthens the city’s flood mitigation capacity and demonstrates an innovative approach to localized stormwater management. In other words, the approach exemplifies the effectiveness of integrating real-time hydrological monitoring, rainfall forecasting, and smart pumping control. Despite rainfall exceeding the stormwater system’s design standard, proactive water-level reduction and timely alerts enabled effective flood mitigation and reduced surface inundation duration.
5. Conclusions
The study develops and deploys an integrated platform for real-time pluvial flood monitoring, prediction, and responses, as summarized in Figure 16. The system comprises five core modules: (a) IoT-based sensing of rainfall, surface runoff, drainage networks, and pumping operations; (b) integration of existing and newly updated datasets, including radar composites and CCTV imagery; (c) AI and edge-computing functions for simulation, prediction, and inundation classification; (d) centralized big-data storage and analytics for hazard assessment at local and island-wide scales; and (e) interactive user interfaces for alerts, decision support, and evacuation guidance. Built on an SOA architecture and AI-IoT technologies interconnected via 4G/5G, the platform supports seamless data aggregation, analysis, and dissemination of real-time hydro-meteorological information.
To enhance flood response efficiency, New Taipei City’s Smart Flood Prevention Platform integrates water-related information systems across municipal agencies. The platform consolidates data from rainfall stations, water-level gauges, drainage sensors, roadside and surface flood sensors, intersection CCTVs, and pumping station operations, providing a comprehensive, unified view of flood conditions.
1. Automated real-time CCTV image classification
This module uses predefined or user-configurable parameters to automate the collection, analysis, and visualization of hydrological image datasets for CNN-based training, validation, and prediction. The system provides six-channel CCTV visualization, localized weather information, automated training and inference scheduling, and continuous dataset updates for both full retraining and incremental learning.
For machine learning experiment, a dataset of 15,662 images was extracted from Department of Transportation CCTV video streams and converted into individual samples by the Research Center team. Image classification models were developed using pre-trained CNN architectures—VGG19, ResNet-101V2, InceptionV3, and InceptionRes-NetV2—configured with the following hyperparameters: Adam optimizer, 30 epochs, dropout rate of 0.4, ImageNet pre-trained weights, learning rate of 0.0001, batch size of 32, and no early stopping.
Among the four models, InceptionV3 achieved the highest performance, with accuracy, precision, recall, and a F1 score. Prior studies similarly indicate that Inception architectures without residual connections can slightly outperform their residual counterparts [46,49], highlighting the value of model simplicity in urban flood-image classification research [20].
For continuous dataset enhancement, the CCTV flood-detection tool incorporates an automated dataset collection mechanism that stores newly captured images by class (six categories) and timestamp during each prediction cycle. This expanding dataset increases model robustness by incorporating diverse environmental conditions, thereby im-proving training and inference accuracy over time. Continuous updates enable the model to adapt to evolving flood pat-terns, while flexible configuration settings allow users to select modeling strategies according to resource availability and performance requirements. Additionally, the application automatically uploads potential flood alerts via LINE.
2. Real-time drainage and pumping system monitoring
This module integrates multi-source information, including drainage-network maps, surface-flooding sensors, pipe-flow depth gauges, rainfall measurements, and pumping-station operating status. The SOBEK hydrological model is incorporated to improve downstream flood forecasting and optimize sluicegate operation planning during typhoon events. All information is compiled within an automated interface that provides agencies with real-time references for coordinated flood control.
For real-time visualization and decision support, by automating data aggregation and visualization, the framework establishes a continuous, systematic monitoring mechanism that strengthens hydrological situational awareness and improves the timeliness of flood-management decisions. A key feature is the real-time six-panel visualization interface [11], as indicated in Figure 17, which presents essential hydrological and operational information, including:
(a) stormwater drainage pipe-flow depths; (b) surface-runoff water levels; (c) rainfall histograms; (d) pumping-machinery status and forebay water levels; (e) river-outlet water levels, and (f) CCTV imagery.
This intuitive layout enables engineers and decision-makers to rapidly assess rainfall intensity, drainage capacity, sur-face flooding, and pumping performance, supporting coordinated and effective flood-response operations. This incident highlights the effectiveness of the smart monitoring platform in managing short-duration, high-intensity rainfall. By integrating real-time sensor data into decision-making, the system shortened flood duration and reduced impacts, even under rainfall exceeding the stormwater system’s design standards.
Design and optimization of urban drainage infrastructure that considers climate change impacts and co-optimizes this with other objectives for a habitable city will become increasingly important in the future [5]. In the study, the system enhances disaster preparedness by automating inundation detection through machine-learning-based image classification and optimizing pumping operations to shorten response times and stagger peak flows. Its centralized data infra-structure supports cascading-hazard assessment while delivering timely warnings to both authorities and the public. By integrating ensemble modeling, remote sensing, and decision-support tools, the platform transforms climate-induced flood risks into opportunities for resilience.
Author Contributions
Conceptualization, S.H.Y., X.J.W., and S.L.H.; methodology, S.L.H., X.J.W. and S.H.Y.; software, S.L.H. and X.J.W.; validation, S.L.H., X.J.W., M.S.H., C.W.C., and S.H.Y.; writing—original draft preparation, S.L.H., X.J.W., D.L.C., and S.H.Y.; writing—review and editing, S.L.H. and D.L.C.; supervision, S.H.Y., M.S.H., C.W.C., D.R.S., J.H.P., and K.C.Y.
Funding
This research received no external funding.
Conflicts of Interest
The authors declare no conflict of interest.
References
- Himanshu Rai Goyal, Kamal Kumar Ghanshala, and Sachin Sharma, “Post flood management system based on smart IoT devices using AI approach”, Volume 46, Part 20, 2021, Pages 10411-10417. [CrossRef]
- Lihua Xiong, Lei Yan, Tao Du, Pengtao Yan, Lingqi Li, and Wen Tao Xu, “Impacts of Climate Change on Urban Extreme Rainfall and Drainage Infrastructure Performance: A Case Study in Wuhan City, China”, December 2018, Irrigation and Drainage 68(2). [CrossRef]
- Sani G. D/iya, Muhd BarzaniGasim, Mohd EkhwanToriman, Musa G. Abdullahi, “FLOODS IN MALAYSIA Historical Reviews, Causes, Effects and Mitigations Approach”, International Journal of Interdisciplinary Research and Innovations ISSN 2348-1226 (online) Vol. 2, Issue 4, pp: (59-65), Month: October—December 2014, Available at: www.researchpublish.com.
- Gangani Dharmarathn, A.O. Waduge, Madhusha Bogahawaththa, Upaka Rathnayake, D.P.P. Meddage, “Adapting Cities to the Surge: A Comprehensive Review of Climate-Induced Urban Flooding”, April 2024, Results in Engineering 22(19):1-15. [CrossRef]
- K. Arnbjerg-Nielsen, P. Willems, J. Olsson, S. Beecham, A. Pathirana, I. Bülow Gregersen, H. Madsen and V.-T.-V. Nguyen,”Impacts of climate change on rainfall extremes and urban drainage systems”, July 2013, Water Science & Technology 68(1):16-28. [CrossRef]
- Dianlei Xu, Tong Li, Yong Li, Xiang Su, Sasu Tarkoma, Tao Jiang, Jon Crowcroft, Pan Hui; Edge Intelligence: Architectures, Challenges, and Applications; Corpus ID: 219635841; Published 26 March 2020 Computer Science arXiv: Networking and Internet Architecture.
- Md. Sazzadur Rahman, Tapotosh Ghosh, Nahid Ferdous Aurna, M. Shamim Kaiser, Mehrin Anannya, A.S.M. Sanwar Hosen, “Machine learning and internet of things in industry 4.0: A review”, Measurement: Sensors, Volume 28, August 2023, 100822. [CrossRef]
- Abid S. K., Sulaiman N., Chan S. W., Nazir U., Abid M., Han H., Ariza-Montes A., and Vega-Muñoz A., 2021, Toward an Integrated Disaster Management Approach: How Artificial Intelligence Can Boost Disaster Management, Sustainability, 13(22), 12560; [CrossRef]
- Sun, W, Bocchini, P, and Davison, B.D., 2020, Applications of artificial intelligence for disaster management. Natural Hazards, 103, 2631–2689, . [CrossRef]
- Joao Giao, Artem A. Nazarenko, Fernando Luis-Ferreira, Diogo Gonçalves and Joao Sarraipa, “A Framework for Service-Oriented Architecture (SOA)-Based IoT Application Development”, Processes 2022, 10, 1782. [CrossRef]
- Sheng-Hsueh Yang, Sheau-Ling Hsieh, Xi-Jun Wang, Deng-Lin Chang, Shao-Tang Wei, De-Rem Song, Jyh Hour Pan, and Keh-Chia Yeh, “Adaptive Pluvial Flood Disaster Management in Taiwan: Infrastructure and IoT Technologies”, Water 2025, 17(15), 2269; [CrossRef]
- Shashikant Nishant Sharma and Dauda Ayuba, “Nature Based Solutions to Prevent Urban Flooding Book”, February 2024. [CrossRef]
- Yi Liu, Zhaoshun Xia, Hongying Deng and Shuihua Zheng, “Two-Stage Hybrid Model for Efficiency Prediction of Centrifugal Pump”, Sensors 2022, 22(11), 4300; [CrossRef]
- Chih-Chiang Wei, Nien-Sheng Hsu, Chien-Lin Huang, “Two-Stage Pumping Control Model for Flood Mitigation in Inundated Urban Drainage Basins”, Water Resources Management 28(2) December 2013;. [CrossRef]
- Ke Li, Yanping Wang, Xiujuan Fan, “Control system design of the pumping station”, IOP Conf. Series: Materials Science and Engineering 394 (2018) 032129. [CrossRef]
- M. E. Karar, M. F. Al-Rasheed, A. F. Al-Rasheed and Omar Reyad, “IoT and Neural Network-Based Water Pumping Control System for Smart Irrigation”, Inf. Sci. Lett. 9, No. 2, 107-112 (2020) (Information Sciences Letters);/www.naturalspublishing.com/Journals.asp.
- SOBEK (Deltares), Available online: https://www.deltares.nl/en/software/sobek/(accessed on 29 November 2025).
- Punit Kumar Bhola, Bhavana B. Nair, Jorge Leandro, Sethuraman N. Rao and Markus Disse, “Flood inundation forecasts using validation data generated with the assistance of computer vision”,.
- 19. Journal of Hydroinformatics (2019) 21 (2): 240–256. [CrossRef]
- Kanishk Lohumi and Sudip Roy, “Automatic Detection of Flood Severity Level from Flood Videos using Deep Learning Models”, 2018 5th International Conference on Information and Communication Technologies for Disaster Management (ICT-DM).
- Abdirahman Osman Hashi, Abdullahi Ahmed Abdirahman, Mohamed Abdirahman Elmi, Siti Zaiton Mohd Hashi, Octavio Ernesto Romo Rodriguez, “A Real-Time Flood Detection System Based on Machine Learning Algorithms with Emphasis on Deep Learning”, International Journal of Engineering Trends and Technology Volume 69 Issue 5, 249-256, May 2021 ISSN: 2231—5381/doi:10.14445/22315381/IJETT-V69I5P232.
- Pallavi Jain, Bianca Schoen-Phelan, Robert Ross, “Automatic flood detection in SentineI-2 images using deep convolutional neural networks”, SAC ‘20: Proceedings of the 35th Annual ACM Symposium on Applied Computing, March 2020, Pages 617–623, . [CrossRef]
- Pally, R and Samadi, S., “Application of Image Processing and Big Data Science for Flood Label Detection’, European Geosciences Union, 2021-04-30, https://par.nsf.gov/servlets/purl/10270717.
- Jaku Rabinder Rakshit Pally, “Application of image processing and convolutional neural networks for flood image classification and semantic segmentation”, Thesis (Jan 1, 2023)Muhammed Sit, Bekir Z. Demiray, Zhongrun Xiang, Gregory J. Ewing, Yusuf Sermet, Ibrahim Demir, “A Comprehensive Review of Deep Learning Applications in Hydrology and Water Resources”, Water Science and Technology (2020) 82 (12): 2635–2670. [CrossRef]
- Muhammad Alam, Jian-Feng Wang, Cong Guangpei, LV Yunrong, Yuanfang Chen, “Convolutional Neural Network for the Semantic Segmentation of Remote Sensing Images”, Mobile Networks & Applications (2021) 26:200–215, . [CrossRef]
- Roberto Bentivoglio, Elvin Isufi, Sebastian Nicolaas Jonkman, and Riccardo Taormina, “Deep Learning Methods for Flood Mapping: A Review of Existing Applications and Future Research Directions”, Hydrology Earth System Science, 26, 4345–4378, 2022 . [CrossRef]
- Ghobadi, F. and Kang, D., “Application of Machine Learning in Water Resources Management: A Systematic Literature Review”, Water 2023, 15, 620. [CrossRef]
- C. Thirumarai Selvi and S. Kalieswari, “Convolutional Neural Network Based Flood Detection Using Remote sensing images”, EasyChair Preprint no. 2235, December, 2019. https://easychair.org › publications › preprint › CSNF.
- Deep Residual Learning for Image Recognition Kaiming He Xiangyu Zhang Shaoqing Ren Jian Sun Microsoft Research {kahe, v-xiangz, v-shren, jiansun}@microsoft.com.
- Nur Atirah Muhadi, Ahmad Fikri Abdullah, Siti Khairunniza Bejo, Muhammad Razif Mahadi and Ana Mijic, Deep Learning Semantic Segmentation for Water Level Estimation Using Surveillance Camera”, Appl. Sci. 2021, 11, 9691. [CrossRef]
- Cem Sazara, Mecit Cetin and Khan M. Iftekharuddin, Detecting floodwater on roadways from image data with handcrafted features and deep transfer learning, 2019 IEEE Intelligent Transportation Systems Conference (ITSC) Auckland, NZ, October 27-30, 2019.
- Xiao-Xue Li, Dan Li, Wei-Xin Ren, and Jun-Shu Zhang, “Loosening Identification of Multi-Bolt Connections Based on Wavelet Transform and ResNet-50 Convolutional Neural Network”, Sensors 2022, 22, 6825. [CrossRef]
- Rikiya Yamashita, Mizuho Nishio, Richard Kinh Gian Do and Kaori Togashi, “Convolutional neural networks: an overview and application in radiology”, Insights into Imaging (2018) 9:611–629 . [CrossRef]
- Thaer Falahi, Ghalia Nassreddine, Joumana Younis, “Detecting Data Outliers with Machine Learning”, Al-Salam Journal for Engineering and Technology, Vol. 2 No. 2 (May, 2023) p. 152-164. [CrossRef]
- Leiyu Chen, Shaobo Li, Qiang Bai, Jing Yang, Sanlong Jiang and Yanming Miao, “Review of Image Classification Algorithms Based on Convolutional Neural Networks”, Remote Sens. 2021, 13, 4712. [CrossRef]
- Mohammad Mustafa Taye, “Theoretical Understanding of Convolutional Neural Network:Concepts, Architectures, Applications, Future Directions”, Computation 2023, 11, 52. [CrossRef]
- LoRa; available online: https://lora.readthedocs.io/en/latest/(accessed on 29 November 2025).
- Yaw-Wen Kuo, Wei-Ling Wen, Xue-Fen Hu, Ying-Ting Shen and Shen-Yun Miao, “A LoRa-Based Multisensor IoT Platform for Agriculture Monitoring and Submersible Pump Control in a Water Bamboo Field”, Processes 2021, 9, 813. [CrossRef]
- AT Commands Examples Examples for u-blox cellular modules Application Note, www.u-blox.com, UBX-13001820—R12.
- RESTful web API design, available online: https://learn.microsoft.com/en-us/azure/architecture/best-practices/api-design (accessed on 29 November 2025).
- Introducing JSON; available online: https://www.json.org/json-en.html (accessed on 29 November 2025).
- Shiang-Jen Wu, Chih-Tsu Hsu, Jhih-Cyuan Shen and Che-Hao Chang, “Modeling the 2D Inundation Simulation Based on the ANN-Derived Model with Real-Time Measurements at Roadside IoT Sensors”, Water 2022, 14(14), 2189; [CrossRef]
- Deng-Lin Chang, Sheng-Hsueh Yang, Sheau-Ling Hsieh, Hui-Jung Wang and Keh-Chia Yeh, “Artificial Intelligence Methodologies Applied to Prompt Pluvial Flood Estimation and Prediction”, Water 2020, 12(12), 3552; [CrossRef]
- Harlan H. Bengtson, Spreadsheet Use for Partially Full Pipe Flow Calculations, Continuing Education and Development, Inc. 9 Greyridge Farm Court Stony Point, NY 10980.
- K. Simonyan and A. Zisserman, “Very deep convolutional networks for large-scale image recognition”, CoRR, vol. abs/1409.1556, 2014.
- K. He, X. Zhang, S. Ren, and J. Sun. Deep residual learning for image recognition. In Proceedings of the IEEE conference on computer vision and pattern recognition, pages 770–778, 2016.
- Jashila Nair Mogan, Chin Poo Lee, Kian Ming Lim and Kalaiarasi Sonai Muthu, “VGG16-MLP: Gait Recognition with Fine-Tuned VGG-16 and Multilayer Perceptron”, Appl. Sci. 2022, 12, 7639. [CrossRef]
- Muhammad Shafiq and Zhaoquan Gu, “Deep Residual Learning for Image Recognition: A Survey”, Appl. Sci. 2022, 12, 8972. [CrossRef]
- Christian Szegedy, Sergey Ioffe, Vincent Vanhoucke, and Alex Alemi, “Inception-v4, Inception-ResNet and the Impact of Residual Connections on Learning”, AAAI’17: Proceedings of the Thirty-First AAAI Conference on Artificial Intelligence, February 2017 Pages 4278–4284.
- Hamidreza Mosaffa, Mojtaba Sadeghi, Iman Mallakpour, Mojtaba Naghdyzadegan Jahromi, and Hamid Reza Pourghasemi, “Application of machine learning algorithms in hydrology”, Computers in Earth and Environmental Sciences, Artificial Intelligence and Advanced Technologies in Hazards and Risk Management, 2022, Pages 585-591.
- Ezio Todini, PierPaolo Alberoni, Michael Butts, Chris Collier. Rahman Khatibi, Paul Samuels, Albrecht Weerts; ACTIF Best Practice Paper—Understanding and Reducing Uncertainty in Flood Forecasting; International conference on innovation, advances and implementation of flood forecasting technology, Tromsø, Norway, October 2005 Conference Papers.
Figure 1.
Overall architecture of the study.
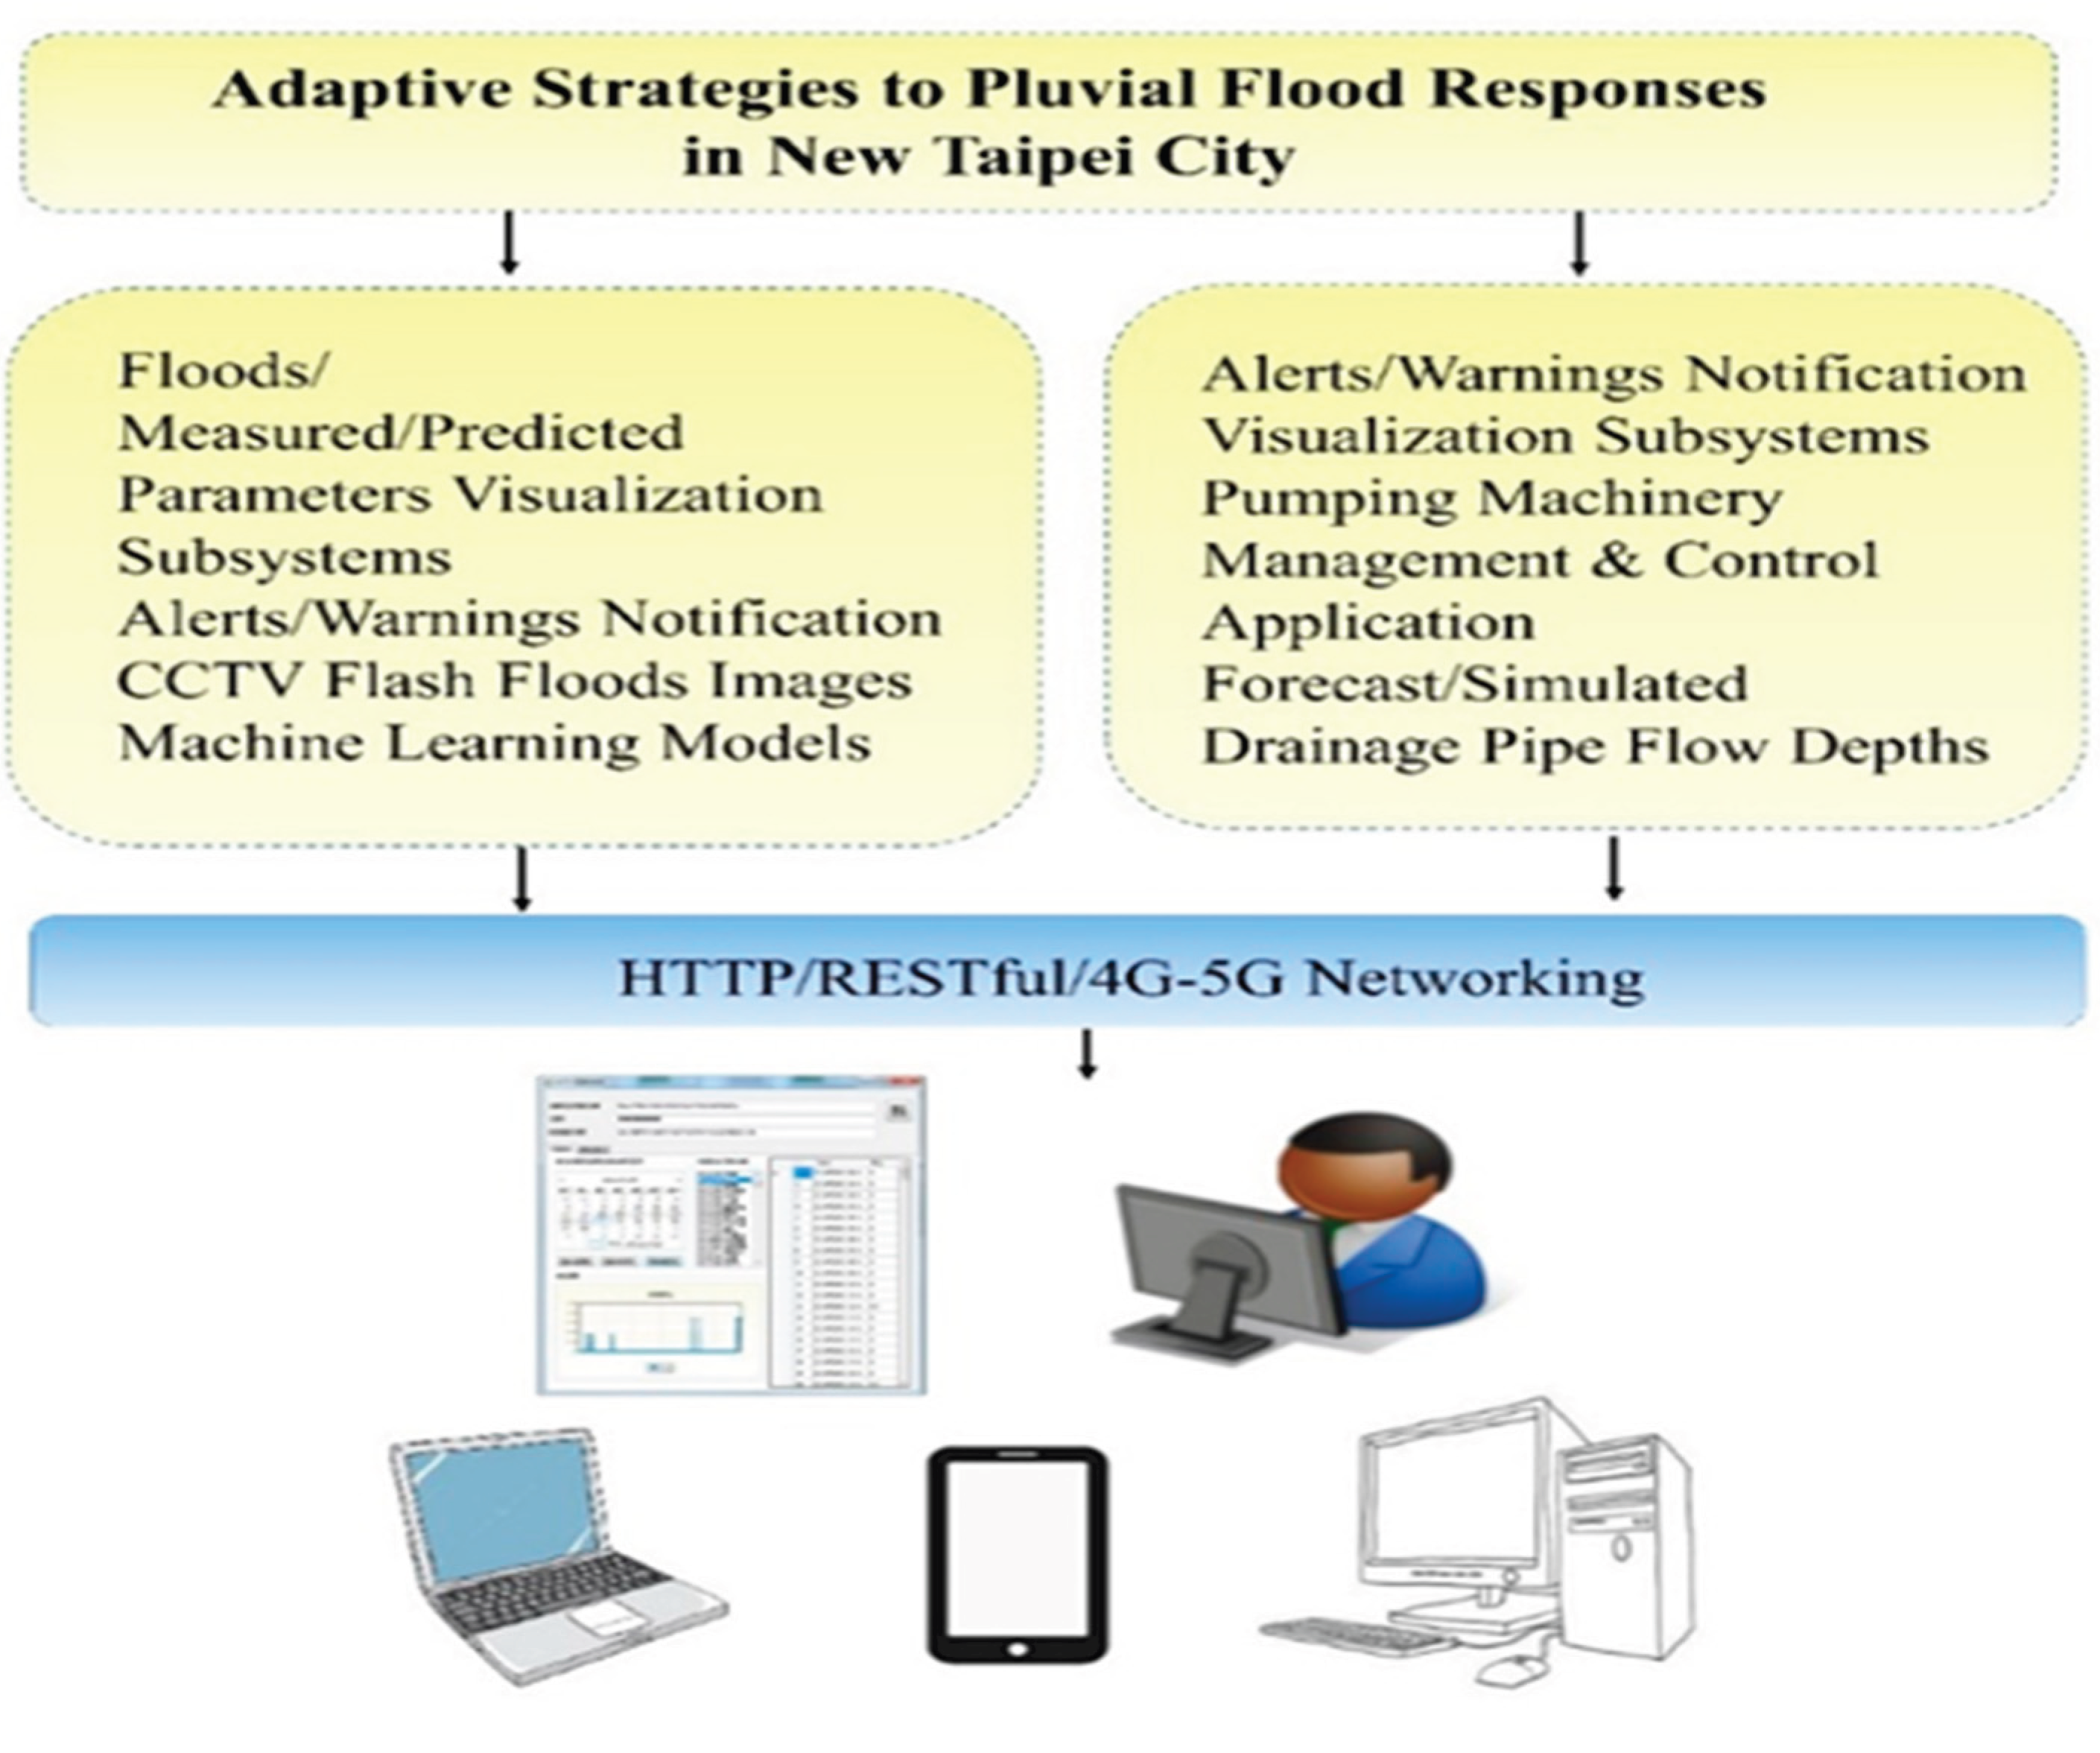
Figure 2.
CNN flooding images classification methodologies.
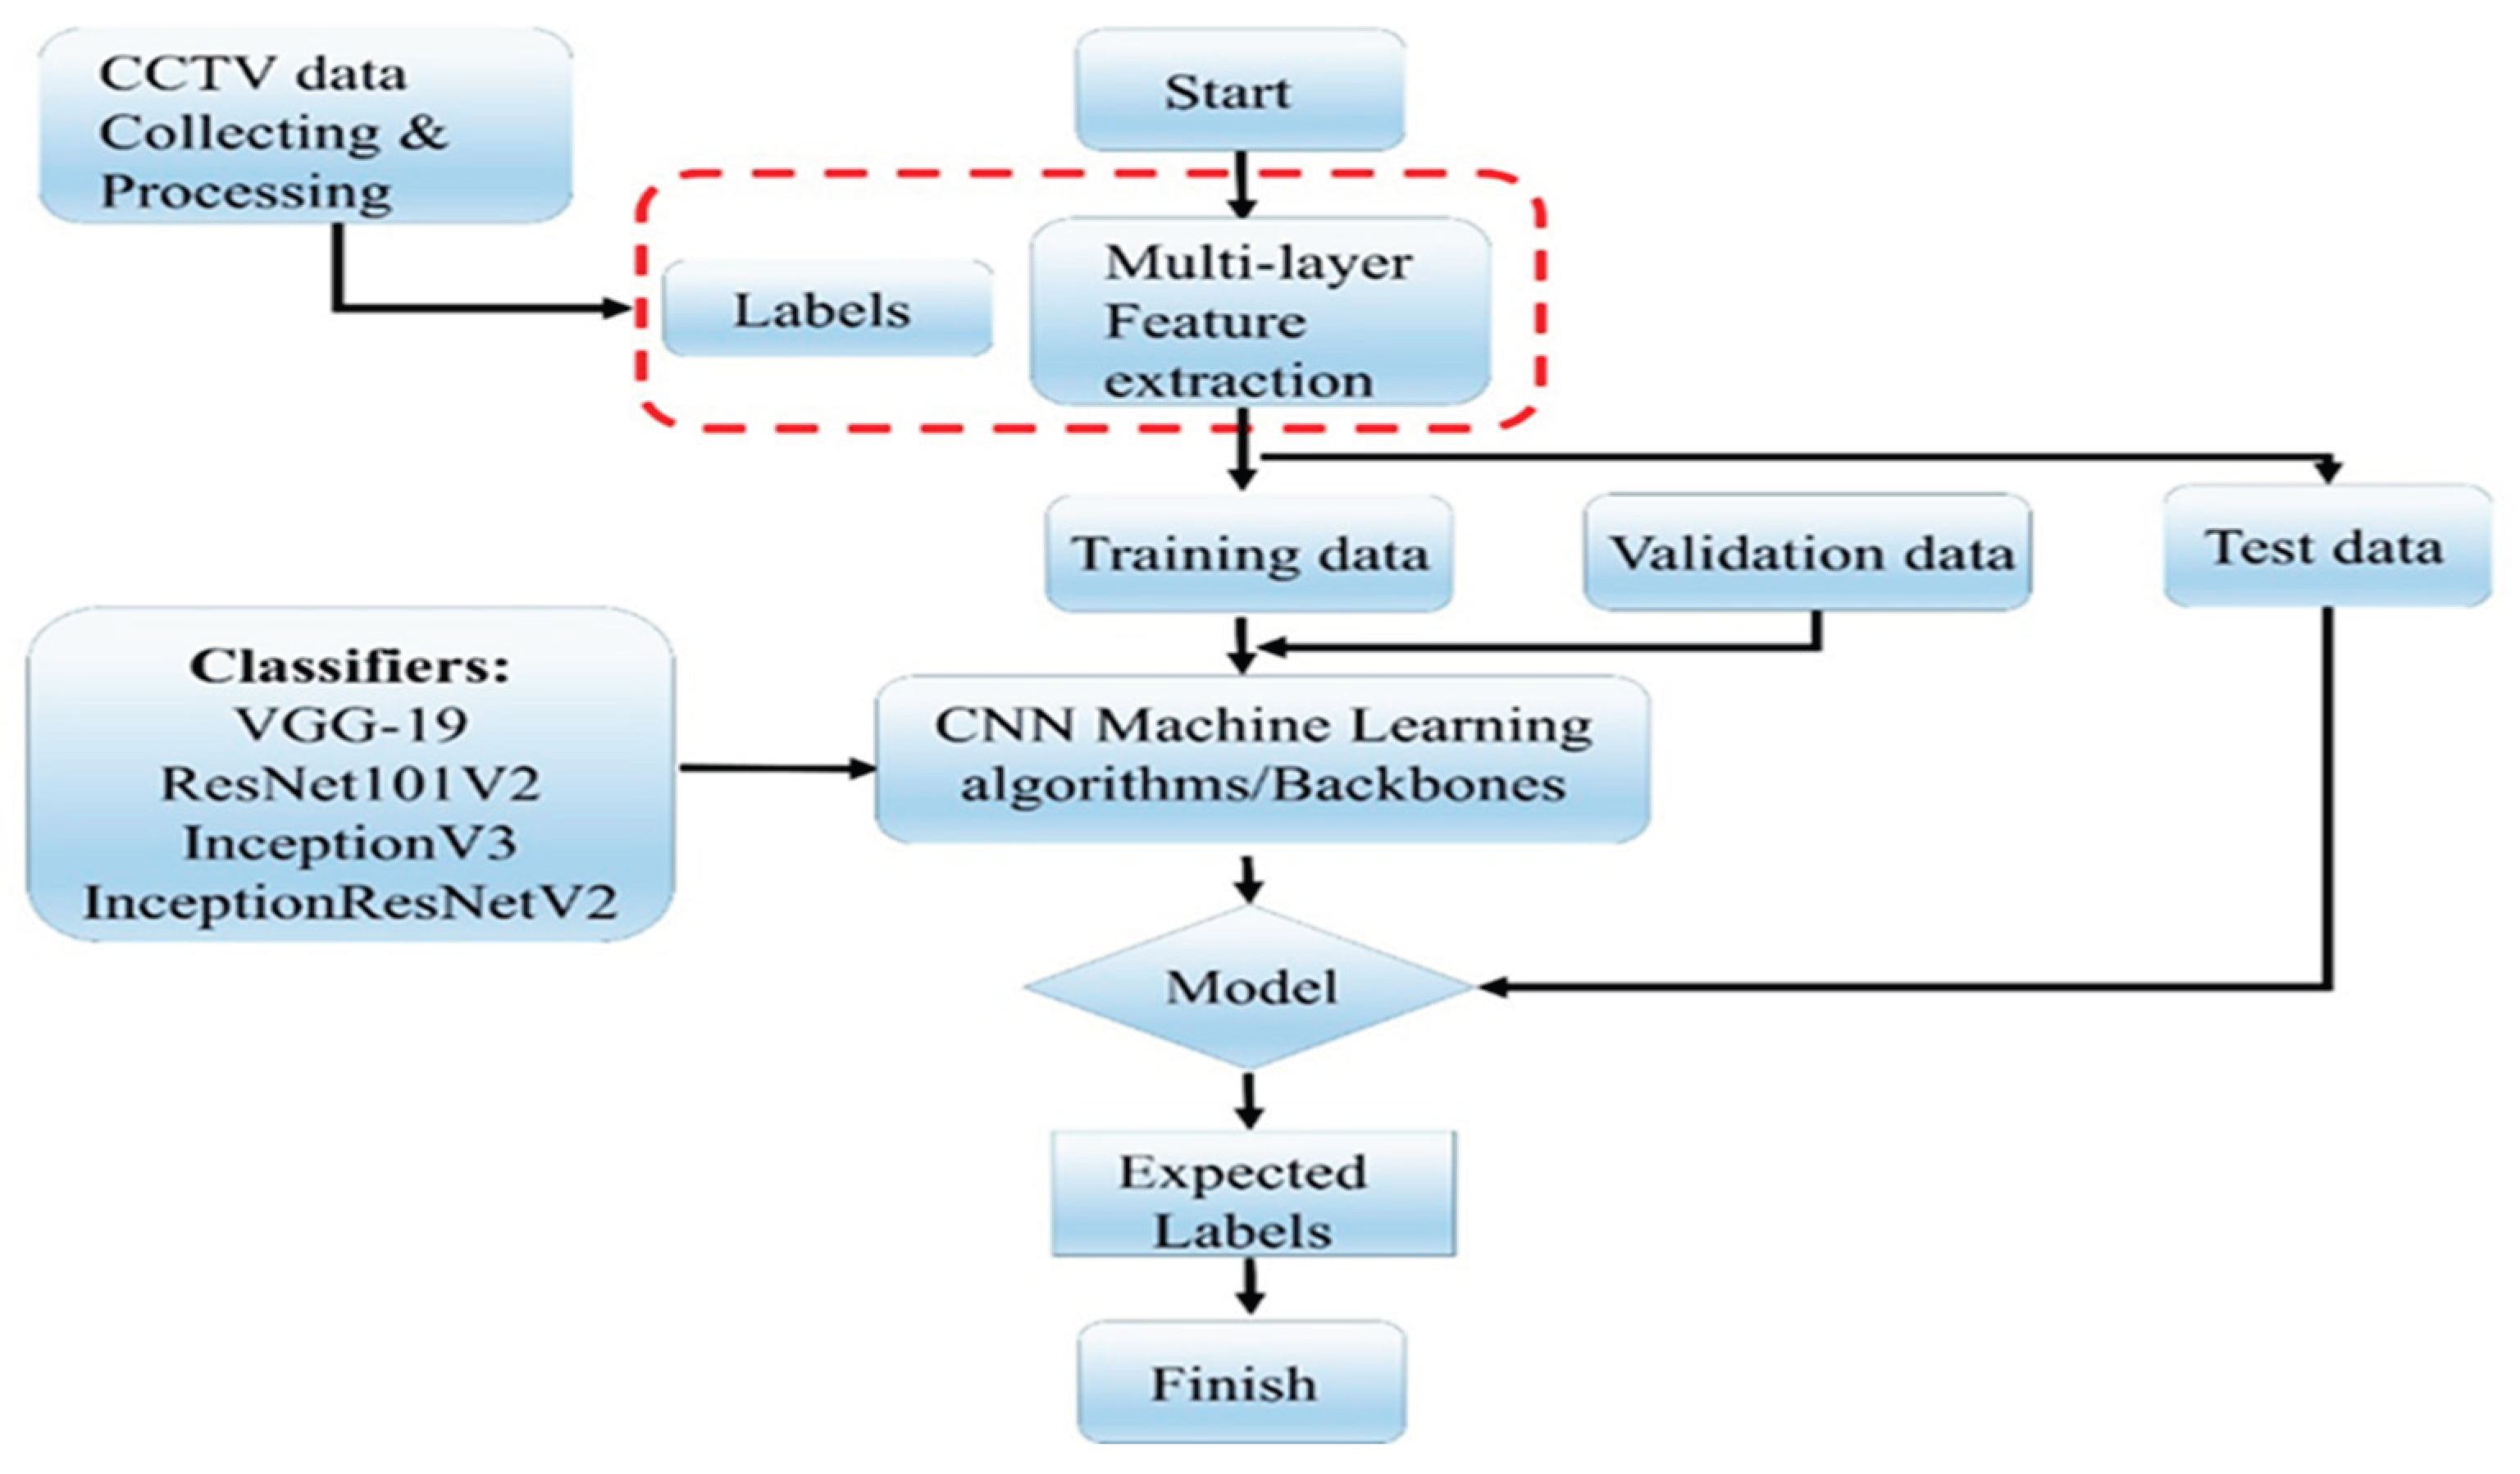
Figure 3.
Pumping machinery control and management application architecture and components.
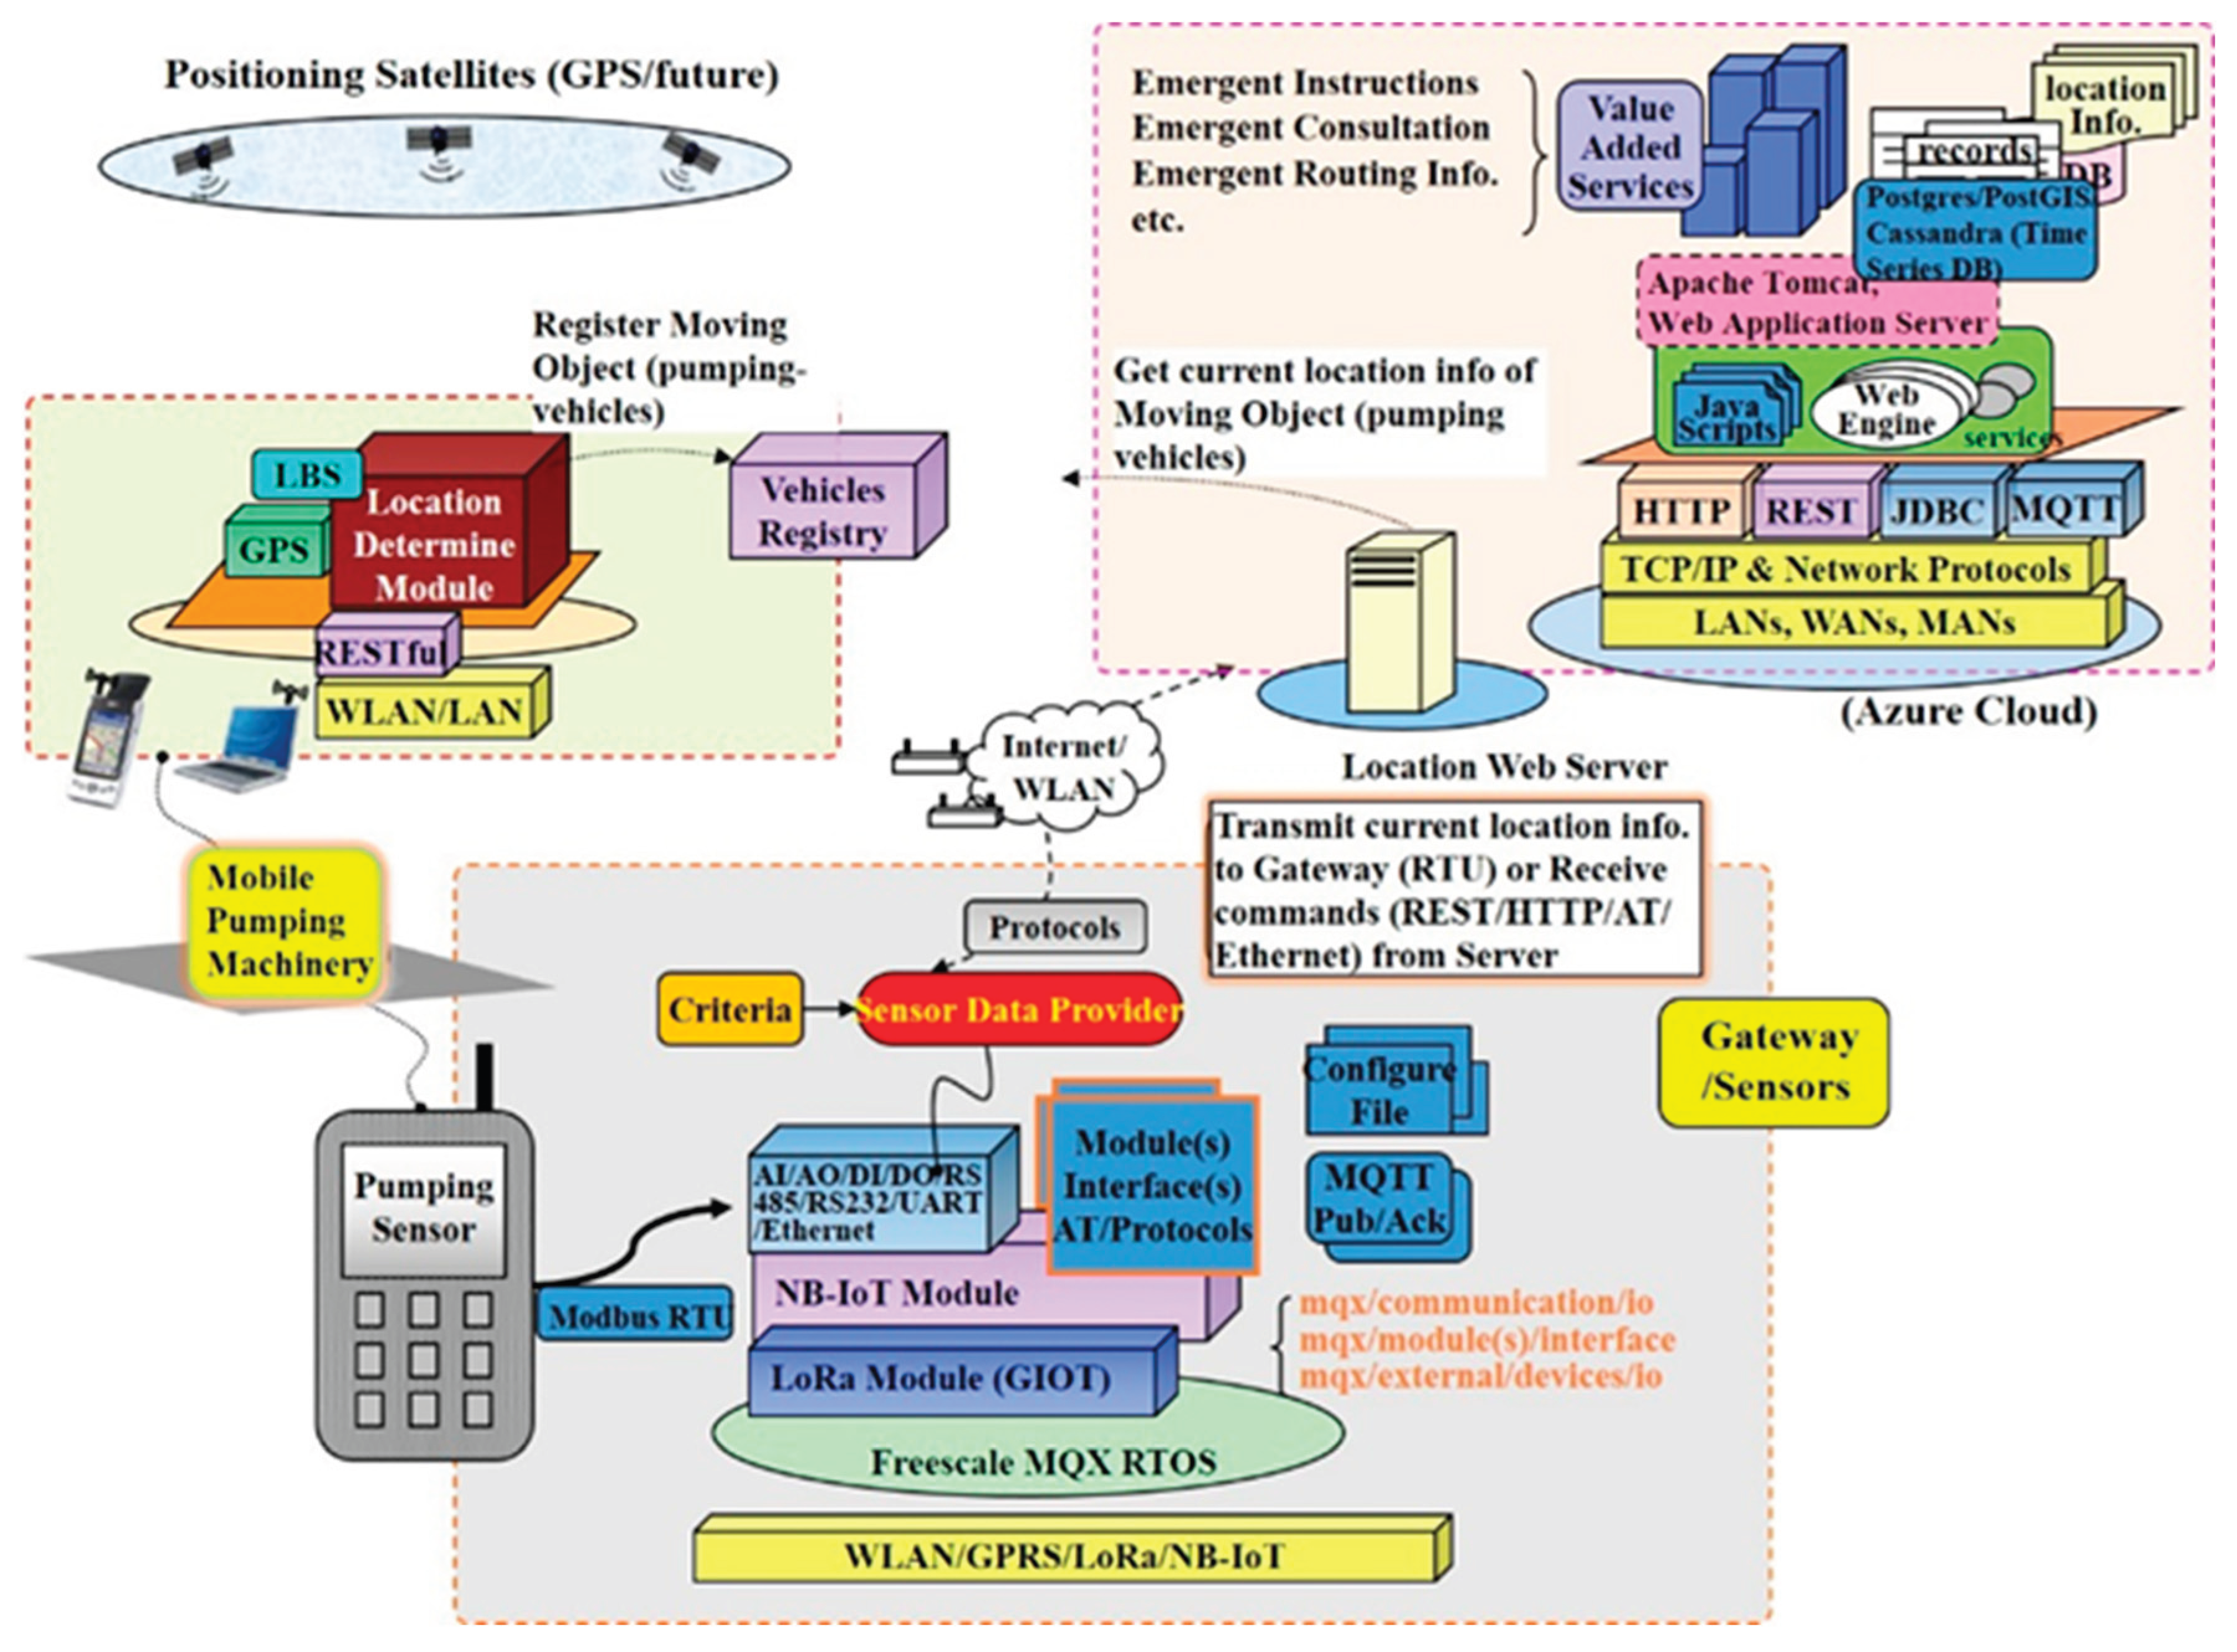
Figure 4.
Subsurface drainage networks and simulated pipe flow depths under varying rainfall scenarios.
Figure 4.
Subsurface drainage networks and simulated pipe flow depths under varying rainfall scenarios.
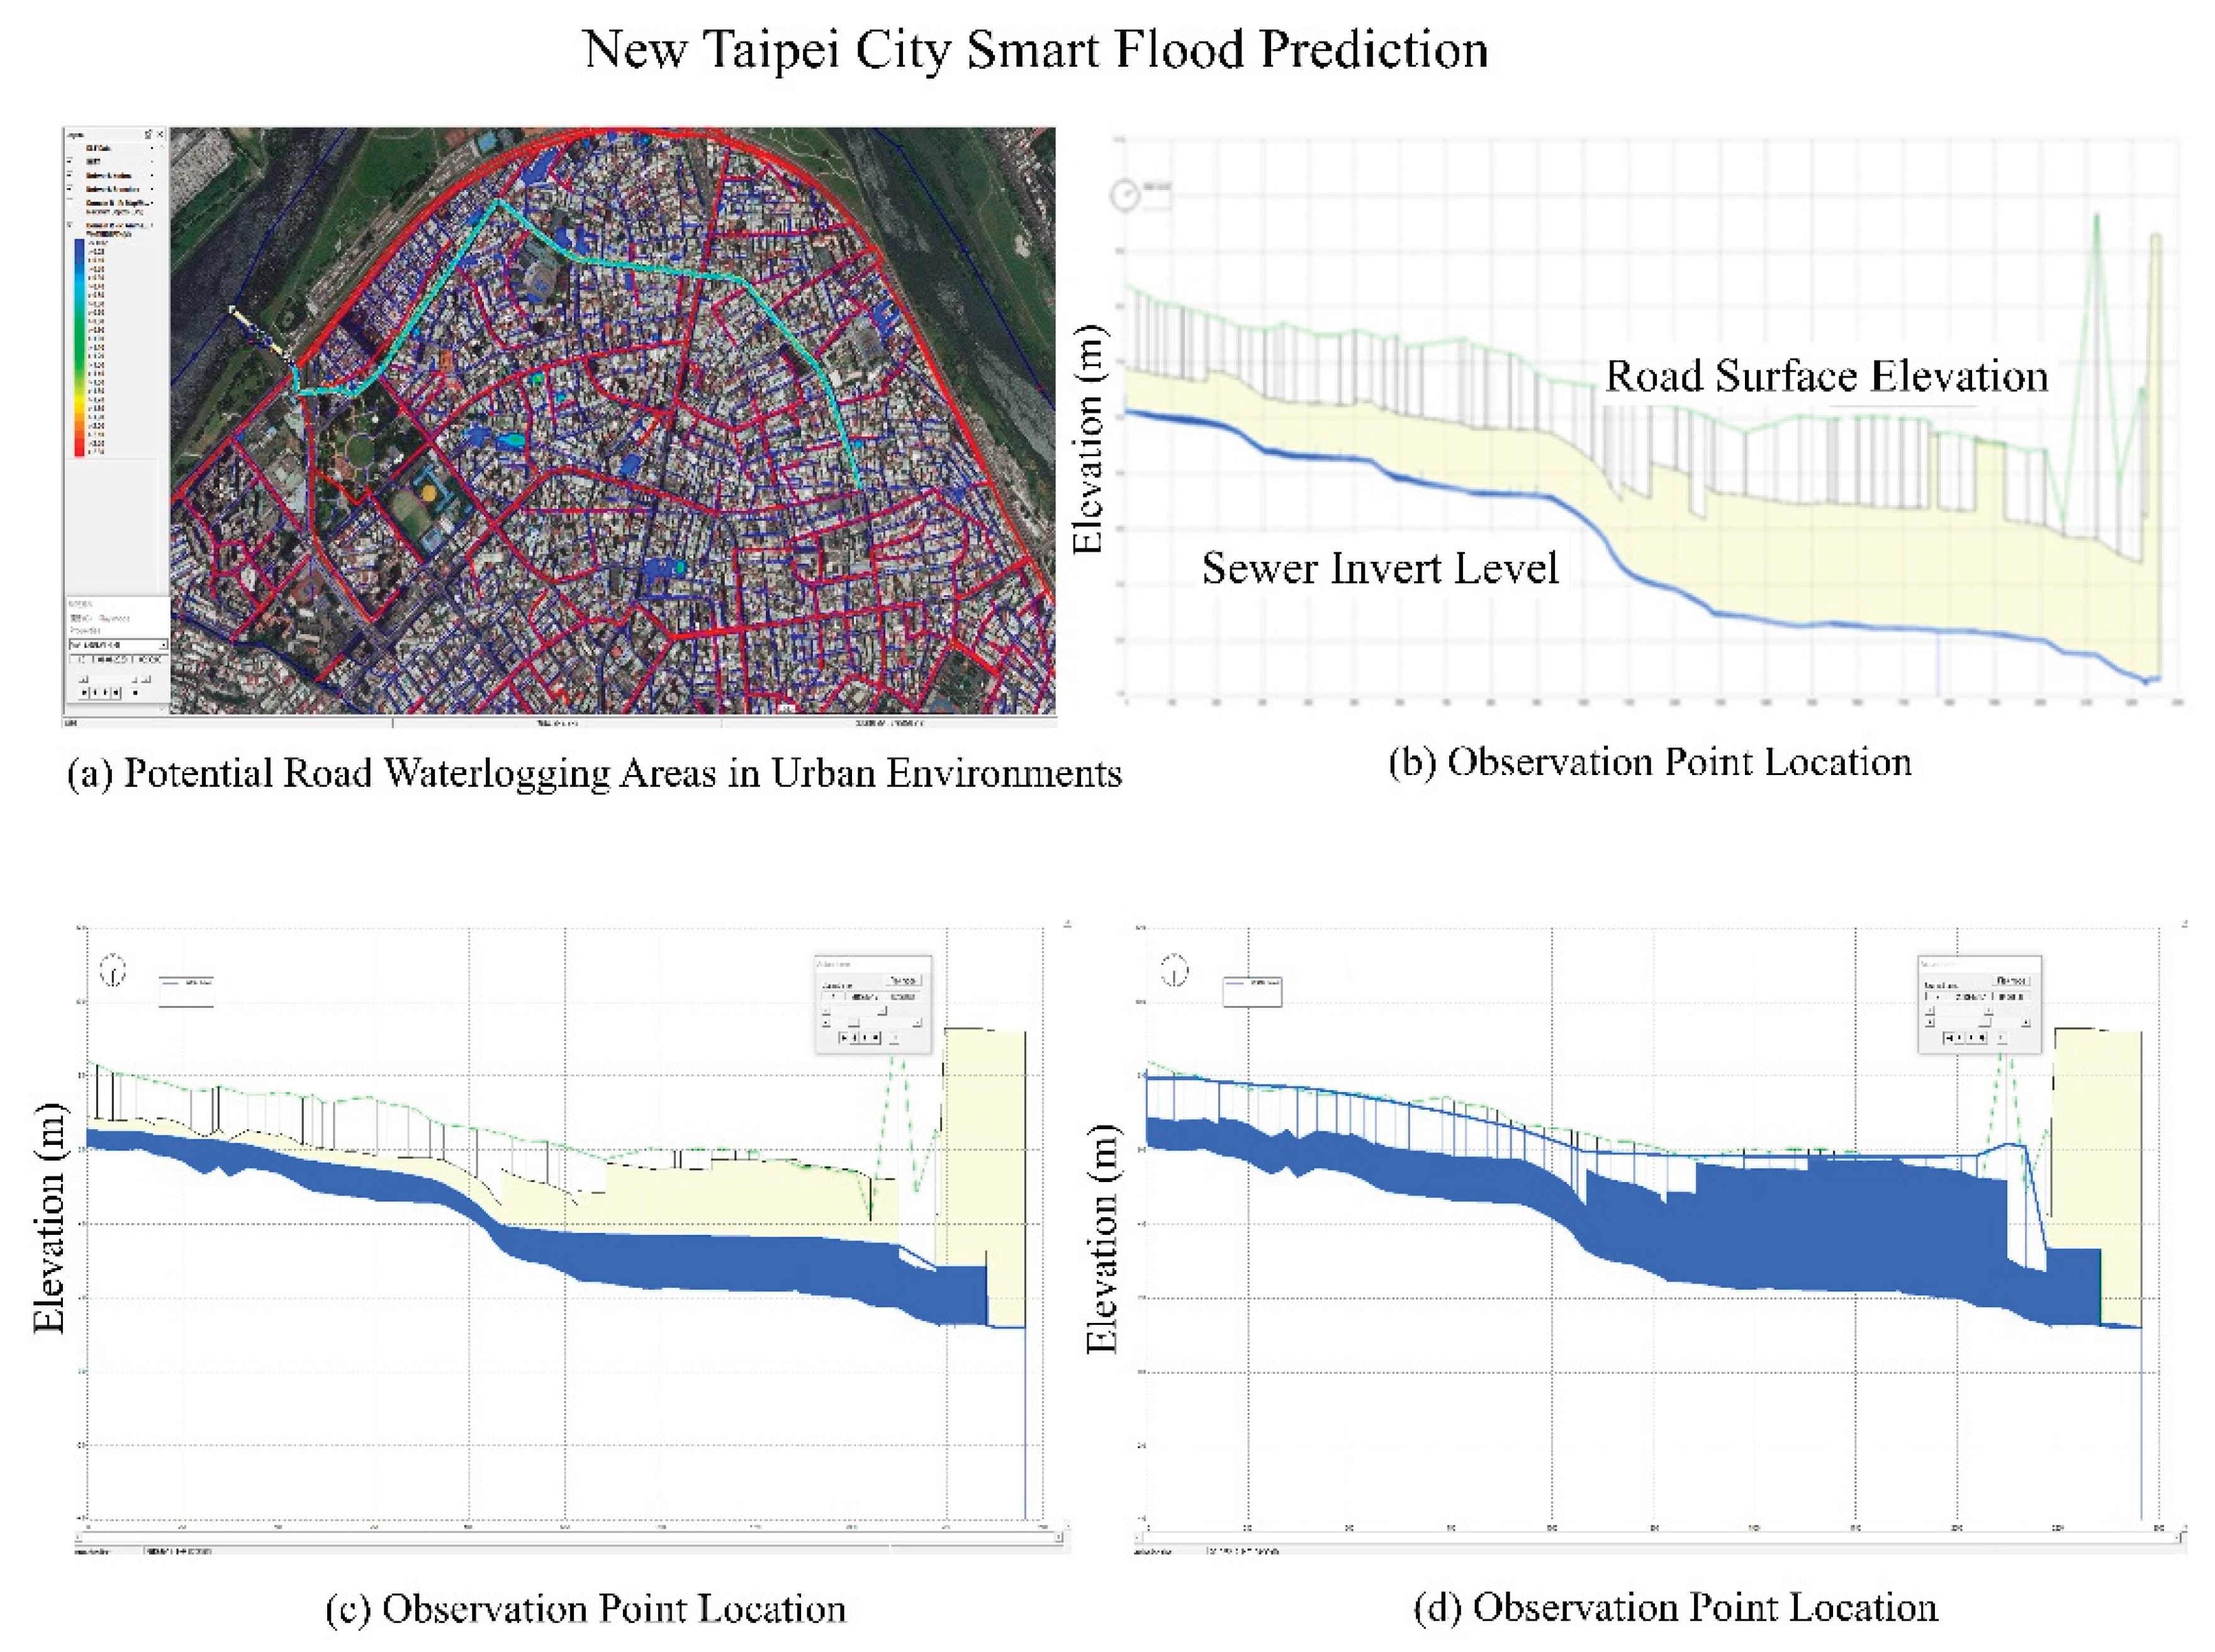
Figure 6.
Comparison of training accuracy and loss of the four CNN backbone models in the study.
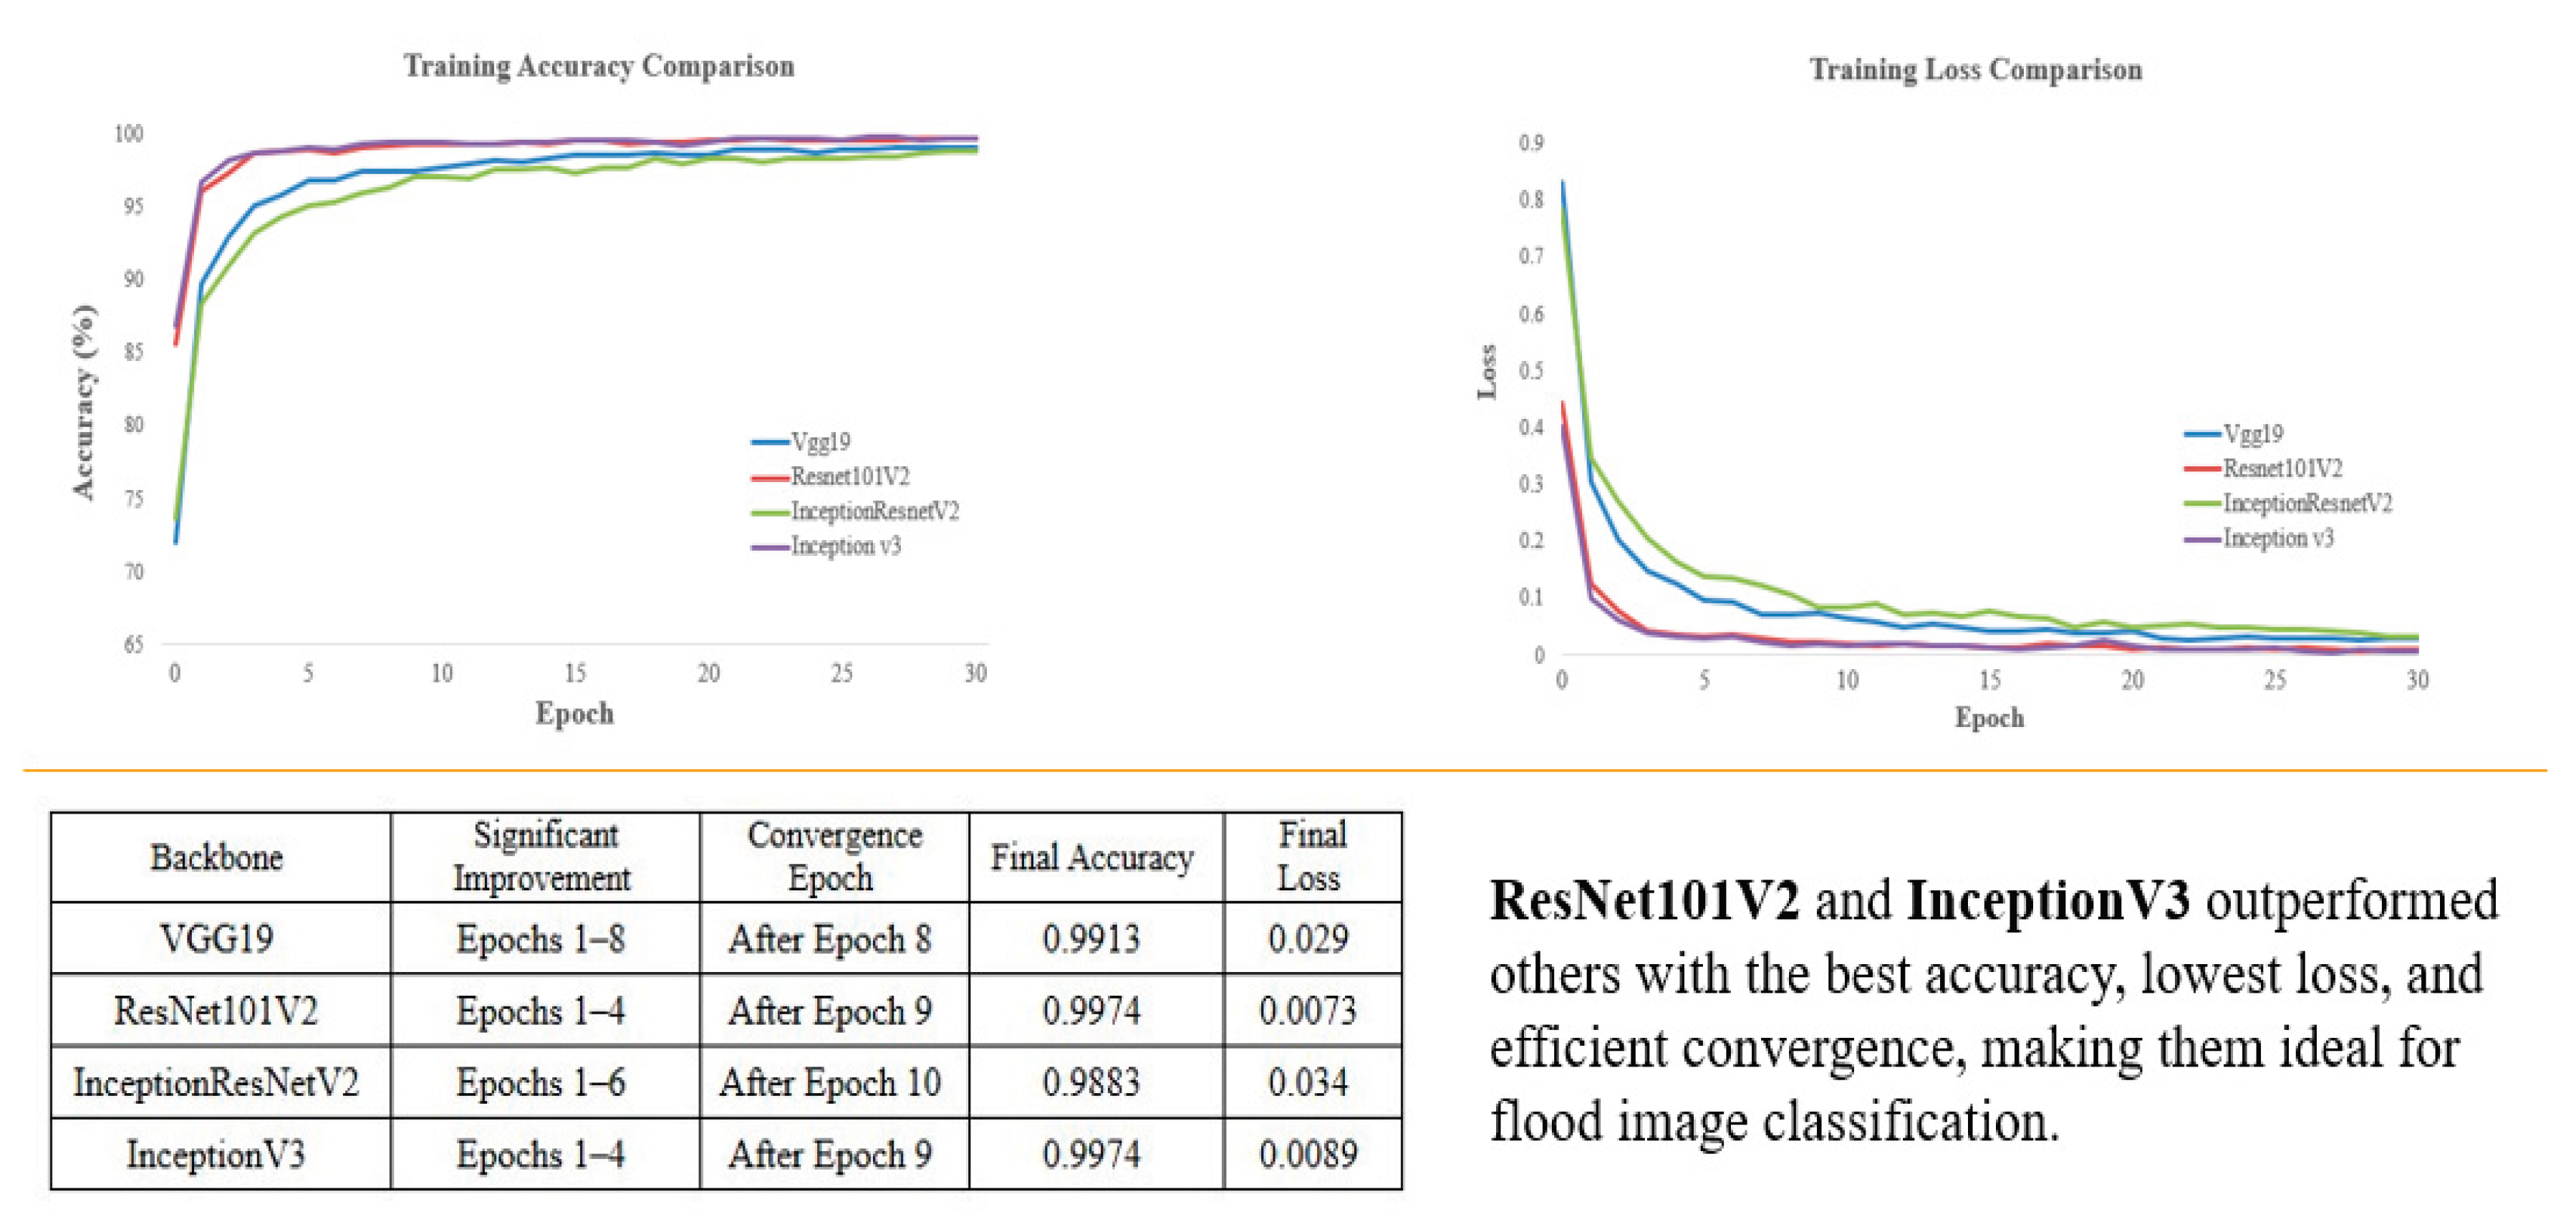
Figure 5.
Summary of intelligent pump operating algorithms and associated scenarios.
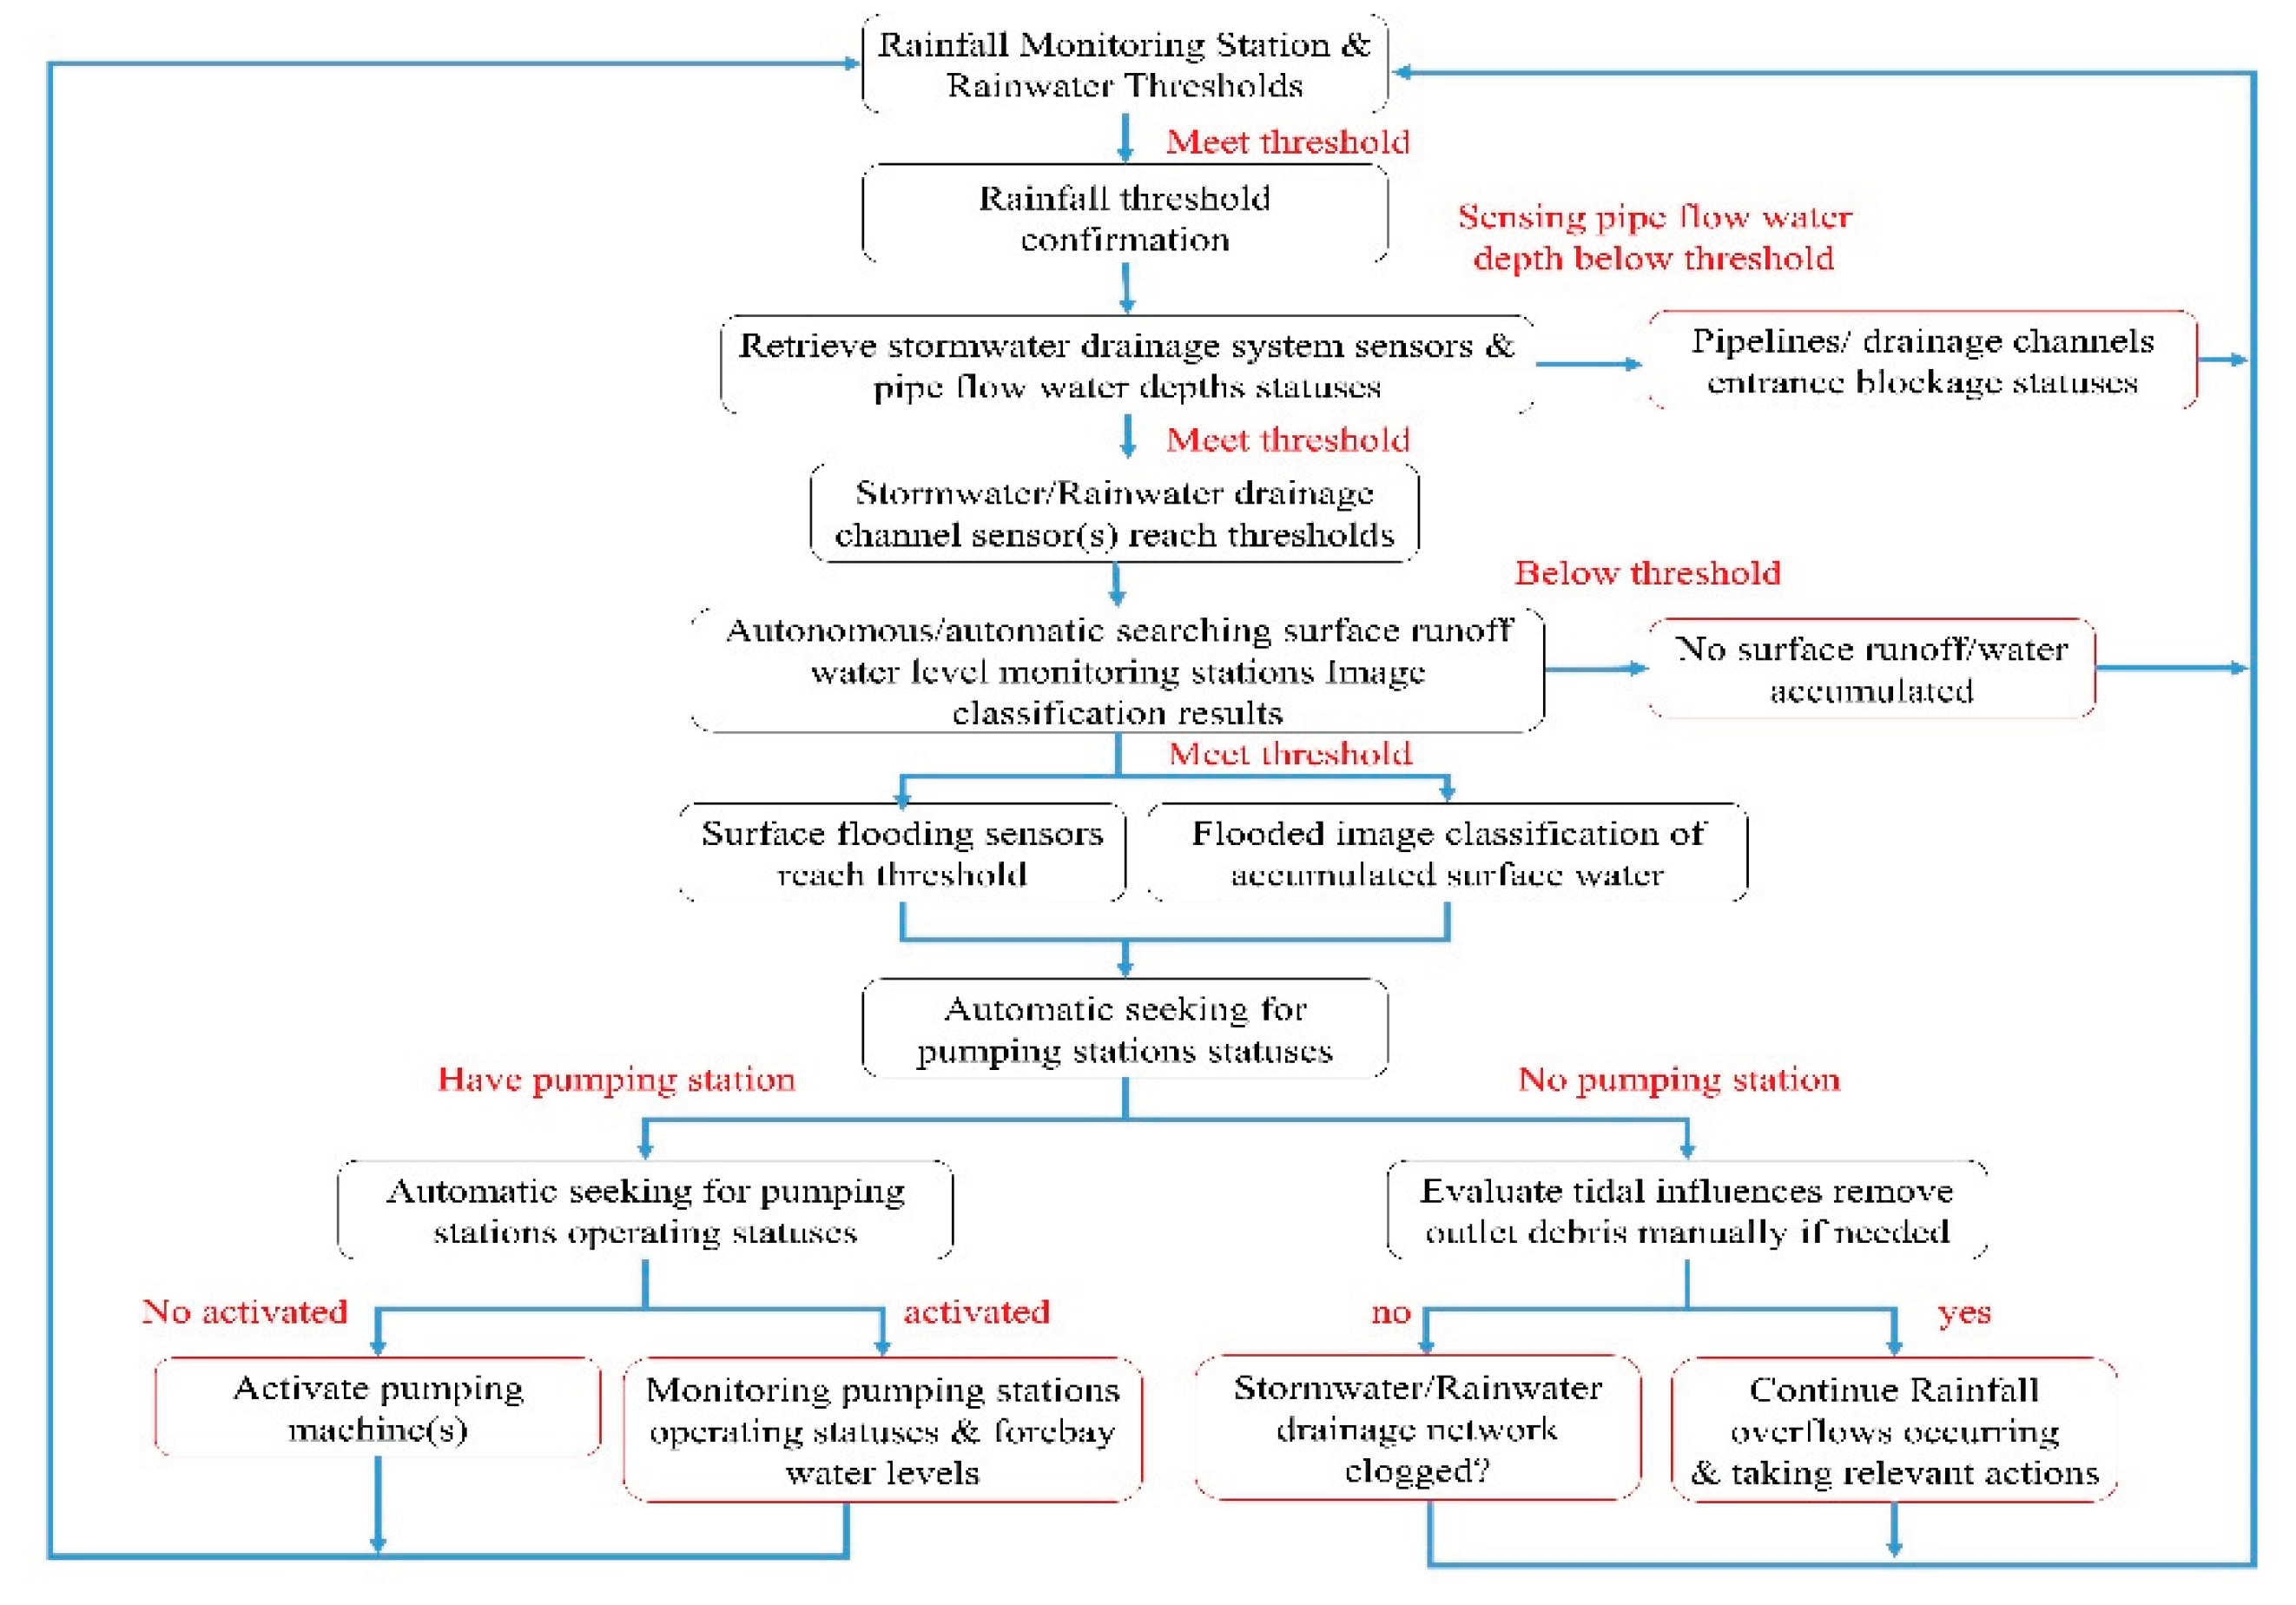
Figure 7.
Comparative Analysis of Training Times for Each CNN Backbone Model.
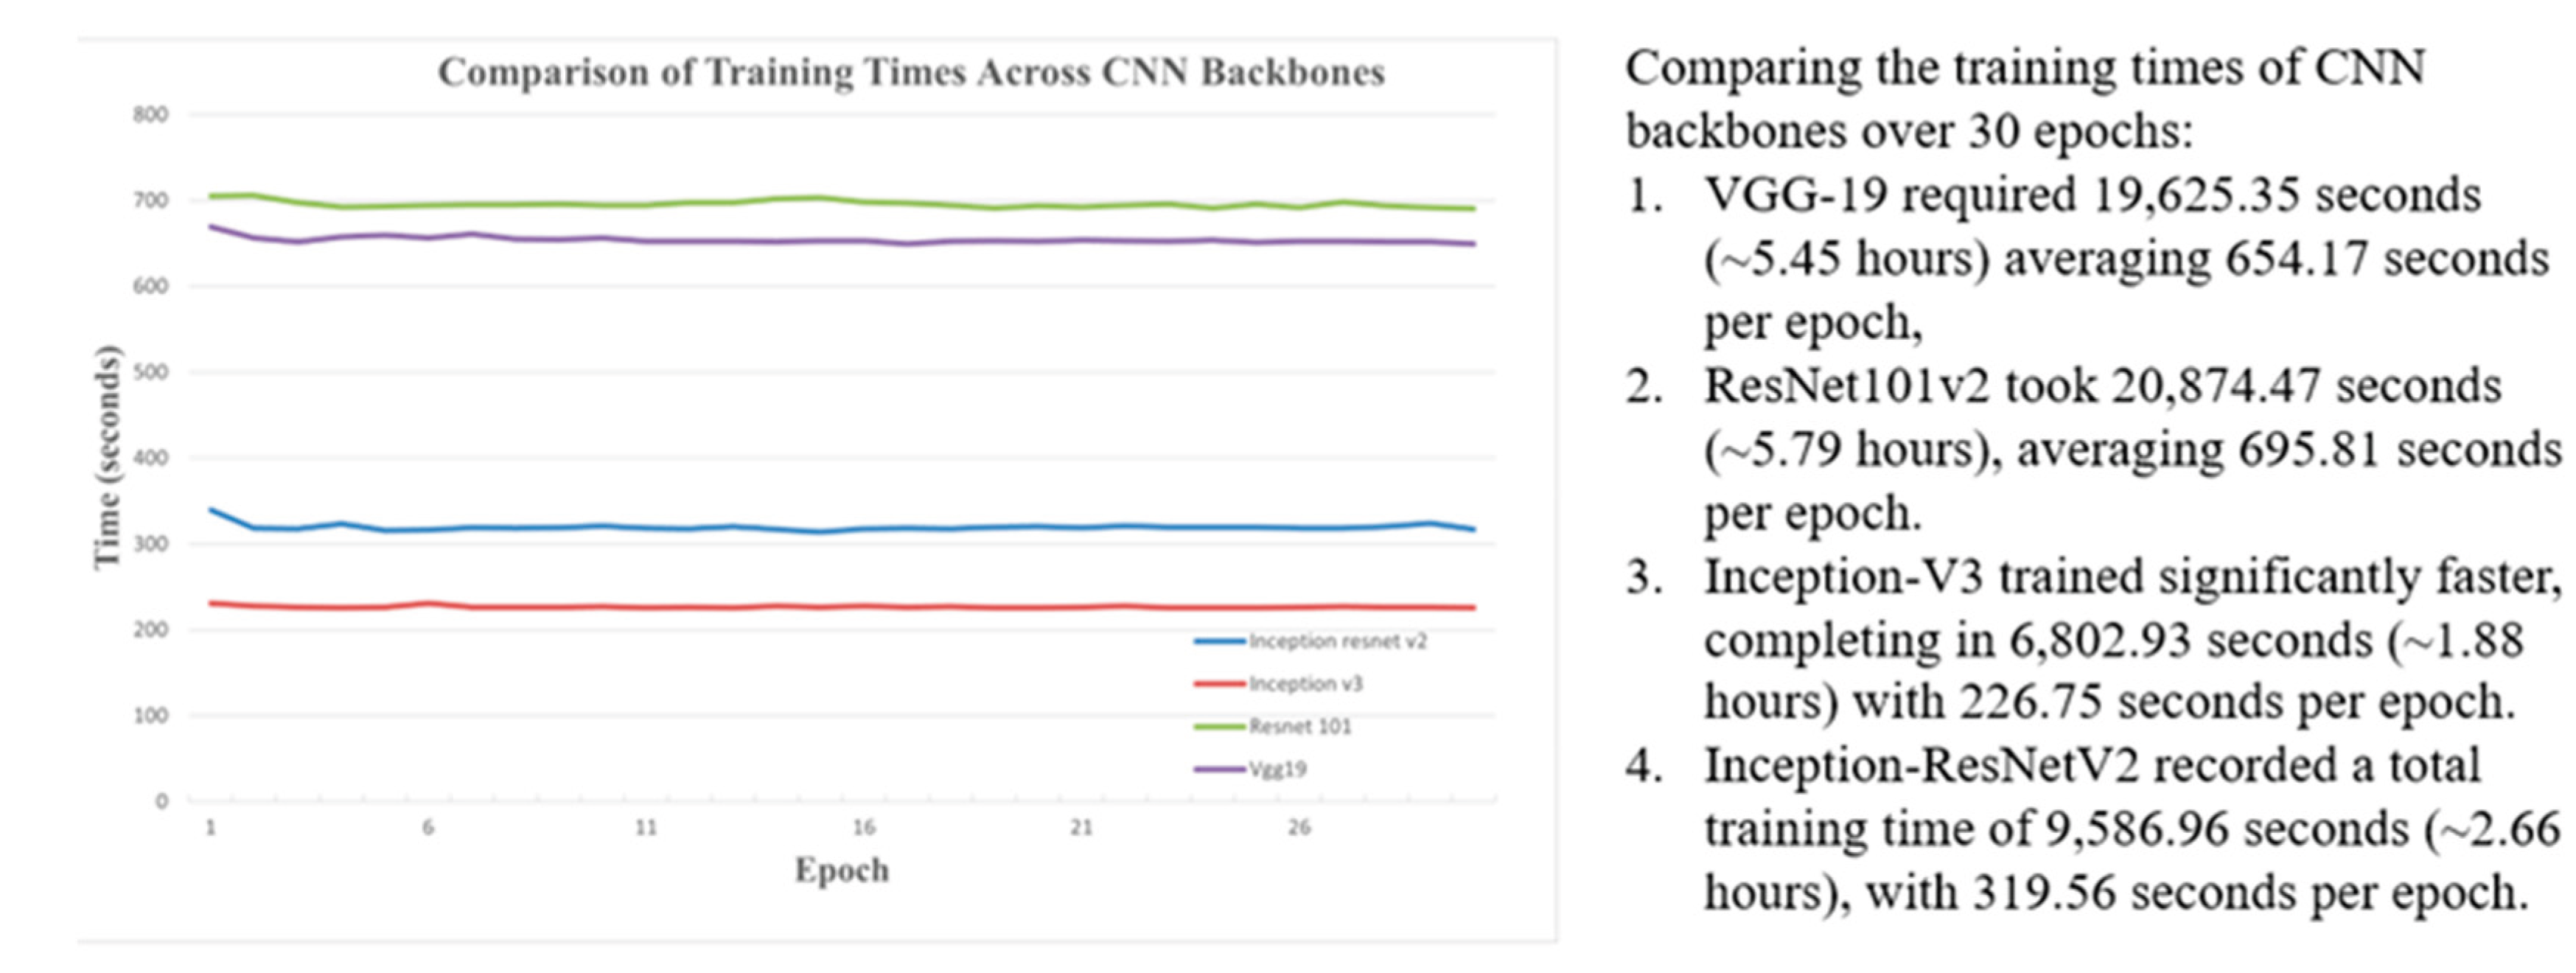
Figure 8.
Testing results for backbone Inception V3 (1,553 testing images).
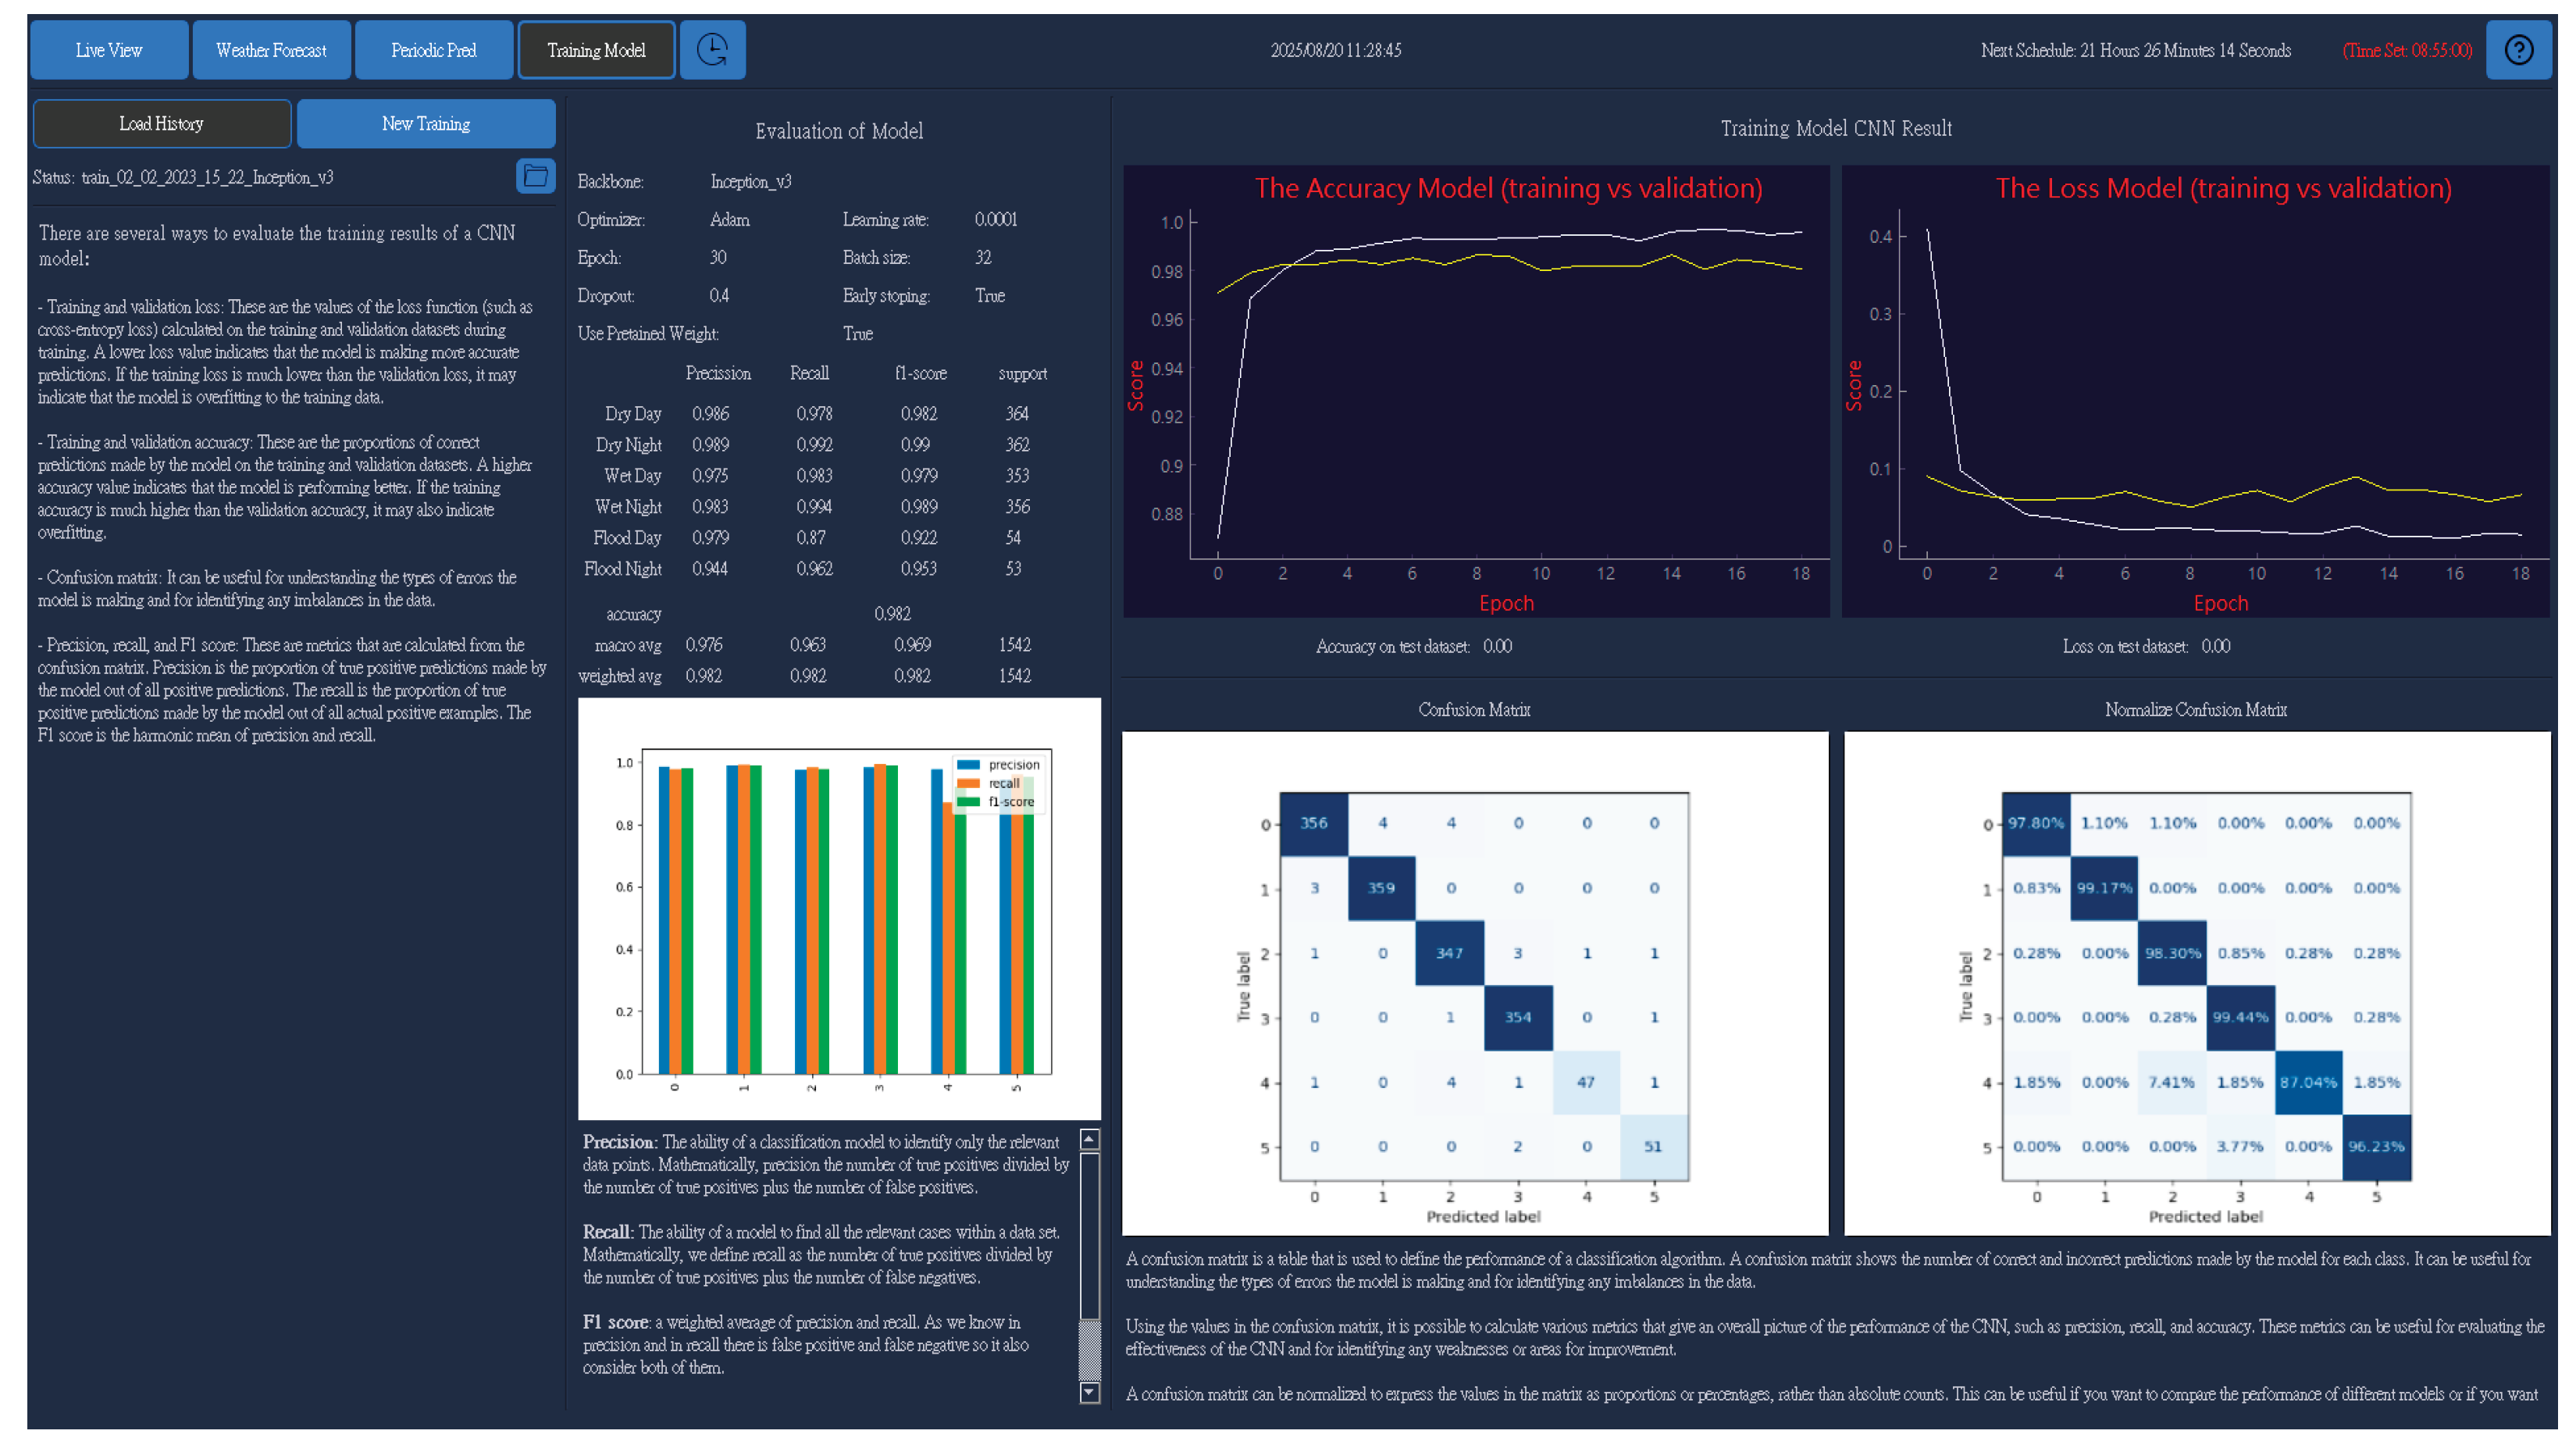
Figure 9.
CNN model flood detection application and its operational flow chart.
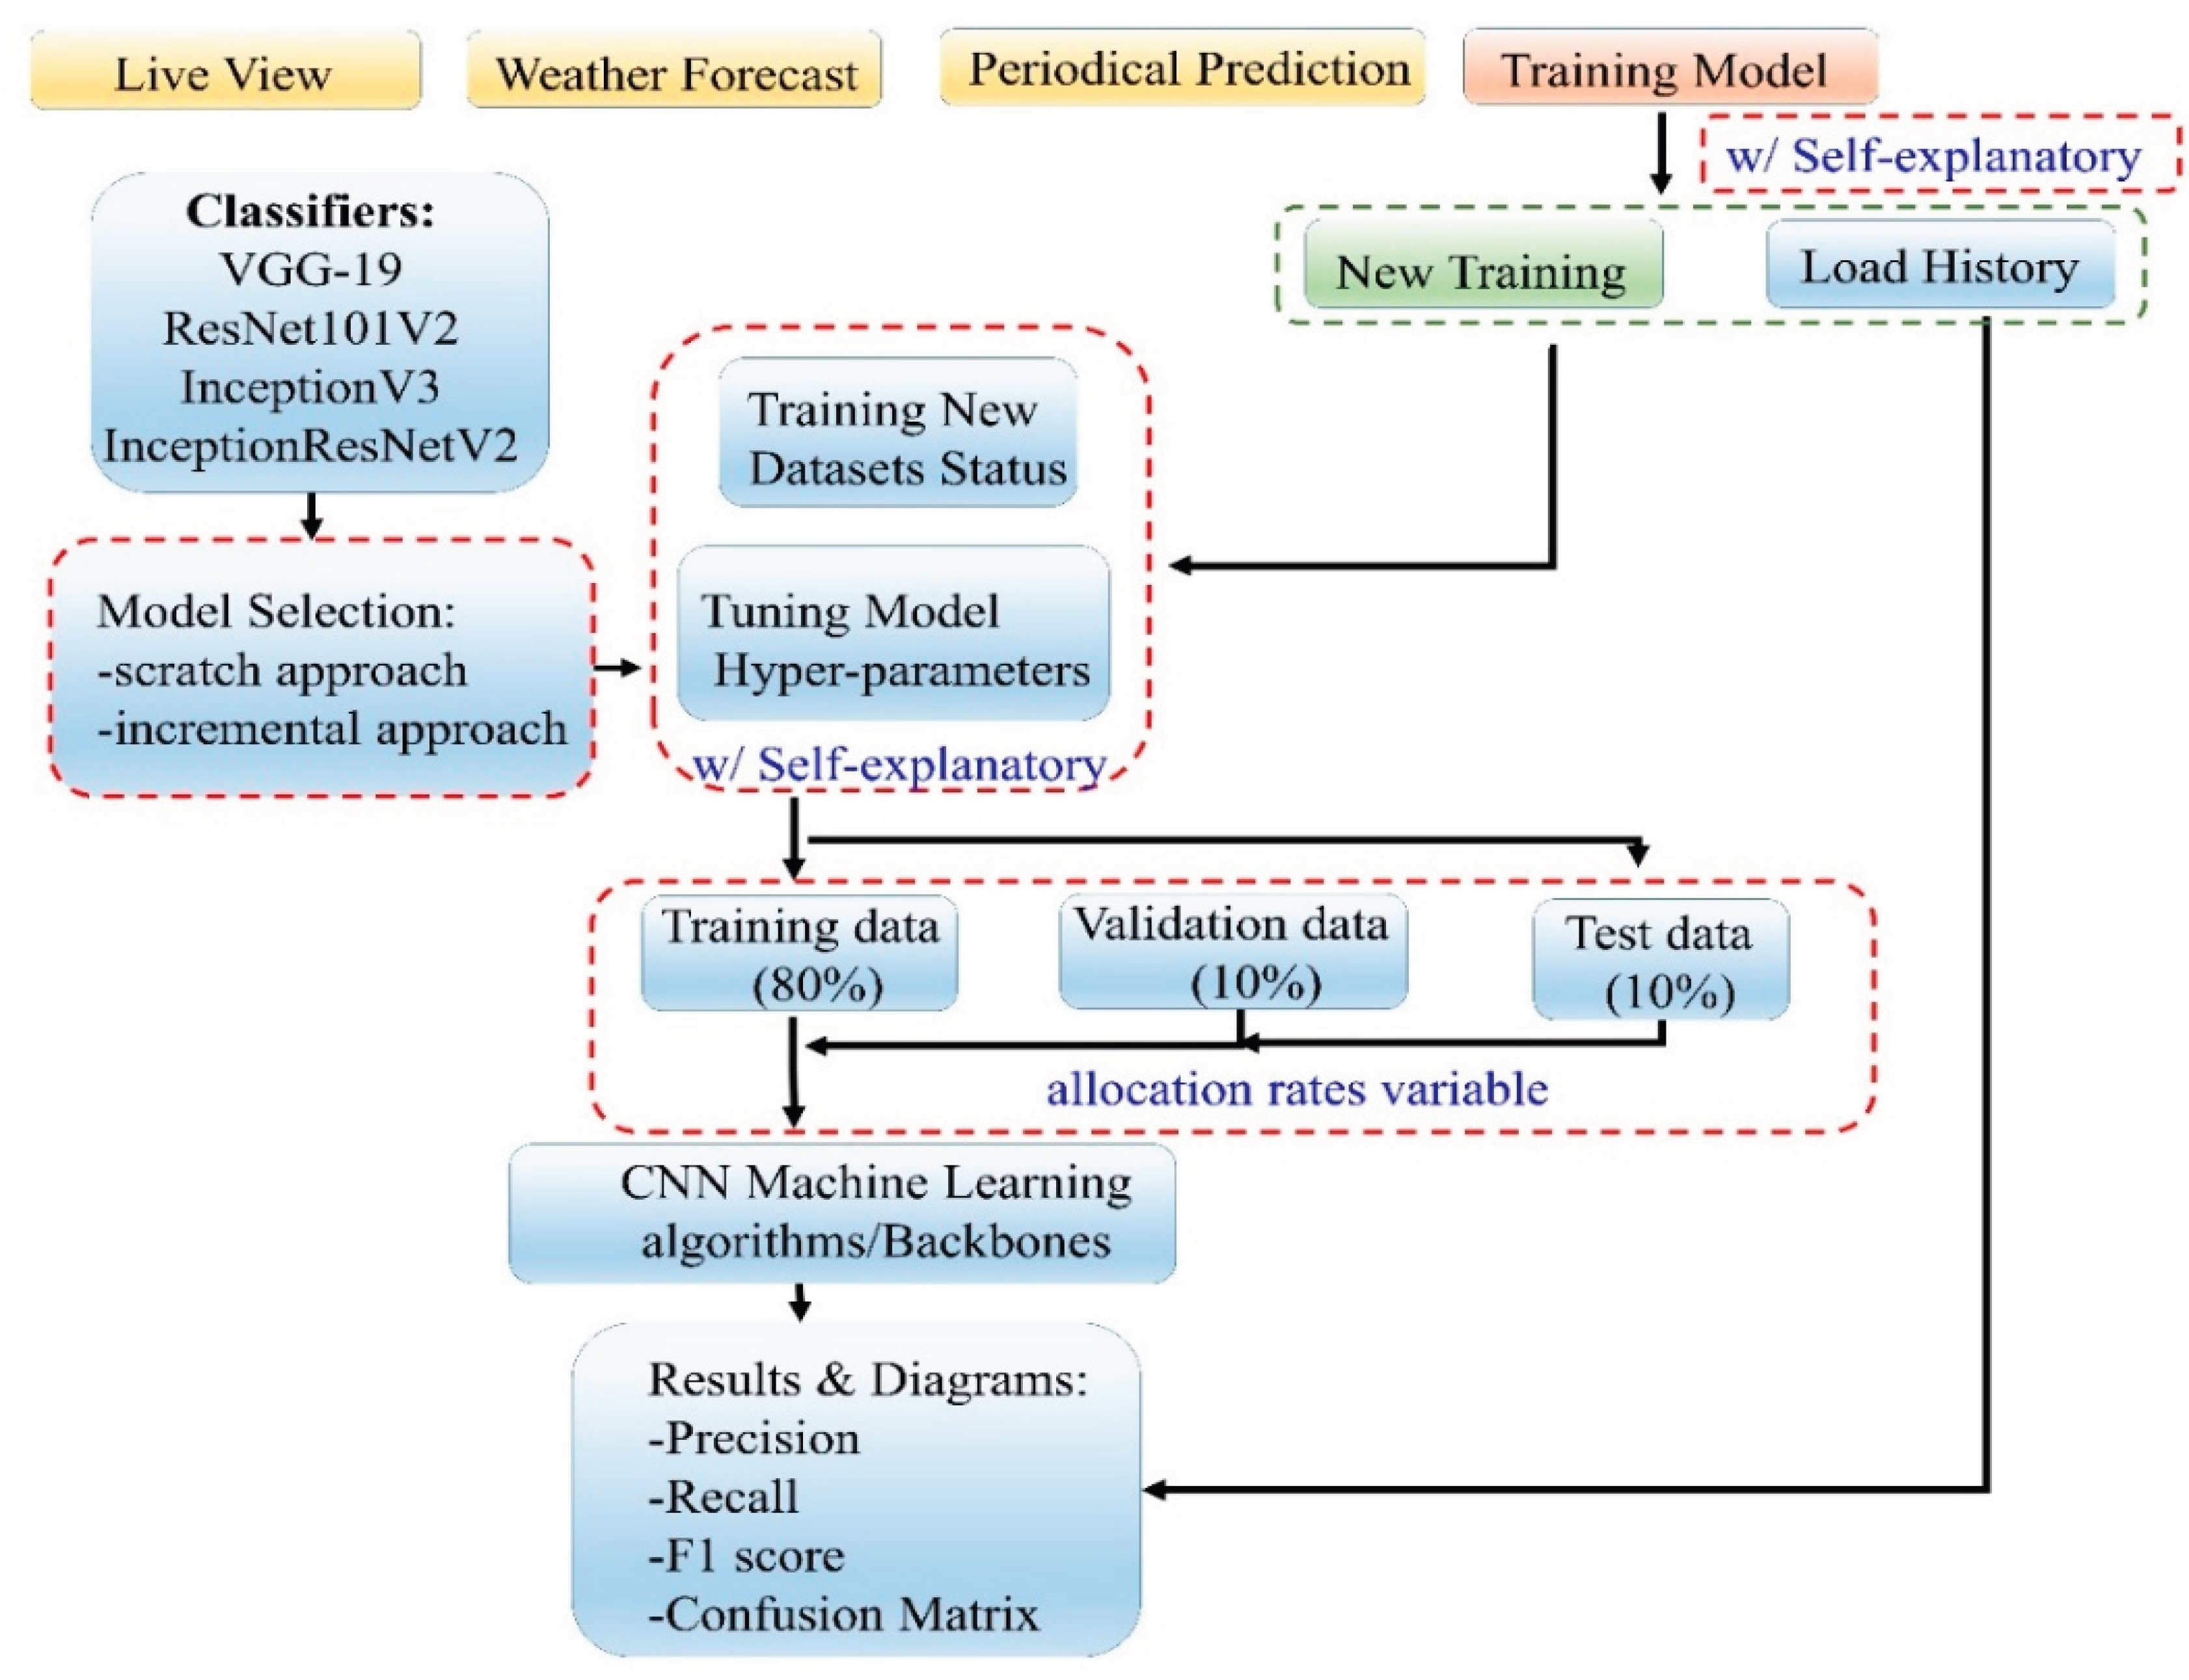
Figure 14.
An example of a web interactive flood classification application with automatic Line message generation based on predicted results.
Figure 14.
An example of a web interactive flood classification application with automatic Line message generation based on predicted results.
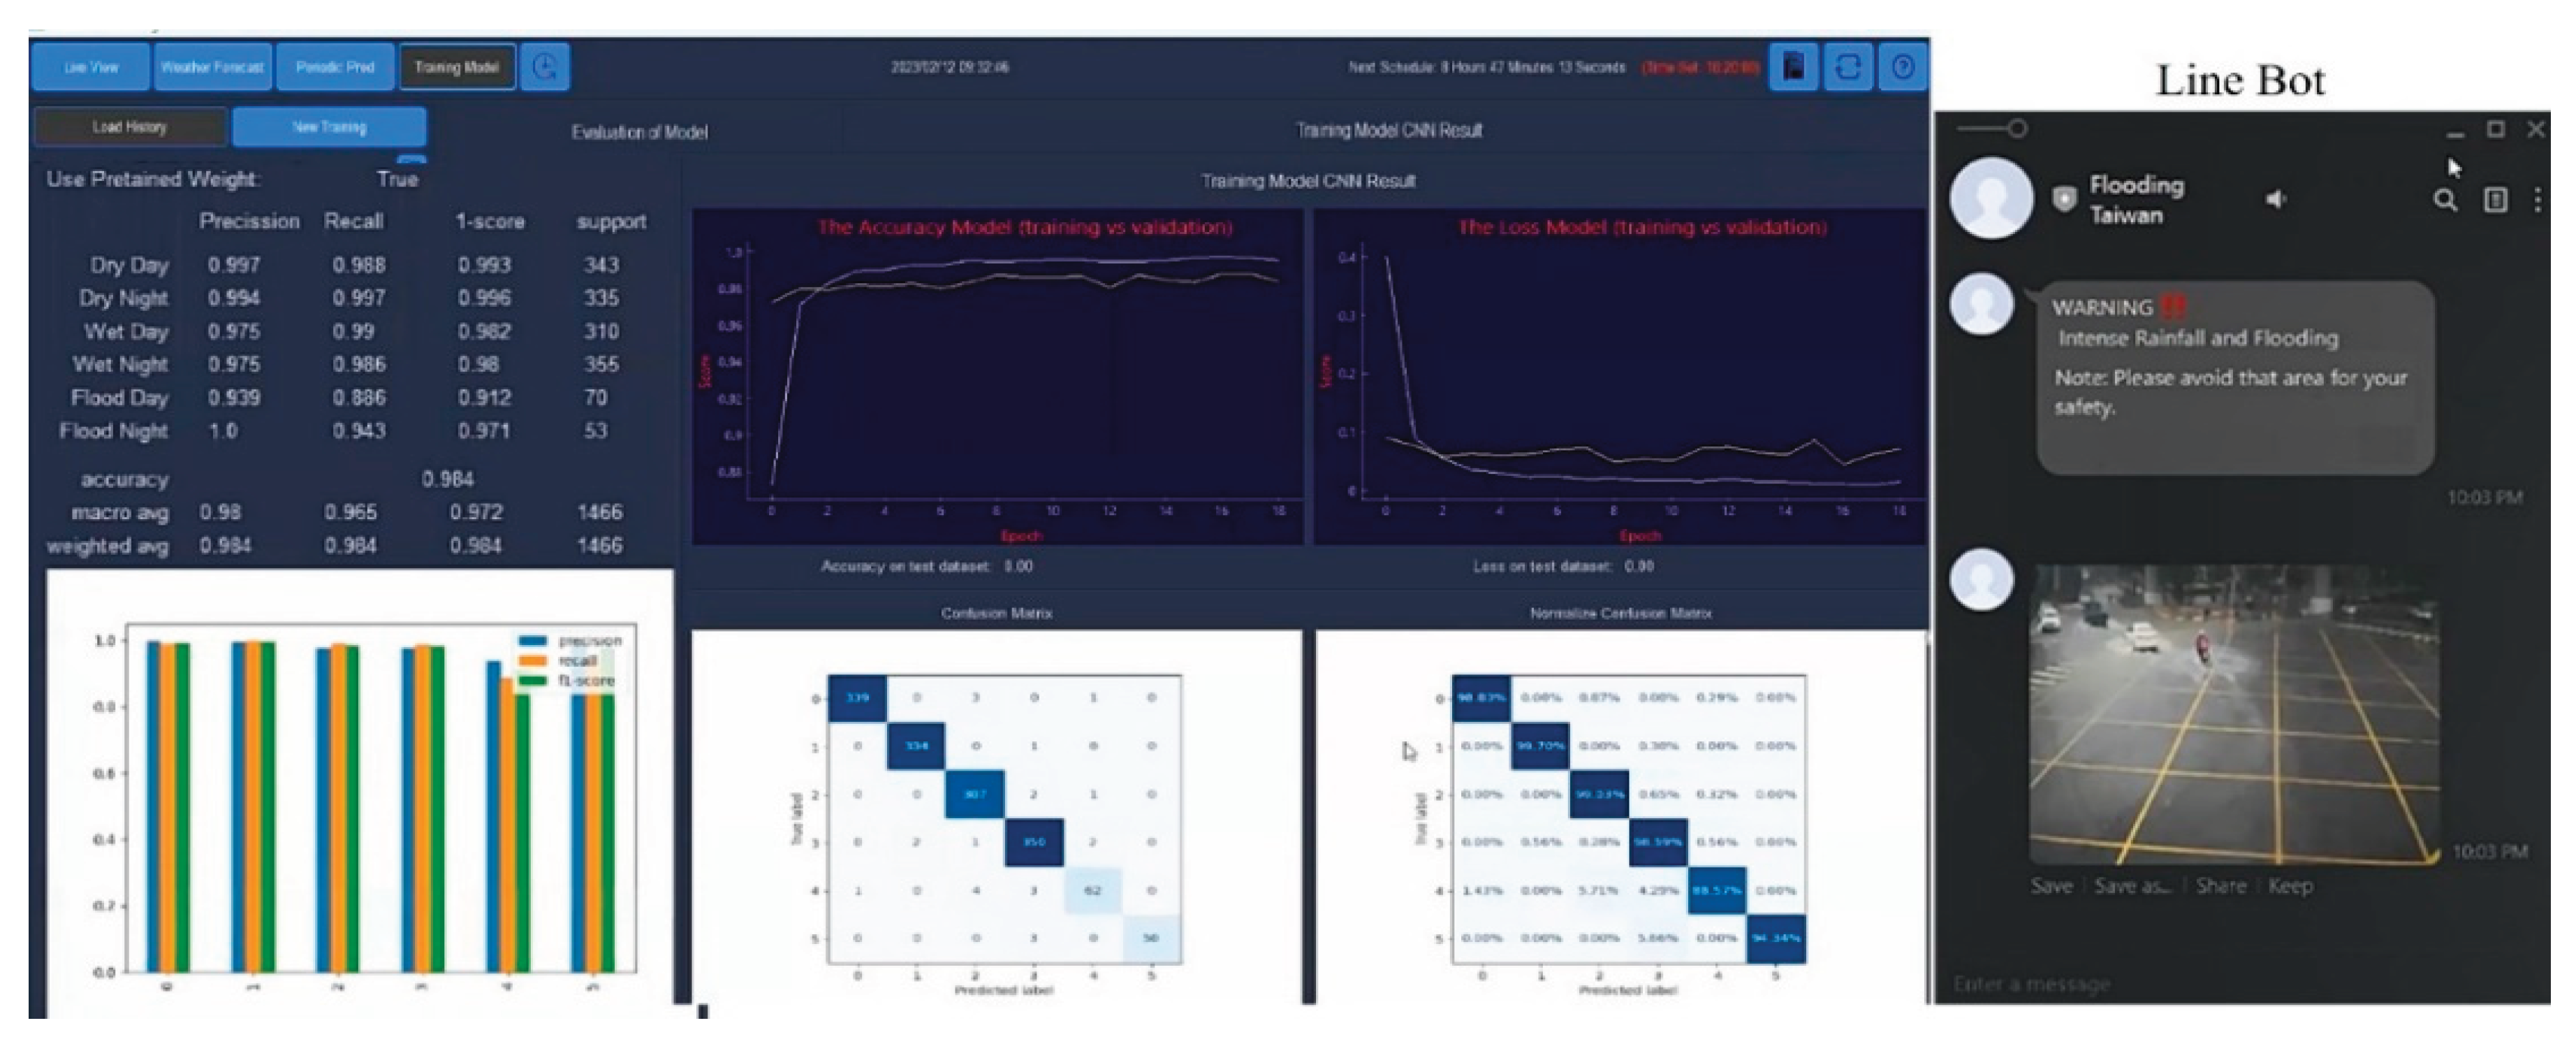
Figure 15.
Adaptive pumping strategies for New Taipei City flood mitigation in a three-phase operational framework.
Figure 15.
Adaptive pumping strategies for New Taipei City flood mitigation in a three-phase operational framework.
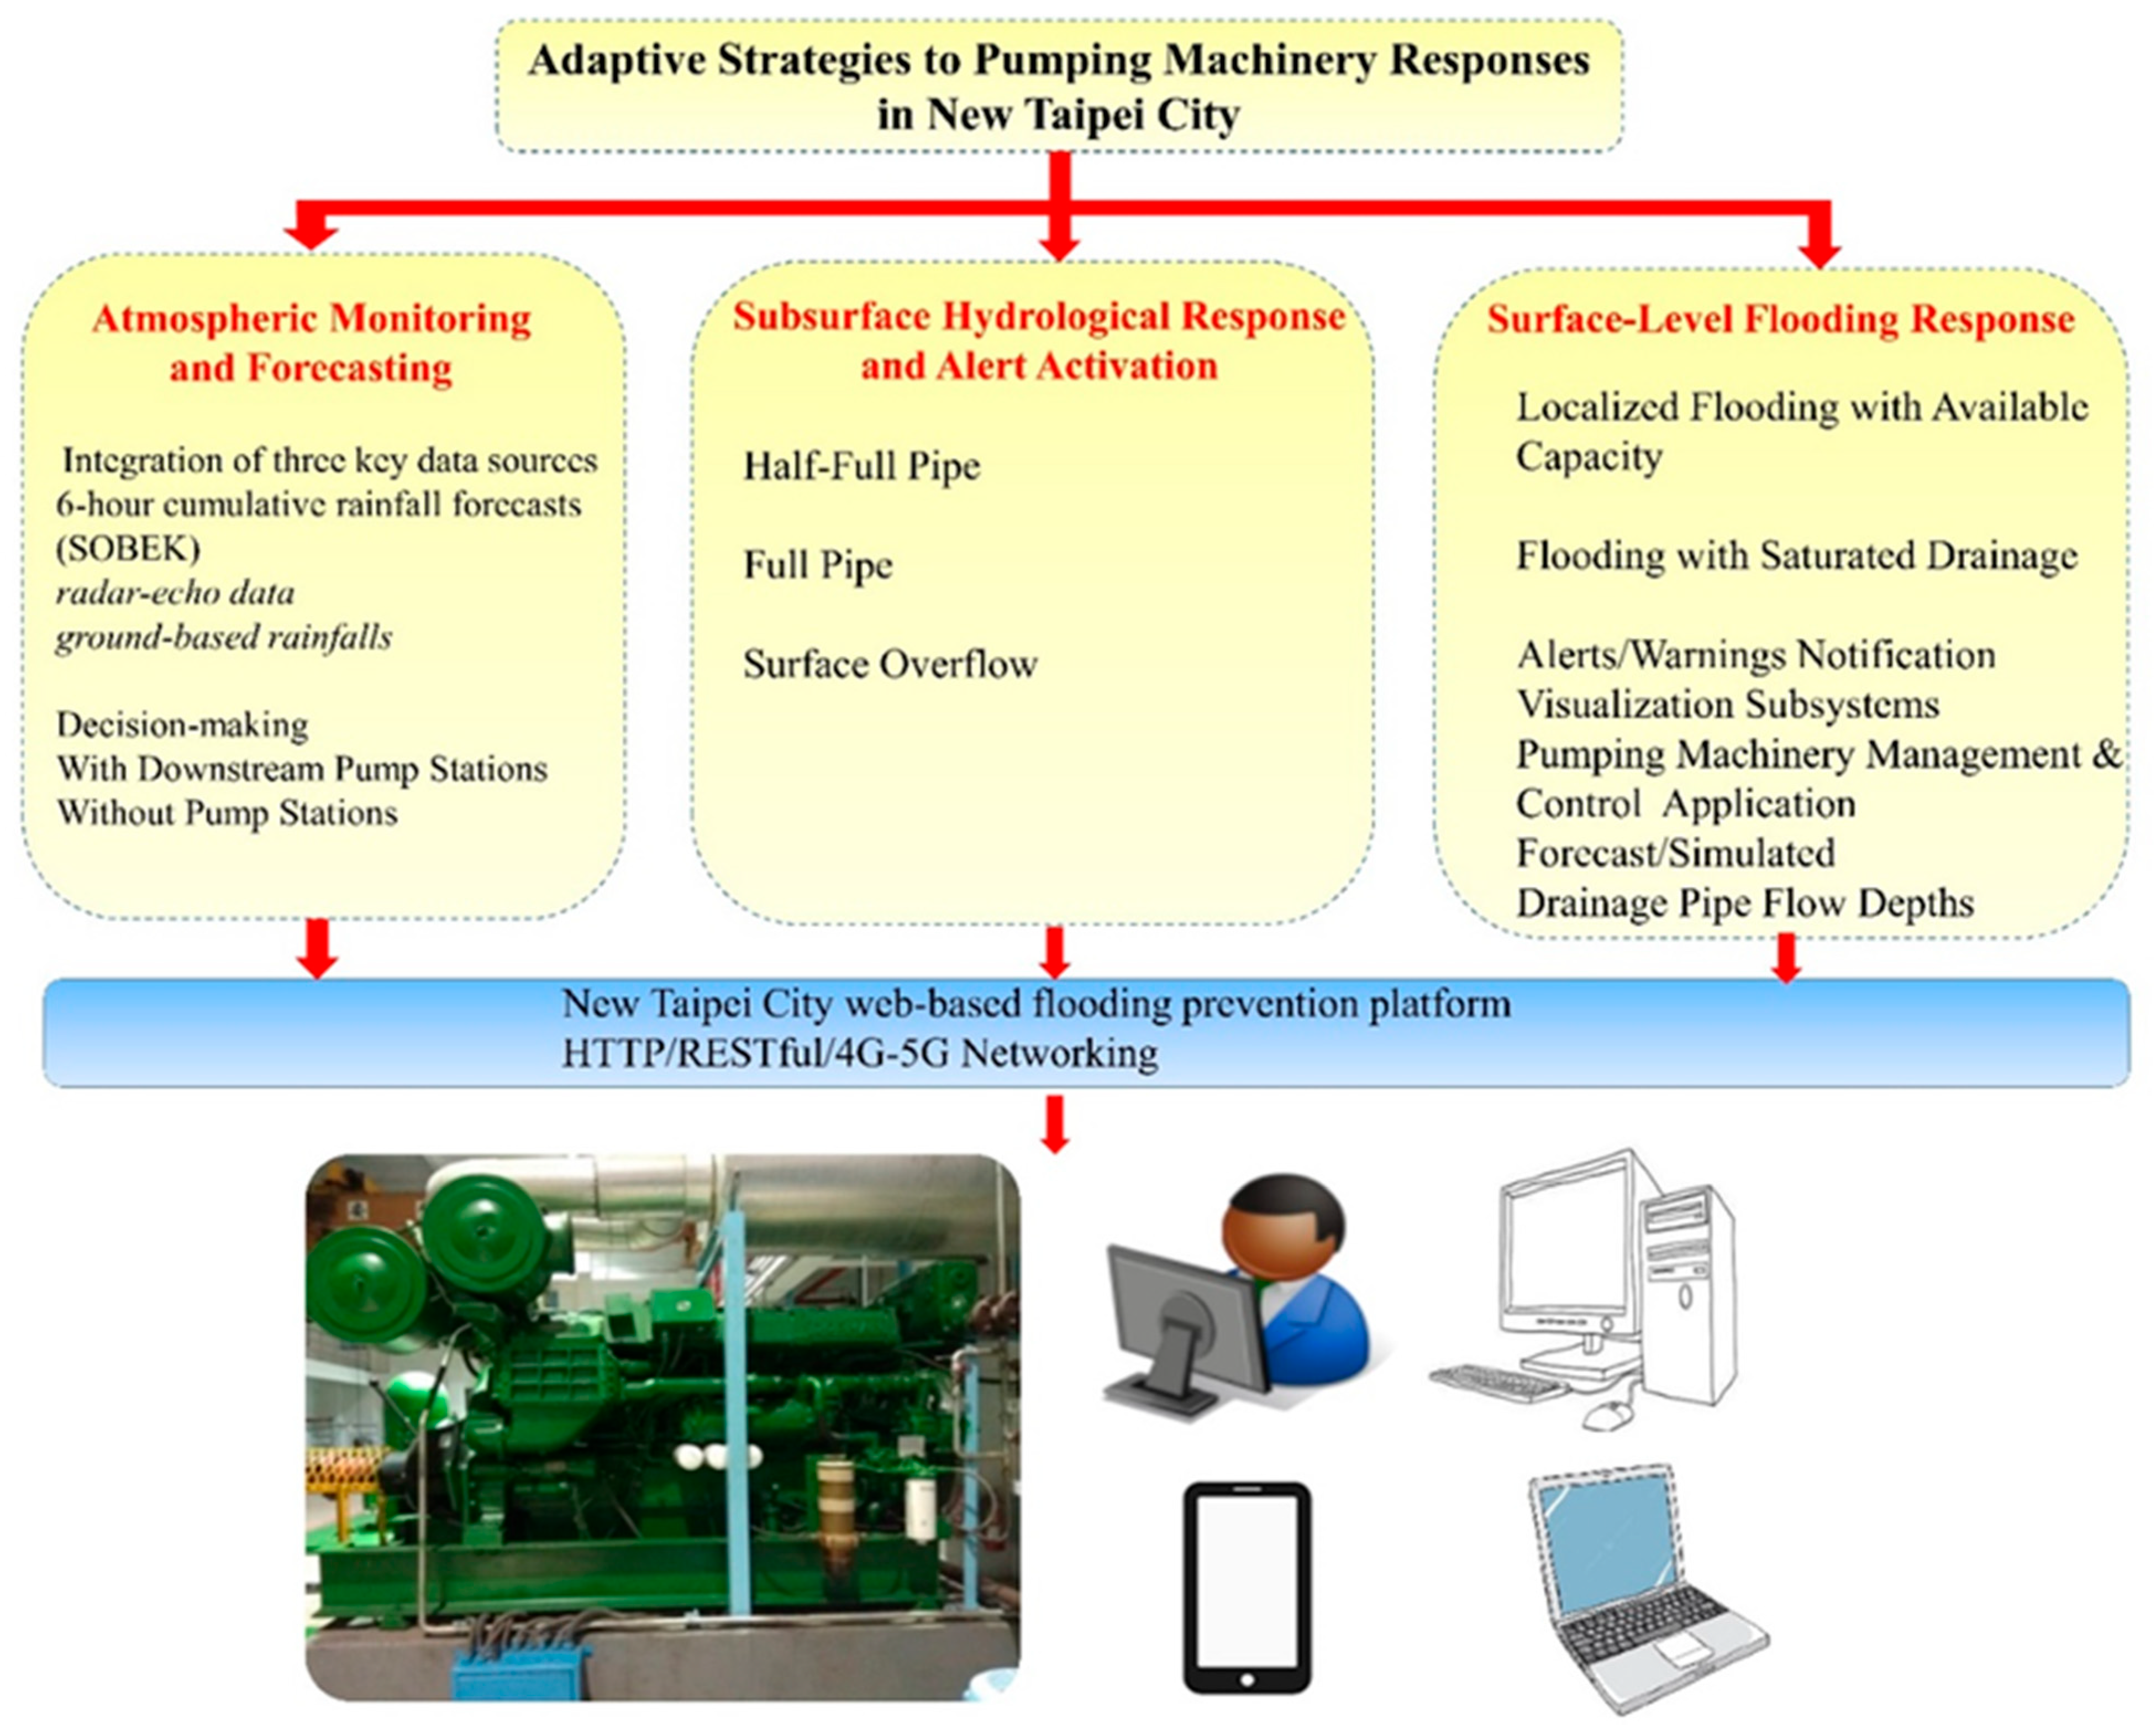
Figure 16.
Distributed, Hierarchical Cloud Based Infrastructure AI+IoT+SOA+Networking Implementation for Ecosystem Real-Time Flush Floods Prediction, Prevention and Mitigation involving Hydrological/Hydraulic Domain Knowledge.
Figure 16.
Distributed, Hierarchical Cloud Based Infrastructure AI+IoT+SOA+Networking Implementation for Ecosystem Real-Time Flush Floods Prediction, Prevention and Mitigation involving Hydrological/Hydraulic Domain Knowledge.
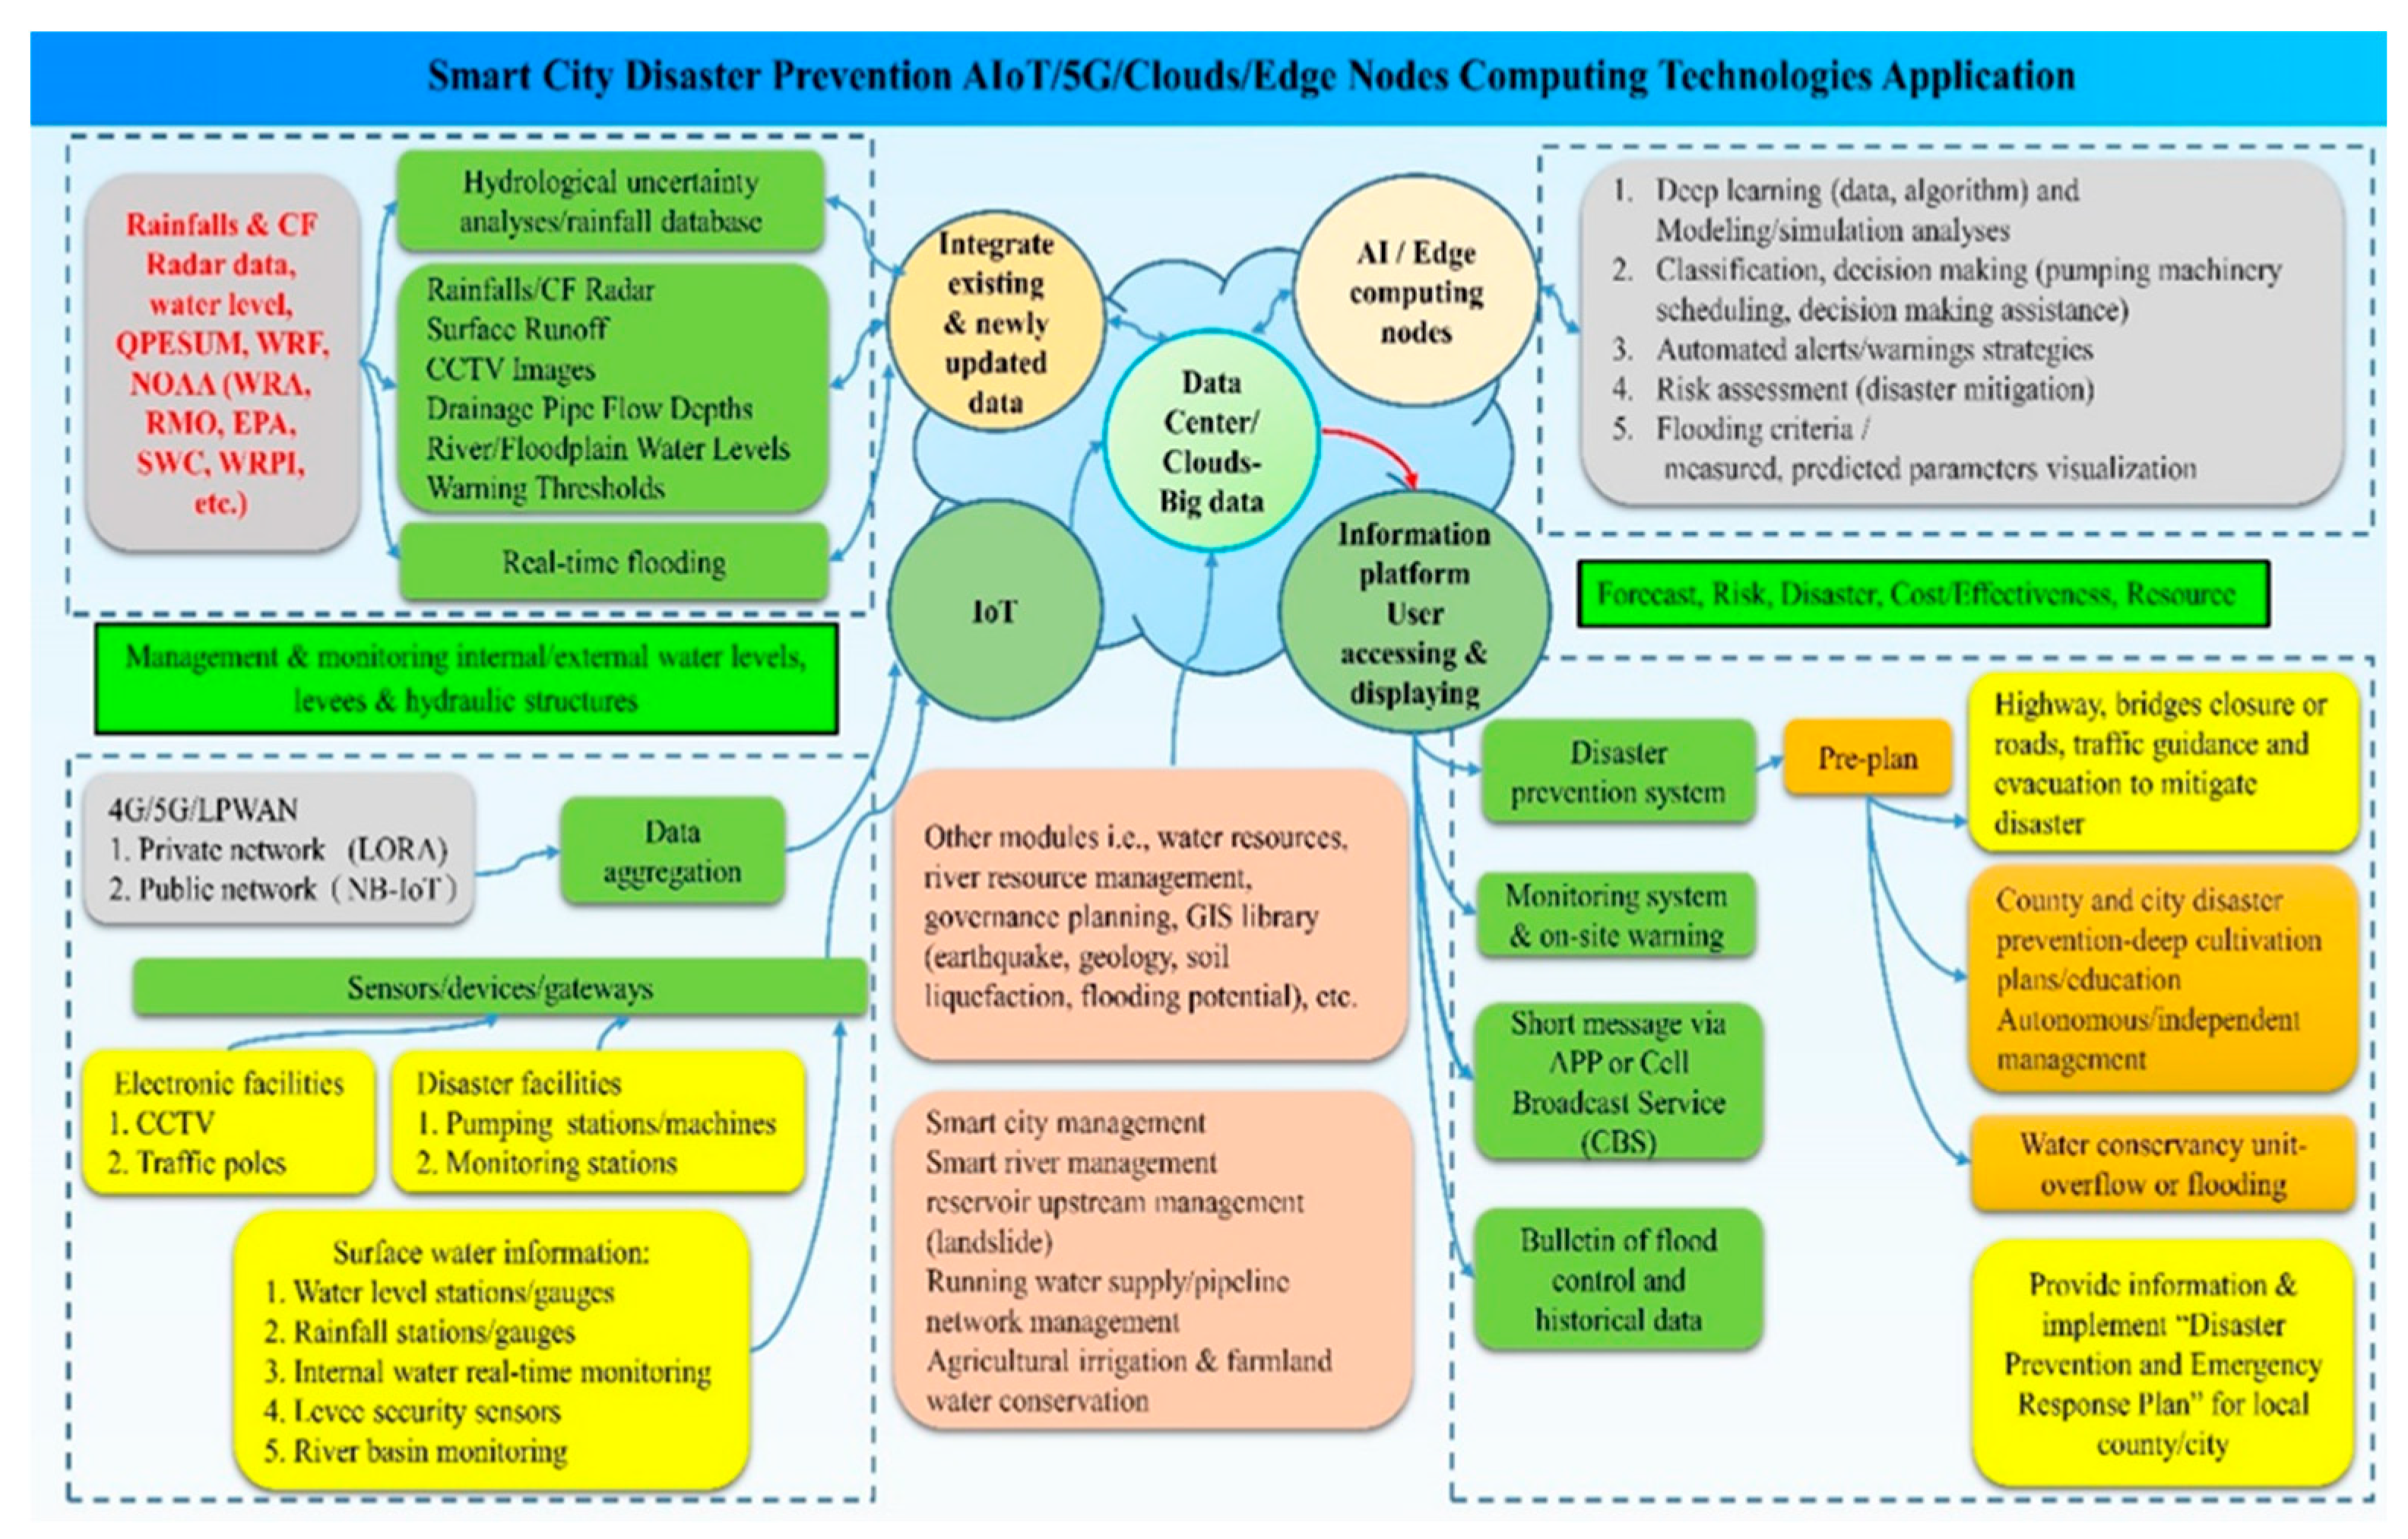
Figure 17.
Six-panel dashboard layouts and real-time adaptive responses.
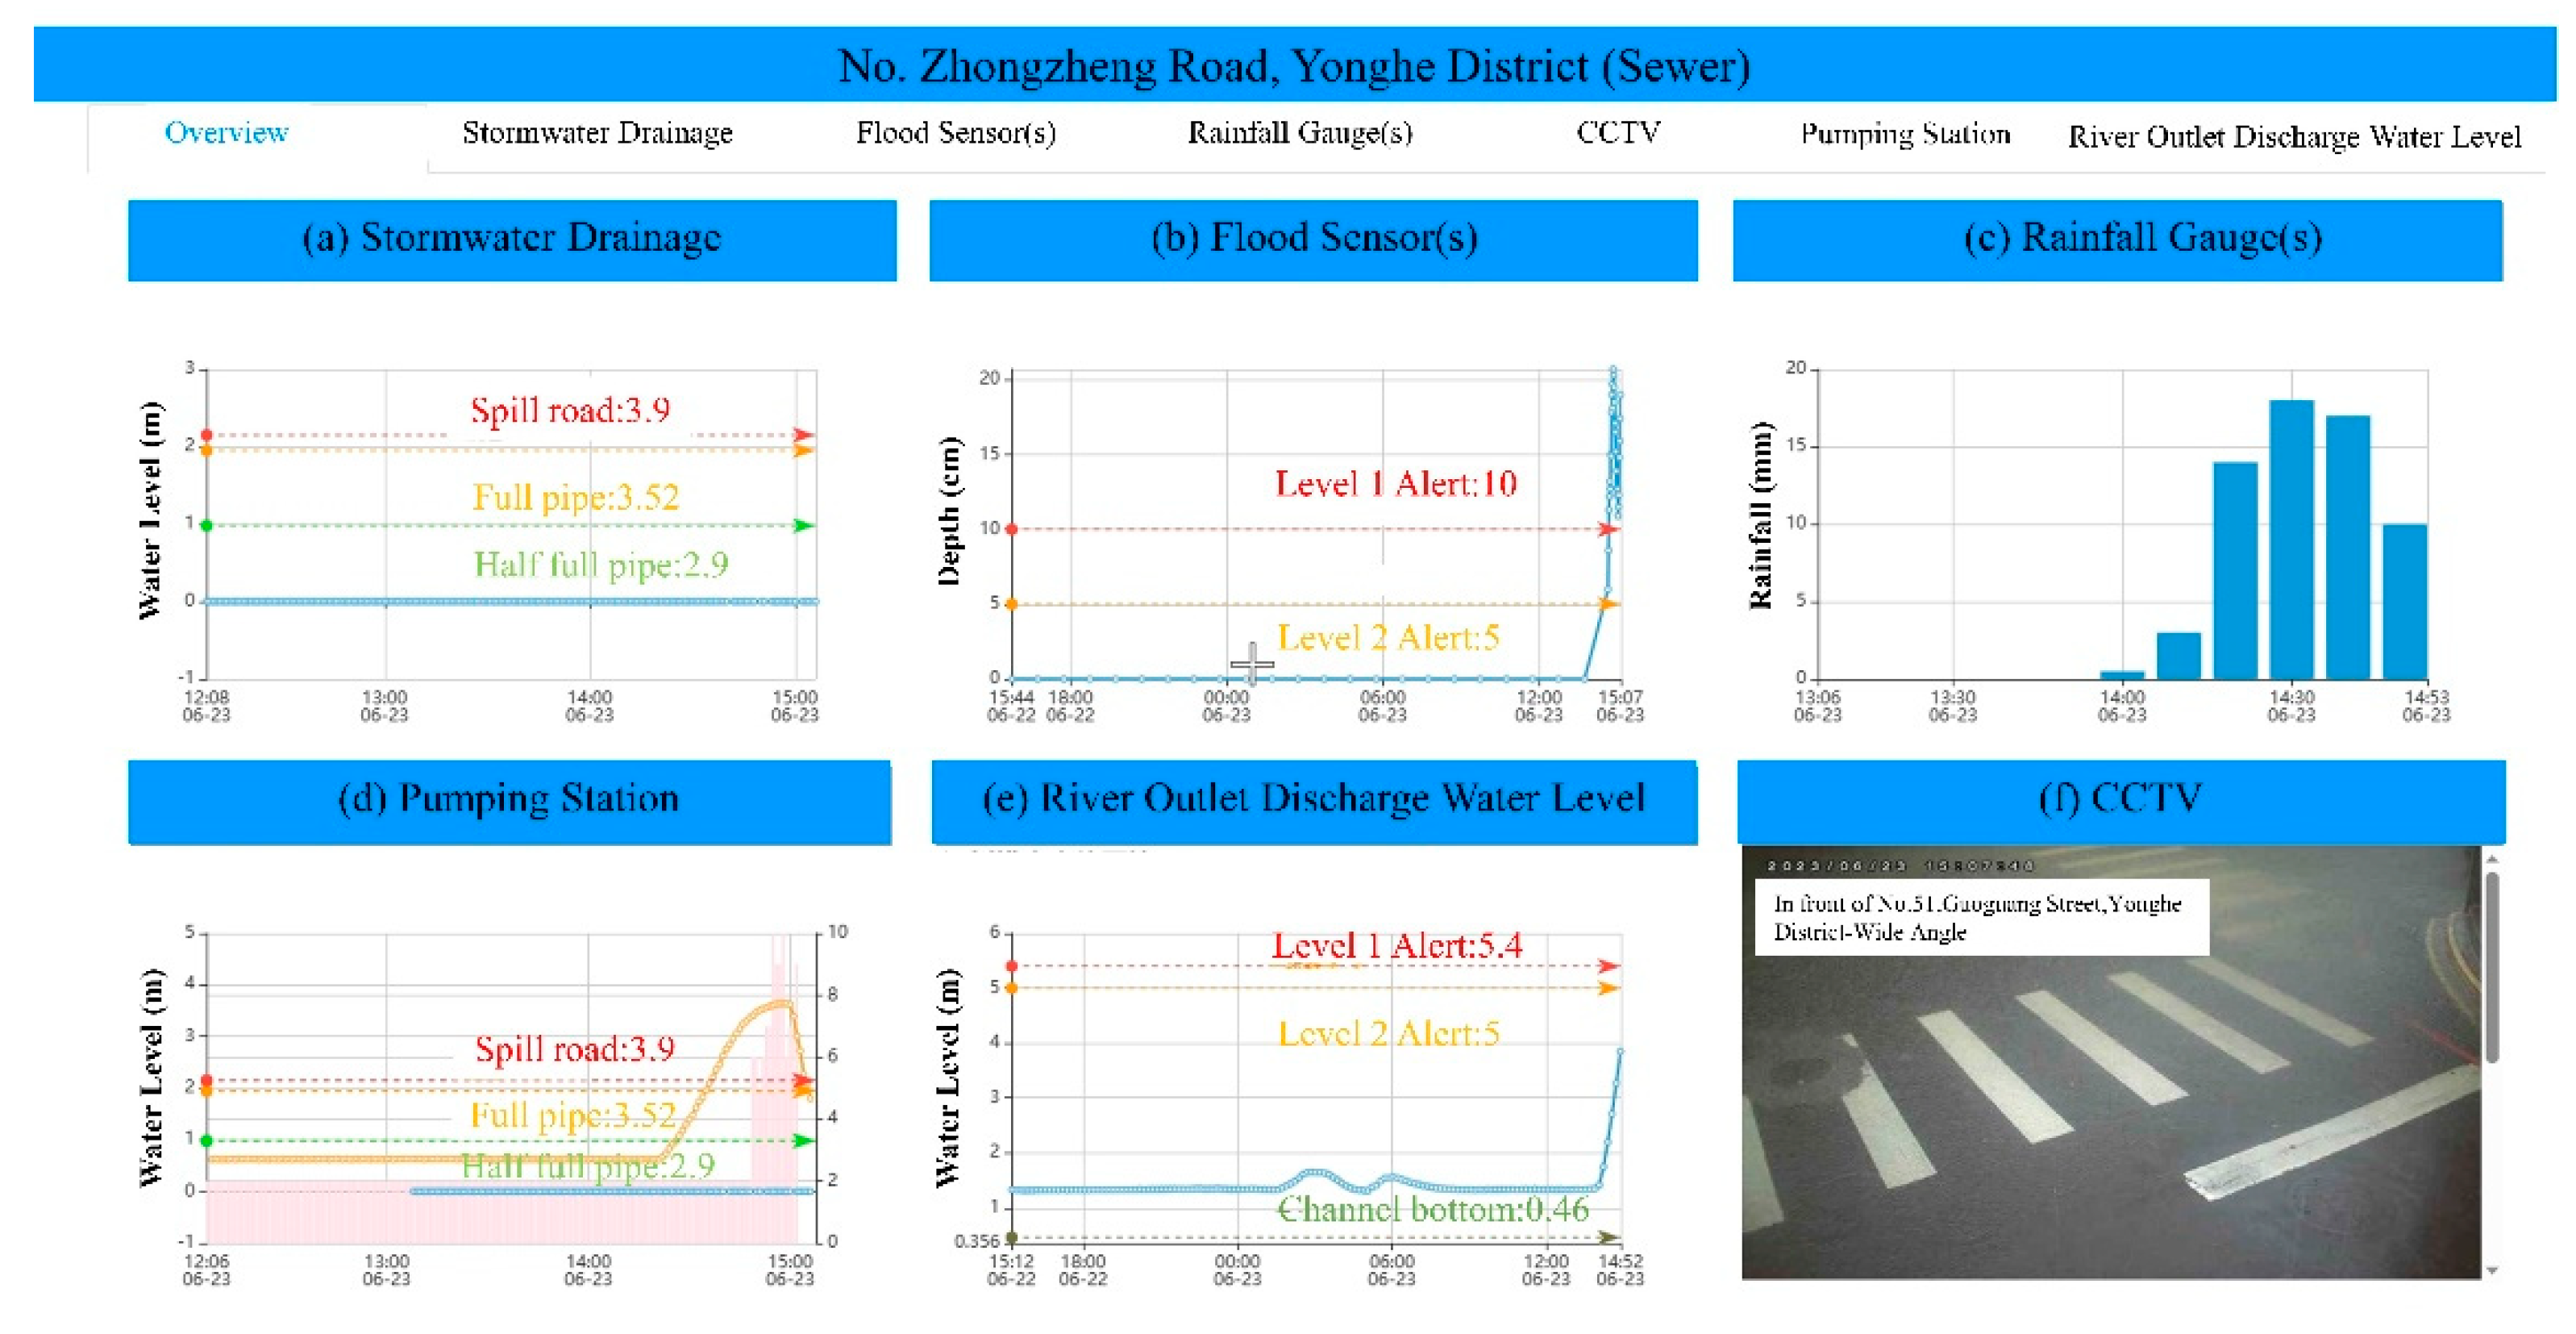

Table 1.
Device specification for training CNN backbone.
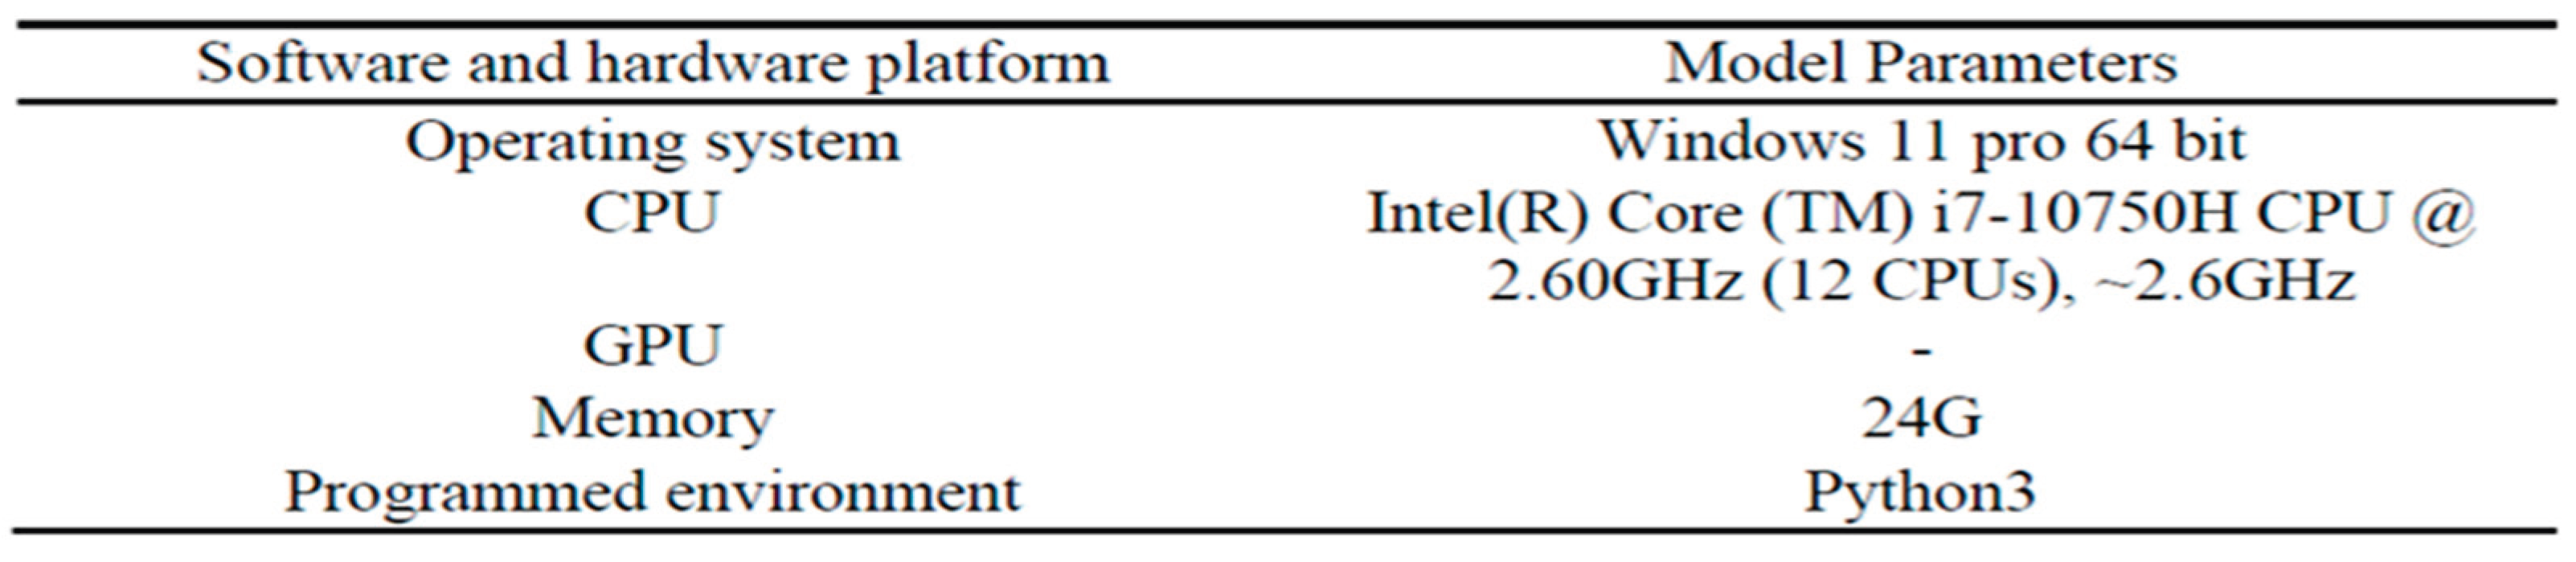 |
Table 2.
CNN model backbones features and impact.
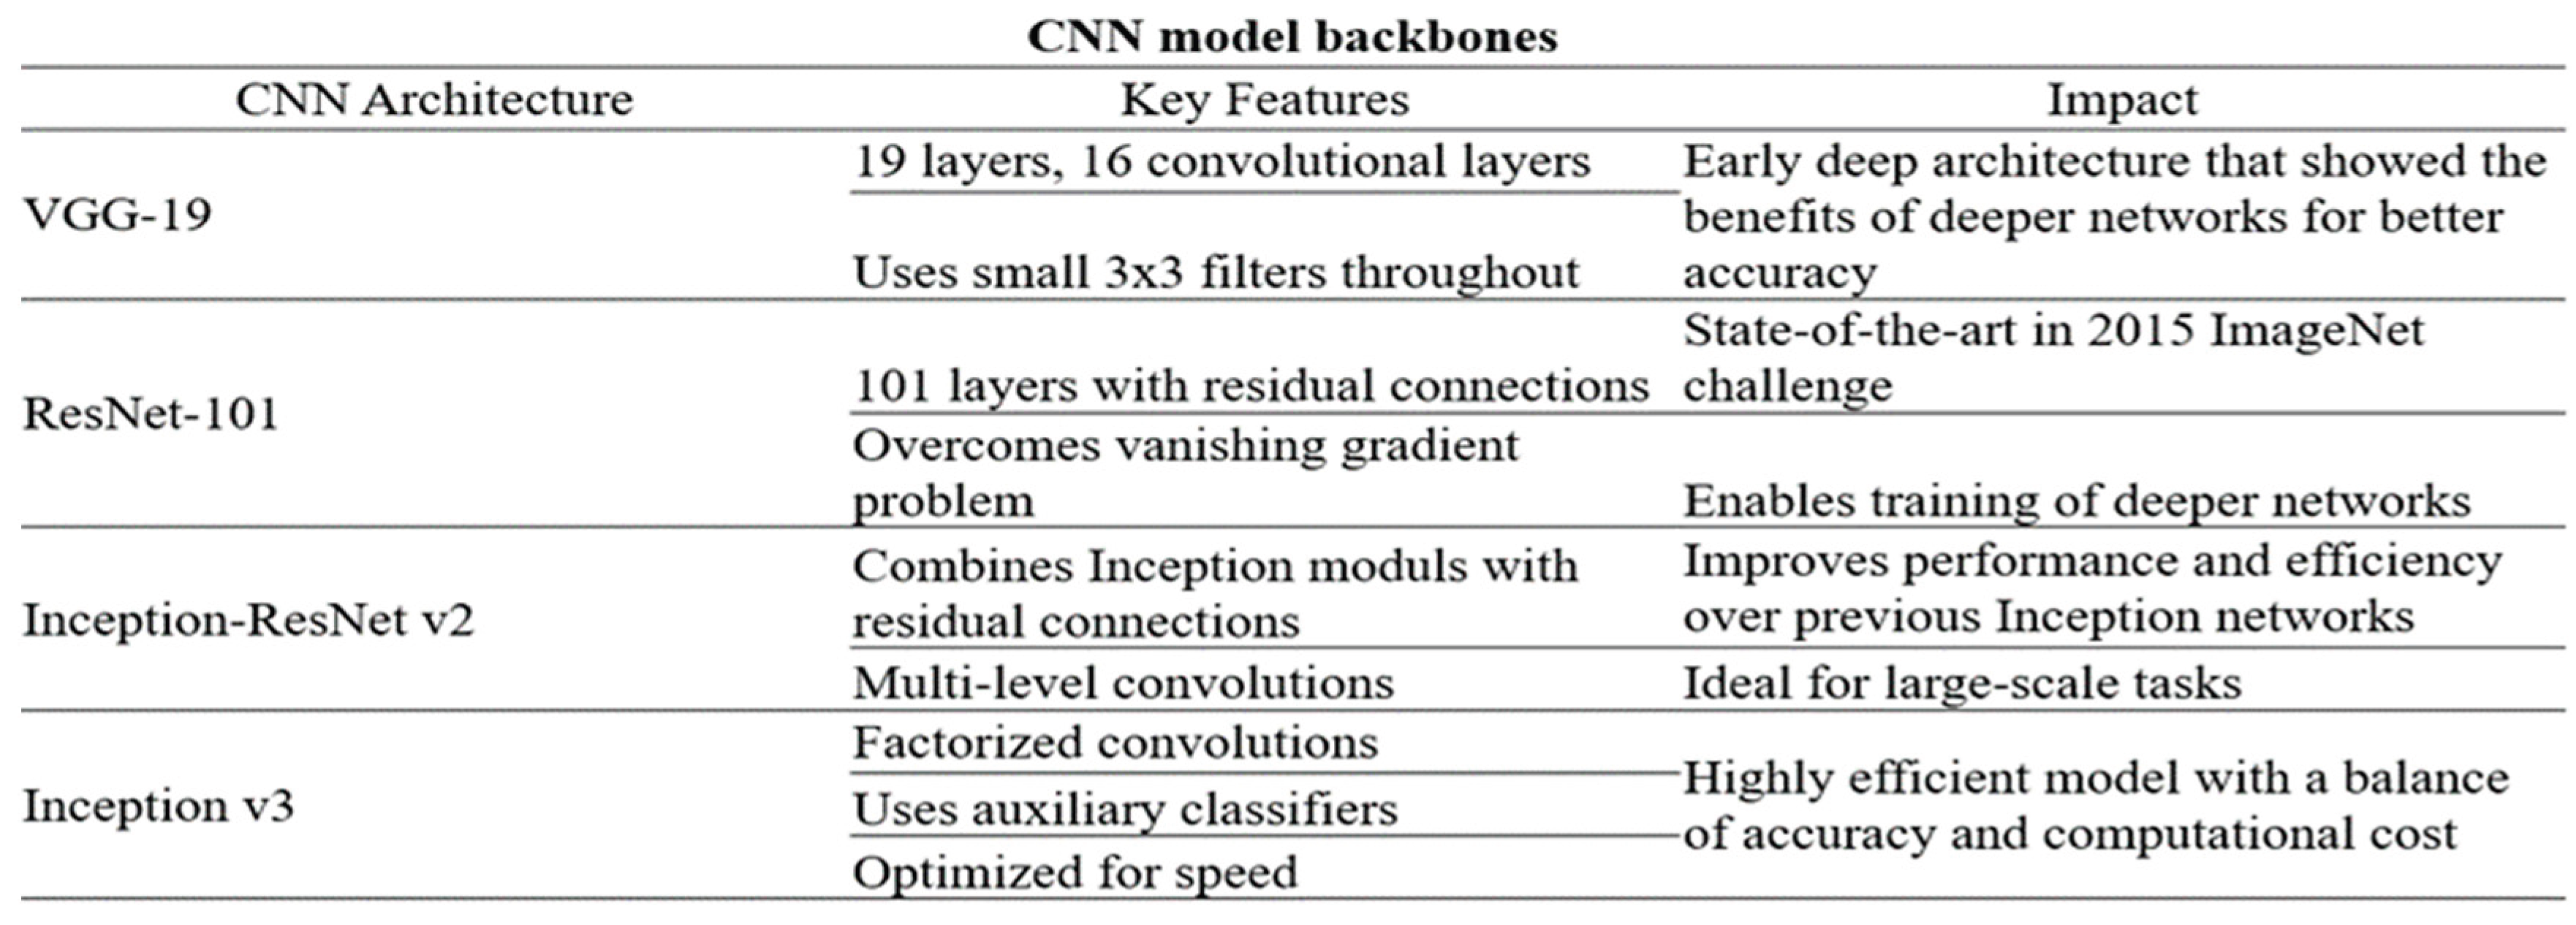 |
Table 3.
Classification accuracy and loss of each model.
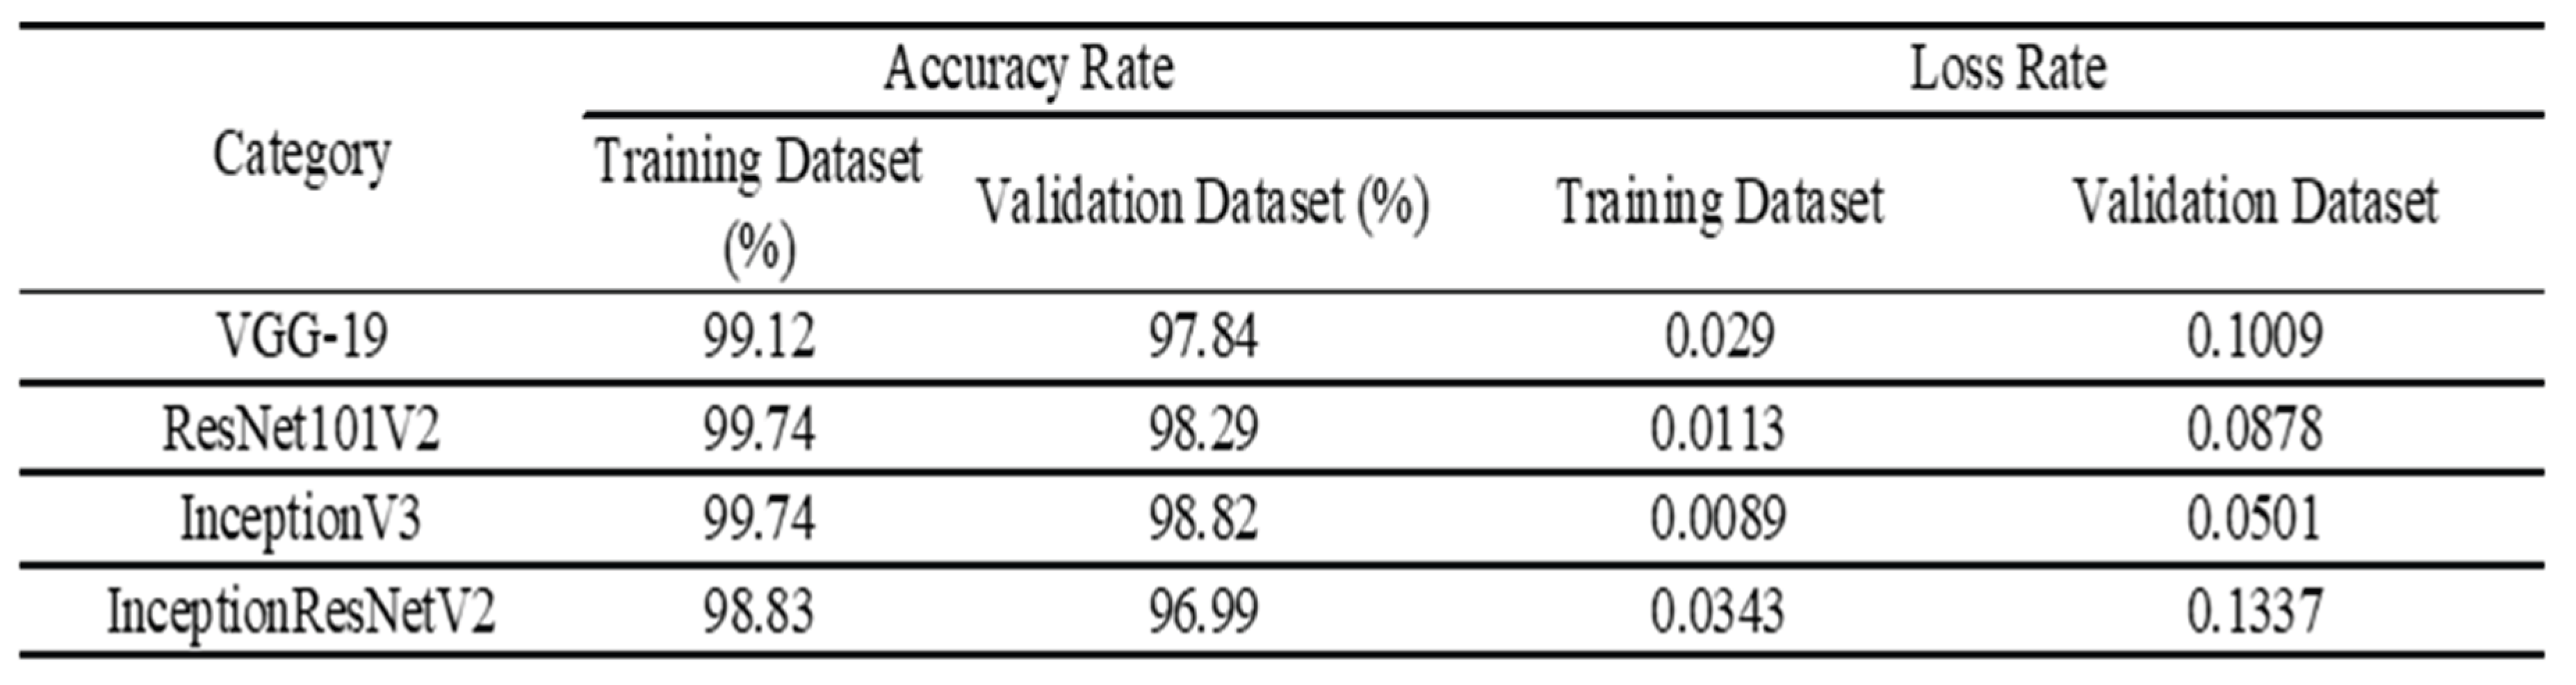 |
Table 4.
The summary of testing results for each CNN backbone model.
 |
Disclaimer/Publisher’s Note: The statements, opinions and data contained in all publications are solely those of the individual author(s) and contributor(s) and not of MDPI and/or the editor(s). MDPI and/or the editor(s) disclaim responsibility for any injury to people or property resulting from any ideas, methods, instructions or products referred to in the content. |
© 2025 by the authors. Licensee MDPI, Basel, Switzerland. This article is an open access article distributed under the terms and conditions of the Creative Commons Attribution (CC BY) license (http://creativecommons.org/licenses/by/4.0/).
Copyright: This open access article is published under a Creative Commons CC BY 4.0 license, which permit the free download, distribution, and reuse, provided that the author and preprint are cited in any reuse.


