1. Introduction
Immune checkpoint inhibitors (ICIs) have become a cornerstone of modern immuno-oncology and have demonstrated significant survival benefits across a broad spectrum of malignancies, both in (neo)adjuvant and metastatic settings [
1,
2]. Unlike conventional anticancer therapies, ICIs exert their therapeutic effect by restoring and enhancing host immune responses against tumor cells [
3]. To date, the U.S. Food and Drug Administration has approved agents targeting three major immune checkpoints—cytotoxic T-lymphocyte–associated antigen 4 (CTLA-4), programmed cell death protein 1 (PD-1) and its ligand PD-L1, and lymphocyte activation gene 3 (LAG-3)—either as monotherapy or in combination with other ICIs, chemotherapy, or targeted therapies.
Despite their clinical efficacy, ICIs are associated with immune-related adverse events (IRAEs), which may involve multiple organ systems, including the cardiovascular system [
4,
5,
6]. Among cardiovascular IRAEs, ICI-related myocarditis represents the most severe manifestation and typically occurs within the first three months after treatment initiation. Although relatively uncommon, with a reported prevalence ranging from 0.09% to 2.4%, ICI-related myocarditis carries a high mortality rate of up to 25–50% [
7,
8,
9,
10,
11,
12]. Increased awareness of this potentially fatal complication has stimulated growing interest in identifying less severe or subclinical forms of ICI-related myocardial injury [
13].
Conventional transthoracic echocardiography (TTE), with assessment of left ventricular ejection fraction (LVEF), has limited sensitivity for the early detection of myocardial dysfunction, as contractile impairment may already be present despite preserved LVEF values [
14,
15]. Speckle-tracking echocardiography (STE) has emerged as an advanced imaging technique capable of overcoming these limitations by quantifying myocardial deformation (strain) and strain rate in longitudinal, circumferential, and radial directions during systole and diastole [
16,
17]. Using STE, myocardial mechanical properties of both ventricles and atria can be accurately assessed. In particular, early impairment of left ventricular global longitudinal strain (LV-GLS), the most widely used STE-derived parameter, has been consistently shown to precede LVEF reduction in a variety of clinical settings [
18,
19,
20]. Moreover, myocardial strain abnormalities affecting both ventricular and atrial chambers have been shown to correlate with the degree of myocardial edema and fibrosis documented by endomyocardial biopsy [
21,
22].
Over the past few years, several imaging studies have evaluated myocardial strain parameters in patients undergoing ICI therapy at baseline and during short-term follow-up, reporting heterogeneous and sometimes conflicting results [
23,
24,
25,
26,
27,
28,
29,
30,
31]. While the majority of studies observed a significant reduction in strain values during follow-up compared with accepted reference ranges [
32], some investigations did not detect significant changes in LV-GLS after ICI exposure [
25,
31]. Notably, only a limited number of studies have simultaneously assessed left and right ventricular myocardial strain, consistently demonstrating early attenuation of biventricular mechanics following ICI therapy [
23,
25,
28].
In contrast to ventricular deformation analysis, atrial myocardial mechanics have received very limited attention in the context of immune checkpoint inhibitor therapy. Although speckle-tracking echocardiography enables a comprehensive evaluation of atrial function, including reservoir, conduit, and contractile phases, atrial strain assessment has been only sporadically incorporated into imaging protocols of ICI-treated patients and generally limited to isolated reports or secondary analyses [
25]. Consequently, the prevalence, temporal evolution, and clinical implications of left and right atrial mechanical impairment following ICI exposure remain largely undefined. Given the strong functional interdependence between atrial and ventricular chambers and the high sensitivity of atrial strain to early myocardial stiffness, inflammation, and diastolic dysfunction, the paucity of data on atrial mechanics represents a relevant gap in current cardio-oncology research.
On the basis of these considerations, we hypothesized that ICI therapy may induce early, subclinical myocardial dysfunction involving not only both ventricles but also both atria. Accordingly, the present study aimed to evaluate the short-term effects of ICI therapy on biventricular and biatrial mechanics using advanced strain imaging in patients with advanced cancer.
2. Materials and Methods
2.1. Study Population
The present observational, prospective, monocentric study was conducted at Ospedale San Giuseppe MultiMedica IRCCS between 5 May 2025 and 1 August 2025 and was designed to evaluate the effect of ICI therapy on biventricular and biatrial mechanics in patients with advanced cancer over a three-month follow-up period. Consecutive adult patients with advanced malignancies involving the lung, breast, skin, or kidney, referred to our Institution and scheduled to receive neoadjuvant or adjuvant ICI therapy, as well as ICI treatment for metastatic disease, were considered eligible for inclusion. All patients were recruited from the Division of Oncology of Ospedale San Giuseppe MultiMedica.
Exclusion criteria were age ≤18 years; absence of advanced cancer or lack of indication for ICI therapy; hemodynamic instability, defined as atrial tachyarrhythmias associated with arterial hypotension, acute heart failure, acute respiratory failure, or acute renal failure; inadequate echocardiographic acoustic windows; and refusal to provide informed consent for participation in the study.
This study was conducted in accordance with the ethical standards of the Declaration of Helsinki and received approval from the local Ethics Committee (reference no. 211/25). All participants provided written informed consent before participation.
2.2. Baseline Clinical Evaluation
At baseline evaluation, comprehensive clinical, laboratory, electrocardiographic, and echocardiographic data were collected. Oncological data were also recorded, including cancer type, disease stage (metastatic or nonmetastatic), and details of ICI therapy, specifically whether treatment was administered in the neoadjuvant or adjuvant setting, or for metastatic disease. Demographic information included age, while anthropometric measurements comprised body surface area (BSA) and body mass index (BMI). Clinical assessment included heart rate and blood pressure measurements. Laboratory analyses encompassed complete blood count with determination of hemoglobin levels, red cell distribution width (RDW), and neutrophil-to-lymphocyte ratio (NLR), as well as serum creatinine with estimated glomerular filtration rate (eGFR) [
33], C-reactive protein (CRP), high-sensitivity cardiac troponin T (hs-TnT), and N-terminal pro-brain natriuretic peptide (NT-proBNP). A standard 12-lead electrocardiogram (ECG) was obtained in all participants. Transthoracic echocardiography was performed at baseline and included STE analysis of myocardial deformation parameters, specifically LV-GLS, left ventricular global circumferential strain (LV-GCS), right ventricular global longitudinal strain (RV-GLS), left atrial reservoir strain (LASr), and right atrial reservoir strain (RASr). All echocardiographic examinations were carried out on the same day by a single experienced cardiologist to minimize inter-observer variability.
2.3. Conventional Echocardiographic Assessment
All echocardiographic studies were performed using a commercially available Philips Sparq ultrasound system (Philips, Andover, Massachusetts, USA) equipped with a 2.5-MHz transducer. Image acquisition was conducted with patients in the left lateral decubitus position, and measurements were obtained in accordance with the recommendations of the American Society of Echocardiography and the European Association of Cardiovascular Imaging [
34,
35].
The following two-dimensional echocardiographic parameters were recorded: aortic root and ascending aorta diameters measured using the leading-edge–to-leading-edge method; relative wall thickness (RWT), calculated as twice the posterior wall thickness divided by left ventricular end-diastolic diameter; left ventricular mass index (LVMi), derived using the Devereux formula; indexed left ventricular end-diastolic and end-systolic volumes (LVEDVi and LVESVi); and LVEF, assessed using the biplane modified Simpson method as an indicator of systolic function [
34]. Additional measurements included left atrial volume index (LAVi), right ventricular inflow tract (RVIT) diameter, tricuspid annular plane systolic excursion (TAPSE) as a marker of right ventricular systolic performance, and inferior vena cava (IVC) diameter during spontaneous respiration.
Doppler analysis included transmitral early-to-late diastolic flow velocity ratio (E/A) and the ratio between early mitral inflow velocity and averaged mitral annular early diastolic velocity (E/e′) as indices of left ventricular diastolic function and filling pressures, respectively [
35]. Systolic pulmonary artery pressure (sPAP) was estimated using the modified Bernoulli equation (sPAP = 4 × TRV² + estimated right atrial pressure) [
36]. The severity of concomitant valvular heart disease was graded according to current AHA/ACC guidelines [
37].
2.4. Myocardial Deformation Analysis by Speckle-Tracking Echocardiography
Following completion of conventional TTE, myocardial deformation analysis was performed using high-quality two-dimensional images suitable for speckle-tracking analysis. Longitudinal strain of the left ventricle was assessed from apical four-, two-, and three-chamber views, while circumferential strain was derived from basal, mid-ventricular, and apical short-axis views. Image analysis was performed using automated function imaging with the Q-Analysis module of the Philips QLAB software.
According to the QLAB protocol, the left ventricular myocardium was automatically divided into seven segments for each apical projection. Peak systolic strain was defined as the maximal myocardial shortening during systole for both longitudinal and circumferential components. Global longitudinal strain and global circumferential strain were calculated as the average of segmental peak strain values and displayed using a standardized bull’s-eye representation. Early diastolic peak strain rate was derived from the corresponding strain curves for both deformation components [
17].
Right ventricular global longitudinal strain was obtained by averaging segmental strain values derived from the apical four-chamber view. Right ventricular free wall longitudinal strain (RV-FWLS) was calculated as the mean strain of the basal, mid, and apical segments of the right ventricular lateral wall, excluding septal segments, in accordance with current recommendations [
38].
Left atrial strain analysis was performed using a biplane approach. In both apical four- and two-chamber views, the left atrial endocardial border was automatically segmented into seven regions. Left atrial conduit strain (LAScd), contractile strain (LASct), and reservoir strain (LASr) were measured, with LASr defined as the sum of LAScd and LASct. Final LAS values were obtained by averaging measurements from the two apical views [
39]. Strain rate analysis was additionally performed to quantify atrial deformation during ventricular systole, early diastole, and late diastole. Left atrial stiffness was estimated as the ratio between LASr and E/e′ [
40].
Right atrial reservoir strain (RASr) was assessed by positioning reference points at the septal and lateral portions of the tricuspid annulus and along the superior right atrial endocardial border, following standardized methodology [
41].
Finally, the time required to complete each speckle-tracking echocardiographic examination was recorded and expressed in minutes.
Normal reference values were defined as absolute strain values >20% for LV-GLS [
32], >23.6% for LV-GCS [
42], >20% for RV-GLS [
43], >39% for LASr [
44], and >44% for RASr [
45].
2.5. Outcome Assessment
Patients were prospectively followed according to a predefined schedule including three study visits: at baseline, prior to immune checkpoint inhibitor initiation, and at 1 month and 3 months after treatment start, with the primary aim of evaluating short-term changes in biventricular and biatrial myocardial mechanics. Longitudinal variations in myocardial deformation parameters were considered the main outcome of the study.
As additional outcome assessments, the study also explored factors associated with immune checkpoint inhibitor–related left ventricular dysfunction, defined as a relative reduction in LV-GLS greater than 15% compared with baseline values [
46]. Independent predictors of this strain-based ventricular dysfunction were evaluated.
Furthermore, the occurrence of adverse clinical events, including unplanned emergency department visits, episodes of clinical deterioration, and all-cause mortality, was assessed as an exploratory outcome. Independent predictors of these adverse events were also analyzed. In addition to scheduled visits, all unscheduled hospital admissions, clinical worsening, and deaths were systematically recorded from baseline evaluation through a mean observational period of 5.4 ± 3 months.
2.6. Statistical Analysis
Sample size estimation was performed using G*Power software (version 3.1.9.4) for a repeated-measures analysis of variance (ANOVA) within subjects. A medium effect size (f = 0.25) was assumed, derived from the expected difference in LV-GLS between baseline (20%) and three-month follow-up (19.5%), divided by the pooled standard deviation of LV-GLS measurements at the two time points (pooled SD = 2). Assuming three repeated measurements, a statistical power of 80%, and a two-sided alpha level of 0.05, the minimum required sample size was calculated to be 28 patients.
The distribution of continuous variables was assessed using the Kolmogorov–Smirnov test. Variables showing an approximately normal distribution are presented as mean ± standard deviation, whereas non-normally distributed data are reported as median with interquartile range (25th–75th percentiles). Repeated-measures ANOVA was applied to compare haemodynamic, laboratory, conventional echocardiographic, and myocardial strain parameters across the three predefined time points—baseline (prior to ICI initiation), 1 month, and 3 months after treatment initiation—provided that the assumption of normality was satisfied. Categorical variables expressed as percentages and assessed at the three time points (T0, T1, and T2), including left ventricular geometric patterns as well as the presence of more than mild mitral, aortic, and tricuspid regurgitation, were compared using the Cochran’s Q test. For ease of interpretation and clarity, LV-GLS, LV-GCS, and RV-GLS were expressed as absolute positive values throughout the analyses.
As part of additional outcome analyses, univariate logistic regression was used to identify variables associated with ICI–related left ventricular dysfunction, defined as a relative reduction in LV-GLS greater than 15% from baseline at the three-month follow-up [
46]. For each covariate, odds ratios (ORs) with corresponding 95% confidence intervals (CIs) were calculated.
Furthermore, Cox proportional hazards regression analysis was performed to investigate independent predictors of adverse clinical events—defined as unplanned emergency department visits and/or clinical deterioration—and all-cause mortality from baseline through the follow-up period (mean duration 5.4 ± 3 months).
For both logistic and Cox regression analyses, two separate multivariable models were constructed in order to explore the association between different sets of clinically relevant variables and the study outcomes, while maintaining a parsimonious modeling strategy.
Regarding logistic regression analysis for ICI–related left ventricular dysfunction, two models were tested. In Model 1, baseline clinical and anthropometric variables were included, specifically age, male sex, and baseline BMI. In Model 2, follow-up variables measured at the three-month evaluation (T2) were analyzed, including systolic blood pressure (T2-SBP), neutrophil-to-lymphocyte ratio at T2 (T2-NLR), and exposure to pembrolizumab therapy.
Similarly, Cox proportional hazards regression analysis for adverse clinical events and/or mortality was performed using three distinct models. In Cox Model 1, age and baseline left ventricular global longitudinal strain (T0-LV-GLS) were included to assess the prognostic role of baseline myocardial deformation. In Cox Model 2, age and baseline inflammatory status, expressed by the neutrophil-to-lymphocyte ratio at baseline (T0-NLR), were entered into the model. In Cox Model 3, age and cancer stage (metastatic versus nonmetastatic disease) were evaluated to explore the prognostic impact of metastatic status on adverse clinical outcomes.
Multivariable analyses were performed only when the number of observed outcome events was sufficient relative to the number of covariates included, in accordance with accepted methodological recommendations aimed at minimizing overfitting and ensuring model robustness.
Receiver operating characteristic (ROC) curve analysis was additionally performed for continuous variables that resulted significant in logistic and/or Cox regression analyses, in order to assess their discriminative ability and to identify optimal cut-off values. The optimal thresholds were determined using the Youden index (J = sensitivity + specificity − 1). Area under the ROC curve (AUC) values were reported with 95% CIs, along with the corresponding sensitivity and specificity at the identified cut-off.
To assess intra- and inter-observer reproducibility of LV-GLS measurements, strain analysis was repeated in a predefined subgroup of patients by the same cardiologist who performed the original examinations and independently by a second cardiologist. Both observers were blinded to clinical data and prior measurements. Measurement reliability was quantified using the intraclass correlation coefficient (ICC) with 95% confidence intervals; an ICC value ≥0.70 was considered indicative of acceptable agreement.
All statistical analyses were conducted using SPSS software, version 28 (SPSS Inc., Chicago, Illinois, USA). A two-tailed p value <0.05 was considered statistically significant.
3. Results
3.1. Baseline Demographic and Clinical Data
The baseline characteristics of the study population are summarized in
Table 1.
A total of 28 consecutive patients undergoing immune checkpoint inhibitor therapy were included in the analysis. The study population consisted of middle-aged to older adults with a balanced distribution of body size and a slight predominance of female patients. Overall cardiovascular risk burden was moderate: hypertension and smoking were the most frequently observed risk factors, whereas diabetes mellitus, dyslipidemia, and established coronary artery disease were relatively uncommon.
Patients were affected by a heterogeneous spectrum of advanced malignancies, with breast cancer and melanoma representing the most common diagnoses, followed by lung, renal, colorectal, and esophageal cancers. Half of the study population (n = 14, 50.0%) had metastatic disease at baseline, while the remaining patients had nonmetastatic cancer treated in the neoadjuvant or adjuvant setting. Most patients received programmed cell death protein-1 (PD-1) inhibitor–based therapy, predominantly pembrolizumab or nivolumab, while a minority were treated with combination immunotherapy or PD-L1 inhibition. Immune checkpoint inhibitors were administered as neoadjuvant therapy in 7 patients (25.0%), as adjuvant therapy in 7 patients (25.0%), and for metastatic disease in 14 patients (50.0%). Seven patients (25.0%) received concomitant anthracycline-based therapy in the neoadjuvant ICI setting.
At baseline, the use of cardiovascular medications reflected the moderate prevalence of cardiovascular risk factors, with angiotensin-converting enzyme inhibitors or angiotensin receptor blockers and beta-blockers being the most commonly prescribed treatments. Antiplatelet agents and diuretics were used in approximately one-quarter of patients, whereas anticoagulants, statins, and antiarrhythmic drugs were infrequently prescribed.
3.2. Serial Hemodynamic and Laboratory Assessments
Table 2 summarizes hemodynamic parameters and laboratory findings at baseline (T0), 1-month (T1), and 3-month (T2) follow-up.
Hemodynamic parameters remained overall stable throughout the follow-up period, with no significant changes in heart rate or systolic and diastolic blood pressure from baseline to 1- and 3-month evaluations. Similarly, renal function indices and markers of myocardial injury, including serum creatinine, estimated glomerular filtration rate, and high-sensitivity troponin T, did not show significant longitudinal variations.
In contrast, inflammatory biomarkers exhibited a significant progressive increase over time. Red cell distribution width and neutrophil-to-lymphocyte ratio rose markedly from baseline to follow-up, reaching their highest values at 3 months. A significant increase in CRP levels was also observed during follow-up. Hemoglobin levels showed a mild downward trend without reaching statistical significance. Natriuretic peptide concentrations demonstrated wide interindividual variability and did not significantly change over time.
3.3. Serial Conventional Echocardiographic Assessment
Conventional echoDoppler parameters at baseline (T0), 1-month (T1), and 3-month (T2) follow-up are listed in
Table 3.
Conventional echocardiographic parameters remained largely stable throughout the follow-up period. Left ventricular wall thickness, chamber dimensions, RWT, and LVMi did not show significant longitudinal variations. Accordingly, the distribution of left ventricular geometric patterns remained unchanged over time, with normal geometry being the most prevalent finding.
Left ventricular volumes and systolic function, as assessed by LVEF, were preserved at all time points, without significant differences from baseline to follow-up. Indices of left ventricular diastolic function, including transmitral flow velocities and E/average e′ ratio, also remained stable. Left atrial volume index did not show significant changes during follow-up.
The prevalence of more than mild valvular regurgitation was low and did not significantly vary over time for mitral, aortic, or tricuspid valves.
Right ventricular size and systolic function, assessed by RVIT diameter and TAPSE, respectively, remained within normal ranges, with no significant longitudinal changes. Similarly, estimated sPAP showed no significant variation during follow-up.
3.4. Longitudinal Changes in Myocardial Strain Parameters
Table 4 details myocardial strain and strain rate parameters measured at baseline (T0), 1-month (T1), and 3-month (T2) follow-up.
A significant and progressive impairment of left ventricular longitudinal mechanics was observed during follow-up. Longitudinal strain and strain rate derived from all apical views showed a consistent reduction over time, resulting in a significant decrease in LV-GLS and its corresponding strain rate at 3 months compared with baseline. In contrast, left ventricular circumferential strain parameters, including segmental and global circumferential strain and strain rate, did not exhibit significant longitudinal changes.
Left atrial mechanics showed an early and marked deterioration during follow-up. All components of left atrial strain—including conduit, contractile, and reservoir function—progressively declined from baseline to 3 months. This was paralleled by a significant reduction in atrial strain rate parameters across all functional phases and by an increase in the echocardiographic index of left atrial stiffness, indicating worsening atrial compliance over time.
Similarly, right atrial myocardial deformation parameters demonstrated a significant and progressive decline throughout the follow-up period. Right atrial conduit, contractile, and reservoir strain values, as well as corresponding strain rate indices, were significantly reduced at 3 months compared with baseline, suggesting early involvement of right atrial mechanics.
Right ventricular longitudinal function was also affected during follow-up. Both RV-GLS and RV-FWLS showed a significant reduction over time, accompanied by a decrease in right ventricular longitudinal strain rate, despite the absence of significant changes in conventional right ventricular systolic indices.
Finally, the time required to complete speckle-tracking echocardiographic analysis remained stable throughout the study period, supporting the feasibility of comprehensive biventricular and biatrial strain assessment in routine clinical practice.
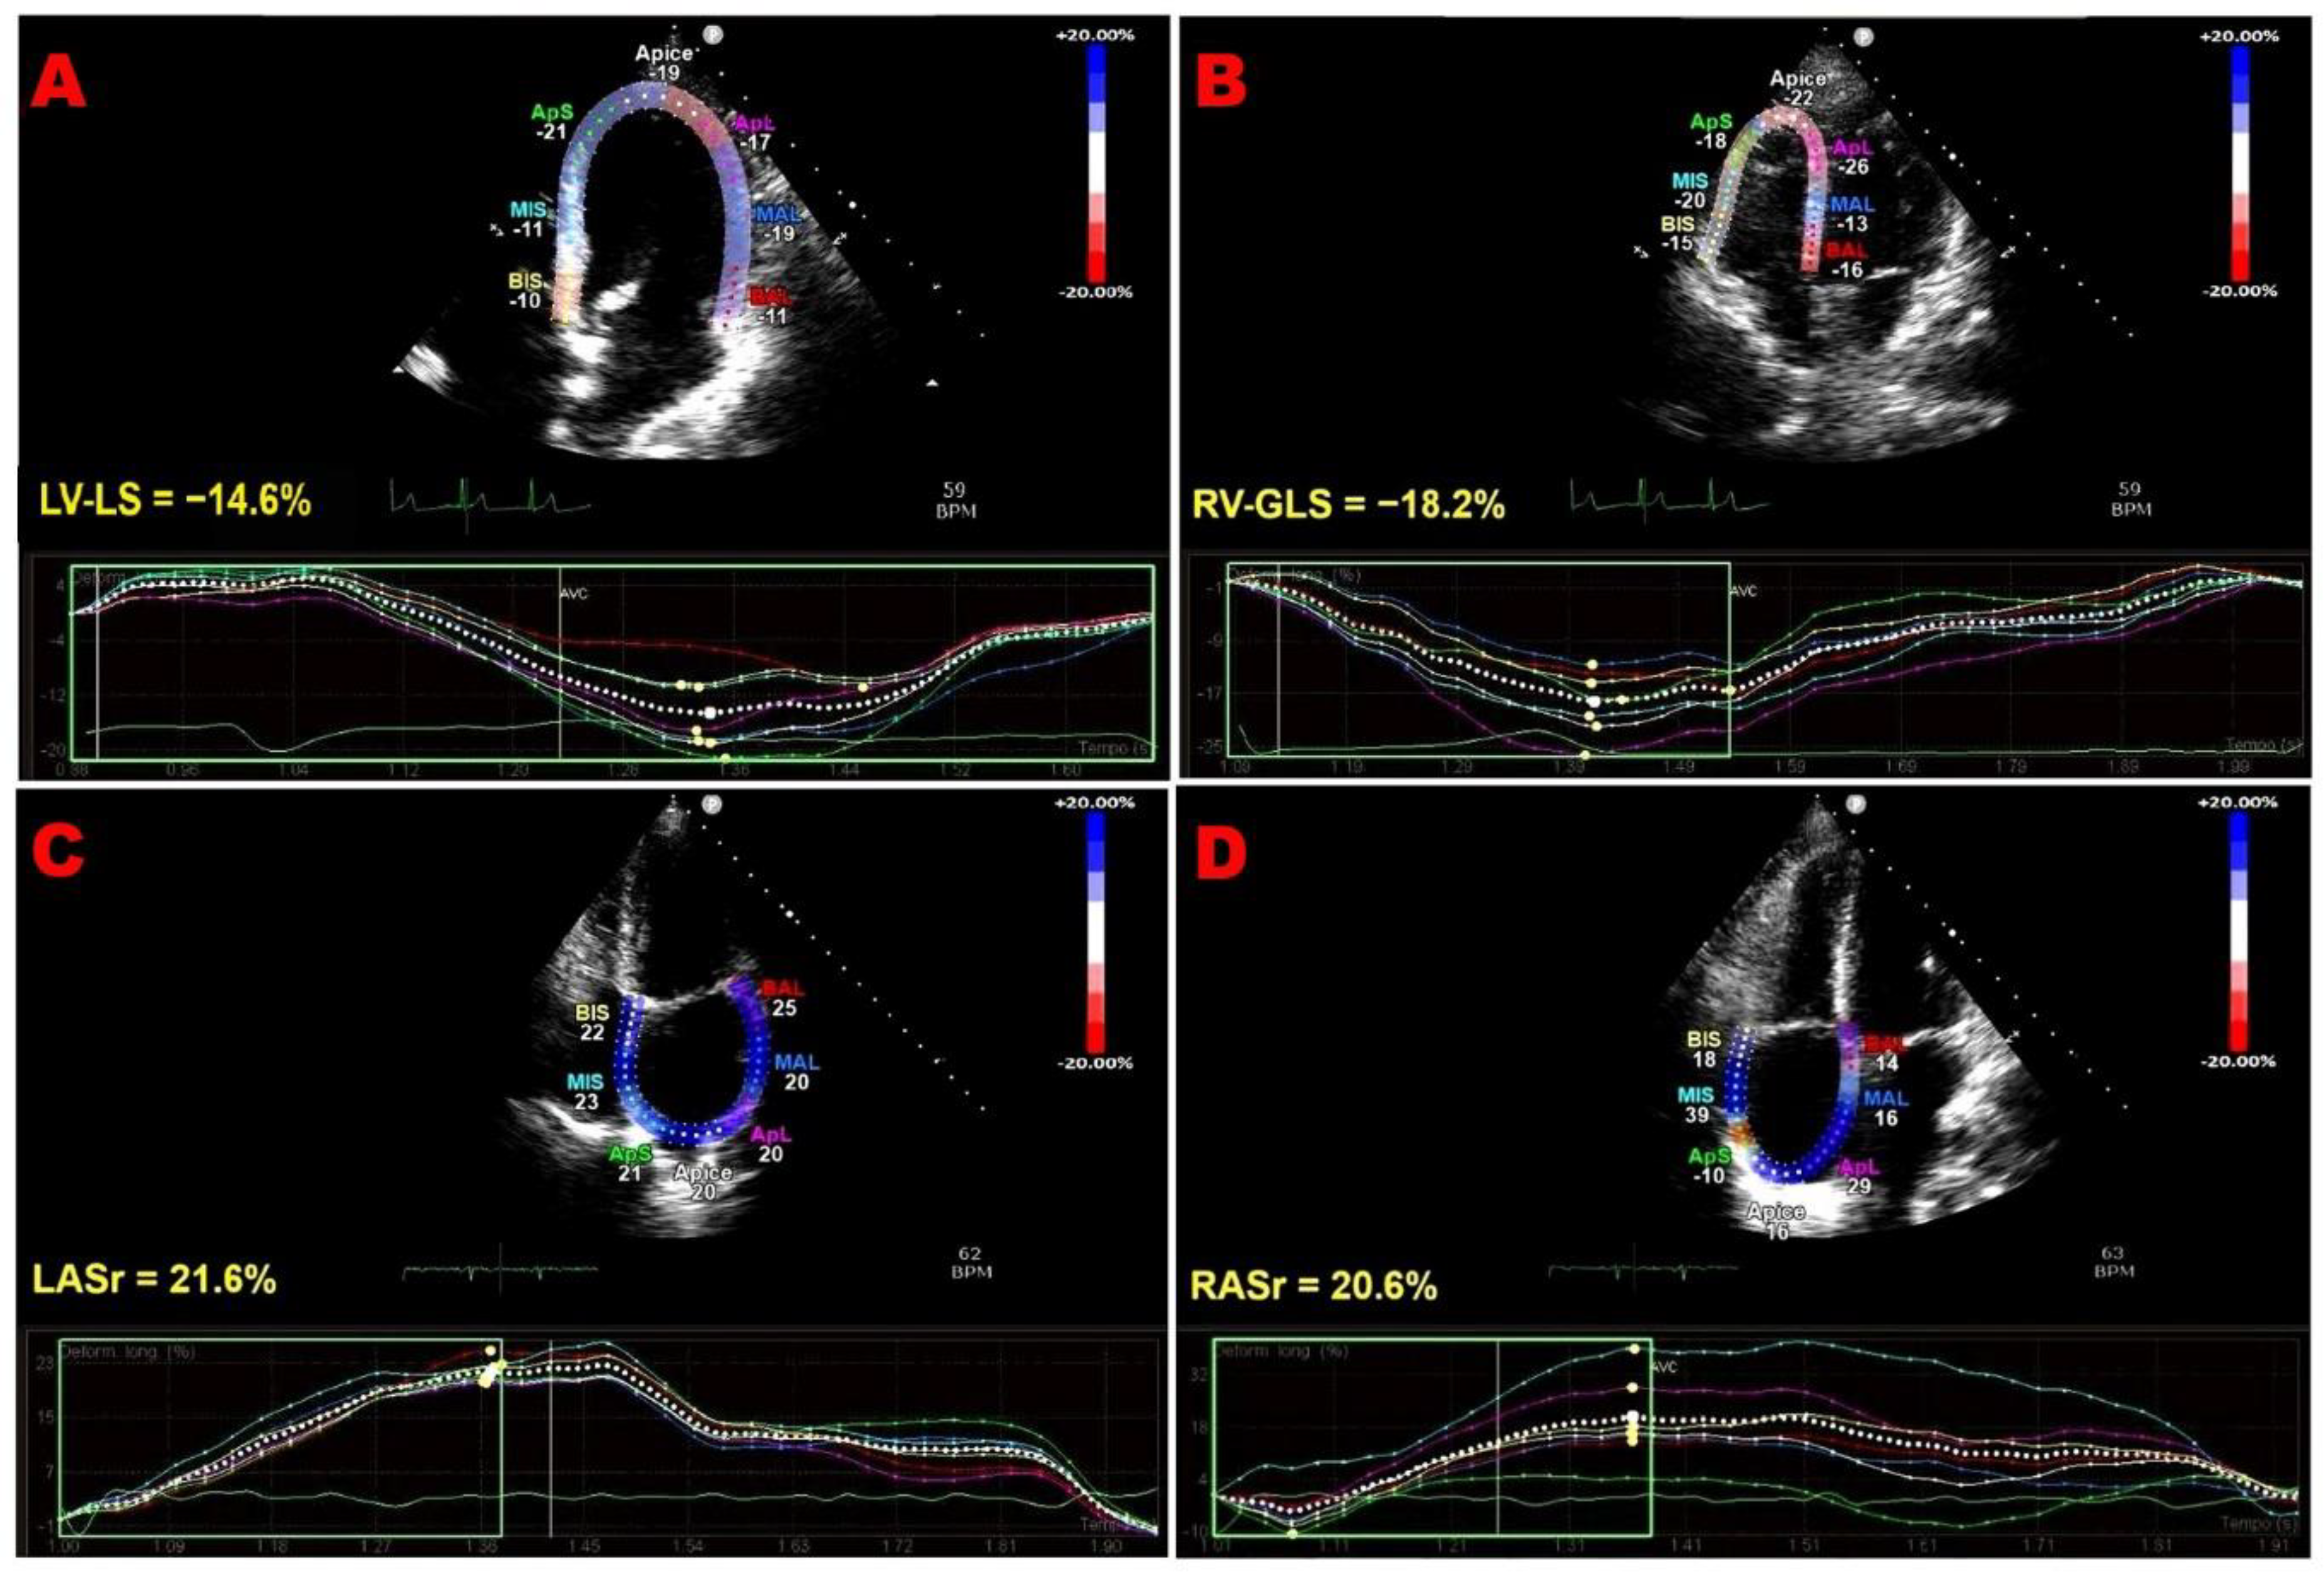
Figure 1 shows representative examples of biventricular and biatrial dysfunction identified by speckle-tracking echocardiography in an ICI-treated patient enrolled in the present study.
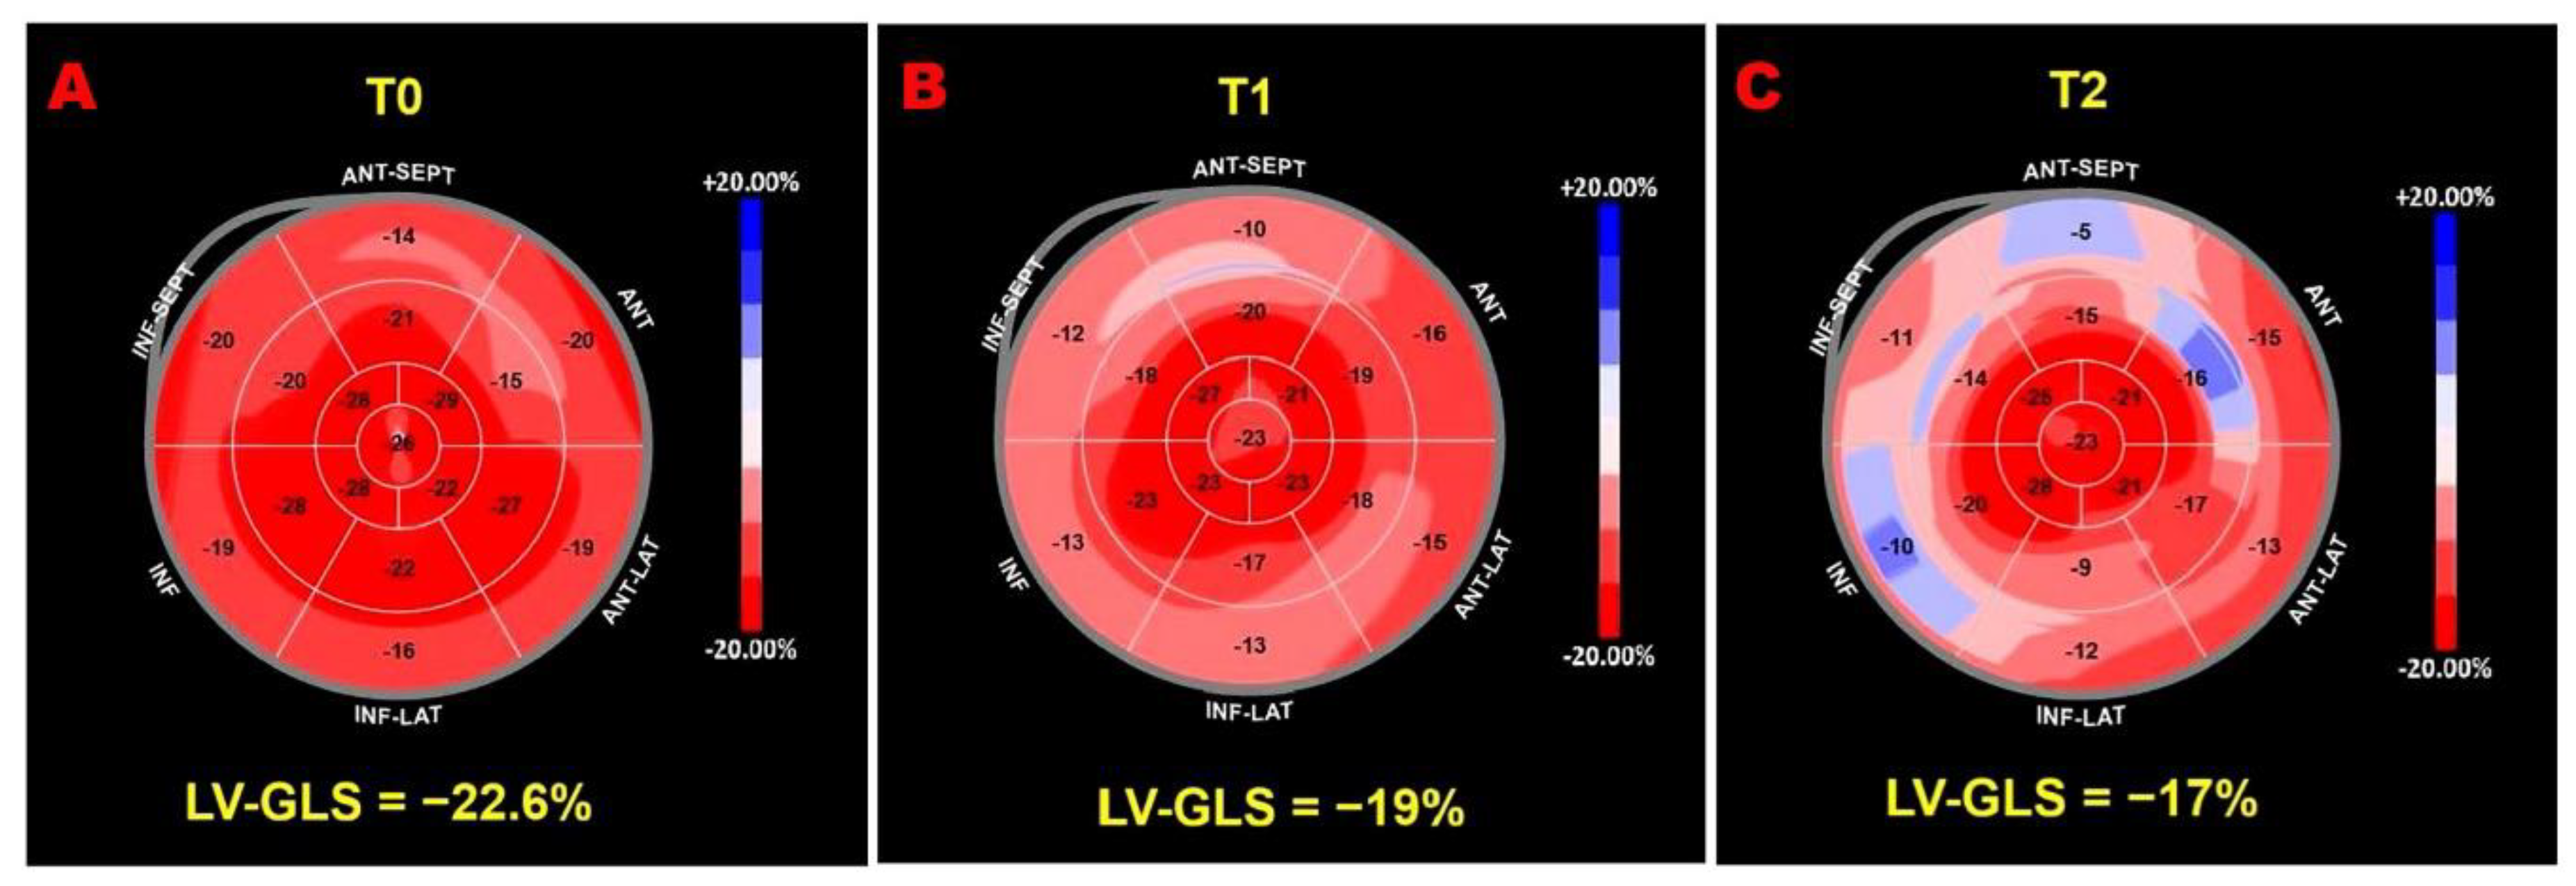
Figure 2 illustrates serial LV-GLS bull’s-eye plots from an ICI-treated patient who developed a >15% reduction in LV-GLS compared with baseline.
3.5. Predictors of Subclinical Left Ventricular Dysfunction
At the 3-month follow-up (T2), subclinical left ventricular dysfunction—defined as a relative reduction in LV-GLS greater than 15% compared with baseline [
46]—was observed in 24 out of 28 patients (85.7%). The results of logistic regression analyses evaluating predictors of ICI–related left ventricular dysfunction are presented in
Table 5 and Table 6.
Table 5 (Model 1) reports the logistic regression analysis including baseline demographic and anthropometric variables. In this model, age was significantly associated with LV-GLS impairment, whereas sex and baseline BMI were not independently associated with the outcome.
ROC curve analysis indicated that an age ≥46 years was associated with LV-GLS impairment in ICI-treated patients, with 96% sensitivity and 100% specificity (AUC = 0.99; 95% CI, 0.96-1.00; p = 0.002).
Table 6 (Model 2) presents the logistic regression analysis including variables assessed at 3-month follow-up. In this model, NLR measured at T2 emerged as a significant predictor of LV-GLS impairment, while systolic blood pressure and exposure to pembrolizumab therapy were not independently associated with treatment-related left ventricular dysfunction.
ROC curve analysis demonstrated that a T2-NLR (measured at the 3-month follow-up) ≥4 predicted LV-GLS impairment in ICI-treated patients with 100% sensitivity and 100% specificity (AUC = 1.00; 95% CI, 1.00–1.00; p = 0.002).
Overall, these findings suggest that both older age and increased systemic inflammatory burden during follow-up are associated with a higher likelihood of developing subclinical ICI-related left ventricular dysfunction.
3.6. Cox Regression Analyses for Adverse Clinical Events and Mortality
During a mean follow-up period of 5.4 ± 3 months, a total of 15 adverse clinical events were recorded. Five patients died during follow-up. Among non-fatal events, three patients required emergency department admission for worsening dyspnea associated with pleural effusion, three for sepsis related to urinary or respiratory tract infections, two for severe anemia, and two for atrial fibrillation complicated by hemodynamic decompensation.
The results of univariate and multivariate Cox proportional hazards regression analyses evaluating predictors of adverse clinical events and/or all-cause mortality during follow-up are presented in
Table 7, Table 8 and Table 9.
Table 7 (Model 1) reports the Cox regression analysis including baseline demographic variables and baseline left ventricular myocardial deformation. In this model, both age and baseline left ventricular global longitudinal strain (T0-LV-GLS) were independently associated with the risk of adverse clinical outcomes. Increasing age was associated with a higher hazard of events, whereas more preserved baseline LV-GLS values were associated with a significantly lower risk, highlighting the prognostic relevance of baseline myocardial mechanics.
ROC curve analysis demonstrated that an age ≥67 years predicted short-term adverse clinical outcomes in ICI-treated patients with 93% sensitivity and 85% specificity (AUC = 0.95; 95% CI, 0.87–1.00; p < 0.001). In comparison, a baseline LV-GLS ≤19.5% predicted short-term adverse clinical outcomes with 100% sensitivity and 100% specificity (AUC = 1.00; 95% CI, 1.00–1.00; p < 0.001).
Table 8 (Model 2) presents the Cox regression analysis evaluating baseline systemic inflammatory status. In this model, age remained independently associated with adverse clinical outcomes, while baseline neutrophil-to-lymphocyte ratio (T0-NLR), although significant at univariate analysis, did not retain independent prognostic significance after multivariable adjustment.
A third Cox regression model (
Model 3) was constructed to explore the prognostic impact of cancer stage. In this univariate model, age remained significantly associated with adverse clinical outcomes, whereas the presence of metastatic cancer at baseline was not significantly associated with the risk of adverse events or mortality (
Table 9).
Overall, these findings indicate that baseline left ventricular longitudinal mechanics provide incremental prognostic information for short-term adverse clinical outcomes in patients undergoing ICI therapy, whereas baseline inflammatory markers appear to have a weaker independent association.
3.7. Measurement Variability
Reproducibility of LV-GLS measurements was assessed by evaluating both intraobserver and interobserver variability in a predefined subgroup of 15 cancer patients. Overall, agreement was found to be excellent. Intraobserver reliability showed a very high level of concordance, as reflected by an ICC of 0.97 (95% confidence interval [CI], 0.94–0.99). Similarly, interobserver agreement was also strong, with an ICC of 0.91 (95% CI, 0.79–0.97). These findings support the robustness and reliability of LV-GLS assessment in the present study. Detailed results are provided in the Supplementary Material (Supplementary Material S1).
4. Discussion
4.1. Principal Findings
In this prospective, monocentric study of patients with advanced cancer undergoing ICI therapy, we observed a consistent pattern of early subclinical myocardial dysfunction affecting both ventricles and both atria, despite preserved conventional echocardiographic parameters. Over a three-month follow-up, the vast majority of patients developed a significant reduction in LV-GLS, reflecting a progressive impairment of longitudinal myocardial mechanics, while LVEF, chamber dimensions, and diastolic indices remained stable. These deformation abnormalities occurred in parallel with a gradual and significant increase in systemic inflammatory indices, including NLR and CRP, whereas circulating markers of myocardial injury and wall stress, such as high-sensitivity troponin T and NT-proBNP, did not show significant longitudinal changes. In contrast, left ventricular circumferential mechanics remained largely preserved, as neither global nor segmental circumferential strain or strain rate showed significant changes over time, suggesting a selective vulnerability of longitudinal fibers in the early phase of ICI-related myocardial involvement. In parallel, right ventricular longitudinal mechanics progressively deteriorated, indicating early biventricular involvement.
Beyond ventricular mechanics, a key novel finding of the present study is the consistent and marked impairment of biatrial myocardial function. Both left and right atrial reservoir, conduit, and contractile strain parameters declined significantly during follow-up, accompanied by worsening atrial strain rate indices and increased left atrial stiffness. These changes occurred in the absence of significant atrial enlargement, highlighting the sensitivity of speckle-tracking echocardiography in detecting early atrial dysfunction.
Importantly, exploratory regression analyses identified older age and greater systemic inflammatory burden as significant correlates of ICI-related left ventricular strain impairment, while baseline LV-GLS emerged as a robust independent predictor of adverse clinical events and mortality during follow-up. Notably, cancer stage at baseline, including the presence of metastatic disease, did not independently influence short-term adverse clinical outcomes, suggesting that early prognosis in ICI-treated patients may be more closely driven by myocardial functional vulnerability than by oncologic disease burden.
4.2. Comparison with Previous Studies
Our findings are largely consistent with previous echocardiographic studies investigating the impact of ICI therapy on myocardial deformation, while also extending current knowledge by providing a comprehensive evaluation of biventricular and biatrial mechanics.
Most available studies [
23,
24,
25,
26,
27,
28,
29,
30,
31] have primarily focused on LV-GLS, which was assessed in the vast majority of published reports, whereas circumferential and radial strain parameters, as well as atrial and right ventricular strain, were evaluated far less frequently. Across these studies, a significant deterioration of LV-GLS following ICI therapy has been commonly reported, with relative reductions ranging approximately between 9% and 19%, despite minimal or absent changes in conventional indices such as LVEF [
47].
In line with this literature, our study demonstrated a significant and progressive reduction in LV-GLS over short-term follow-up, while LVEF and other standard echocardiographic parameters remained preserved. Importantly, the absence of significant changes in LV-GCS in our cohort is consistent with observations from other clinical settings, in which GLS impairment typically precedes GCS deterioration [
48,
49]. This temporal dissociation reflects the pivotal role of long-axis function in left ventricular systolic performance, which contributes approximately 60% of total stroke volume [
50]. Moreover, longitudinally oriented subendocardial fibers exhibit higher oxygen consumption and are particularly vulnerable to ischemia and inflammatory injury [
51]. As a result, longitudinal strain is altered in the early phases of various cardiac diseases and is generally considered more sensitive than circumferential or radial strain for detecting subclinical myocardial dysfunction [
52].
It is noteworthy that a small number of prior investigations did not observe significant LV-GLS changes after ICI exposure [
25,
31]; however, these discrepancies may reflect heterogeneity in study design, imaging timing, cancer type, or baseline cardiovascular risk profile. Importantly, our data are concordant with studies reporting that strain-based metrics detect myocardial involvement earlier and more sensitively than conventional echocardiography.
Previous echocardiographic studies that simultaneously assessed left and right ventricular mechanics have described a concomitant impairment of biventricular longitudinal function after ICI therapy, supporting the concept of diffuse myocardial involvement [
23,
25,
28]. Our findings confirm and reinforce this observation, showing parallel deterioration of LV-GLS, RV-GLS, and RV-FWLS, even in the absence of overt right ventricular systolic dysfunction as assessed by TAPSE.
Data on atrial mechanics in ICI-treated patients remain particularly scarce. Only a limited number of studies have evaluated atrial strain [
25], and even fewer have explored biatrial function. In this context, the present study provides novel evidence of early and marked impairment of both left and right atrial mechanics, involving reservoir, conduit, and contractile phases. These findings expand previous observations and suggest that atrial dysfunction may represent an integral component of ICI-related subclinical cardiotoxicity, rather than a secondary phenomenon related solely to ventricular impairment.
Unlike some prior reports, no cases of clinically overt myocarditis were documented in our cohort. This supports the concept that significant myocardial deformation abnormalities may occur independently of overt inflammatory cardiomyopathy, reinforcing the role of strain imaging as a sensitive tool for detecting early and potentially reversible myocardial injury in patients receiving ICIs.
4.3. Pathophysiological mechanisms underpinning subclinical myocardial dysfunction in ICI-treated patients
Growing experimental evidence supports the concept that ICI therapy promotes a systemic and myocardial pro-inflammatory milieu that may lead to early, subclinical myocardial dysfunction, even in the absence of overt myocarditis. Preclinical studies have consistently demonstrated that short-term exposure to ICIs induces T-cell hyperactivation, resulting in direct cardiomyocyte injury and the release of damage-associated molecular patterns and pro-inflammatory cytokines, including interleukins (IL-1α, IL-1β, IL-6, IL-17α), interferon-γ, and tumor necrosis factor-α [
53]. These inflammatory cascades have been linked to myocardial strain impairment and to the activation of profibrotic pathways, as evidenced by increased expression of galectin-3, procollagen type I, and matrix metalloproteinases, ultimately favoring early myocardial remodeling [
53].
Consistent with these experimental observations, cardiac magnetic resonance feature-tracking (CMR-FT) studies have shown that patients treated with ICIs may develop early and diffuse myocardial edema, which likely reflects immune cell infiltration within the myocardium [
4]. Persistent inflammatory activation may subsequently promote progressive interstitial fibrosis as a longer-term consequence of ongoing myocardial injury [
54]. These alterations of the myocardial extracellular matrix are known to increase myocardial stiffness, thereby adversely affecting myocardial deformation and reducing the magnitude of strain parameters assessed by imaging techniques [
22,
55,
56].
Importantly, experimental models suggest that different immune checkpoint targets may exert heterogeneous cardiovascular effects. Anti–PD-1 therapy has been associated with a more pronounced activation of NF-κB signaling, cardiomyocyte hypertrophy, and vascular inflammation compared with CTLA-4 inhibition, potentially explaining differential patterns of myocardial involvement observed in clinical practice [
53]. Additional mechanistic insights indicate that ICI-related cardiotoxicity may also be mediated indirectly through alterations in gut microbiota composition. Inhibition of the PD-1/PD-L1 axis has been shown to induce dysbiosis, reduce short-chain fatty acid production, and promote macrophage polarization toward a pro-inflammatory phenotype, thereby amplifying myocardial inflammation and cardiomyocyte apoptosis via cytokine-driven pathways [
57].
Beyond direct myocardial effects, ICIs have been shown to exacerbate vascular and endothelial inflammation. Both CTLA-4 and PD-1/PD-L1 blockade promote T-cell–driven inflammatory responses within the vascular wall, accelerating atherosclerotic plaque progression, endothelial activation, and necrotic core expansion in preclinical models [
58,
59]. These systemic inflammatory and vascular effects may further contribute to myocardial strain abnormalities by increasing afterload, impairing coronary microcirculation, and promoting diffuse myocardial injury.
While acute ICI-related myocarditis represents the most severe manifestation of immune-mediated cardiotoxicity, it remains a relatively rare complication and was not observed in the present cohort. Nevertheless, mechanistic overlap likely exists between fulminant myocarditis and milder, subclinical myocardial involvement. Both conditions are characterized by immune tolerance breakdown, expansion of activated T-cell populations, macrophage infiltration, and cytokine-mediated myocardial injury [
60,
61,
62]. Our findings suggest that even in the absence of clinically overt myocarditis, sustained immune activation and low-grade inflammation during ICI therapy may be sufficient to impair myocardial deformation properties, particularly those assessed by strain imaging, which are highly sensitive to early changes in myocardial structure and function.
As myocardial stiffness increases, the extent of myocardial deformation progressively declines, resulting in lower strain values across multiple cardiac chambers. This pathophysiological process is not confined to the left ventricle but may involve both ventricles and atria, as demonstrated by prior imaging studies in various clinical settings [
63,
64,
65,
66] and supported by the diffuse pattern of strain impairment observed in the present study. Notably, some investigators have reported that right ventricular mechanical impairment may precede the decline in LV-GLS during ICI therapy [
25]. This early involvement of the right ventricle has been attributed to its smaller myocardial mass and thinner wall structure, which may render it more susceptible to immune-mediated injury compared with the left ventricle [
67]. In addition, because the interventricular septum is shared by both ventricles and contributes substantially to their systolic performance, RV-GLS is intrinsically influenced by both RV and LV function, further underscoring the concept of ventricular mechanical interdependence [
68].
Although data specifically addressing the impact of ICIs on biatrial reservoir strain remain limited, it is plausible that early biatrial dysfunction represents a downstream consequence of altered biventricular mechanics. Myocardial edema and increased myocardial stiffness may impair atrial reservoir function by reducing atrial compliance and ventricular–atrial coupling, leading to lower atrial strain values. Similar reductions in biatrial reservoir strain have been described in conditions characterized by chronic pressure overload and myocardial stiffening [
69,
70].
Taken together, these data support the hypothesis that inflammation-driven myocardial injury represents a central pathophysiological mechanism underlying subclinical biventricular and biatrial dysfunction in ICI-treated patients. This mechanistic framework aligns with the progressive strain impairment observed in our study and provides a biological rationale for the integration of advanced myocardial deformation imaging into early cardio-oncology surveillance strategies.
4.4. Clinical Translation of the Findings
Taken together, the results of the present study further reinforce the clinical value of myocardial strain imaging for the early detection of subclinical cardiotoxicity in patients treated with immune checkpoint inhibitors. In our cohort, a marked reduction in LV-GLS was observed in the majority of patients within a short time frame, despite preserved LVEF and stable conventional echocardiographic parameters. This finding is consistent with the well-established role of LV-GLS as a sensitive and highly reproducible marker of left ventricular systolic function [
71,
72,
73], capable of identifying early myocardial impairment even in the presence of preserved LVEF [
74,
75]. Importantly, in our study baseline LV-GLS also emerged as an independent predictor of adverse clinical events and mortality, underscoring its prognostic relevance beyond diagnostic purposes [
76,
77,
78].
Current ESC cardio-oncology guidelines recommend baseline LV-GLS assessment in patients receiving potentially cardiotoxic therapies and identify a relative GLS reduction of approximately 15% as a threshold suggestive of subclinical myocardial dysfunction during cancer treatment [
46]. Our findings strongly support the applicability of this cut-off in the setting of ICI therapy, where a high prevalence of GLS decline was observed early after treatment initiation. Moreover, the concomitant deterioration of right ventricular longitudinal strain and the consistent impairment of biatrial mechanics observed in our cohort indicate that ICI-related cardiotoxicity is not confined to the left ventricle, but rather reflects a more diffuse myocardial process.
In this context, reliance on LVEF alone appears insufficient for early cardiovascular surveillance in ICI-treated patients. Comprehensive strain imaging, including biventricular and biatrial assessment, may allow a more accurate characterization of myocardial involvement and facilitate earlier identification of patients at higher risk. The association observed between systemic inflammatory burden and LV-GLS impairment further suggests that integrating imaging findings with inflammatory biomarkers could enhance risk stratification. Early detection of strain abnormalities, even in asymptomatic patients, may therefore prompt closer monitoring and consideration of timely therapeutic interventions—such as optimization of cardioprotective therapy, corticosteroid initiation, or modification of oncologic treatment—potentially reducing the risk of progression toward overt myocarditis or other severe cardiovascular immune-related adverse events. Nonetheless, prospective studies are still needed to define optimal surveillance intervals and management strategies in this emerging clinical scenario.
4.5. Methodological Limitations
Several limitations of the present study should be acknowledged. First, the relatively small sample size, although determined by an a priori power calculation, may limit the generalizability of our findings and reduce the statistical power to detect more subtle associations or smaller effect sizes for certain parameters. Second, the monocentric design may have introduced selection bias related to local referral patterns, patient characteristics, or institutional practices, thereby limiting the external validity of the results. Third, although patients were prospectively followed over a short-term period, the absence of longer-term follow-up precludes evaluation of the persistence, progression, or reversibility of the observed myocardial deformation abnormalities and their long-term clinical implications.
Importantly, the observational nature of the study does not allow definitive causal inference regarding the relationship between ICI therapy and myocardial strain impairment. Although temporal associations were observed, contributory effects of the underlying malignancy, its progression, and its intrinsic inflammatory burden cannot be fully excluded. In addition, oncologic response to ICI therapy and its potential relationship with myocardial deformation changes were not systematically assessed and therefore could not be analyzed in relation to strain deterioration.
In addition, despite the application of a comprehensive echocardiographic protocol incorporating advanced speckle-tracking analysis, several methodological limitations intrinsic to this imaging technique should be considered. Myocardial strain assessment is influenced by image quality and frame rate settings [
79], as well as by operator expertise and contour-tracking accuracy [
80]. Moreover, inter-vendor and software-related variability may affect absolute strain measurements and limit direct comparisons across different studies or platforms [
81]. Strain parameters are also load-dependent and may be modulated by changes in blood pressure and intravascular volume, which could influence myocardial deformation independently of intrinsic myocardial function [
82]. Finally, acoustic window quality and patient-related factors, such as thoracic anatomy and body habitus, may affect tracking feasibility and accuracy, particularly in patients with advanced malignancy or treatment-related physical changes [
83]. These technical considerations should be taken into account when interpreting strain-derived indices and when extrapolating the present findings to broader clinical settings.
Author Contributions
Conceptualization, A.S. and E.F.; methodology, A.S., E.F., N.T. and G.L.N.; software, A.S.; validation, G.L.N. and P.F.; formal analysis, A.S. and N.T.; investigation, A.S., E.F. and N.T.; resources, A.S.; data curation, A.S., E.F. and N.T.; writing—original draft preparation, A.S.; writing—review and editing, G.L.N.; visualization, M.L., M.B. and P.F.; supervision, M.L., M.B., P.F. and P.M; project administration, A.S.; funding acquisition, P.M.. All authors have read and agreed to the published version of the manuscript.
Figure 1.
Representative examples of biventricular and biatrial myocardial strain parameters assessed by speckle-tracking echocardiography from the apical four-chamber (4C) view in an ICI-treated patient enrolled in the present study who developed ICI-related cardiac dysfunction. (A) LV-LS, left ventricular longitudinal strain. (B) RV-GLS, right ventricular global longitudinal strain. (C) LASr, left atrial reservoir strain. (D) RASr, right atrial reservoir strain. For each cardiac chamber, color-coded segmental strain maps are provided together with the corresponding strain curves. ICI, immune checkpoint inhibitors.
Figure 2.
Speckle-tracking echocardiography–derived LV-GLS bull’s-eye plots obtained in a patient enrolled in the present study who developed ICI-related cardiotoxicity. (A) Normal LV-GLS bull’s-eye plot at baseline (T0). (B) Mild impairment of the LV-GLS bull’s-eye plot at the 1-month follow-up (T1). (C) Moderate impairment of the LV-GLS bull’s-eye plot at the 3-month follow-up (T2). ICI, immune checkpoint inhibitors; LV-GLS, left ventricular global longitudinal strain.
Table 1.
Baseline clinical characteristics of ICI-treated patients included in the present study. Continuous variables are expressed as mean ± standard deviation, whereas categorical variables are expressed as number (percentage). ACEi-ARBs, angiotensin-converting enzyme inhibitors/angiotensin receptor blockers; BMI, body mass index; BSA, body surface area; CAD, coronary artery disease; CCB, calcium channel blockers; ICI, immune checkpoint inhibitors.
| |
ICI-treated patients (n = 28) |
| Demographics and anthropometrics |
|
| Age (yrs) |
62.1 ± 16.0 |
| Male sex (%) |
12 (42.8) |
| BSA (m2) |
1.73 ± 0.19 |
| BMI (Kg/m2) |
23.0 ± 3.5 |
| Cardiovascular risk factors and cardiovascular comorbidities |
|
| Smoking (%) |
9 (32.1) |
| Hypertension (%) |
13 (46.4) |
| Type 2 diabetes (%) |
3 (10.7) |
| Dyslipidemia (%) |
2 (7.1) |
| History of CAD (%) |
2 (7.1) |
| Cancer type |
|
| Melanoma (%) |
6 (21.4) |
| Breast (%) |
10 (35.7) |
| Lung (%) |
4 (14.3) |
| Colorectal (%) |
2 (7.1) |
| Kidney (%) |
3 (10.7) |
| Esophagus (%) |
3 (10.7) |
| Metastatic cancer (%) |
14 (50.0) |
| ICI therapy |
|
| Pembrolizumab (%) |
18 (64.3) |
| Nivolumab (%) |
9 (32.1) |
| Pembrolizumab plus Retlimib (%) |
3 (10.7) |
| Durvalumab (%) |
1 (3.6) |
| Co-treatment with antracyclines (%) |
7 (25.0) |
| Neoadjuvant ICI (%) |
7 (25.0) |
| Adjuvant ICI (%) |
7 (25.0) |
| ICI for metastatic cancer (%) |
14 (50.0) |
| Current cardiac treatment |
|
| Anticoagulants (%) |
1 (3.6) |
| Antiplatelets (%) |
7 (25.0) |
| ACEi-ARBs (%) |
12 (42.8) |
| Beta blockers (%) |
10 (35.7) |
| Antiarrhythmics (%) |
1 (3.6) |
| CCB (%) |
7 (25.0) |
| Diuretics (%) |
7 (25.0) |
| Statins (%) |
1 (3.6) |
Table 2.
Hemodynamic parameters and laboratory findings at baseline and during follow-up in ICI-treated patients. All variables are expressed as continuous values and were compared across time points using repeated-measures ANOVA; statistically significant p values are shown in bold. DBP, diastolic blood pressure; eGFR, estimated glomerular filtration rate; Hb, hemoglobin; Hs-TnT, high-sensitivity troponin T; ICI, immune checkpoint inhibitors; NLR, neutrophil-to-lymphocyte ratio; NT-proBNP, N-terminal pro–B-type natriuretic peptide; PCR, C-reactive protein; RDW, red cell distribution width; SBP, systolic blood pressure.
| |
T0 |
T1 |
T2 |
P-value |
| Hemodynamics |
|
|
|
|
| Heart rate (bpm) |
75.1 ± 11.6 |
75.9 ± 11.6 |
76.4 ± 14.7 |
0.96 |
| SBP (mmHg) |
132.4 ± 24.5 |
126.1 ± 20.1 |
125.4 ± 25.1 |
0.74 |
| DBP (mmHg) |
72.7 ± 13.1 |
69.5 ± 6.3 |
68.5 ± 10.9 |
0.61 |
| Blood tests |
|
|
|
|
| Hb (g/dl) |
12.7 ± 2.0 |
12.3 ± 1.7 |
12.0 ± 1.8 |
0.76 |
| RDW (%) |
13.8 ± 1.8 |
15.2 ± 2.6 |
16.8 ± 2.9 |
0.002 |
| NLR |
1.8 ± 0.9 |
2.9 ± 1.5 |
4.2 ± 2.4 |
<0.001 |
| Creatinine (mg/dl) |
0.75 ± 0.21 |
0.74 ± 0.22 |
0.81 ± 0.25 |
0.65 |
| eGFR (ml/min/m2) |
104.5 ± 13.6 |
103.4 ± 10.5 |
98.4 ± 16.6 |
0.55 |
| PCR (mg/dl) |
4.4 ± 3.5 |
13.9 ± 20.0 |
33.4 ± 44.3 |
0.03 |
| Hs-TnT (ng/l) |
4.2 ± 3.3 |
5.0 ± 3.9 |
5.5 ± 4.0 |
0.68 |
| NT pro-BNP (pg/ml) |
300.6 ± 319.7 |
575.8 ± 1305.8 |
416.3 ± 436.0 |
0.69 |
Table 3.
Conventional echoDoppler parameters at baseline and during follow-up in ICI-treated patients. Continuous variables are expressed as mean ± standard deviation and were compared across time points using repeated-measures ANOVA; categorical variables are expressed as number (percentage). Statistically significant p values are shown in bold. AR, aortic regurgitation; DBP, diastolic blood pressure; E/A, early-to-late diastolic transmitral flow velocity ratio; e′, early diastolic mitral annular velocity; ICI, immune checkpoint inhibitors; IVS, interventricular septal thickness; LAVi, left atrial volume index; LV, left ventricular; LVEDD, left ventricular end-diastolic diameter; LVEDV, left ventricular end-diastolic volume; LVEF, left ventricular ejection fraction; LVESV, left ventricular end-systolic volume; LVMi, left ventricular mass index; MR, mitral regurgitation; PW, posterior wall thickness; RVIT, right ventricular inflow tract diameter; RWT, relative wall thickness; sPAP, systolic pulmonary artery pressure; TAPSE, tricuspid annular plane systolic excursion; TR, tricuspid regurgitation.
| Conventional echoDoppler indices |
T0 |
T1 |
T2 |
P-value |
| IVS (mm) |
11.1 ± 3.0 |
11.3 ± 3.3 |
11.3 ± 3.2 |
0.97 |
| PW (mm) |
8.1 ± 1.5 |
8.1 ± 1.4 |
8.3 ± 1.6 |
0.90 |
| LVEDD (mm) |
45.3 ± 4.8 |
45.2 ± 4.4 |
45.3 ± 4.9 |
0.99 |
| RWT |
0.37 ± 0.07 |
0.36 ± 0.07 |
0.37 ± 0.08 |
0.96 |
| LVMi (g/m2) |
87.3 ± 26.5 |
87.9 ± 31.4 |
91.0 ± 39.4 |
0.93 |
| Normal LV geometric model (%) |
21 (75.0) |
21 (75.0) |
19 (67.8) |
0.13 |
| LV Concentric remodeling (%) |
1 (3.6) |
1 (3.6) |
3 (3.6) |
0.13 |
| LV concentric hypertrophy (%) |
3 (10.7) |
3 (10.7) |
1 (3.6) |
0.13 |
| LV eccentric hypertrophy (%) |
3 (10.7) |
3 (10.7) |
5 (17.8) |
0.13 |
| LVESV (ml) |
67.0 ± 16.7 |
63.6 ± 13.3 |
67.8 ± 16.1 |
0.67 |
| LVEDV (ml) |
23.7 ± 6.6 |
23.7 ± 5.4 |
25.5 ± 8.5 |
0.65 |
| LVEF (%) |
64.5 ± 4.7 |
62.5 ± 4.1 |
62.6 ± 6.6 |
0.42 |
| E/A ratio |
1.0 ± 0.3 |
0.8 ± 0.2 |
0.9 ± 0.3 |
0.23 |
| E/average e’ ratio |
8.5 ± 4.5 |
9.2 ± 3.9 |
10.5 ± 5.0 |
0.38 |
| LAVi (ml/m2) |
32.0 ± 9.5 |
31.2 ± 8.1 |
34.0 ± 9.2 |
0.60 |
| More than mild MR (%) |
6 (21.4) |
6 (21.4) |
8 (28.6) |
0.13 |
| More than mild AR (%) |
0 (0.0) |
0 (0.0) |
1 (3.6) |
0.37 |
| More than mild TR (%) |
0 (0.0) |
1 (3.6) |
1 (3.6) |
0.37 |
| RVIT (mm) |
29.0 ± 3.4 |
28.7 ± 2.9 |
29.7 ± 2.6 |
0.57 |
| TAPSE (mm) |
24.0 ± 3.5 |
22.3 ± 3.5 |
21.8 ± 4.4 |
0.17 |
| sPAP (mmHg) |
26.9 ± 3.4 |
27.6 ± 3.7 |
28.9 ± 3.3 |
0.22 |
Table 4.
Longitudinal changes in myocardial strain and strain rate parameters at baseline and during follow-up in ICI-treated patients. Continuous variables are expressed as mean ± standard deviation and evaluated longitudinally using repeated-measures ANOVA; statistically significant p values are denoted in bold. 2C, two-chamber view; 3C, three-chamber view; 4C, four-chamber view; CS, circumferential strain; CSR, circumferential strain rate; FWLS, free wall longitudinal strain; GLS, global longitudinal strain; GLSR, global longitudinal strain rate; GCS, global circumferential strain; GCSR, global circumferential strain rate; ICI, immune checkpoint inhibitors; LA, left atrial; LAcd, left atrial conduit strain; LAct, left atrial contractile strain; LASr, left atrial reservoir strain; LS, longitudinal strain; LSR, longitudinal strain rate; LV, left ventricular; RA, right atrial; RAcd, right atrial conduit strain; RAct, right atrial contractile strain; RASr, right atrial reservoir strain; RV, right ventricular; STE, speckle-tracking echocardiography.
| Myocardial strain parameters |
T0 |
T1 |
T2 |
P-value |
| LS-4C (%) |
20.9 ± 2.3 |
19.4 ± 3.4 |
17.9 ± 3.1 |
0.01 |
| LSR-4C (s-1) |
1.05 ± 0.17 |
1.04 ± 0.21 |
0.89 ± 0.23 |
0.02 |
| LS-2C (%) |
21.2 ± 2.7 |
19.1 ± 3.4 |
17.9 ± 3.0 |
0.01 |
| LSR-2C (s-1) |
1.08 ± 0.17 |
1.05 ± 0.18 |
0.87 ± 0.21 |
0.004 |
| LS-3C (%) |
20.1 ± 3.7 |
17.4 ± 3.1 |
16.5 ± 2.8 |
0.005 |
| LSR-3C (s-1) |
1.13 ± 0.17 |
1.04 ± 0.14 |
0.95 ± 0.14 |
0.004 |
| LV-GLS (%) |
20.7 ± 2.1 |
18.9 ± 3.0 |
17.6 ± 2.7 |
0.002 |
| LV-GLSR (s-1) |
1.08 ± 0.14 |
1.06 ± 0.15 |
0.88 ± 0.20 |
0.001 |
| Basal LV-CS (%) |
18.7 ± 3.5 |
17.6 ± 5.0 |
17.0 ± 4.6 |
0.56 |
| Basal LV-CSR (s-1) |
1.24 ± 0.15 |
1.18 ± 0.27 |
1.11 ± 0.22 |
0.23 |
| Mid LV-CS (%) |
22.7 ± 3.6 |
20.3 ± 5.1 |
20.7 ± 4.9 |
0.31 |
| Mid LV-CSR (s-1) |
1.39 ± 0.17 |
1.35 ± 0.20 |
1.32 ± 0.22 |
0.64 |
| Apical LV-CS (%) |
27.8 ± 5.4 |
25.7 ± 5.6 |
25.2 ± 7.8 |
0.47 |
| Apical LV-CSR (s-1) |
1.82 ± 0.31 |
1.80 ± 0.47 |
1.62 ± 0.49 |
0.31 |
| LV-GCS (%) |
22.8 ± 3.3 |
20.7 ± 4.5 |
20.5 ± 5.3 |
0.29 |
| LV-GCSR (s-1) |
1.46 ± 0.14 |
1.45 ± 0.27 |
1.32 ± 0.21 |
0.13 |
| LAcd strain (%) |
26.1 ± 5.2 |
24.0 ± 5.8 |
20.1 ± 4.2 |
0.005 |
| LAct strain (%) |
9.5 ± 5.5 |
7.3 ± 4.7 |
4.2 ±3.0 |
0.006 |
| LASr (%) |
35.7 ±6.5 |
30.8 ±6.0 |
26.7 ± 5.5 |
<0.001 |
| LASr/E/e’ ratio |
5.1 ± 2.7 |
3.7 ± 1.6 |
3.1 ± 1.8 |
0.02 |
| LA-SRs (s-1) |
1.72 ± 0.35 |
1.54 ± 0.37 |
1.22 ± 0.32 |
<0.001 |
| LA-SRe (s-1) |
1.94 ± 0.66 |
1.66 ± 0.77 |
1.26 ± 0.61 |
0.02 |
| LA-SRl (s-1) |
2.73 ± 0.62 |
2.51 ± 0.49 |
1.87 ± 0.41 |
<0.001 |
| RAcd strain (%) |
31.6 ± 7.7 |
26.7 ± 4.9 |
21.6 ± 6.2 |
<0.001 |
| RAct strain (%) |
10.2 ± 5.8 |
8.3 ± 5.8 |
4.3 ± 2.9 |
0.009 |
| RASr (%) |
41.5 ± 9.0 |
34.3 ± 4.9 |
26.4 ± 4.3 |
<0.001 |
| RA-SRs (s-1) |
2.01 ± 0.54 |
1.88 ± 0.36 |
1.63 ± 0.35 |
0.04 |
| RA-SRe (s-1) |
1.76 ± 0.34 |
1.60 ± 0.26 |
1.40 ± 0.43 |
0.04 |
| RA-SRl (s-1) |
2.19 ± 0.66 |
2.08 ± 0.47 |
1.68 ± 0.40 |
0.04 |
| RV-GLS (%) |
20.1 ± 3.7 |
19.2 ± 3.3 |
16.6 ± 4.1 |
0.03 |
| RV-GLSR (s-1) |
1.27 ± 0.26 |
1.08 ± 0.14 |
1.01 ± 0.21 |
0.005 |
| RV-FWLS (%) |
21.2 ± 3.7 |
19.2 ± 3.3 |
17.6 ± 4.3 |
0.03 |
| Timing STE (min) |
8.9 ± 1.4 |
8.4 ± 1.4 |
8.1 ± 1.5 |
0.29 |
Table 5.
Logistic regression analysis (Model 1) evaluating baseline demographic and anthropometric predictors of LV-GLS impairment. Statistically significant p values are highlighted in bold. OR, odds ratio; CI, confidence interval; BMI, body mass index; LV-GLS, left ventricular global longitudinal strain.
| Model 1 |
Logistic regression analysis |
| OR (95% CI) |
P-value |
| Age (yrs) |
1.72 (1.00–2.93) |
0.04 |
| Male sex |
2.54 (0.23–28.0) |
0.45 |
| Basal BMI (Kg/m2) |
1.13 (0.83–1.56) |
0.43 |
Table 6.
Logistic regression analysis (Model 2) evaluating 3-month follow-up variables associated with LV-GLS impairment. Statistically significant p values are reported in bold type. OR, odds ratio; CI, confidence interval; LV-GLS, left ventricular global longitudinal strain; NLR, neutrophil-to-lymphocyte ratio; SBP, systolic blood pressure; T2, 3-month follow-up.
| Model 2 |
Logistic regression analysis |
| OR (95% CI) |
P-value |
| T2-SBP (mmHg) |
1.05 (0.98–1.12) |
0.17 |
| T2-NLR |
1.94 (1.25–3.01) |
0.003 |
| Pembrolizumab therapy |
3.00 (0.34–26.2) |
0.32 |
Table 7.
Cox proportional hazards regression analysis (Model 1) evaluating baseline demographic variables and baseline left ventricular myocardial deformation as predictors of adverse clinical outcomes. Significant p values are shown in bold. HR, hazard ratio; CI, confidence interval; LV-GLS, left ventricular global longitudinal strain; T0, baseline.
| Model 1 |
Univariate Cox regression analysis |
Multivariate Cox regression analysis |
| HR (95% CI) |
P-value |
HR (95% CI) |
P-value |
| Age (yrs) |
1.11 (1.04–1.18) |
<0.001 |
1.08 (1.01–1.16) |
0.03 |
| T0-LV-GLS |
0.41 (0.27–0.62) |
<0.001 |
0.43 (0.26–0.71) |
<0.001 |
Table 8.
Cox proportional hazards regression analysis (Model 2) evaluating baseline systemic inflammatory status as a predictor of adverse clinical outcomes. P values in bold denote statistical significance. HR, hazard ratio; CI, confidence interval; NLR, neutrophil-to-lymphocyte ratio; T0, baseline.
| Model 2 |
Univariate Cox regression analysis |
Multivariate Cox regression analysis |
| HR (95% CI) |
P-value |
HR (95% CI) |
P-value |
| Age (yrs) |
1.11 (1.04–1.18) |
<0.001 |
1.09 (1.01–1.17) |
0.02 |
| T0-NLR |
1.54 (1.21–1.96) |
<0.001 |
1.15 (0.84–1.58) |
0.37 |
Table 9.
Univariate Cox proportional hazards regression analysis (Model 3) evaluating age and metastatic cancer status as predictors of adverse clinical outcomes in patients undergoing immune checkpoint inhibitor therapy. Hazard ratios (HRs) are reported with corresponding 95% confidence intervals (CIs). Statistically significant p values are shown in bold.
| Model 3 |
Univariate Cox regression analysis |
| HR (95% CI) |
P-value |
| Age (yrs) |
1.11 (1.04–1.18) |
<0.001 |
| Metastatic cancer |
1.31 (0.47–3.60) |
0.61 |