
Submitted:
28 December 2025
Posted:
29 December 2025
You are already at the latest version
Abstract
The rapid development of Information and Communication Technologies (ICTs) has reshaped how communities access and utilize essential services. Rural communities, however, continue to face significant access barriers due to geographic isolation, ICT infrastructure gaps, and social inequalities. Smart divide, an emerging concept representing the disparities in smart infrastructure penetration, the variation in smart service adoption, and entrenched digital inequalities across communities, is expected to widen in the coming decades. This study aims to examine the causes of this divide quantitatively from the lens of a socio-technical system, emphasizing the interwoven roles of social and technological factors in contributing to the divide. A Structural Equation Modelling (SEM) model is developed to examine the interplay of ICT infrastructures, social infrastructures, and socio-economic factors contributing to smart divide. The model tests three relationships: both insufficient ICT infrastructures and disadvantaged socio-economic factors proportionately correlate to smart divide occurrence, and social infrastructure acts as a mediator reducing the impact of both ICT infrastructures’ deficiencies and socio-economic disadvantages. Mail survey data on households’ digital connectivity, socio-economic indicators, and smart divide metrics (smart education and health) was collected from 262 residents of two remote small towns with racially diverse and underserved communities in Southern Illinois. The model explained 41.3% of variance in the smart divide. Human factors showed the strongest relationship with smart divide (β = 0.407, p = 0.098), while digital connectivity had no significant direct effect (β = 0.161, p > 0.05). Social infrastructure significantly moderated the relationship between digital connectivity and smart divide (β = -0.167, p < 0.01) but not the relationship between human factors and smart divide relationship (p > 0.05). Results indicate that social support can compensate for connectivity gaps but cannot address persistent inequalities rooted in individual characteristics.
Keywords:
smart divide
; socio-technical system
; structural equation modelling
Introduction
The recent success of a myriad of information and communication technology (ICT) projects in urban settings largely defines our perception of what future smart communities may look like. A smart community (SC) can be defined as a locality where residents, organizations, and governing institutions utilize advanced ICT infrastructures to optimize service delivery and improve quality of living (Kaur and Sharma 2024; Ramos 2022; Zaidan et al. 2022). However, defining SC remains challenging due to limited number of studies and the term's application across diverse contexts, leading to multiple competing definitions that emphasize different technological, social, or governance aspects in different context. Without a consensus on the definitions of SC, the meanings of the term “smart” often range from ideological and strategic (e.g., place branding) to practical and instrumented (e.g., city operation) with explicit or implicit intentions to address various pressing problems common in urban settings (Cocchia 2014; Albino et al. 2015; Visvizi and Lytras 2018). However, the conventional wisdom of smart communities, which is largely built upon well-established broadband access and ICT applications in urban hubs, is out of context in decentralized rural communities (Li et al. 2020). The concept of 'smart divide' emerged from this landscape of inequality. (Li et al. 2020) defined smart divide as a form of social inequality characterized by imbalanced penetration and matureness of smart ICT infrastructure (e.g., wireless broadband network) and services (e.g., smart health service), coupled with varying intellectual and skill levels across different communities and regions. This conceptualization of smart divide deviates from previous research that has maintained either a sole technical focus (Ntanda and Carolissen 2025) or approached the phenomenon exclusively through a social equality lens (S. Lee 2016). Research has shown that, redressing inequality in the digital world must consider both human and non-human factors such as technological infrastructure, its dependent communities as well as the social context (Dijk 2020; Helsper 2021).
The smart divide represents a distinct evolution beyond the traditional digital divide. While the traditional digital divide focused on basic ICT access and usage, the smart divide emerges from the increased demands of next-generation ICTs like big data, artificial intelligence, and Internet of Things (Song et al. 2013). The key difference between the “Smart Divide” and the “Digital Divide” lies in infrastructure requirements: the smart divide stems from outdated communication networks that cannot effectively support modern Smart Applications and Services (SAS), whereas the digital divide focuses on the basic availability of internet access and devices. Dismissing a smart divide as a conventional digital divide or a broadband access issue may result in “thinking inside the box” and prohibit seeking creative and innovative solutions. Practically, there is a real urgency to address a smart divide at present. We argue that a smart divide is not a hypothetical and distant threat but one that has been fully realized during the COVID-19 pandemic. The pandemic forced many essential human services to be virtual and online (e.g., telehealth and online education), and thus expedited the engagement of people with ICT even in the post pandemic era (Dornauer and Bryce 2020; Esteban-Navarro et al. 2020). Such engagement forms a socio-technical tension forming an interconnected and complex system, which is a force that shapes the smart inequality (Hanseth and Lyytinen 2010; Kim and Yang 2023; Mondschein et al. 2021; Monteiro and Hanseth 1996). However, the conventional technocentric perspective of ICT infrastructure tends to frame barriers of SC as an issue of broadband and smart device access (Kopackova and Libalova 2017), overlooking the complexity arising from diverse user capacities such as varying levels of education, digital literacy, and skills necessary to engage meaningfully with technology. This complexity is particularly pronounced among underserved rural populations, who face compounded challenges due to socioeconomic disparities and limited access to tailored digital support (Ntanda and Carolissen 2025). Another gap is the role of social infrastructure that can act as a mediator between people and technology. Social infrastructure can ensure that technological advancements are matched by citizen participation, and equitable access to services (J. Lee et al. 2023; Masik et al. 2021). Thereby, an incorporation of socio-economic consideration, human capabilities, and social infrastructure in the design of future smart infrastructure is particularly vital to the success of smart transition.
Despite extensive qualitative work in socio-technical system studies, the field lacks systematic quantitative frameworks for examining sociotechnical phenomena (Bijker 2010; Latour 2007a). While qualitative studies can provide rich contextual understanding, they limit the field's capacity for comparative analysis and generalization across different contexts (Pinch and Bijker 1984). The existing literature also reveals a gap in the quantification of smart divide and how it is shaped in a contemporary context. In addition, although the roles of social infrastructures (i.e., community based organizations) in closing the digital gap between the "haves" and "have-nots" is recognized in literature (Fryer and Granger 2008; Shin et al. 2021), there remains limited attention to how community networks and social connections shape knowledge transformation pathways.
This research focused on telehealth access and use that was a critical smart service in rural areas during the COVID-19 pandemic. Telehealth includes a wide range of services such as virtual visits, remote monitoring, and mobile health, and has become an essential part of modern health care, especially since the COVID-19 pandemic (Bouabida et al. 2022; Crowe et al. 2024). During the pandemic, telehealth offered multiple benefits such as expanding access to care, reducing disease exposure, and preserving personal protective equipment supplies (Bouabida et al. 2022; Koonin et al. 2020). Beyond COVID-19, telehealth demonstrates comparable health outcomes in patient-physician communication and satisfaction, improving healthcare access when properly implemented (Clare 2021). As telehealth became more integrated into healthcare delivery, the persistent disparities related to it also came to light. Research shows that while telehealth was intended to close healthcare gaps for rural populations, it might actually be widening disparities due to persistent technological, social, economic, and political barrier (Klee et al. 2023; Lestari et al. 2024).
This study aims to understand the smart divide in a socio-technical context. Specifically, we employ the Actor-Network Theory (ANT) to examines the disparity in smart technology adoption in the lens of a dynamic network where human and non-human actors interact and co-produce technological experiences. Being inspired from the ANT framework, we empirically test a structural equation model that explores how ICT infrastructures, social infrastructures, and socio-economic factors collectively contribute to the smart divide. Specifically, we investigate three critical relationships: how insufficient digital connectivity and disadvantaged human factors influence smart divide and if social infrastructure can help in mediating these influences.
Conceptual Framework
Research in the field of information and communication systems adopts a sociotechnical approach that examines the mutual constitution and interaction between technological and social components, rather than treating them as independent or separate phenomena (Baxter and Sommerville 2011; Sawyer and Jarrahi 2014). An emerging body of literature has suggested that the term smart communities connotes both technological and social dimensions (Kitchin 2014; Kitchin et al. 2018; Mondschein et al. 2021). Consequently, this study conceptualizes smart divide as a socio-technical system problem. ANT is a social science theory (Callon 1986; Latour 1984; Law 1990) that views the world as composed of interactive hybrid human and non-human entities. It offers a framework for understanding complex socio-technical networks by treating human and non-human actors impartially and avoiding essentialist distinctions between the social and the technological (Tatnall and Gilding 1999). We argue that ANT is particularly suitable to analyse the smart divide, because it treats people and ICT as equally important actors from a network perspective, unravels complex issues that cannot be understood solely through traditional technological or socially inclined theories and methods, (Latour 2007b).
From an ANT perspective, smart divide emerges from the interactions between technological and social dimensions. The technological dimension encompasses non-human actors such as smart infrastructures, devices, and applications/ services that generate information flows. The social dimension comprises human actors including users with varying digital capabilities, policymakers controlling resources, and communities with different socio-economic status positions who interact with, resist, or are excluded from the technological dimensions. Crucially, social infrastructure can act as a moderator here that either enables or constrains human actors' capacity to form stable associations with smart technologies (Green and Haines 2016). We argue that the smart divide emerges when human actors' varying capabilities and social inequalities foster unequal engagement with smart technologies.
Inspired by ANT, we posit that the smart divide is shaped by both technical and social dimensions. Specifically, we argue that insufficient digital connectivity and disadvantaged human factors, such as socio-economic challenges and digital capability, exacerbate the occurrence of the smart divide. However, we also hypothesize that social infrastructure that includes community resources, institutions, and networks may mediate these relationships by buffering their negative effects. Each of these factors contributes together and uniquely to the overall smart inequality landscape, shaping access to and benefits from smart technologies across different populations. Finally, we propose an analytical framework to test the following hypothesized relationships (See Figure 1).
- Hypothesis 1: Insufficient digital connectivity increases smart divide.
- Hypothesis 2: Disadvantaged human factors increase smart divide.
- Hypothesis 3: Social infrastructure moderates these relationships by reducing their negative impact.
Study Area
The study focuses on two Southern Illinois communities- Carbondale and Cairo which are selected for their significant socioeconomic characteristics. Both communities are in rural counties, Jackson and Alexander respectively. However, Carbondale is classified as a small rural college town while Cairo as a rural area. Despite their differences, both share critical similarities in poverty levels and have experienced persistently high poverty rates spanning over four decades, as identified by the USDA Economic Research Service. Demographically, the communities are diverse, with substantial white and black populations. Cairo, a smaller community of 1,733 residents in 2020, is predominantly Black (69%), while Carbondale, with 21,857 residents, is more racially mixed, with White (54.3%) and Black (25.7%) populations being the largest groups. Key economic indicators reveal similar challenges: Cairo has a median household income of $27,661 and an unemployment rate of 9.8%, while Carbondale has a median household income of $24,093 and an unemployment rate of 8.7%.
Dataset and Sample
Data was collected through mail surveys conducted between fall 2022 and spring 2023, as part of a broader investigation into urban-rural residence and enduring poverty's impact on online education and telehealth access. Using the Dillman approach (Dillman et al. 2014), surveys were sent in three waves: an initial mailing with a personalized cover letter and confidentiality statement, a follow-up postcard reminder, and a second survey sent to non-respondents two weeks later. A total of 262 respondents completed the survey from an initial sample of 2,732 households, representing a 9.6% response rate after excluding undeliverable surveys. The respondents were predominantly from Carbondale (56.9%), with the remainder from Cairo (43.1%). The sample demography is given in the Figure 2.
All participants were adults, with 159 (61%) aged 18-64 years and 103 (39%) aged 65 and over. The majority respondents were female (173, 67.3%), with 82 (31.9%) males and 2 (0.8%) identifying as non-binary or other. Regarding race and ethnicity, 130 (51.2%) identified as White/Caucasian and 108 (42.5%) as Black/African American, while smaller proportions identified as Asian (11, 4.3%), Hispanic/Latino (5, 2%), American Indian/Alaska Native (4, 1.6%), and other races (6, 2.4%). Educational attainment was high, with 68 (26.6%) holding bachelor's degrees, 61 (23.8%) having some college without a degree, 40 (15.6%) with master's degrees, and 17 (6.6%) with doctoral or professional degrees. Household income levels were lower, with 92 (35.1%) earning $0-24,999 annually and 85 (32.4%) earning $25,000-49,999, while only 22 (8.4%) reported incomes above $100,000.
Methodology
This study employs structural equation modelling (SEM) to test the aforementioned hypotheses. SEM was selected for this analysis because it enables the simultaneous examination of complex interactions among key constructs. Traditional regression analysis would be inadequate for testing these interconnected relationships, as it cannot accommodate the multiple dependent pathways and mediating effects that were hypothesized in our model.
Instrumentation
This section presents the latent constructs and their corresponding measured variables, with the scale, values, and descriptive statistics of each variable provided in Table 1. The complete model is shown in Figure 3.
Household’s Digital Connectivity: Digital connectivity refers the technological capability that enables devices to connect to the internet or mobile networks, providing access to a vast ecosystem of digital services, applications, and online platforms (Hariyadi et al. 2024). At its fundamental core, this connectivity requires two essential elements: an internet connection and a device capable of accessing that network. This study measured households’ digital connectivity using availability of internet access of any type (broadband, mobile internet, dial up internet, mobile hotspot or satellite) and the total number of smart devices (desktops, laptops, tablets, and electronic readers) within a household.
Human Factors: Human factors encompass individual behavior, capabilities, and limitations that may shape their engagement with smart devices, internet, and/or online platforms. The variable used in this study is respondents perceived ability to effectively use telehealth technologies. Data on human factors was collected through self-reported measures; respondents provided a binary yes or no response indicating their perceived ability to use these technologies. This study also collected data on socio-economic factors that encompass a range of social and economic elements that influence individual behaviors, opportunities, and outcomes within society. To measure socio-economic factors data on the following variables were collected- age of respondent, household income, and educational qualification.
Social Infrastructure: Social infrastructures are the spaces and services that support a community's social well-being and overall quality of life. These infrastructures extend beyond mere physical structures, encompassing a comprehensive network of facilities and services designed to enhance community cohesion, individual development, and collective welfare (McFarlane 2021). The variables of social infrastructures include support systems across person, community, and institution (government) levels . Respondents evaluated support networks for internet use issues using a 5-point Likert scale. The assessment included questions about the helpfulness of community clubs and organizations and family and friends in resolving internet challenges, as well as perceptions of government efforts in providing necessary resources and services.
Smart Divide: Smart divide is measured based on a single smart technology, telehealth, which is important to rural areas in the context of this study. The variables used to measure smart divide include- telehealth use and attitudes towards telehealth.
Telehealth use: Participants responded with a binary yes or no, where "no" potentially indicates a smart divide. However, the researchers recognize that a negative response might simply reflect personal choice rather than a true barrier. To differentiate between a genuine divide and a deliberate choice, additional context may be further examined.
Attitude towards telehealth: The participant's perspective towards telehealth services is considered as a factor of smart divide. A negative attitude is likely to contribute to the smart divide, creating psychological barriers to smart service adoption.
Software and Estimation
Analysis was conducted using R, version 4.3.1. The selected parameter estimation method is robust maximum likelihood; a technique selected for its statistical resilience and ability to handle complex data structures. The mvoutlier package of R facilitated multivariate outlier screening, while the lavaan package enabled path analysis model construction using robust maximum likelihood estimation. To address the challenge of missing data, full information maximum likelihood estimation was implemented. This method allows for the inclusion of all available data points, maximizing statistical power and minimizing potential bias introduced by data exclusion.
Data Preprocessing
Before running the model, the issue of missing data was addressed through targeted imputation strategies. Age data was imputed calculating midpoint of household demographics or by the overall dataset average when no specific information existed. Education had only 6 missing points (approximately 3% of total data) which required no special treatment. Household income missing values (22 cases, 8% of data) were imputed using community medians, while internet speed missing values in Carbondale and Cairo were imputed using location-specific medians due to skewed distributions with extreme values.
Model assumptions were tested prior to analysis. Univariate normality was assessed through Shapiro-Wilk tests and Q-Q plot visual inspection in SPSS, confirming normal distributions for all variables. However, multivariate normality testing using the MVN package in lavaan indicated this assumption was violated, necessitating the use of robust maximum likelihood estimation. Outlier analysis was conducted at both univariate and multivariate levels using SPSS boxplots and Mahalanobis distance in R's mvoutlier package respectively. All identified outliers were retained after investigation, as they represented valid data points rather than measurement errors.
Model Assessment
This study employed a two-step approach to structural equation modelling (SEM) analysis following (Anderson and Gerbing 1988). This methodological approach involves the sequential evaluation of the measurement model followed by the structural model, ensuring robust and interpretable results. There was no model convergence issue. To check for model fitness, we computed the following fit indices- chi-square relative to degrees of freedom, Root Mean Square Error of Approximation (RMSEA), Comparative Fit Index (CFI), and Standardized Root Mean Square Residual (SRMR). Unlike traditional SEM approaches using rigid cutoff values, this study interprets fit indices relative to the baseline model that assume no relationship. (McNeish et al. 2018) argued that traditionally used cutoff values for approximate goodness-of-fit indexes, particularly those recommended by (Hu and Bentler 1999), may not be universally applicable across different measurement qualities.
For the measurement model, chi-square is 60.496 with a p-value = 0.000 which indicates statistically significant results leading to reject the null hypothesis of perfect model fit. However, Chi-square is sensitive to sample size (Hu & Bentler, 1999; Kline, 2016). Additionally, failing to retain a model does not mean that it should be rejected. Another critical issue with chi- square is the null hypothesis of perfect model fit. However, a perfect model fit is not a realistic or even desirable goal in scientific modeling (McNeish et al., 2018). The Robust RMSEA is 0.066, with a 90% confidence interval of [0.044, 0.088]. According to the popularly cited (Hu & Bentler, 1999), the cutoff criterion for RMSEA is less than 0.06. However, according to (Browne & Cudeck, 1992; MacCallum et al., 1996) values between .05 and .08 are considered as a good fit, values between .08 and .10 are mediocre fit and values > 0.10 are not acceptable. So, the point RMSEA value here indicates a good fit. The lower bound of the confidence interval 0.044 suggests that the model might be on the edge of an adequate fit and the upper bound 0.088 suggests a mediocre fit. The CFI is 0.890 suggesting that the fit of the hypothesized model is 89% better than the fit of the baseline independence model that assumes no relationship among the construct. The model was retained despite not meeting the traditional CFI >0.95 cutoff (Hu and Bentler 1999) because the CFI value in this model suggests improvement over the baseline independence model. The SRMR value of 0.056 indicates that the model's predicted correlations (model-implied covariances) differ from the observed correlations in the data by an average of 0.056. An SRMR value below 0.08 is generally considered acceptable, and values below 0.05 indicate a close fit (Hu and Bentler 1999; Zyl and Klooster 2022).
For the structural model, chi-square = 60.496 (p = 0.000) suggests rejecting the exact fit hypothesis, but given chi-square's known limitations, the model is not rejected. The Robust RMSEA value is 0.074 with a 90% confidence interval ranging from 0.046 to 0.102. The point estimate of 0.074 indicates a good fit. However, the lower bound of the confidence interval 0.046 suggests that the model is an excellent fit although the upper bound 0.102 suggests that the fit may be somewhat poor. CFI is 0.89 meaning that the fit of the hypothesized model is 89% better than the fit of the independence model. The SRMR value of 0.056 indicates that the model's predicted correlations differ from the observed correlations in the data by an average of 0.075 and this value meets the cutoff criterion (Hu and Bentler 1999).
Results
The measurement model shows moderate factor loadings that represent the strength and direction of the relationship between observed variables and underlying latent factors in the model (Table 5). Digital Connectivity factors demonstrate strong loading; Internet Access has a significant standardized loading of 0.730 (z = 5.092, p < 0.001). For human factors, the loadings are 0.625 (z= 5.955, p=0.000) and -0.297 (z= -2.065, p= 0.039) for education level and telehealth skills respectively. Thus, education level emerges as the strongest predictor of human factors, while telehealth skills exhibit a weaker negative association with human factors. Social Infrastructure factors have moderately strong to weak factor loadings. The loadings are 0.419 (z = 3.515, p = 0.000) to 0.598 (z = 2.494, p = 0.013) for support from government and friends and family respectively. The Smart Divide construct has moderately strong significant loading of 0.593 (z= 3.876. p=0.000) for telehealth attitude.
The structural model accounted for 41.3% of variance in Smart Divide (R² = 0.413), demonstrating good explanatory power. The results provide partial support for the proposed hypotheses. Of the four tested paths, two achieved statistical significance at 90% confidence level. Examining the direct effects, human factors demonstrate the strongest relationship with smart divide, with a standardized coefficient of 0.407 (z= 1.653, p = 0.098), indicating that disadvantaged human factors significantly contribute to the smart divide. This relationship aligns with expectations about how individual characteristics such as education level, income, and telehealth skills create barriers to bridging the smart divide. Digital connectivity shows a non-significant direct effect on smart divide (β = 0.161, z= 0.760, p > 0.05), suggesting that connectivity alone may not be sufficient to address digital inequalities without considering other contextual factors (i.e., human factors).
The moderation analysis reveals important conditional effects. Social infrastructure significantly moderates the relationship between digital connectivity and smart divide (β = -0.167, z= -3.001, p < 0.01), indicating that as social infrastructure increases, the impact of lack of digital connectivity on smart divide becomes weaker or even reversed. This negative moderation effect suggests that the impact of poor digital connectivity may diminish in areas with stronger social infrastructure, potentially because support from government, friends and family, and community can compensate for connectivity gaps. However, social infrastructure does not significantly moderate the relationship between human factors and smart divide (β = -0.167, p > 0.05), indicating that the human factors-smart divide relationship remains consistent regardless of social infrastructure levels. These findings highlight the complex interplay between technological access and social support systems, where strong social infrastructure may reduce the negative effect of digital connectivity deficits in contributing to smart divide

Table 2.
Measurement model outputs.
| Factor | Indicator | Unstandardized Loading | SE | z-value | p-value | Standardized Loading | R² |
|---|---|---|---|---|---|---|---|
| Digital Connectivity | Total Device | 1.000 (fixed) | - | - | - | 0.569 | 0.324 |
| Internet Access | 0.163 | 0.032 | 5.092 | 0.000 | 0.730*** | 0.533 | |
| Human Factors | Household Income | 1.000 | 0.590 | 0.348 | |||
| Education Level | 1.222 | 0.205 | 5.955 | 0.000 | 0.625*** | 0.390 | |
| Telehealth Skills | -0.116 | 0.056 | -2.065 | 0.039 | -0.297* | 0.088 | |
| Social Infrastructure | Community Organization Help | 1.000 (fixed) | - | - | - | 0.574 | 0.330 |
| Friends and Family Help | 1.217 | 0.488 | 2.494 | 0.013 | 0.598* | 0.358 | |
| Government Help | 0.751 | 0.214 | 3.515 | 0.000 | 0.419*** | 0.175 | |
| Smart Divide | Telehealth Usage | 1.000 (fixed) | - | - | - | 0.638 | 0.407 |
| Telehealth Attitude | 1.682 | 0.434 | 3.876 | 0.000 | 0.593*** | 0.351 |
Note: *** p < 0.001, ** p < 0.01, * p < 0.05.
Figure 3.
Standardized Model outputs.
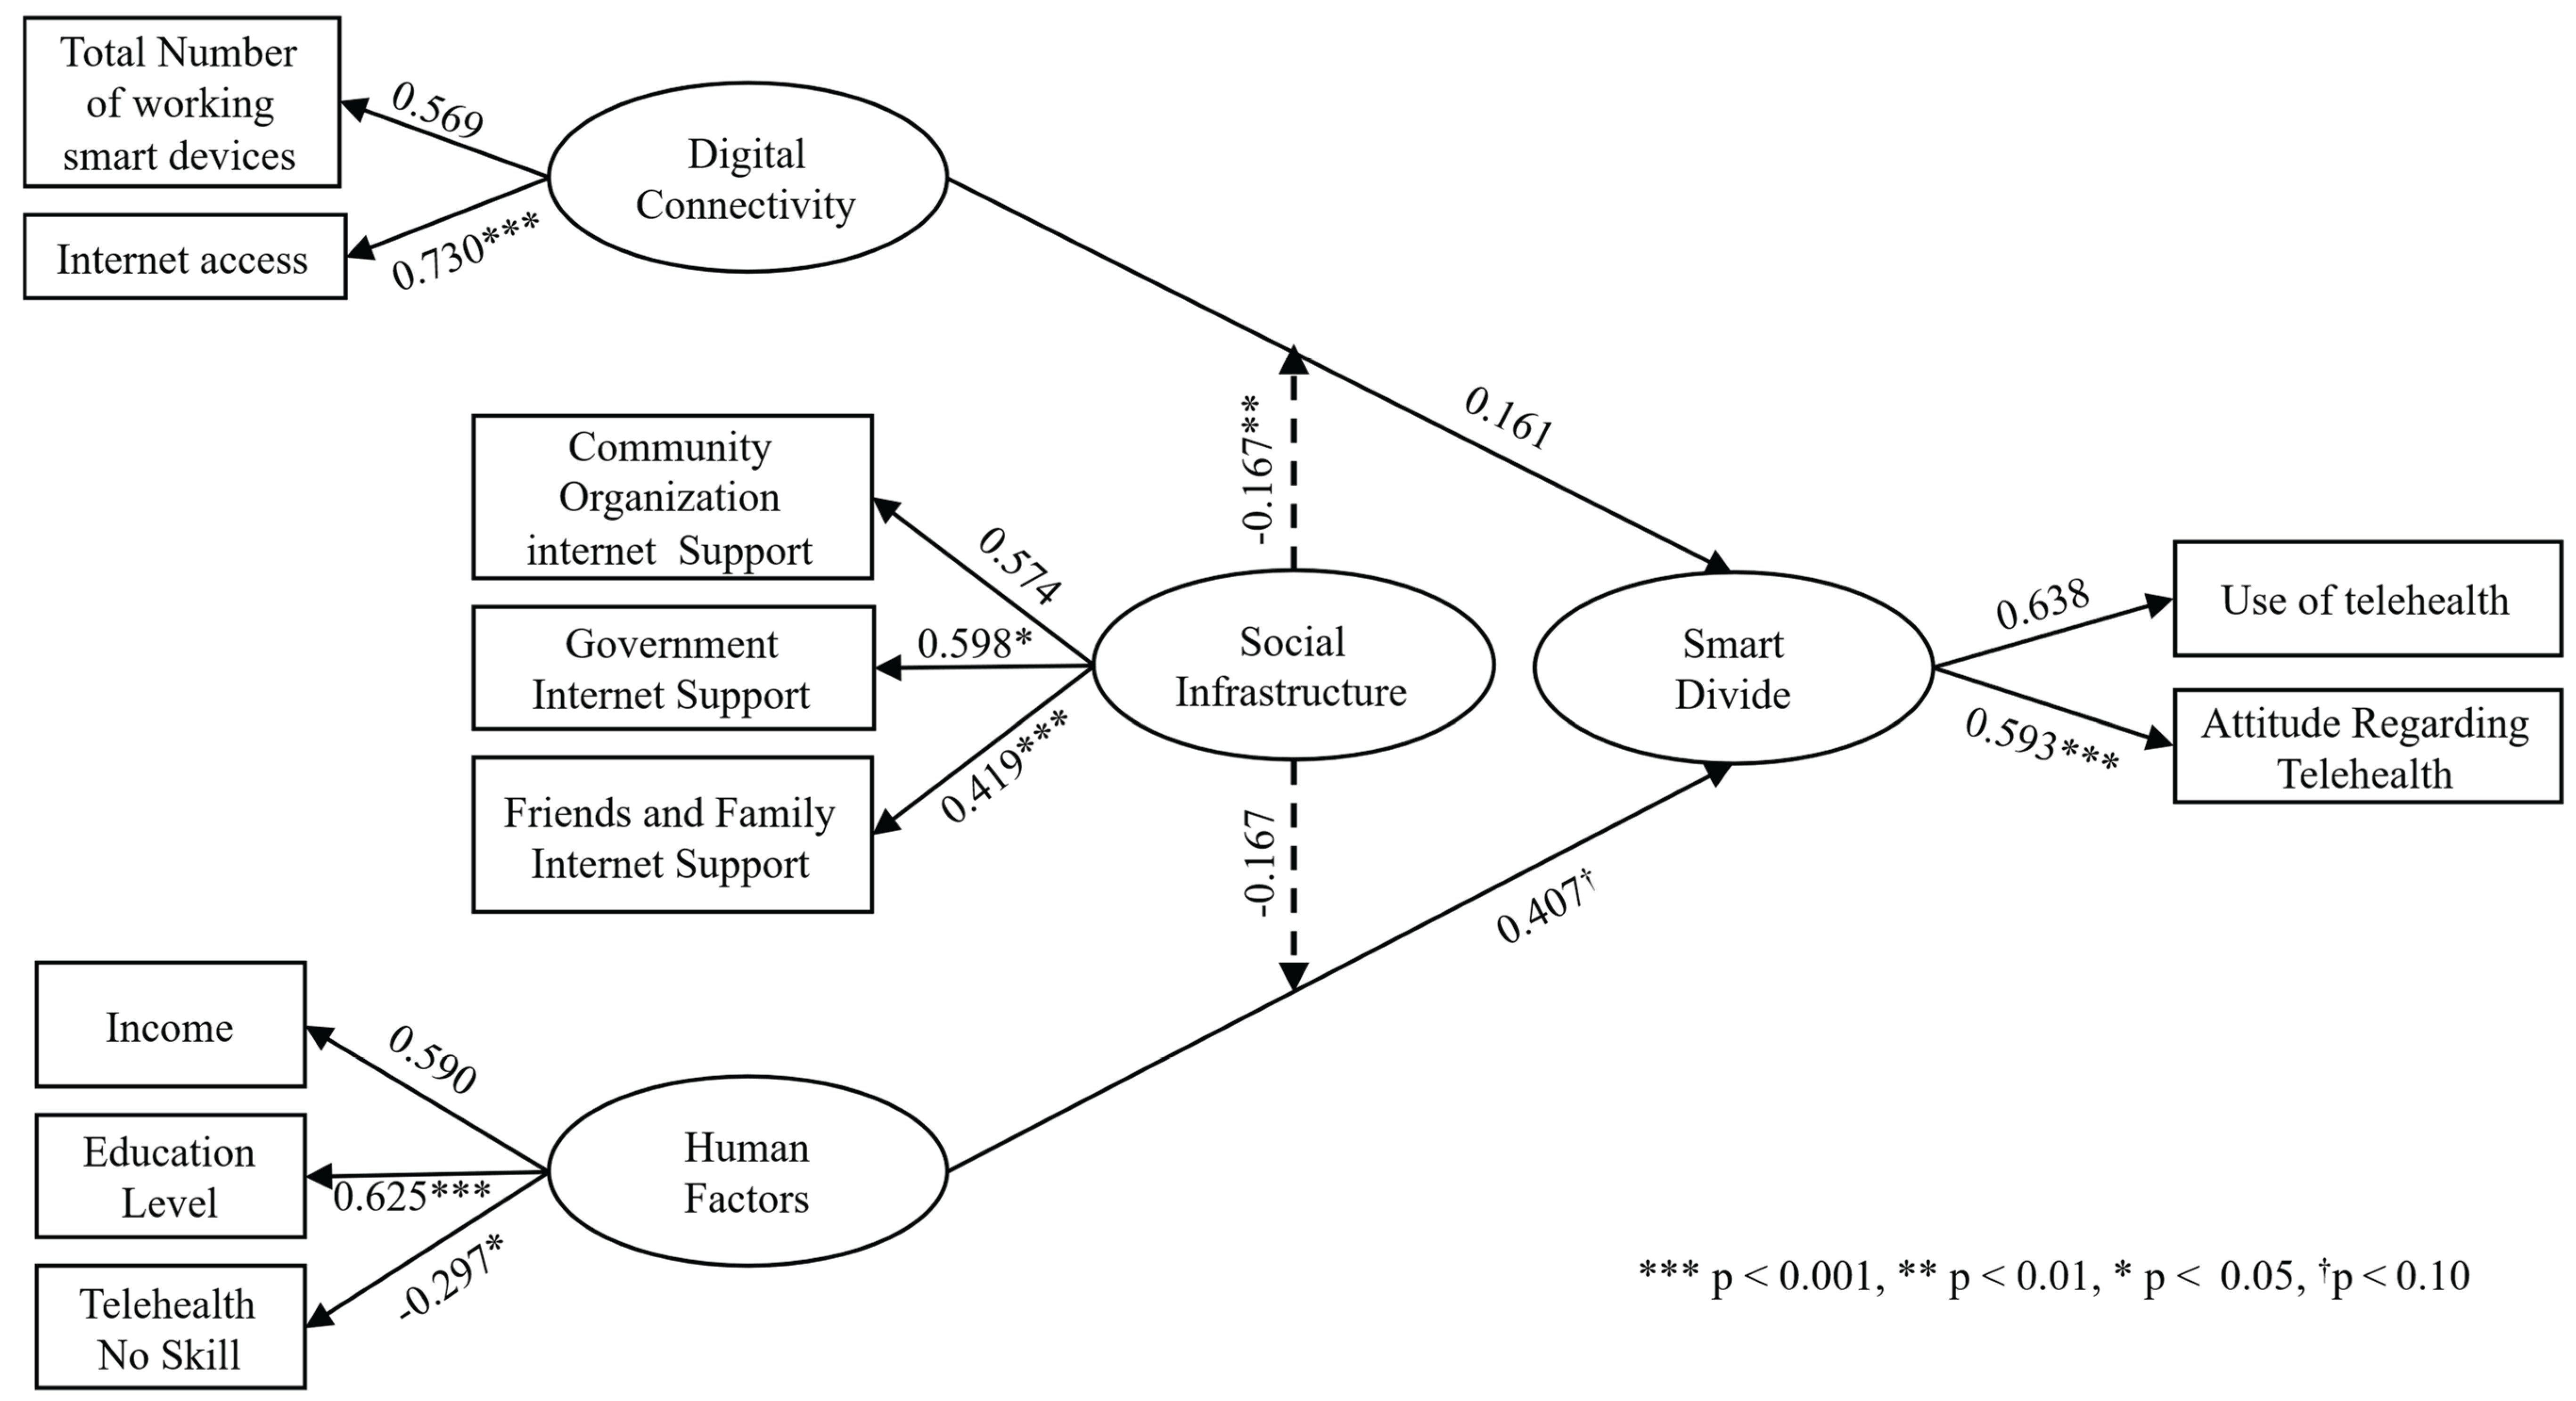
Table 3.
Structural Model Output.
| Path | Unstandardized Coefficient | SE | z-value | p-value | Standardized Coefficient |
|---|---|---|---|---|---|
| Digital Connectivity → Smart Divide |
0.032 | 0.042 | 0.760 | 0.447 | 0.161 |
| Human Factors → Smart Divide | 0.158 | 0.095 | 1.653 | 0.098 | 0.407 † |
| Digital Connectivity → Social Infrastructure → Smart Divide | -0.182 | 0.061 | -3.001 | 0.003 | -0.167** |
| Human Factors → Social Infrastructure → Smart Divide | -0.182 | 0.124 | -1.475 | 0.140 | -0.167 |
***p < 0.001, **p < 0.01, *p < 0.05, †p < 0.10.
Discussion
The rapid emergence and evolution of information and communication technologies has fundamentally altered the landscape of this smart inequality, creating new forms of exclusion that extend far beyond traditional notions of the digital divide. While early research focused primarily on binary distinctions between connected and disconnected populations, the proliferation of big data, smart devices and applications, cloud computing, IoT systems, and AI-driven services has created a more nuanced form of inequality, the smart divide, which encompasses not just access to or availability of technology, but meaningful participation in ever growing smart ecosystems. This study aimed to deconstruct the complex relationships among digital connectivity, human factors, and social infrastructure to shape smart divide. Our investigation was motivated by three key questions that challenge common assumptions in the discourse of smart inequality: Does improving digital connectivity necessarily reduce smart divide? How do individual and demographic characteristics influence smart divide? And can social support systems influence the relationships between digital connectivity and smart divide and human factors and smart divide?
Digital Connectivity Gap and Smart Divide
Contrary to widely held belief, our findings show that simply enhancing digital connectivity through better access to smart devices or ICT infrastructures does not automatically reduce the smart divide. The lack of a statistically significant relationship between digital connectivity and smart divide suggests that the smart divide is not merely a technological problem to be solved with more cables, towers, devices, and/or services (i.e., patient portal) or Wi-Fi hotspots. Bridging such divide also involves addressing motivation (whether people want to use telehealth), skills (whether people have the digital literacy to use telehealth) and usage (whether they can use telehealth in meaningful ways, such as for chronic disease management, preventive care, mental health support, or accessing specialized services) (Clare 2021; Dijk 2020; Helsper 2021; Lestari et al. 2024). This challenges the “build it and they will come” approach that has dominated policies and industry responses for years. Infrastructure alone cannot guarantee adoptions, usage and/ or equitable outcomes without addressing the underlying social and human context. Moreover, if not regulated properly such technological infrastructures can reinforce existing social inequalities which in turn will keep contributing to smart divide (Dijk 2020; Vogels et al. 2020).
Although our model did not find a statistically significant relationship between digital connectivity and smart divide, this does not mean that the physical infrastructure is irrelevant here. The growing supply and demand of data intensive and real time applications requires higher bandwidth capacity and lower latency which heavily depend on the physical infrastructure. For example, smart applications like telehealth demand a minimum of 10 Mbps download and 5 Mbps upload to function properly, but higher bandwidth is often necessary to ensure stable, high-quality video communication, especially in households with multiple users or advanced remote diagnostic needs. Again, these benchmarks may fall short when accounting for latency, overloaded and unstable networks, specifically in rural areas with limited connectivity and options (X. Chen et al. 2023). While wireless networks, including 4G LTE and emerging 5G technologies, offer cost-effective and scalable solutions, their coverage and speed still vary significantly across rural geographies. Bridging the smart divide for rural communities must integrate place-based policy frameworks that prioritize local needs and tackle both technological barriers and underlying social inequalities.
Human Factors and Smart Divide:
The strongest and most consistent predictor of the smart divide in our study is human factors such as income, education, and digital skills. This raises the critical question that, how do human factors can cause the smart divide even when technological infrastructure is available? Research has showed that barriers related to different socioeconomic status, educational attainment, income and digital literacy persist even in contexts where technological infrastructure is widely available (Dijk 2020; Robinson et al. 2015; Scheerder et al. 2017). These factors interact in complex ways and compound over time to create persistent barrier to the smart ecosystem (Helsper 2021). Low-income households face significant constraints on their ability to purchase smart devices, afford reliable internet access, or regularly upgrade technologies, which fundamentally limits their participation in the smart ecosystem. For these families, basic necessities often take priority over digital tools, making internet access or device ownership secondary concerns rather than essential investments. The education gap extends beyond traditional educational credentials to encompass digital competency in the smart landscape. People with limited formal education often lack familiarity with digital navigation and basic technical problem-solving. This challenge is often compounded by reduced motivation to engage with digital platforms, creating a cycle where limited exposure leads to decreased confidence and further avoidance (Dijk 2020; Helsper 2021).
Educational level also strongly also correlates with the skills necessary for effectively using smart applications and services. People with lower education levels typically have reduced digital competency, though education is not the sole determining factor here. Other barriers such as limited exposure to technology, lack of support networks, or cultural attitudes toward digital tools also play significant roles (Bouabida et al. 2022; J. Chen et al. 2021; Koonin et al. 2020). In this sense, the smart divide represents less a matter of physical connectivity and more a reflection of broader patterns of social and economic exclusion. This evidence calls for a paradigm shift in digital inclusion policy. Rather than relying solely on expanding broadband or device access, tailored strategies must be implemented to address the specific needs and contexts of vulnerable populations. Interventions such as targeted digital literacy programs, community outreach, and support for marginalized groups have been shown to be more effective in bridging smart divide than infrastructure investments alone (Fryer and Granger 2008; Helsper 2021; Mwansa et al. 2025; Scheerder et al. 2017).
Moderating role of Social Infrastructure:
The most important finding of this study is the unique role of social infrastructure as a moderating factor that shapes the relationship between digital connectivity, human factors, and the smart divide. Social infrastructure, as measured through support systems formed by family and friends, community organizations, and/or government, demonstrates a significant effect on reducing smart divide outcomes in places that have a lack of digital connectivity. This finding suggests that supportive relationships and institutional backing can help individuals overcome digital barriers to telehealth regardless of their connectivity issues. Social infrastructures can function as potential "circuit breaker" that can interrupt patterns of smart divide caused by lack of digital connectivity. Studies have found that community organizations serve as vital intermediaries in addressing such smart inequality by providing public access to technology, digital literacy training, and advocacy for inclusive policies, particularly benefiting marginalized and underserved populations (Ashmore et al. 2015; Dijk 2020; Fryer and Granger 2008; Warschauer 2003). Social infrastructure can also help solve the last mile problem which refers to challenge of delivering internet from main network infrastructure to individual homes and businesses (Lambrechts and Sinha 2019). These infrastructures can act as anchor institutions by providing public internet access, shared digital devices, and trusted spaces for digital learning. For instance, libraries and schools equipped with high-speed broadband can extend Wi-Fi access to surrounding communities, while also offering digital literacy training and support (Fryer and Granger 2008; Warschauer 2003). Moreover, they can serve as local coordinators in broadband grant applications, public-private partnerships, or community network initiatives aimed at reducing deployment costs and expanding reach (Lambrechts and Sinha 2019)
However, the number of many such community organizations have declined due to resource constraints. Policymakers need to provide sustainable funding for such community organizations so that they can help to reduce these barriers. Again, the effectiveness of these interventions also depends on addressing socioeconomic and demographic barriers such as education, skills, income, etc., while integrating technology adoption with broader community development and civic engagement. While personal relationships with family, friends and community remain a matter of individual choice, local representatives and policymakers can create environments that foster these connections. They can invest in shared public spaces like parks, libraries, and community centers where people naturally gather. Support for local events, clubs, and civic organizations also encourages social interaction and a sense of belonging.
However, the relationship between human factors and smart divide is not moderated by social infrastructures, contrary to our hypothesis. This might be due to the persistent and systemic nature of inequality driven by the existing human factors. These disparities run much deeper than surface-level problems that cannot be fixed by simply improving social and/or technological infrastructures. Instead, they represent long-standing patterns of inequality that have become built into our social systems, creating barriers to participation in the smart society.
Limitations and Future Directions
This study acknowledges several constraints that present opportunities for future research. The current dataset was limited in its geographic scope, which affects the generalizability of its results to a broader geographic extent. However, we argue that our quantitative socio-technical model suggests a promising new research agenda that can examine the smart divide across diverse communities at a national level. In addition, the research would also have benefited from collecting more variables to measure digital skills and competencies. Our current study relies on self-reported survey data, but future studies should incorporate objective measures such as standardized tests that assess individual digital literacy and skills, providing more precise and reliable measures. Moreover, while the present research utilized ordinal data, future studies might enhance methodological rigor by employing more continuous data measures. Future research can also expand the research horizon by examining additional dimensions of the smart divide, such as smart education and smart transportation. These emerging domains can offer rich potential for understanding smart divide beyond the current study's framework.
Conclusions
This study examined the complex relationships between digital connectivity, human factors, and social infrastructure in shaping the smart divide. Through empirical analysis, we assessed three hypotheses that challenge conventional assumptions about digital inequality in the era of smart technologies. While improving digital connectivity and infrastructure remains important, our findings reveal that these efforts alone are insufficient to bridge the smart divide. Our findings challenge the infrastructure-first approach that promotes investment of billions of dollars for physical broadband connectivity may have limited impact without addressing other barriers. Human factors emerged as the most powerful predictor of smart divide confirming that individual and demographic characteristics create persistent barriers to meaningful technology engagement. Income, education, and digital skills continue to create inequalities despite the availability of digital connectivity. Thus, there is a critical need for targeted interventions that address these underlying socio-economic determinants. Most importantly, social infrastructure emerges as a vital force in reducing the smart divide. Community organizations, government, and local support networks can provide essential resources and guidance that empower individuals to engage with digital technologies, regardless of their socio-economic background. In this era of Society 5.0, where advanced digital integration is the goal, many communities are still grappling with basic broadband and smart device access, which underscores the urgency of addressing the smart divide. Our findings have important implication for policymakers seeking to address the smart divide. Policies need to extend beyond infrastructure development and should include interventions like affordable internet and device programs, digital skill training tailored to different educational levels. Additionally, school education should incorporate digital literacy courses that will benefit student, parents and teachers. Investment in social infrastructure, such as community organizations, is also important for providing supportive environments where individuals can develop digital skills. Finally, addressing the smart divide requires collaboration across all stakeholders, including government agencies, private sectors, community organizations and individuals to create sustainable solutions. Such coordinated efforts must integrate infrastructure expansion, targeted support for vulnerable groups, and the strengthening of social infrastructures. As we advance toward Society 5.0's vision of seamless human-technology integration, addressing the smart divide demands urgent action to ensure that no one is left behind in our pursuit of a truly inclusive digital future.
Appendix
Table A1.
Correlation Matrix.
| TotalDevice | InternetAccess | CommunityOrgInternetHelp | FnFInternetHelp | GovtInternetHelp | HHincome | EducationLevel | Telehealth_Skill | Telehealth_Use | Telehealth_Attitude | |
| Total Device |
1.00 | |||||||||
| InternetAccess | 0.42 | 1.00 | ||||||||
| CommunityOrgInternetHelp | 0.00 | 0.02 | 1.00 | |||||||
| FnFInternetHelp | -0.04 | -0.14 | 0.34 | 1.00 | ||||||
| GovtInternetHelp | -0.01 | -0.05 | 0.26 | 0.24 | 1.00 | |||||
| HHincome | 0.24 | 0.23 | 0.02 | -0.12 | -0.07 | 1.00 | ||||
| EducationLevel | 0.19 | 0.31 | 0.14 | -0.06 | -0.15 | 0.41 | 1.00 | |||
| Telehealth_Skill | -0.22 | -0.23 | 0.01 | 0.03 | 0.06 | -0.09 | -0.14 | 1.00 | ||
| Telehealth_Use | 0.17 | 0.24 | -0.12 | -0.11 | -0.04 | 0.21 | 0.21 | -0.13 | 1.00 | |
| Telehealth_Attitude | 0.13 | 0.19 | -0.09 | -0.18 | -0.12 | 0.19 | 0.13 | -0.30 | 0.38 | 1 |
References
- Albino, Vito, Umberto Berardi, and Rosa Maria Dangelico. 2015. “Smart Cities: Definitions, Dimensions, Performance, and Initiatives.” Journal of Urban Technology 22 (1): 3–21. [CrossRef]
- Anderson, James C., and David W. Gerbing. 1988. “Structural Equation Modeling in Practice: A Review and Recommended Two-Step Approach.” Psychological Bulletin 103 (3): 3. [CrossRef]
- Ashmore, Fiona H., John H. Farrington, and Sarah Skerratt. 2015. “Superfast Broadband and Rural Community Resilience: Examining the Rural Need for Speed.” Scottish Geographical Journal 131 (3–4): 265–78. [CrossRef]
- Baxter, Gordon, and Ian Sommerville. 2011. “Socio-Technical Systems: From Design Methods to Systems Engineering.” Interacting with Computers 23 (1): 4–17. [CrossRef]
- Bijker, Wiebe E. 2010. “How Is Technology Made?—That Is the Question!” Cambridge Journal of Economics 34 (1): 63–76. [CrossRef]
- Bouabida, Khayreddine, Bertrand Lebouché, and Marie-Pascale Pomey. 2022. “Telehealth and COVID-19 Pandemic: An Overview of the Telehealth Use, Advantages, Challenges, and Opportunities during COVID-19 Pandemic.” Healthcare 10 (11): 2293. [CrossRef]
- Callon, Michel. 1986. “The Sociology of an Actor-Network: The Case of the Electric Vehicle.” In Mapping the Dynamics of Science and Technology, edited by Michel Callon, John Law, and Arie Rip. Palgrave Macmillan UK. [CrossRef]
- Chen, Jie, Aitalohi Amaize, and Deanna Barath. 2021. “Evaluating Telehealth Adoption and Related Barriers Among Hospitals Located in Rural and Urban Areas.” The Journal of Rural Health 37 (4): 801–11. [CrossRef]
- Chen, Xiaoqian, Kang Chen, Minxiao Wang, and Ruopu Li. 2023. “Roles of Wireless Networks in Bridging the Rural Smart Infrastructural Divide.” Infrastructures 8 (11): 159. [CrossRef]
- Clare, Camille A. 2021. “Telehealth and the Digital Divide as a Social Determinant of Health during the COVID-19 Pandemic.” Network Modeling and Analysis in Health Informatics and Bioinformatics 10 (1): 26. [CrossRef]
- Cocchia, Annalisa. 2014. “Smart and Digital City: A Systematic Literature Review.” In Smart City, edited by Renata Paola Dameri and Camille Rosenthal-Sabroux. Progress in IS. Springer International Publishing. [CrossRef]
- Crowe, Jessica, Jelena Nikolic-Khatatbeh, and Ruopu Li. 2024. “The Digital Health Divide: Understanding Telehealth Adoption across Racial Lines in Rural Illinois.” SSM - Population Health 26 (June): 101665. [CrossRef]
- Dijk, Jan van. 2020. The Digital Divide. Polity.
- Dillman, Don A., Jolene D. Smyth, and Leah Melani Christian. 2014. Internet, Phone, Mail, and Mixed Mode Surveys: The Tailored Design Method, 4th Ed. Internet, Phone, Mail, and Mixed Mode Surveys: The Tailored Design Method, 4th Ed. John Wiley & Sons Inc.
- Dornauer, Mark E., and Robert Bryce. 2020. Too Many Rural Americans Are Living In the Digital Dark. The Problem Demands A New Deal Solution. [CrossRef]
- Esteban-Navarro, Miguel-Ángel, Miguel-Ángel García-Madurga, Tamara Morte-Nadal, and Antonia-Isabel Nogales-Bocio. 2020. “The Rural Digital Divide in the Face of the COVID-19 Pandemic in Europe—Recommendations from a Scoping Review.” Informatics 7 (4): 4. [CrossRef]
- Fryer, Deidra, and Mary J. Granger. 2008. “Closing the Digital Divide: The Role of Community Based Non-Profit Organizations.” Journal of Global Information Technology Management 11 (1): 1–5. [CrossRef]
- Green, Gary Paul, and Anna Haines. 2016. Asset Building & Community Development. SAGE Publications, Inc. [CrossRef]
- Hanseth, Ole, and Kalle Lyytinen. 2010. “Design Theory for Dynamic Complexity in Information Infrastructures: The Case of Building Internet.” Journal of Information Technology 25 (1): 1–19. [CrossRef]
- Hariyadi, Hariyadi, Mohammad Mulyadi, Handrini Ardiyanti, et al. 2024. “Access to Power Is a Key Requisite for Successful Digital Connectivity: Case Study in Rural Areas in Eastern Indonesia.” In Advances in Finance, Accounting, and Economics, edited by Patricia Ordóñez De Pablos, Mohammad Nabil Almunawar, and Muhammad Anshari. IGI Global. [CrossRef]
- Helsper, Ellen. 2021. The Digital Disconnect: The Social Causes and Consequences of Digital Inequalities. SAGE Publications Ltd. [CrossRef]
- Hu, Li-tze, and Peter M. Bentler. 1999. “Cutoff Criteria for Fit Indexes in Covariance Structure Analysis: Conventional Criteria versus New Alternatives.” Structural Equation Modeling: A Multidisciplinary Journal 6 (1): 1–55. [CrossRef]
- Kaur, Tejinder, and Ojas Sharma. 2024. ARTIFICIAL INTELLIGENCE AND MACHINE LEARNING FOR SMART COMMUNITY: Concepts and Applications. First edition. Edited by T. V. Ramana, G. S. Pradeep Ghantasala, R. Sathiyaraj, and Mudassir Khan. CRC PRESS. [CrossRef]
- Kim, Nammi, and Seungwoo Yang. 2023. “Sociotechnical Characteristics of Conceptually Related Smart Cities’ Services from an International Perspective.” Smart Cities 6 (1): 196–242. [CrossRef]
- Kitchin, Rob. 2014. “Big Data, New Epistemologies and Paradigm Shifts.” Big Data & Society 1 (1): 1. [CrossRef]
- Kitchin, Rob, Paolo Cardullo, and Cesare Di Feliciantonio. 2018. Citizenship, Justice and the Right to the Smart City. Preprint. SocArXiv. [CrossRef]
- Klee, David, Derek Pyne, Joshua Kroll, William James, and Kelly A. Hirko. 2023. “Rural Patient and Provider Perceptions of Telehealth Implemented during the COVID-19 Pandemic.” BMC Health Services Research 23 (1): 981. [CrossRef]
- Koonin, Lisa M., Brooke Hoots, Clarisse A. Tsang, et al. 2020. “Trends in the Use of Telehealth During the Emergence of the COVID-19 Pandemic — United States, January–March 2020.” MMWR. Morbidity and Mortality Weekly Report 69 (43): 1595–99. [CrossRef]
- Kopackova, Hana, and Petra Libalova. 2017. “Smart City Concept as Socio-Technical System.” 2017 International Conference on Information and Digital Technologies (IDT), July, 198–205. [CrossRef]
- Lambrechts, Wynand, and Saurabh Sinha. 2019. “Bridging the Digital Divide: Innovative Last Mile Internet Connectivity Solutions.” In Last Mile Internet Access for Emerging Economies, edited by Wynand Lambrechts and Saurabh Sinha. Springer International Publishing. [CrossRef]
- Latour, Bruno. 1984. “The Powers of Association.” The Sociological Review 32 (S1): 264–80. [CrossRef]
- Latour, Bruno. 2007a. Reassembling the Social: An Introduction to Actor-Network-Theory. 1. publ. in pbk. Clarendon Lectures in Management Studies. Oxford Univ. Press.
- Latour, Bruno. 2007b. Reassembling the Social: An Introduction to Actor-Network-Theory. 1. publ. in pbk. Clarendon Lectures in Management Studies. Oxford Univ. Press.
- Law, John. 1990. “Introduction: Monsters, Machines and Sociotechnical Relations.” The Sociological Review 38 (1_suppl): 1–23. [CrossRef]
- Lee, Juhyun, Julia Babcock, Thai Son Pham, Thu Hien Bui, and Myounggu Kang. 2023. “Smart City as a Social Transition towards Inclusive Development through Technology: A Tale of Four Smart Cities.” International Journal of Urban Sciences 27 (sup1): 75–100. [CrossRef]
- Lee, Seungmin. 2016. “Smart Divide: Paradigm Shift in Digital Divide in South Korea.” Journal of Librarianship and Information Science 48 (3): 260–68. [CrossRef]
- Lestari, Haifa Mayang, Adriana Viola Miranda, and Ahmad Fuady. 2024. “Barriers to Telemedicine Adoption among Rural Communities in Developing Countries: A Systematic Review and Proposed Framework.” Clinical Epidemiology and Global Health 28 (July): 101684. [CrossRef]
- Li, Ruopu, Kang Chen, and Di Wu. 2020. “Challenges and Opportunities for Coping with the Smart Divide in Rural America.” Annals of the American Association of Geographers 110 (2): 559–70. [CrossRef]
- Masik, Grzegorz, Iwona Sagan, and James W. Scott. 2021. “Smart City Strategies and New Urban Development Policies in the Polish Context.” Cities 108 (January): 102970. [CrossRef]
- McNeish, Daniel, Ji An, and Gregory R. Hancock. 2018. “The Thorny Relation Between Measurement Quality and Fit Index Cutoffs in Latent Variable Models.” Journal of Personality Assessment 100 (1): 43–52. [CrossRef]
- Mondschein, Jared, Aaron Clark-Ginsberg, and Andreas Kuehn. 2021. “Smart Cities as Large Technological Systems: Overcoming Organizational Challenges in Smart Cities through Collective Action.” Sustainable Cities and Society 67 (April): 102730. [CrossRef]
- Monteiro, Eric, and Ole Hanseth. 1996. “Social Shaping of Information Infrastructure: On Being Specific about the Technology.” In Information Technology and Changes in Organizational Work: Proceedings of the IFIP WG8.2 Working Conference on Information Technology and Changes in Organizational Work, December 1995, edited by Wanda J. Orlikowski, Geoff Walsham, Matthew R. Jones, and Janice I. Degross. Springer US. [CrossRef]
- Mwansa, Gardner, Matipa Ricky Ngandu, and Zolisa Mkwambi. 2025. “Bridging the Digital Divide: Exploring the Challenges and Solutions for Digital Exclusion in Rural South Africa.” Discover Global Society 3 (1): 54. [CrossRef]
- Ntanda, Ayanda, and Randall Carolissen. 2025. “Technology’s Dual Role in Smart Cities and Social Equality: A Systematic Literature.” Journal of Local Government Research and Innovation 6 (0): 0. [CrossRef]
- Pinch, Trevor J., and Wiebe E. Bijker. 1984. “The Social Construction of Facts and Artefacts: Or How the Sociology of Science and the Sociology of Technology Might Benefit Each Other.” Social Studies of Science 14 (3): 399–441. [CrossRef]
- Ramos, Jaime. 2022. What Are Smart Communities? Strategies, Examples and More - Tomorrow.City - The Biggest Platform about Urban Innovation. Uncategorized. March 1. https://www.tomorrow.city/what-is-smart-community/. https://www.tomorrow.city/what-is-smart-community/.
- Robinson, Laura, Shelia R. Cotten, Hiroshi Ono, et al. 2015. “Digital Inequalities and Why They Matter.” Information, Communication & Society 18 (5): 569–82. [CrossRef]
- Sawyer, Steve, and Mohammad Hossein Jarrahi. 2014. “Sociotechnical Approaches to the Study of Information Systems.” In Computing Handbook, 3rd ed. Chapman and Hall/CRC.
- Scheerder, Anique, Alexander Van Deursen, and Jan Van Dijk. 2017. “Determinants of Internet Skills, Uses and Outcomes. A Systematic Review of the Second- and Third-Level Digital Divide.” Telematics and Informatics 34 (8): 1607–24. [CrossRef]
- Shin, Seung-Yoon, Dongwook Kim, and Soon Ae Chun. 2021. “Digital Divide in Advanced Smart City Innovations.” Sustainability 13 (7): 4076. [CrossRef]
- Song, Y., G. Zhou, and Y. Zhu. 2013. “Present Status and Challenges of Big Data Processing in Smart Grid.” Dianwang Jishu/Power System Technology 37 (April): 927–35.
- Tatnall, Arthur, and Anthony Gilding. 1999. Actor-Network Theory and Information Systems Research. January 1.
- Visvizi, Anna, and Miltiadis Lytras. 2018. “It’s Not a Fad: Smart Cities and Smart Villages Research in European and Global Contexts.” Sustainability 10 (8): 8. [CrossRef]
- Vogels, Emily A., Lee Rainie, and Janna Anderson. 2020. “Tech Causes More Problems than It Solves.” Pew Research Center, June 30. https://www.pewresearch.org/internet/2020/06/30/tech-causes-more-problems-than-it-solves/.
- Warschauer, Mark. 2003. Technology and Social Inclusion: Rethinking the Digital Divide. The MIT Press. [CrossRef]
- Zaidan, Esmat, Ali Ghofrani, Ammar Abulibdeh, and Mohsen Jafari. 2022. “Accelerating the Change to Smart Societies- a Strategic Knowledge-Based Framework for Smart Energy Transition of Urban Communities.” Frontiers in Energy Research 10 (March): 852092. [CrossRef]
- Zyl, Llewellyn E. Van, and Peter M. Ten Klooster. 2022. “Exploratory Structural Equation Modeling: Practical Guidelines and Tutorial With a Convenient Online Tool for Mplus.” Frontiers in Psychiatry 12 (January): 795672. [CrossRef]
Figure 1.
Hypothesized Conceptual Relationship among Digital Connectivity, Human Factors, Social Infrastructure, and Smart Divide. Social Infrastructure acts as moderator here. Solid lines represent direct effects, while dotted lines indicate moderation pathways.
Figure 1.
Hypothesized Conceptual Relationship among Digital Connectivity, Human Factors, Social Infrastructure, and Smart Divide. Social Infrastructure acts as moderator here. Solid lines represent direct effects, while dotted lines indicate moderation pathways.
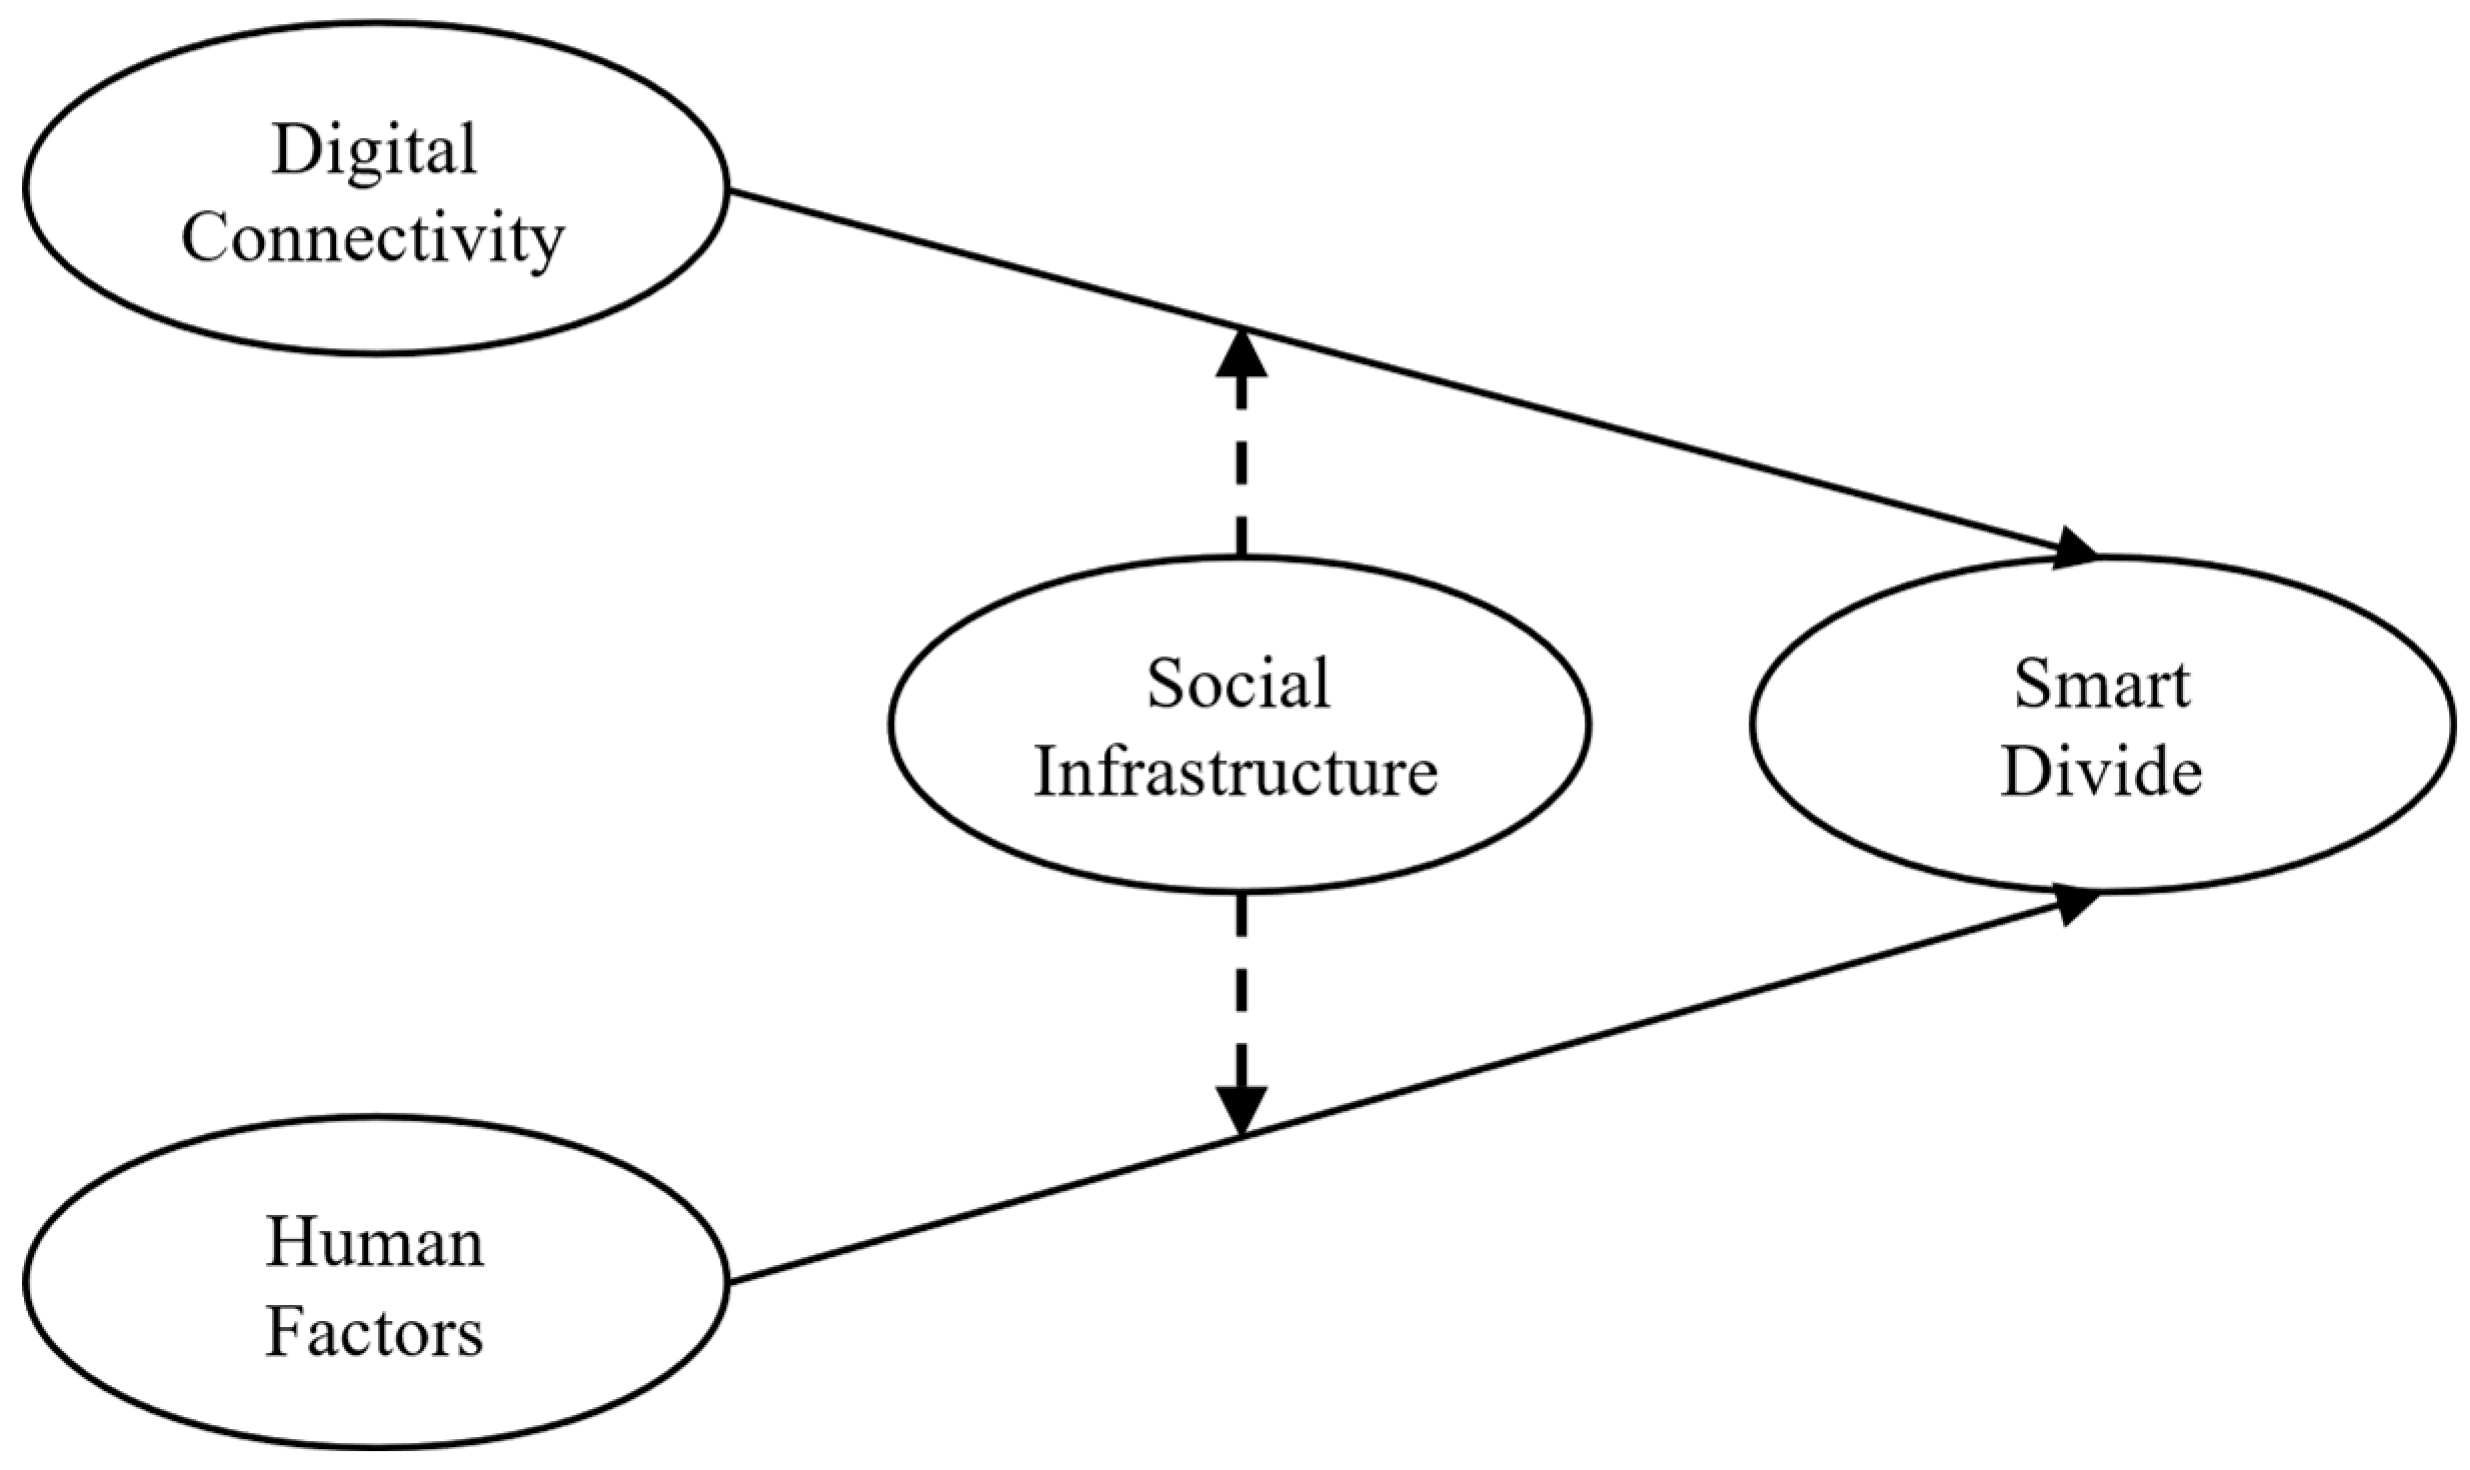
Figure 2.
Socio-Demographic profile of the respondents.
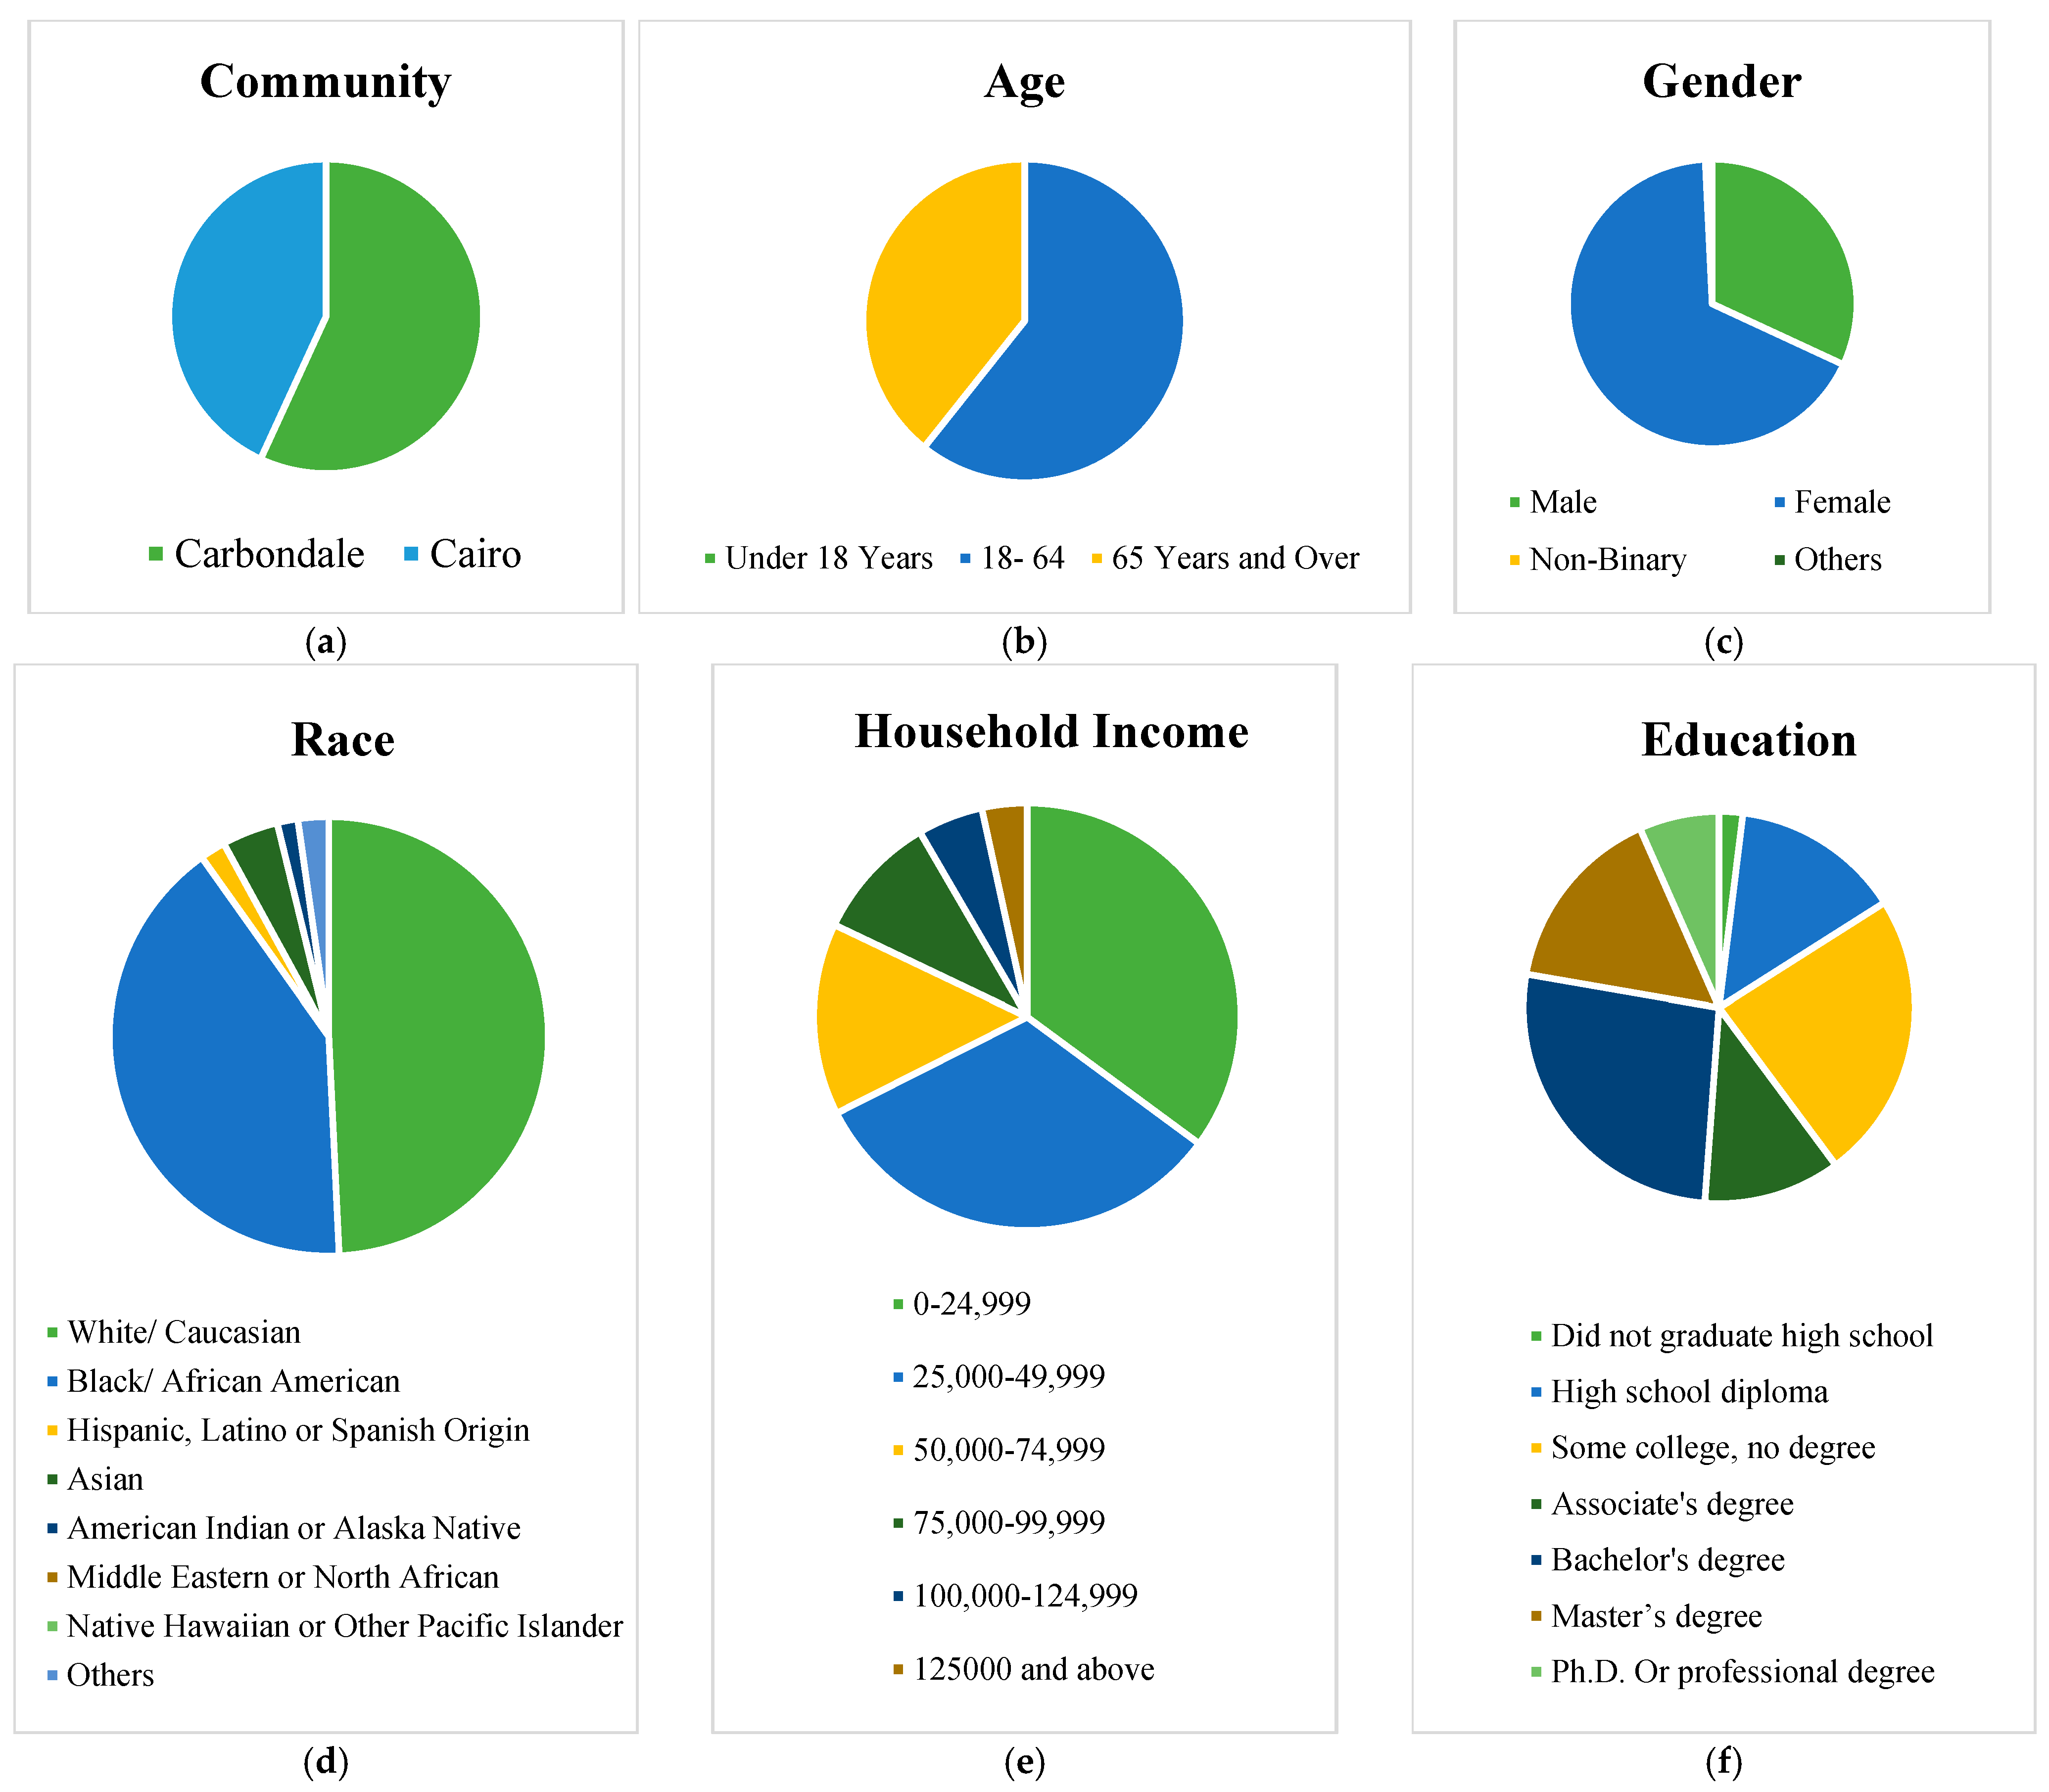
Figure 3.
The complete model of the study.
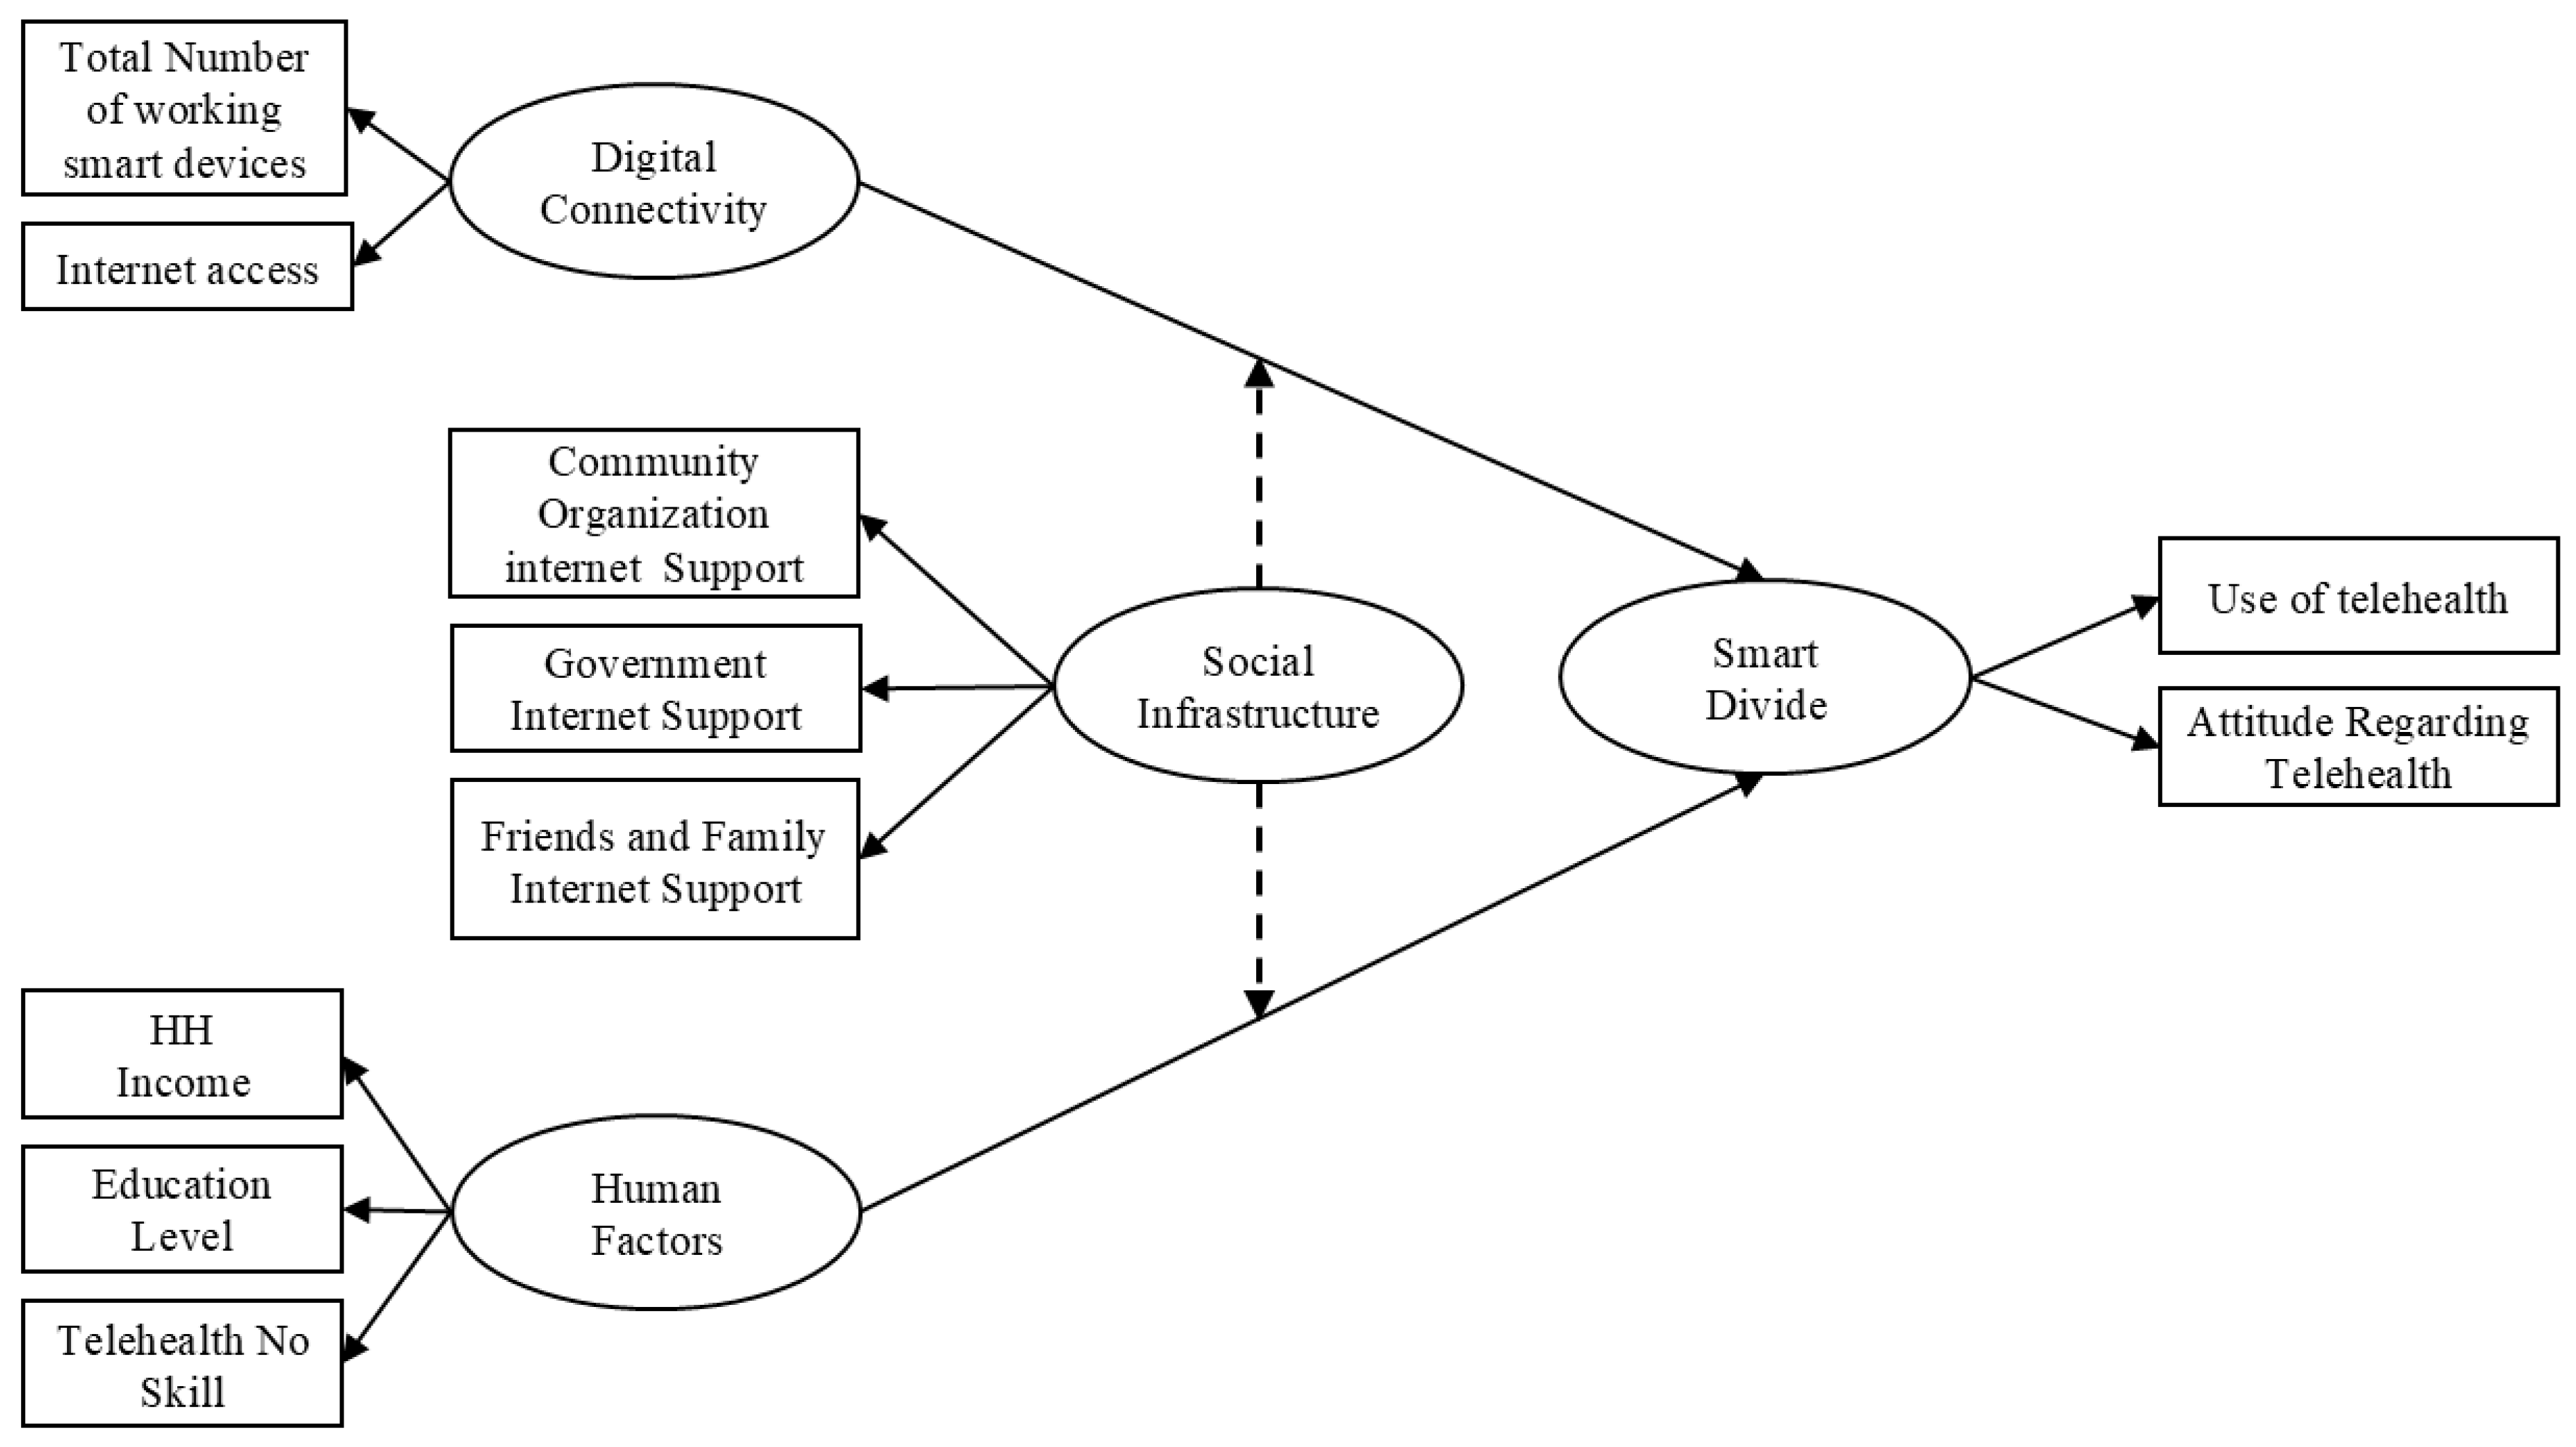
Table 1.
Latent Constructs, Measured Variables, and Descriptive Statistics.
| Latent Constructs | Observed Variable | Scale | Values | Mean | Mode | SD |
|---|---|---|---|---|---|---|
| Digital Connectivity | Total number of working smart devices | Count | None | 4.27 | 2 | 2.69 |
| Internet access at household | Ordinal | 0= No 1= Yes |
0.87 | 1 | 0.34 | |
| Household (HH) Income | Ordinal | 1= 0-24,999 2= 25,000-49,999 3= 50,000-74,999 4= 75,000-99,999 5= 100,000-124,999 6= 125000 and above |
2.27 | 2 | 1.20 | |
| Educational qualification | Ordinal | 1= did not graduate 2= high school high school diploma 3= some college, no degree 4= associate's degree 5= bachelor's degree 6= master’s degree 7= Ph.D. or professional degree |
4.18 | 3 | 1.05 | |
| Don’t have the skills to use the telehealth technologies | Ordinal | 0= No 1= Yes |
0.11 | 2 | 0.48 | |
| Social Infrastructure | Community clubs and organizations support to solve internet issues | Ordinal | 1= strongly disagree 2= disagree 3= neither 4= agree 5= strongly agree |
3.39 | 1 | 1.34 |
| Family and friends help to solve internet use problems | Ordinal | 1= strongly disagree 2= disagree 3= neither 4= agree 5= strongly agree |
2.47 | 5 | 1.56 | |
| The government helps with my internet issues problems | Ordinal | 1= strongly disagree 2= disagree 3= neither 4= agree 5= strongly agree |
3.56 | 0 | 0.47 | |
| Smart Divide | Telehealth Use | Ordinal | 0= No 1= Yes |
1.64 | 2 | 0.48 |
| Telehealth Attitude | Ordinal | 1= strongly disagree 2= disagree 3= neither 4= agree 5= strongly agree |
3.79 | 4 | 0.87 |
Disclaimer/Publisher’s Note: The statements, opinions and data contained in all publications are solely those of the individual author(s) and contributor(s) and not of MDPI and/or the editor(s). MDPI and/or the editor(s) disclaim responsibility for any injury to people or property resulting from any ideas, methods, instructions or products referred to in the content. |
© 2026 by the authors. Licensee MDPI, Basel, Switzerland. This article is an open access article distributed under the terms and conditions of the Creative Commons Attribution (CC BY) license.
Copyright: This open access article is published under a Creative Commons CC BY 4.0 license, which permit the free download, distribution, and reuse, provided that the author and preprint are cited in any reuse.


