
Submitted:
26 December 2025
Posted:
26 December 2025
You are already at the latest version
Abstract
Accurate prediction of motor-insurance policy renewals is essential for pricing, customer retention, and operational decision-making in modern digital insurance ecosystems. This study develops an interpretable intelligent system for classifying Type 1 motor-insurance policy renewals using a real-world portfolio of 70,290 private-car policies from Thailand. Five machine-learning models including Binary Logistic Regression, K-Nearest Neighbors, Support Vector Machines, Random Forests, and XGBoost are systematically evaluated across multiple curated feature sets generated through statistical filtering, stepwise selection, and permutation-based importance. Non-parametric statistical tests are employed to compare model performance across scenarios. Experimental results show that a reduced four-feature Random Forest model (car age, net premium, sum insured, and car group) achieves the highest predictive performance (AUC = 0.9962; F1 = 0.9815), outperforming full-feature models while maintaining superior computational efficiency. To ensure transparency and regulatory alignment, a SHAP-based explainability layer is integrated to quantify the marginal influence of each predictor on renewal decisions, revealing strong behavioral and pricing effects associated with vehicle age and premium structure. The proposed system provides interpretable, scalable, and deployment-ready insights for insurers, supporting dynamic pricing, risk-adjusted retention strategies, and digital customer engagement. The findings demonstrate how efficient and transparent ML-driven intelligent systems can enhance decision support in rapidly evolving motor-insurance markets.
Keywords:
customer retention analysis
; feature selection
; motor-insurance analytics
; risk assessment
; SHAP explainability
1. Introduction
Sustaining policy renewals is fundamental to motor-insurance profitability, as retaining existing customers costs substantially less than acquiring new ones and contributes directly to portfolio stability and long-term loss-ratio management. Increasing price competition, rising operational costs, and rapid technological shifts, particularly the uptake of electric vehicles, have intensified insurers’ reliance on data-driven renewal strategies [1,2,3,4]. Despite these pressures, Thailand’s average renewal rate remains near 54%, indicating substantial room for improvement within a market of more than 40 million registered vehicles.
Type 1 motor insurance, the focus of this study, is the most comprehensive voluntary motor policy in Thailand, covering vehicle damage, theft, fire, flooding, and third-party liability. It is commonly recommended for new or low-age vehicles and high-risk or inexperienced drivers. Premiums vary by vehicle characteristics, claim history, repair options, insured value, and insurer. At renewal, policyholders also consider deductibles, service networks, and competing offers, leading to increasingly heterogeneous renewal behaviors. Early actuarial models predicting renewal decisions largely relied on logistic regression or heuristic scorecards. However, recent evidence demonstrates that policy renewal is influenced by diverse and interacting factors, including distribution channel, no-claim discount, vehicle age, premium level, and purchase price [5,6,7,8,9,10]. Competitive pricing, operational efficiency, and even real-time social-media sentiment further shape retention [1,11]. In response, machine-learning (ML) techniques have gained increasing attention for renewal prediction. Numerous studies confirm that ML models outperform traditional approaches [6,7,8,9,12,13,14]. Their effectiveness, however, depends critically on access to broad, well-structured datasets capturing vehicle attributes, customer behaviors, economic conditions, and temporal dynamics [13,15,16]. Telematics data capturing speed, acceleration, braking, and mileage have been particularly valuable for dynamic risk assessment and personalized pricing [14]. Integrating such varied data sources requires intensive preprocessing, including linking telematics with claim histories and examining correlations among financial or economic indicators [14,17]. Despite global advances, significant gaps remain in the Thai context. Over 40% of registered vehicles lack voluntary insurance, and renewal behavior is driven by pricing sensitivity, rapidly evolving digital ecosystems, and emerging vehicle technologies [2,3,4,13,18,19]. Traditional actuarial models struggle to incorporate these nonlinearities and behaviorally driven patterns. Moreover, high-quality, publicly accessible motor-insurance datasets in Thailand are scarce, limiting reproducibility and methodological innovation. Consequently, there is an urgent need for accurate, explainable, and computationally efficient ML-based renewal systems tailored to Thai market realities. Even when ML models achieve strong predictive accuracy, three methodological challenges persist. Firstly, performance metrics can be distorted by class imbalance. Secondly, multicollinearity among predictors can undermine generalizability. Thirdly, many ensemble methods sacrifice transparency for accuracy, complicating regulatory compliance and practitioner trust. While explainability frameworks such as SHapley Additive exPlanations (SHAP) help address interpretability, relatively few studies simultaneously confront all three challenges using large-scale Asian motor-insurance datasets [20,21,22,23].
Therefore, this study investigates whether an interpretable machine-learning framework can reliably predict motor-insurance renewal risk using 70,290 Thai private-car policies (2024). By combining multiple classifiers, rigorous feature-selection strategies, SHAP-based interpretability, and statistical benchmarking, the study aims to deliver actionable, transparent insights for pricing, retention, and risk management in Thailand’s motor-insurance market.
2. Related Works
Recent research on motor-insurance analytics demonstrates rapid progress in predictive modeling, feature engineering, and explainable AI. Table 1 summarizes existing literature by author and year, sample size, study objectives, response variables, applied machine-learning or statistical models, feature-selection approaches, and interpretation techniques. It highlights methodological diversity, data scales, and explainability strategies, positioning the present study within current research trends and identifying gaps addressed by the proposed approach. Early works such as Spiteri & Azzopardi (2018) applied classical machine-learning classifiers and survival models to understand customer churn, highlighting the value of risk-factor identification [24]. Huang & Meng (2019) extended this direction by proposing a UBI-oriented framework combining crash prediction and claim frequency modeling using wrapper-based feature selection [25]. Studies on claim prediction, e.g., Abdelhadi et al. (2020) and Wang (2020), incorporated tree-based ensembles and domain-knowledge filters (e.g., VIF) to improve accuracy and interpretability. Telematics-driven modeling has become increasingly prominent [26,27]. Gao et al. (2021) integrated deep learning with Poisson regressions for claim frequency prediction, while Strada et al. (2024) engineered dynamic GPS-based behavioral features to enhance accident-risk estimation [28,29]. Parallel work on claim severity by Staudt & Wagner (2021) emphasized model comparison using GAM, GLM, and RF, supported by spatial effect plots [30]. Recent contributions broaden the interpretability landscape: Byrne (2024) and Ding et al. (2025) used SHAP for premium fairness and fraud detection, respectively; Deng et al. (2024) introduced causal inference to quantify environmental impacts on accidents; and Simmachan & Boonkrong (2024) combined GLMs with frequency-model diagnostics to identify influential predictors [16,31,32,33]. Together, these studies highlight the ongoing need for explainable, high-quality renewal prediction models using diverse algorithms and robust interpretability tools. The present study fills a gap by systematically comparing multiple ML classifiers for renewal prediction while simultaneously integrating statistical (VIF, Wald test) and ML-based (MDA, MDI, SHAP) interpretability. Unlike prior work focusing on churn, premiums, telematics, or claims, this study provides comprehensive, explainable renewal-risk insights for operational decision-making.
3. Data and Problem Specification
In the context of motor-insurance renewal decision support, the principal factors driving policyholder retention are identified. The renewal outcome is modeled as a binary variable , where indicates policy renewal and indicates non-renewal, based on a dataset containing nine predictor variables per policy. Before implementing ML classifiers, the descriptive statistics of these features are presented, and the binary classification problem is formally defined.
3.1. Data Description
The preliminary data examination of motor-insurance policy renewals from an insurance company in Thailand revealed no missing values. Removing 184 duplicated and incomplete policies, 70,290 policies remained for analysis. Of these, 37,980 policies were renewed, accounting for 53.91%, while 32,468 policies were not renewed, representing 46.09%. Table 2 summarizes the categorical distribution of policy renewals in term of renewal proportion () by Gender, Region, and Car Group among 70,290 policies. Males (n = 31,683) renewed at 55.13% versus 53.00% for females (n = 38,607). Renewal rates peaked in Central (56.63%) and bottomed in Northeast (46.69%). Car-group rates ranged from 78.87% (Group 02) to 54.50% (Group 03), indicating heterogeneity and guiding targeted retention strategies for motor-insurance renewals and policy design. Particularly in Thai motor-insurance, Car Group categorizes vehicles by chassis value and repair-cost brackets. Group 01 (≥ 5 million THB) includes ultra-luxury models; Group 02 ( million THB) premium vehicles; Group 03 ( million THB) mid-range sedans; Group 04 ( million THB) compact cars; and Group 05 (≤0.7 million THB) economy models. Imported and sports vehicles are assigned to Group 01, higher to reflect elevated repair costs. Furthermore, there are 7 quantitative features including Car Age, Sum Insured, Premium, Recovery, Number of Claims, Total Claim and Incurred Loss. Table 3 presents descriptive statistics for the continuous predictors by renewal status. Renewed policies exhibit higher mean Car Age (4.99 vs. 1.53 years) but lower mean Sum Insured (THB 585,612 vs. THB 750,077) and Premium (THB 14,282 vs. THB 16,896) than non-renewals. Recovery, Claim Count, Total Claim, and Incurred Loss are right-skewed (median = 0; IQR = 0), with non-renewals showing greater mean and variance, reflecting elevated loss exposure.
3.2. Problem Specification
Predicting policy renewals is a binary classification task critical to an insurer’s profitability, regulatory compliance, and customer retention. Let denote the dataset of N policies, where comprises demographic, geographic, vehicle and claim-history attributes, and . Accurate renewal forecasts enable targeted retention incentives, mitigate adverse selection and optimize loss ratios. The 5 effective ML algorithms including BLR, KNN, SVM, RF and XGB were selected as classifier candidates. To address heterogeneity across feature subsets, the classifiers were trained on multiple feature sets , including the full variable complement and subsets derived via penalized and embedded selection methods. The analytic pipeline includes model training and hyperparameter tuning via stratified 5-fold CV to optimize for AUC, F1-score, and accuracy. Post-hoc interpretability is then achieved using SHAP analysis and partial dependence plots to quantify how key features drive renewal propensity.
4. Machine Learning Framework
To investigate the factors influencing the decision to renew the car insurance policy, the ML framework concerns pre-processing, classifiers, hyperparameter tuning, evaluation metric and feature importance. Figure 1 presents the end-to-end workflow for interpretable motor-insurance renewal prediction, encompassing data acquisition, preprocessing and feature selection, comparative ML modeling, statistical performance evaluation, and SHAP-based explainability, culminating in transparent, actionable insights to support pricing, customer retention, and regulatory-compliant decision-making in Thailand’s motor-insurance context. Each process is described as follows:
4.1. Pre-Processing
Pre-processing plays a vital role in ensuring reliable and interpretable model outcomes. This section details the procedures applied prior to model development, including stratified train/test splitting, 5-fold CV for robust validation and tuning, and multiple feature selection strategies. These steps aim to maintain class distribution, reduce overfitting, and improve computational efficiency, thereby supporting accurate and generalizable predictions for motor-insurance policy renewal decisions.
4.1.1. Train/Test Splitting
Throughout this study, the train/test splitting was established to 70/30. That is, the total 7,0290 was split into training and testing sets. In the original data, the training set consists of 26,649 renewed and 22,810 non-renewed policies, with 11,331 renewed and 9,658 non-renewed in the testing set. The renewal rate remained consistent across both sets. The fractions of the major (renewed) to minor (non-renewed) class were 1.168, 1.173 and 1.170 for training, testing and overall dataset, respectively. Thus, the balancing technique is not required.
4.1.2. K-Fold Cross-Validation
To tune hyper-parameters and estimate generalization, stratified 5-fold CV was performed on the 70% training set. The training data was partitioned into 5 folds such that where is held out in fold k, and stratification preserved the renewal-to-lapse ratio in each fold. All 5 ML classifiers were each evaluated on 5 feature sets. Within each fold, GridSearchCV exhaustively searched the predefined hyperparameter grid for the given classifier and feature set, selecting the configuration that maximized mean validation accuracy. For each feature set combination, the mean accuracy, F1-score, and AUC across the 5 folds were recorded. The optimal hyperparameters were then fixed, and final model performance was assessed on the independent 30% test set.
4.1.3. Feature Selection
Screening of important features is a critical pre-processing step in ML that significantly impacts model performance by reducing dimensionality, eliminating noise, and improving accuracy [23,36,37,38]. Models without feature selection may face challenges, e.g., increased complexity, noise, and redundancy, which can adversely affect their performance. Incorporating feature selection techniques is generally recommended for building efficient and accurate ML models. The feature sets were obtained as follows:
- All Features: Without any feature selection technique, all 10 features were directly recruited into ML models. That is,
-
Filter Methods: Statistical associations among the 10 predictors were assessed using point-biserial (binary vs. continuous), Cramer’s V (categorical pairs), Pearson (continuous pairs), and (categorical vs. continuous). As shown in Figure 2, all associations were weak, except for a near-perfect Pearson correlation () between Total Claim () and Incurred Loss (). Selecting Incurred Loss () as it holds greater operational relevance for motor-insurance companies, the new feature set isAdditionally, the Variance Inflation Factor (VIF) was employed to detect multicollinearity. As shown in Table 4, the remaining candidate predictors selected by VIF are the same as .
- Stepwise Selection: Stepwise feature selection refines model inputs by removing irrelevant variables, enhancing interpretability and reducing variance. Applied to motor-insurance renewal data in Thailand using BLR at , the method excluded Constant () and Gender (). Setting , the final feature set was reduced to the following eight significant features:
-
Mean Decrease Accuracy: MDA permutation test was applied to both RF and XGB ensembles to quantify each predictor’s contribution to overall model accuracy. For every feature , its values were randomly permuted while all remaining variables were held constant; the resulting decline in predictive accuracy was interpreted as that feature’s importance score. In RF, the accuracy loss was assessed on out-of-bag samples, yielding the set of features as shown in Table 4. The features for MDA_RF is denoted bySimilarly for XGB, the same procedure was embedded within a 5-fold CV loop, producing the set of features from MDA_XGB as
-
Mean Decrease Impurity: To complement the permutation analysis, MDI was evaluated for the same tree ensembles. In RF, the total reduction in Gini impurity contributed by each predictor across all split nodes was accumulated and averaged over the forest; the resulting scores were recorded as shown in Table 4, i.e.,In XGB, feature importance was computed as the mean gain in log-loss achieved at every split that involved a given variable, with the averages reported as MDI_XGB. To apply a fixed cut-off at 0.001, the MDI_XGB score for each feature was then normalized by their sum and the feature set was obtained as
As shown in Table 4, 6 feature selections were used for classifying motor-insurance renewal decision support. However the feature sets from MDI_RF, and MDI_XGB cover all features as . Finally, there are 5 different feature sets to be experimented ranging from to .
4.2. Classification Models
Classifying motor-insurance renewal, 5 popular supervised classification algorithms including BLR, KNN, SVM, RF and XGB are employed [7,36,37,38]. The binary outcome variable is defined as , where indicates renewal and indicates lapse. Each policy is represented by a feature vector . BLR serves as a standard baseline for comparison. KNN provides a non-parametric approach, leveraging local data structure without strong distributional assumptions [23]. SVM introduces a robust boundary-based classifier, particularly effective in high-dimensional spaces with well-separated classes. RF, an ensemble method based on decision trees, captures non-linear relationships and interactions among variables while offering intrinsic measures of feature importance. XGB is selected for its computational efficiency, regularization capabilities, and high predictive accuracy [39]. Classifying policy renewal, the corresponding confusion matrix provides vital performance insights. Accuracy, precision, recall, F1-score and AUC were employed for model performances [38,39].
4.3. Hyperparameter Tuning
In motor-insurance renewals decision support framework, hyperparameter tuning was conducted using GridSearchCV with 5-fold stratified CV to maximize classification accuracy. Let denote the dataset, and parameter grids spanned all relevant dimensions. The hyperparameter tuning for each ML classifier is given as follows:
- BLR: A 5-fold stratified grid search over the set was conducted using the lbfgs solver (tolerance = , max_iter=1000). Predictors were standardized, and the C value maximizing mean validation accuracy was selected.
- SVM: A 5-fold stratified grid search over with an RBF kernel was employed, where C balances margin width and misclassification penalty, and . Class proportions were preserved across folds, and the configuration maximizing mean validation accuracy was selected.
- KNN: An exhaustive grid search over where , , , was conducted via 5-fold stratified CV to maximize mean accuracy. Here, n specifies the neighborhood size, w the weighting scheme, and p the Minkowski metric ( for Manhattan, for Euclidean). Stratification preserved class proportions and extensive evaluation ensured reproducibility.
- RF: The RF hyperparameter space defined as . The parameters , , , , were optimized through exhaustive 5-fold stratified grid search using GridSearchCV. Tuning of ensemble size (), tree depth (d), split (s) and leaf (ℓ) constraints, and impurity criterion (c) balanced bias-variance, with a fixed random_state ensuring reproducibility.
- XGB: The XGB hyperparameter grid was specified as where , , , , and . The notation is the learning rate and , are the subsample and column-sample fractions. Early stopping limited overfitting, while a 5-fold grid search identified the configuration with optimal validation accuracy.
4.4. Statistical Tests for Comparisons
Non-Parametric Multiple Comparison Procedures (MCPs) was used when the assumptions of normality and homogeneity of variances are violated. Following a significant Kruskal-Wallis test, an alternative of ANOVA, MCPs can be applied to identify which groups differ [37,40]. Among these, Dunn’s test is one of the most widely used non-parametric post-hoc tests, designed for all-pairs comparisons using rank sums. To control the family-wise error rate (FWER) in the context of multiple testing, the Holm step-down method can be applied to adjust p-values. Holm’s method sequentially compares ordered p-values to progressively less stringent significance thresholds, calculated as , where m is the total number of comparisons and i denotes the rank of the p-value. Non-parametric pairwise comparisons were conducted using Dunn’s test with Holm-adjusted p-values. This approach was chosen for its robust control over false positives while providing greater statistical power than more conservative corrections.
4.5. SHapley Additive exPlanations
High predictive accuracy alone is insufficient when a model’s mechanism is opaque. SHAP mitigates this limitation by decomposing each prediction into feature-level contributions with game-theoretic guarantees [41,42,43]. It offers a comprehensive explanation of how individual features influence the final prediction, as given by where is the model output, the baseline (mean prediction), the Shapley value for feature j, and the number of features on the final model. Positive (negative) increases (decreases) the estimate relative to the baseline, providing fine-grained local explanations while maintaining global consistency. Since SHAP satisfies the axioms of efficiency, symmetry, dummy, and additivity, it yields coherent importance rankings across algorithms and datasets, outperforming earlier post-hoc heuristics. Accordingly, SHAP is employed herein to rank predictors and visualize their marginal effects, ensuring interpretability without sacrificing performance. ML models are expected to identify key renewal risk drivers, quantify pricing sensitivity across customer profiles, enable meaningful customer segmentation, and enhance regulatory transparency by providing interpretable, data-driven explanations that support fair pricing, accountable decision-making, and compliant deployment of predictive analytics in motor-insurance operations.
5. Numerical Results
A comprehensive evaluation of 25 ML scenarios, derived from 5 classifiers and 5 feature sets, is conducted to identify the optimal model and assess the effectiveness of feature reduction. Additionally, SHAP analysis is employed to provide model interpretability by quantifying the importance and impact of key predictors on insurance renewal decisions.
5.1. Classification Performance
Classification algorithms are systematically benchmarked across various feature sets to assess their impact on key metrics. The superiority of specific classifiers is demonstrated, and it is shown that predictive accuracy can be maintained or improved with more parsimonious feature sets.
5.1.1. Comparison of ML Classifiers
To investigate the impact of different feature sets and classifiers, Table 5 summarizes the performance of 5 classifiers across 5 feature selection strategies. Particularly for the classification purposes, key evaluation metrics reported include AUC, F1-score and accuracy are respectively prioritized. Since all 3 evaluation metrics are not normally distributed (Shapiro-Wilk Statistics, ), Kruskal-Wallis H test (non-parametric test) was used instead of ANOVA F-test. Subsequently, the statistical test claims that at least one classifier is different from others for all metrics (). Applying the non-parametric MCP test, it was found that the accuracy scores between BLR-RF (adjusted ) and BLR-XGB (adjusted ) are significantly different. Similarly for F1-scores, BLR-RF (adjusted ) and BLR-XGB (adjusted ) are significantly different. Comparing AUC scores, BLR-RF (adjusted ) and BLR-XGB (adjusted ) are also significantly different. Other pairs of classifiers showed indifference.
5.1.2. Impact of Feature Selection
Feature selection plays a critical role in enhancing the performance, interpretability, and generalizability of ML models. Comparing the combinations of ML models and , it is seen that a reduced model can maintain, or even improve classification performance. Taking into account the feature selection techniques, there was no difference among all metrics: accuracy (), F1-Score () and AUC (). That is, all 5 feature sets showed comparable performance in creating classification models. As shown in Figure 3, RF and XGB models using achieved an AUC of 99.62% and 99.54%, respectively, with F1-scores approximately 98%. The ROC/AUC and precision-recall curves confirmed that the reduced feature set achieved comparable or superior predictive accuracy while enhancing computational efficiency and the model interpretability required in regulated sectors like insurance.
5.2. Model Interpretation
To enhance model transparency and explainability, SHAP analysis was applied to quantify the marginal impact of each predictor on renewal decisions. The global feature importance and individual-level effects across selected features were highlighted. The SHAP framework enables visual interpretation of how feature values influence predictions and offers insights into customer behavior patterns.
5.2.1. SHAP Analysis
SHAP-based feature importance, partial dependence insights, and sensitivity analyses to assess model stability under varying data-perturbation scenarios. As shown in Figure 4, 10 predictors were ranked for motor-insurance renewals. The largest contribution was generated by Car Age, i.e., newer vehicles were positively associated with renewal, whereas older vehicles were linked to negative contributions. A similarly pronounced influence was exhibited by Net Premium; high premiums were found to diminish retention, while competitive premiums were seen to increase it. Sum Insured produced a comparable but more moderate gradient, reflecting the trade-off perceived between coverage and price. Car Group was identified as the fourth driver: economical segments were favoured, whereas luxury segments were penalised. Claim-related attributes including Total Claim, Region, Incurred Loss, and Number of Claims were clustered next, indicating that loss-free histories were rewarded, while recent or costly claims were penalised. Finally, marginal yet non-zero effects were produced by Gender and a proprietary Recovery flag. SHAP analysis identifies Car Age as the most influential predictor of renewal decisions. Higher Car Age consistently produce strong positive SHAP values, while younger cars show mixed or negative contributions. With the highest mean SHAP value of 6.33, Car Age clearly outweighs all other variables, indicating that older vehicles are more likely to renew, possibly reflecting price sensitivity, perceived value of continued coverage, or reduced incentive to switch insurers.
5.2.2. Individual Effects of Important Features
The details of the feature contributions of the top four features was further investigated. Figure 5 displays SHAP value dispersion for , stratified into . One-year-old vehicles cluster near , indicating negative influence on the renewal score, and exhibit the lowest observed of 0.02%. Cars Age of years yield dense, highly positive SHAP values (up to 0.5) and the highest of 93.13%. Categories years and >10 years maintain positive, though weaker, contributions, aligning with of 85.84% and 91.43%, respectively. First-year vehicles show higher early churn due to price sensitivity and insurer switching, while renewal rates rise notably after year one, reflecting growing customer loyalty. Focusing on Net Premium across four price bands, Premiums under 13 000 yield mainly positive SHAP values () and the highest of 89.41%. As premiums rise, SHAP distributions shift downward, reaching in the band, and renewal proportions fall sharply through successive categories, highlighting price sensitivity within the insurer’s customer base. Thus, maintaining competitively low premiums remains crucial for sustaining renewal rates. Sums Insured below present predominantly positive SHAP values (to 0.15) and the highest renewal share (). In the and bands, median contributions drift toward zero while negative tails deepen to , paralleling lower renewal proportions. Policies exceeding display the most negative dispersion and record the lowest renewal rate. Similarly, lower coverage limits promote retention, whereas high sums insured markedly diminish renewal likelihood. For the Car Group, group 1 exhibits uniformly positive values around 0.04 and achieves a perfect of 100%. Group 2 remains positive but slightly lower (). Groups 3-5 exhibit lower renewal rates ( of 54-55%). This pattern highlights risk segmentation in pricing. Strategies should prioritize retention of Groups 1-2 while addressing risk factors in Groups 3-5.
6. Discussion and Implementation
The findings of this study provide new perspectives on renewal behavior within Thailand’s motor insurance sector and reflect broader industry changes toward personalized pricing, digital adoption, and data-driven marketing. The predictive modeling framework developed here offers a robust tool to support retention strategies, while the interpretability features ensure regulatory compliance and operational transparency.
6.1. Model Insights and Practical Relevance
This study highlights the effectiveness of feature selection in improving the predictive performance and interpretability of ML models for the renewal of motor-insurance policies. Using the MDA method under RF, the original set of 10 features was reduced to four key predictors including Car Age, Net Premium, Sum Insured, and Car Group while preserving near-perfect classification performance. Statistical tests confirmed the reduced model’s equivalence to full-feature versions, validating its practical use. Beyond computational efficiency, the selected features align with core insurance principles for the following reasons:
- Car Age emerged as the most influential factor, with older vehicles showing higher renewal rates. This may reflect customer perceptions of higher value in maintaining coverage for aging assets, as well as decreased willingness to switch providers for lower-value vehicles.
- Net Premium and Sum Insured were inversely associated with renewal likelihood, indicating that customers facing higher insurance costs are more prone to lapse.
- Car Group further stratified the risk, with economical vehicles more likely to renew and the luxury segments showing lower retention, likely due to increased exposure to claims and competitive market alternatives.
These insights align well with the observed trends in Thailand’s motor-insurance sector. Voluntary insurance plans (Types 1, 2+, 3+, and 3) offer varying levels of protection at different price points. Customers are increasingly motivated by perceived value and affordability, especially in a landscape where nearly 40% of vehicle owners remain uninsured due to misalignment between premium costs and income levels [2,3,4,18]. The model’s ability to identify and isolate key drivers related to financial and vehicle activities reinforces its utility to support personalized pricing strategies [12]. These strategies are growing in Thailand as insurers tailor products to user behavior, while structured feature selection enhances model generalization and streamlines retention, underwriting, and resource use.
6.2. Comparison with Prior Studies
Various ML models have been extensively explored for predicting customer decisions in the motor insurance sector. These include decision trees, random forests, gradient boosting, AdaBoost, Naive Bayes, logistic regression, neural networks, and LightGBM [6,7,8,9,12,13,14]. Among these, LightGBM has consistently demonstrated superior performance and robustness in predicting auto insurance renewals. Similarly, models such as RF and XGB have shown high accuracy and robustness, with random forests achieving an AUC of over 0.8 in several studies [6,7,9]. While confirming the established superiority of RF and XGB, this study achieves a higher predictive performance using only a parsimonious set of four core features, unlike prior works that often rely on extensive telematics or behavioral data. The robustness of these findings is further established through rigorous statistical comparisons and SHAP-based interpretability, providing insurers with an accurate and transparent tool to improve operational efficiency and customer retention strategies. In addition, ML algorithms further support fraud detection, thereby preserving financial integrity and customer trust, both of which contribute to improved renewal rates [8,36,44]. Based on the analysis of renewal probabilities, insurers can also formulate preferential policies tailored to individual customer profiles, thereby increasing the likelihood of renewal [12]. Furthermore, several key factors have been identified across the literature as influential in predicting auto insurance renewals. These include the business acquisition channel, no-claim discount (NCD), vehicle age, and initial purchase price. Additional factors including driver demographics, accident history, and telematics-based driving behaviors (e.g., speed, acceleration, and braking) have also been shown to significantly influence renewal decisions [2,6,12,21].
6.3. Digital Transformation
Recent industry reports have noted a significant increase in digital insurance adoption in Thailand. From 2020 to 2024, the proportion of consumers purchasing insurance online has grown rapidly, supported by generational digital familiarity and the cost advantage of online channels [2,3,4]. Priceza Money, a leading comparison platform, has reported that premiums for online-purchased Type 1 insurance policies are typically 3,000 to 4,000 THB lower than equivalent offline policies [18]. Beyond pricing, customer expectations now favor seamless digital experiences. Common pain points have driven the adoption of centralized platforms integrating AI, GPS, and real-time tracking. The EMCS platform, for example, connects over 4,000 stakeholders nationwide, enabling faster claims handling, document exchange, and intelligent routing [2]. The platform supports digital policy storage, automated renewals, repair scheduling, and real-time e-claims. The proposed predictive framework integrates seamlessly into such environments, where timely and accurate decision support is essential. As online purchasing trends toward full adoption, interpretable models are vital for sustaining user trust. AI-driven platforms further reduce operational costs while enabling personalized pricing and risk assessment. The COVID-19 pandemic shifted consumer focus from low pricing to insurer credibility, following failures of undercapitalized providers. In response, the SHAP-based explainability layer in this study enhances transparency in pricing and renewal decisions, aligning with evolving trust expectations. In parallel with AI and platform integration, telematics is playing an increasingly vital role in the digital transformation of car insurance [2,6,12,21]. Capturing real-time driving behavior data, e.g., speed, braking intensity, acceleration, and mileage, insurers can transition from traditional risk pooling toward dynamic, usage-based pricing (UBI) models. The integration of telematics and AI enhances actuarial fairness and operational efficiency by enabling real-time risk monitoring, personalized incentives, improved fraud detection, and streamlined claims processing. Evolving data-driven ecosystems, interpretability tools like SHAP are critical for ensuring the transparency, regulatory alignment, and consumer confidence necessary for their adoption.
6.4. Industry Implications
Thailand’s motor insurance landscape is undergoing rapid transformation driven by technological, regulatory, and consumer behavior changes. The adoption of new insurance regulations for electric vehicles (EVs), effective mid-2024, underscores the need for predictive models that are adaptable to emerging risk profiles [2,3,4]. While centered on traditional vehicles, this study offers a modular framework adaptable to EV-specific attributes. Its SHAP-based interpretability meets the rising demand for transparency in digital insurance, especially post-COVID. These explainable models can enhance quote personalization, automated underwriting, and real-time engagement [44]. Additionally, the rise of telematics enables a shift toward usage-based pricing by integrating data on driving behavior, mileage, and time-of-day, thereby improving underwriting accuracy, promoting safe driving, and reducing fraud. As digital ecosystems mature, integrating telematics with interpretable ML models will be essential for developing adaptive, customer-centric solutions [2,3,4,6,12]. Furthermore, the findings of this study provide insurers with actionable insights to implement customer-centric strategies:
- Personalized Pricing: The strong association between renewal probability and features, e.g., car age and premium levels supports dynamic pricing. High-likelihood renewers may receive discounts or bonus coverage, while pricing for higher-risk segments can be adjusted accordingly.
- Loyalty Incentives: Customers with consistent renewal histories may be offered benefits, e.g., premium reductions or extended service packages, strengthening retention and reducing churn.
- Risk-Based Customization: SHAP analysis facilitates tailored underwriting by highlighting impactful features like incurred losses and car group. This enables flexible policy structures that better reflect individual risk levels.
- Digital Communication: Personalized reminders, AI-driven chatbots, and APP-based policy management can improve customer engagement and streamline renewal processes. These channels are increasingly preferred in Thailand’s growing digital economy.
- Regulatory Alignment: Transparent pricing mechanisms and fair underwriting practices, informed by interpretable ML models, can ensure compliance while fostering trust and credibility in the competitive insurance sector.
6.5. Limitation
Although this study demonstrates strong predictive performance using a large, structured Type 1 motor-insurance dataset, certain scope-related considerations remain. The available predictors primarily capture vehicle and financial attributes, while behavioral and telematics-based factors, shown in prior literature to influence renewal decisions, were not accessible. The dataset also reflects only Type 1 voluntary policyholders, meaning renewal dynamics under alternative coverage levels may differ. Furthermore, additional contextual variables, e.g., distribution channels or claim-handling experience, may enhance practical deployment. These considerations suggest valuable avenues for expanding the framework to broader policy types, behavioral indicators, and richer customer-experience data in future work.
7. Conclusions
This study developed a data-driven framework for predicting Type 1 motor-insurance policy renewals in Thailand, combining multiple classification models and structured feature-selection techniques. Among 5 ML algorithms including BLR, KNN, SVM, RF, and XGB, the RF model trained on a reduced four-variable feature set demonstrated the highest overall performance. Using the MDA method under RF, four key predictors were identified: car age, net premium, sum insured, and car group. These variables explained over 93% of the variance in renewal decisions and enabled the model to achieve an AUC of 99.62% and an F1-score of 98.15%. SHAP analysis further revealed that older vehicles, lower premiums, and lower sums insured were strongly associated with higher renewal probabilities, while luxury car segments and higher claim exposure reduced the likelihood of renewal. The findings confirm the importance of financial and risk-related variables, enabling the development of interpretable and efficient tools, e.g., risk-adjusted pricing models and targeted retention campaigns. The framework’s practical scalability ensured by high accuracy with a minimal feature set and its modular design facilitate both immediate implementation and future adaptation for emerging data like electric vehicle attributes and telematics. Future research should extend this work by incorporating telematics and behavioral data with advanced models like deep learning to address evolving market dynamics, e.g., post-COVID trends and wider EV adoption, thereby providing a continually improving tool for customer retention in Thailand.
Author Contributions
Conceptualization, methodology, formal analysis, writing-original draft preparation, project administration, validation, interpretation, P.B. and T.S.; data curation, visualization, investigation, J.Y.; writing-review and editing, X.H. All authors have read and agreed to the published version of the manuscript.
Funding
This work was supported by the Thammasat University Research Unit in Statistical Theory and Applications.
Data Availability Statement
The raw data supporting the conclusions of this article will be made available by the authors on request.
Acknowledgments
The authors gratefully acknowledge the insightful comments and constructive suggestions provided by the anonymous reviewers, which have significantly contributed to the enhancement of this manuscript. Any errors that remain are the sole responsibility of the authors.
Conflicts of Interest
The authors declared no conflicts of interest.
References
- Hosein, P. A data science approach to risk assessment for automobile insurance policies. Int. J. Data Sci. Anal. 2024, 17, 127–138. [Google Scholar] [CrossRef]
- Roojai.com. Exploring the role of emerging technologies and AI in the car insurance industry. 2024.
- Marketeer Online. Forty percent of car owners remain uninsured due to high premium costs. 2024.
- Addict, Ad. 9 key takeaways on the future of car insurance in Thailand. 2025.
- Rustam, Z.; Audia, N.P.A. Support vector machines for classifying policyholders satisfactorily in automobile insurance. J. Phys. Conf. Ser. 2018, 1028, 012005. [Google Scholar] [CrossRef]
- Wang, H.D. Research on the features of car insurance data based on machine learning. Procedia Comput. Sci. 2020, 166, 582–587. [Google Scholar] [CrossRef]
- Hanafy, M.; Ming, R. Machine learning approaches for auto-insurance big data. Risks 2021, 9, 42. [Google Scholar] [CrossRef]
- Saikia, D.; Barua, R.; Gourisaria, M.K.; Bandyopadhyay, A.; Mishra, S.R.; Bilgaiyan, S. Machine learning enhancements for car-insurance claim prediction. In Proceedings of the Proceedings of the 15th International Conference on Computing, Communication and Networking Technologies, 2024; pp. 1–6. [Google Scholar]
- Logeswaran, K.; Savitha, S.; Harshan, A.S.S.; Suganraj, S.; Kumar, M.D.; Kumar, K.R.P.; Gunasekar, M.; Rajdevi, R. Machine-learning-driven precise automobile-insurance claim predictions. In Proceedings of the Proceedings of the 15th International Conference on Soft Computing and Pattern Recognition, 2025; pp. 125–133. [Google Scholar]
- Kiyosov, S. Predictive analytics in automotive insurance for financial risk mitigation. In AI’s Role in Enhanced Automotive Safety; IGI Global, 2025; pp. 423–436. [Google Scholar]
- England, R.; Owadally, I.; Wright, D. An agent-based model of motor-insurance customer behaviour in the UK with word of mouth. J. Artif. Soc. Soc. Simul. 2022. [Google Scholar] [CrossRef]
- Wang, J.; Xiao, J.; Mei, B. Insurance renewal probability model based on a deep-learning algorithm. In Proceedings of the Proceedings of the Asia-Pacific Conference on Image Processing, Electronics and Computers, 2020; pp. 252–256. [Google Scholar]
- Segura-Gisbert, J.; Lledó, J.; Pavía, J.M. Dataset of an actual motor-vehicle insurance portfolio. European Actuarial J. 2025, 15, 241–253. [Google Scholar] [CrossRef]
- Guillén, M. Econometrics of insurance based on telematics information and machine learning. In Handbook of Insurance; Dionne, G., Ed.; Springer: Cham, 2025. [Google Scholar]
- Cesarini, M.; Brentegani, E.; Ceci, G.; Cerreta, F.; Messina, D.; Petrarca, F.; Robutti, M. Usage of the Kullback–Leibler divergence on posterior Dirichlet distributions to create a training dataset for a learning algorithm to classify driving behaviour events. Journal of Computational Mathematics and Data Science 2023, 8, 100081. [Google Scholar] [CrossRef]
- Simmachan, T.; Boonkrong, P. A Comparison of Count and Zero-Inflated Regression Models for Predicting Claim Frequencies in Thai Automobile Insurance. Lobachevskii Journal of Mathematics 2024, 45, 6400–6414. [Google Scholar] [CrossRef]
- Panibratov, R. Decision support system for estimating and forecasting state of insurance company. Syst. Res. Inf. Technol. 2022, 2022, 61–72. [Google Scholar] [CrossRef]
- Money, Priceza. Which car-insurance company is best in 2025, 2025. June 2025.
- Thai General Insurance Association (TGIA). Member company list. 2025.
- Aas, K.; Jullum, M.; Løland, A. Explaining individual predictions when features are dependent: more accurate approximations to Shapley values. Artif. Intell. 2021, 298, 103502. [Google Scholar] [CrossRef]
- Taha, A.; Cosgrave, B.; McKeever, S. Using feature selection with machine learning for generation of insurance insights. Appl. Sci. 2022, 12, 3209. [Google Scholar] [CrossRef]
- Owolabi, T.; Shahra, E.Q.; Basurra, S. Auto-insurance fraud detection using machine-learning classification models. In Proceedings of the Proceedings of the International Congress on Information and Communication Technology, 2023; pp. 503–513. [Google Scholar]
- Simmachan, T.; Wongsai, S.; Lerdsuwansri, R.; Boonkrong, P. Impact of COVID-19 pandemic on road-traffic accident severity in Thailand: an application of K-nearest-neighbor algorithm with feature-selection techniques. Thailand Stat. 2025, 23, 129–143. [Google Scholar]
- Spiteri, M.; Azzopardi, G. Customer churn prediction for a motor insurance company. In Proceedings of the 2018 Thirteenth international conference on digital information management (ICDIM), 2018; IEEE; pp. 173–178. [Google Scholar]
- Huang, Y.; Meng, S. Automobile insurance classification ratemaking based on telematics driving data. Decision Support Systems 2019, 127, 113156. [Google Scholar] [CrossRef]
- Abdelhadi, S.; Elbahnasy, K.; Abdelsalam, M. A proposed model to predict auto insurance claims using machine learning techniques. Journal of Theoretical and Applied Information Technology 2020, 98, 3428–3437. [Google Scholar]
- Wang, H.D. Research on the features of car insurance data based on machine learning. Procedia Computer Science 2020, 166, 582–587. [Google Scholar] [CrossRef]
- Gao, G.; Wang, H.; Wüthrich, M.V. Boosting Poisson regression models with telematics car driving data. Machine Learning 2022, 111, 243–272. [Google Scholar] [CrossRef]
- Strada, S.; Costantini, E.; Formentin, S.; Savaresi, S.M. Machine learning based car accident risk prediction for usage-based insurance. Intelligent Data Analysis 2025, 29, 156–170. [Google Scholar] [CrossRef]
- Staudt, Y.; Wagner, J. Assessing the performance of random forests for modeling claim severity in collision car insurance. Risks 2021, 9, 53. [Google Scholar] [CrossRef]
- Byrne, A. Pricing Risk: An XAI Analysis of Irish Car Insurance Premiums. In Proceedings of the World Conference on Explainable Artificial Intelligence, 2024; Springer; pp. 315–330. [Google Scholar]
- Ding, N.; Ruan, X.; Wang, H.; Liu, Y. Automobile insurance fraud detection based on PSO-XGBoost model and interpretable machine learning method. Insurance: Mathematics and Economics 2025, 120, 51–60. [Google Scholar] [CrossRef]
- Deng, Y.; He, J.; Li, B.; Shen, X. Does air pollution cause more car accidents? Evidence from auto insurance claims. China Economic Review 2024, 88, 102261. [Google Scholar] [CrossRef]
- Poufinas, T.; Gogas, P.; Papadimitriou, T.; Zaganidis, E. Machine learning in forecasting motor insurance claims. Risks 2023, 11, 164. [Google Scholar] [CrossRef]
- Seyam, E.A. Predicting motor insurance claim incidence using generalized and tree-based models: A comparative statistical approach. Insurance Markets and Companies 2025, 16, 38. [Google Scholar] [CrossRef]
- Dali, A.; Bane, J.; Badhe, N.; Sonkusare, R. Car-accident insurance-claim verification with deep learning. In Proceedings of the Proceedings of the 1st International Conference on Pioneering Developments in Computer Science & Digital Technologies, 2024; pp. 1–6. [Google Scholar]
- Boonkrong, P.; Simmachan, T. Does data balancing play an important role in classifying road-accident severity in Thailand? In Proceedings of the Proceedings of ECTI DAMT & NCON, 2025; pp. 359–364. [Google Scholar]
- Boonkrong, P.; Simmachan, T.; Sittimongkol, R.; Lerdsuwansri, R. Data-Driven Approach in Provincial Clustering for Sustainable Tourism Management in Thailand. Thailand Statistician 2025, 23, 481–500. [Google Scholar]
- Simmachan, T.; Boonkrong, P. Effect of resampling techniques on machine-learning models for classifying road-accident severity in Thailand. J. Curr. Sci. Technol. 2025, 15, 99–99. [Google Scholar] [CrossRef]
- Rainio, O.; Teuho, J.; Klén, R. Evaluation metrics and statistical tests for machine learning. Scientific Reports 2024, 14, 6086. [Google Scholar] [CrossRef]
- Wang, H.; Liang, Q.; Hancock, J.T.; Khoshgoftaar, T.M. Feature-selection strategies: a comparative analysis of SHAP-value and importance-based methods. J. Big Data 2024, 11, 44. [Google Scholar] [CrossRef]
- Salih, A.M.; Raisi-Estabragh, Z.; Galazzo, I.B.; Radeva, P.; Petersen, S.E.; Lekadir, K.; Menegaz, G. A perspective on explainable artificial-intelligence methods: SHAP and LIME. Adv. Intell. Syst. 2025, 7, 2400304. [Google Scholar] [CrossRef]
- Simmachan, T.; Lerdpraserdpakorn, N.; Deesrisu, J.; Sriwipat, C.; Shakya, S.; Boonkrong, P. A penalized regression and machine learning approach for quality-of-life prediction in psoriasis patients. Healthcare Analytics 2025, 100417. [Google Scholar] [CrossRef]
- Ortega, M.; Quintanilla, J.; Ong, E.R.; Ramos, R.M.; Trinidad, C.J. Asfalis: a web-based system for customer-retention strategies optimisation of a car-insurance company using cohort and churn analysis. In Proceedings of the Proceedings of the International Conference on Inventive Computation Technologies, 2023; pp. 1065–1072. [Google Scholar]
Figure 1.
Methodological framework for interpretable motor-insurance renewal prediction.
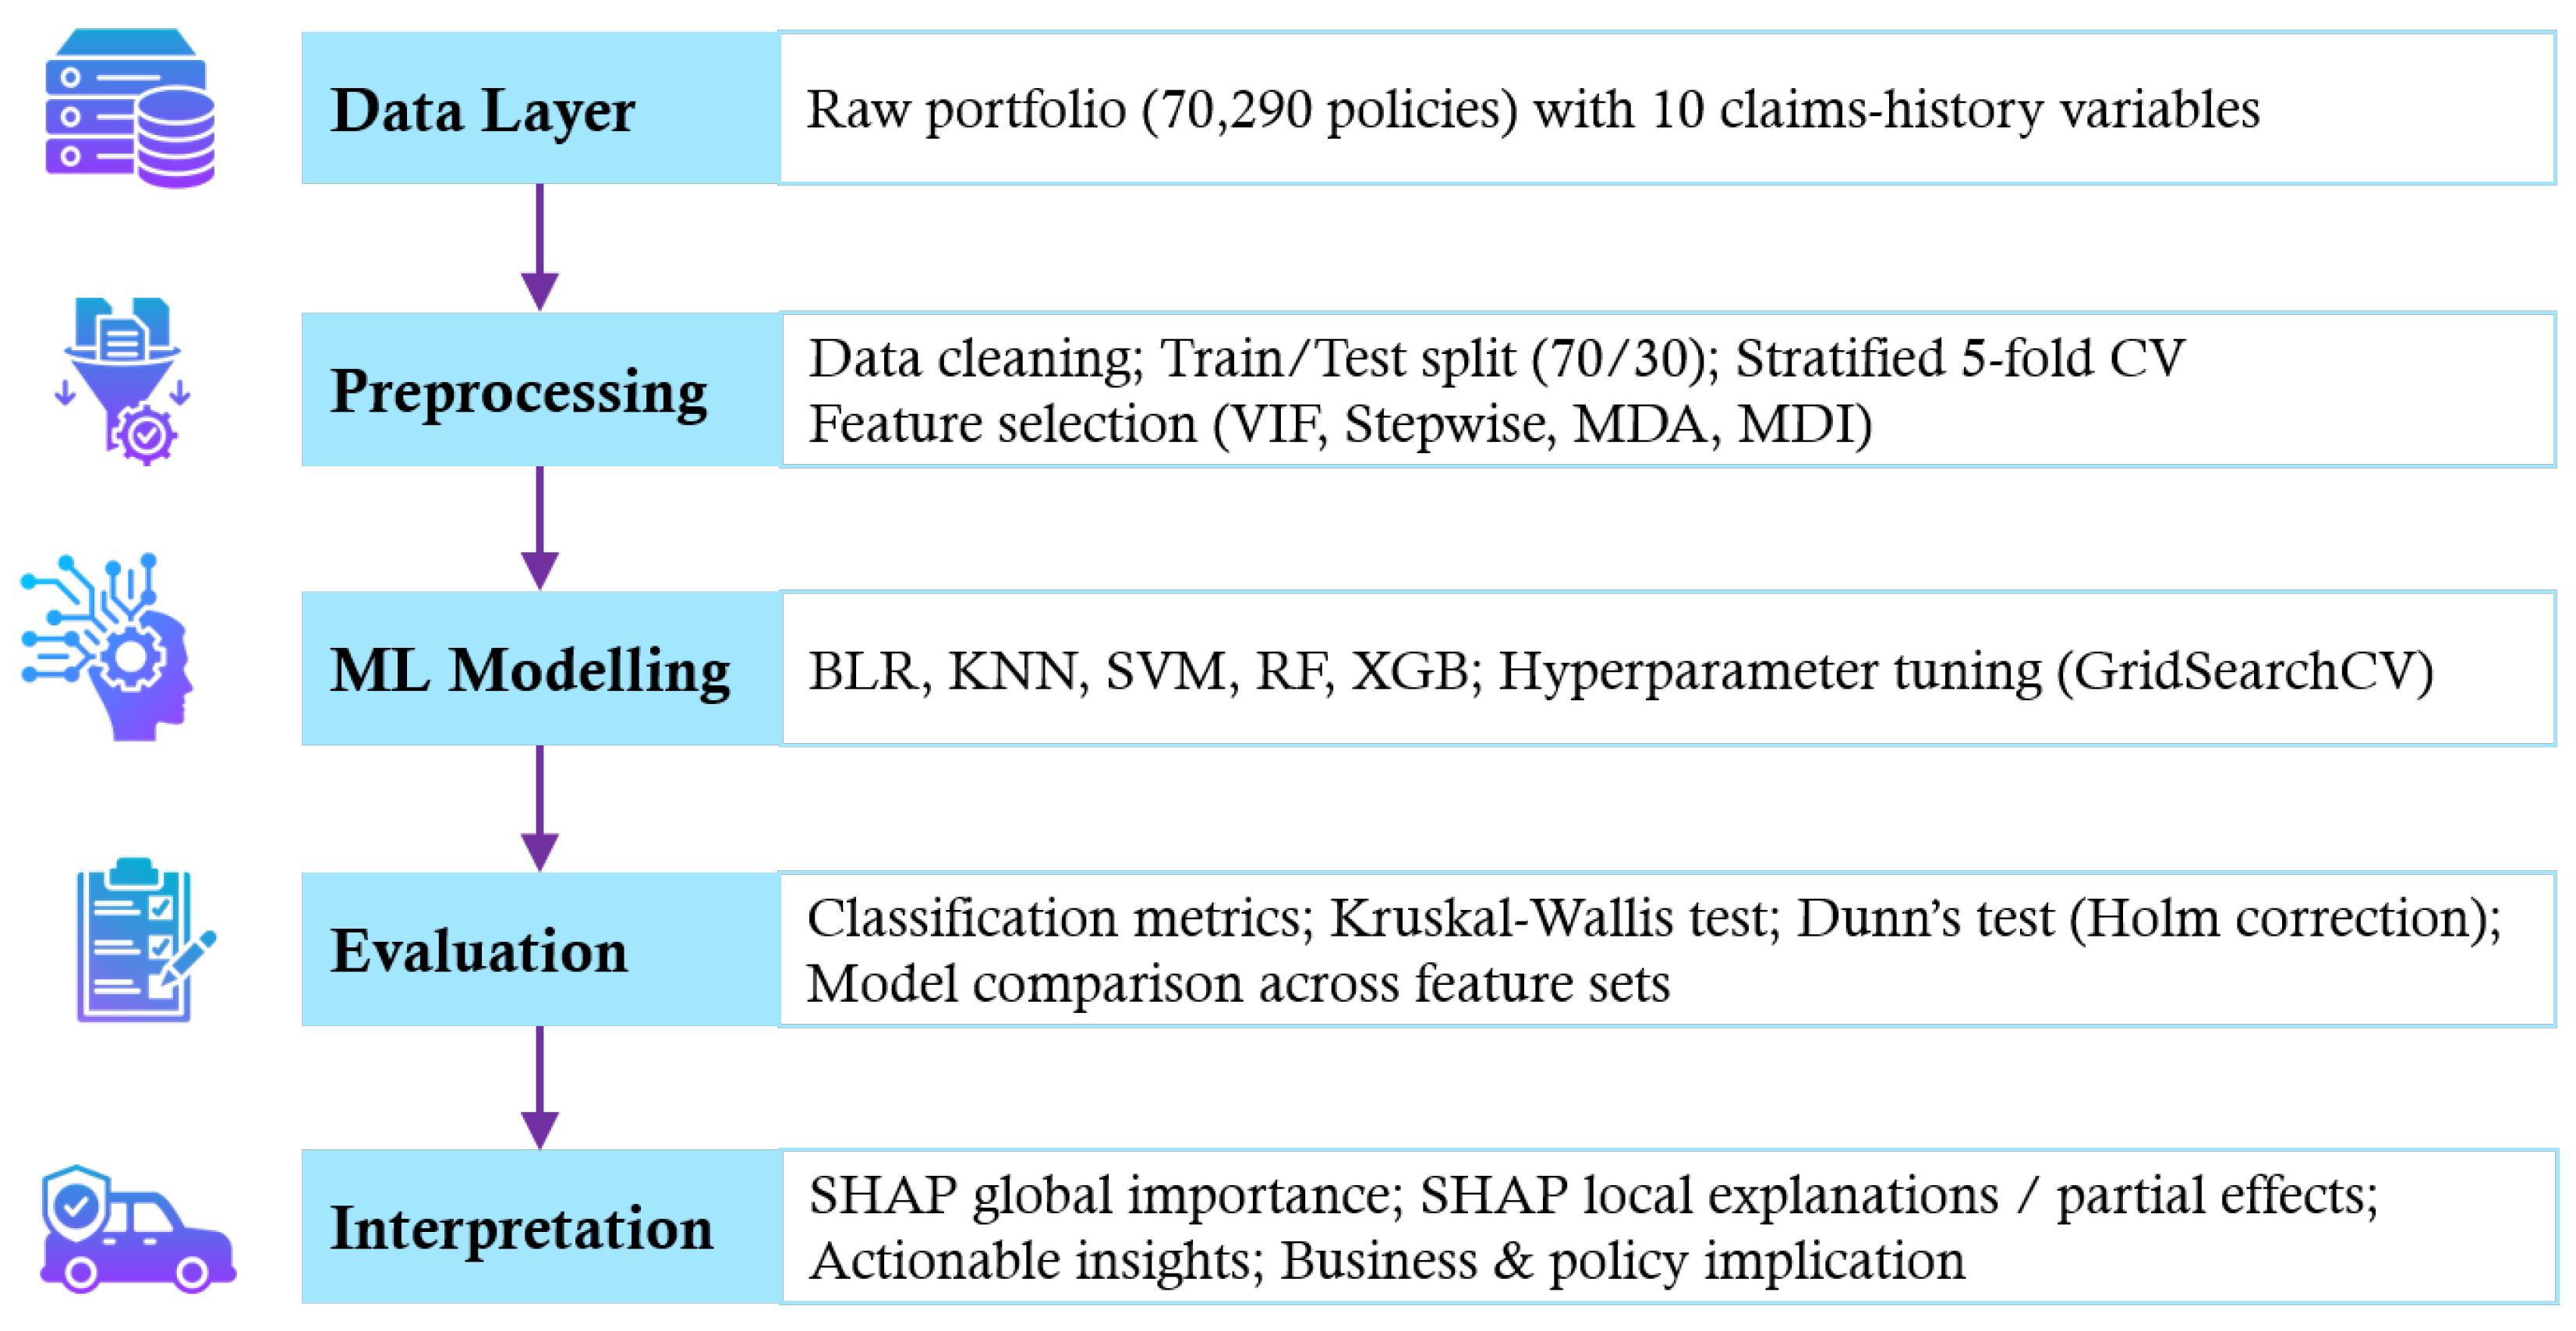
Figure 2.
The statistical association measure among 10 features for motor-insurance renewal.
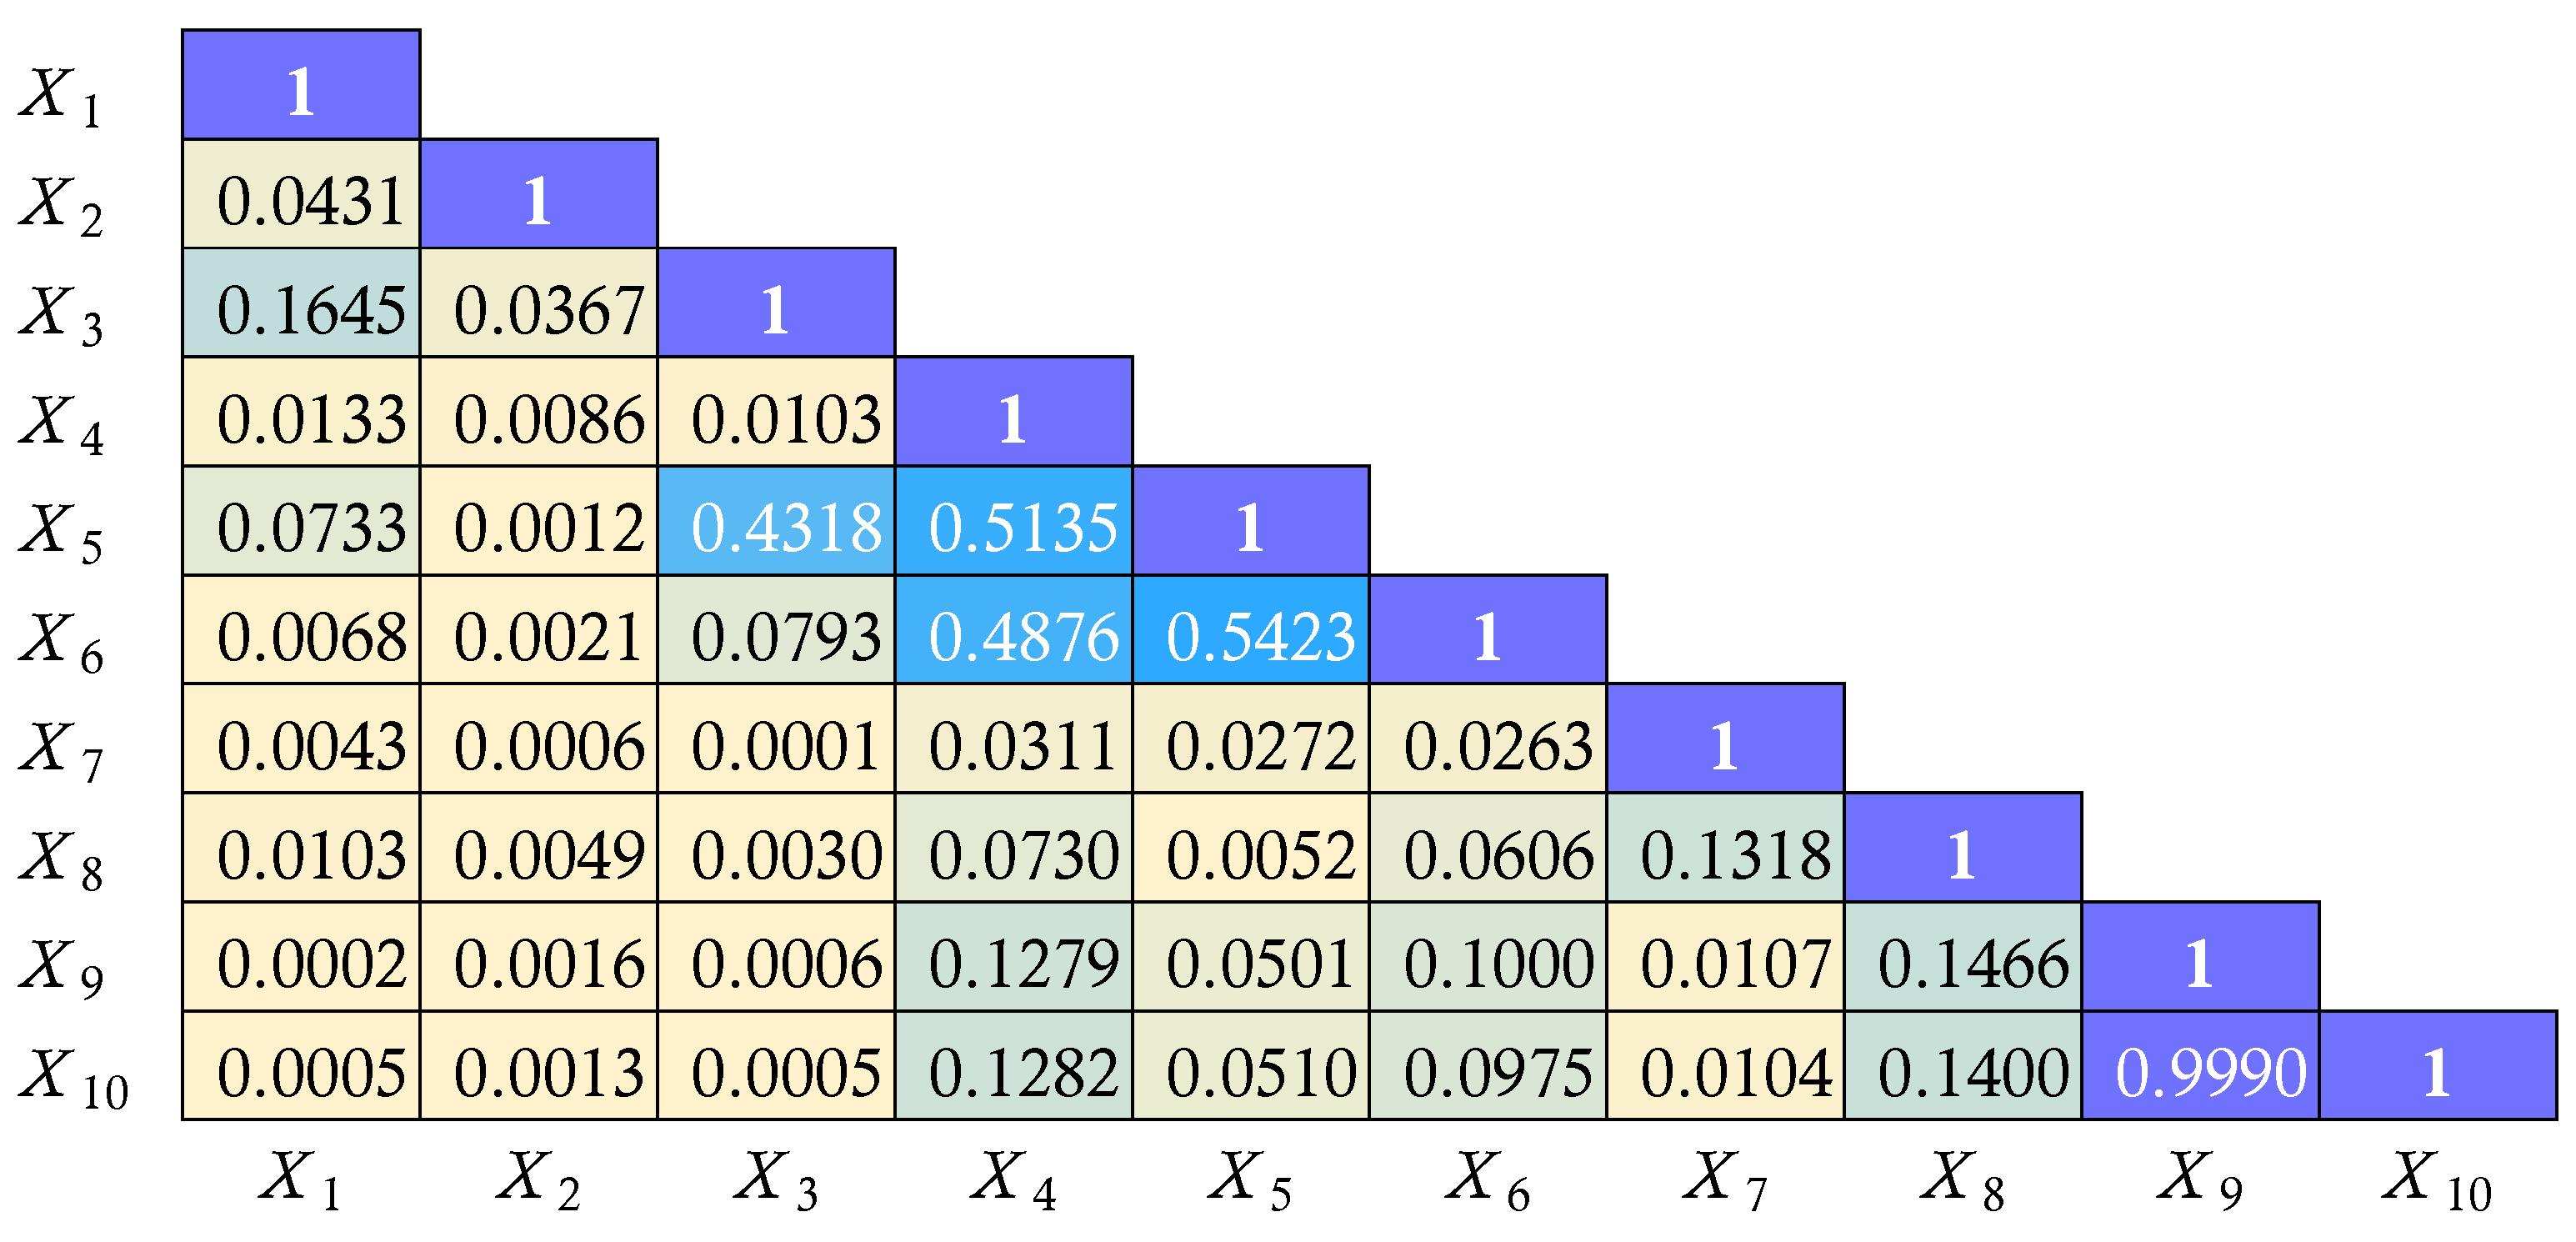
Figure 3.
Comparison of ROC/AUC and precision-recall curves from three example classifiers for 10 (left) and 4 features (right).
Figure 3.
Comparison of ROC/AUC and precision-recall curves from three example classifiers for 10 (left) and 4 features (right).
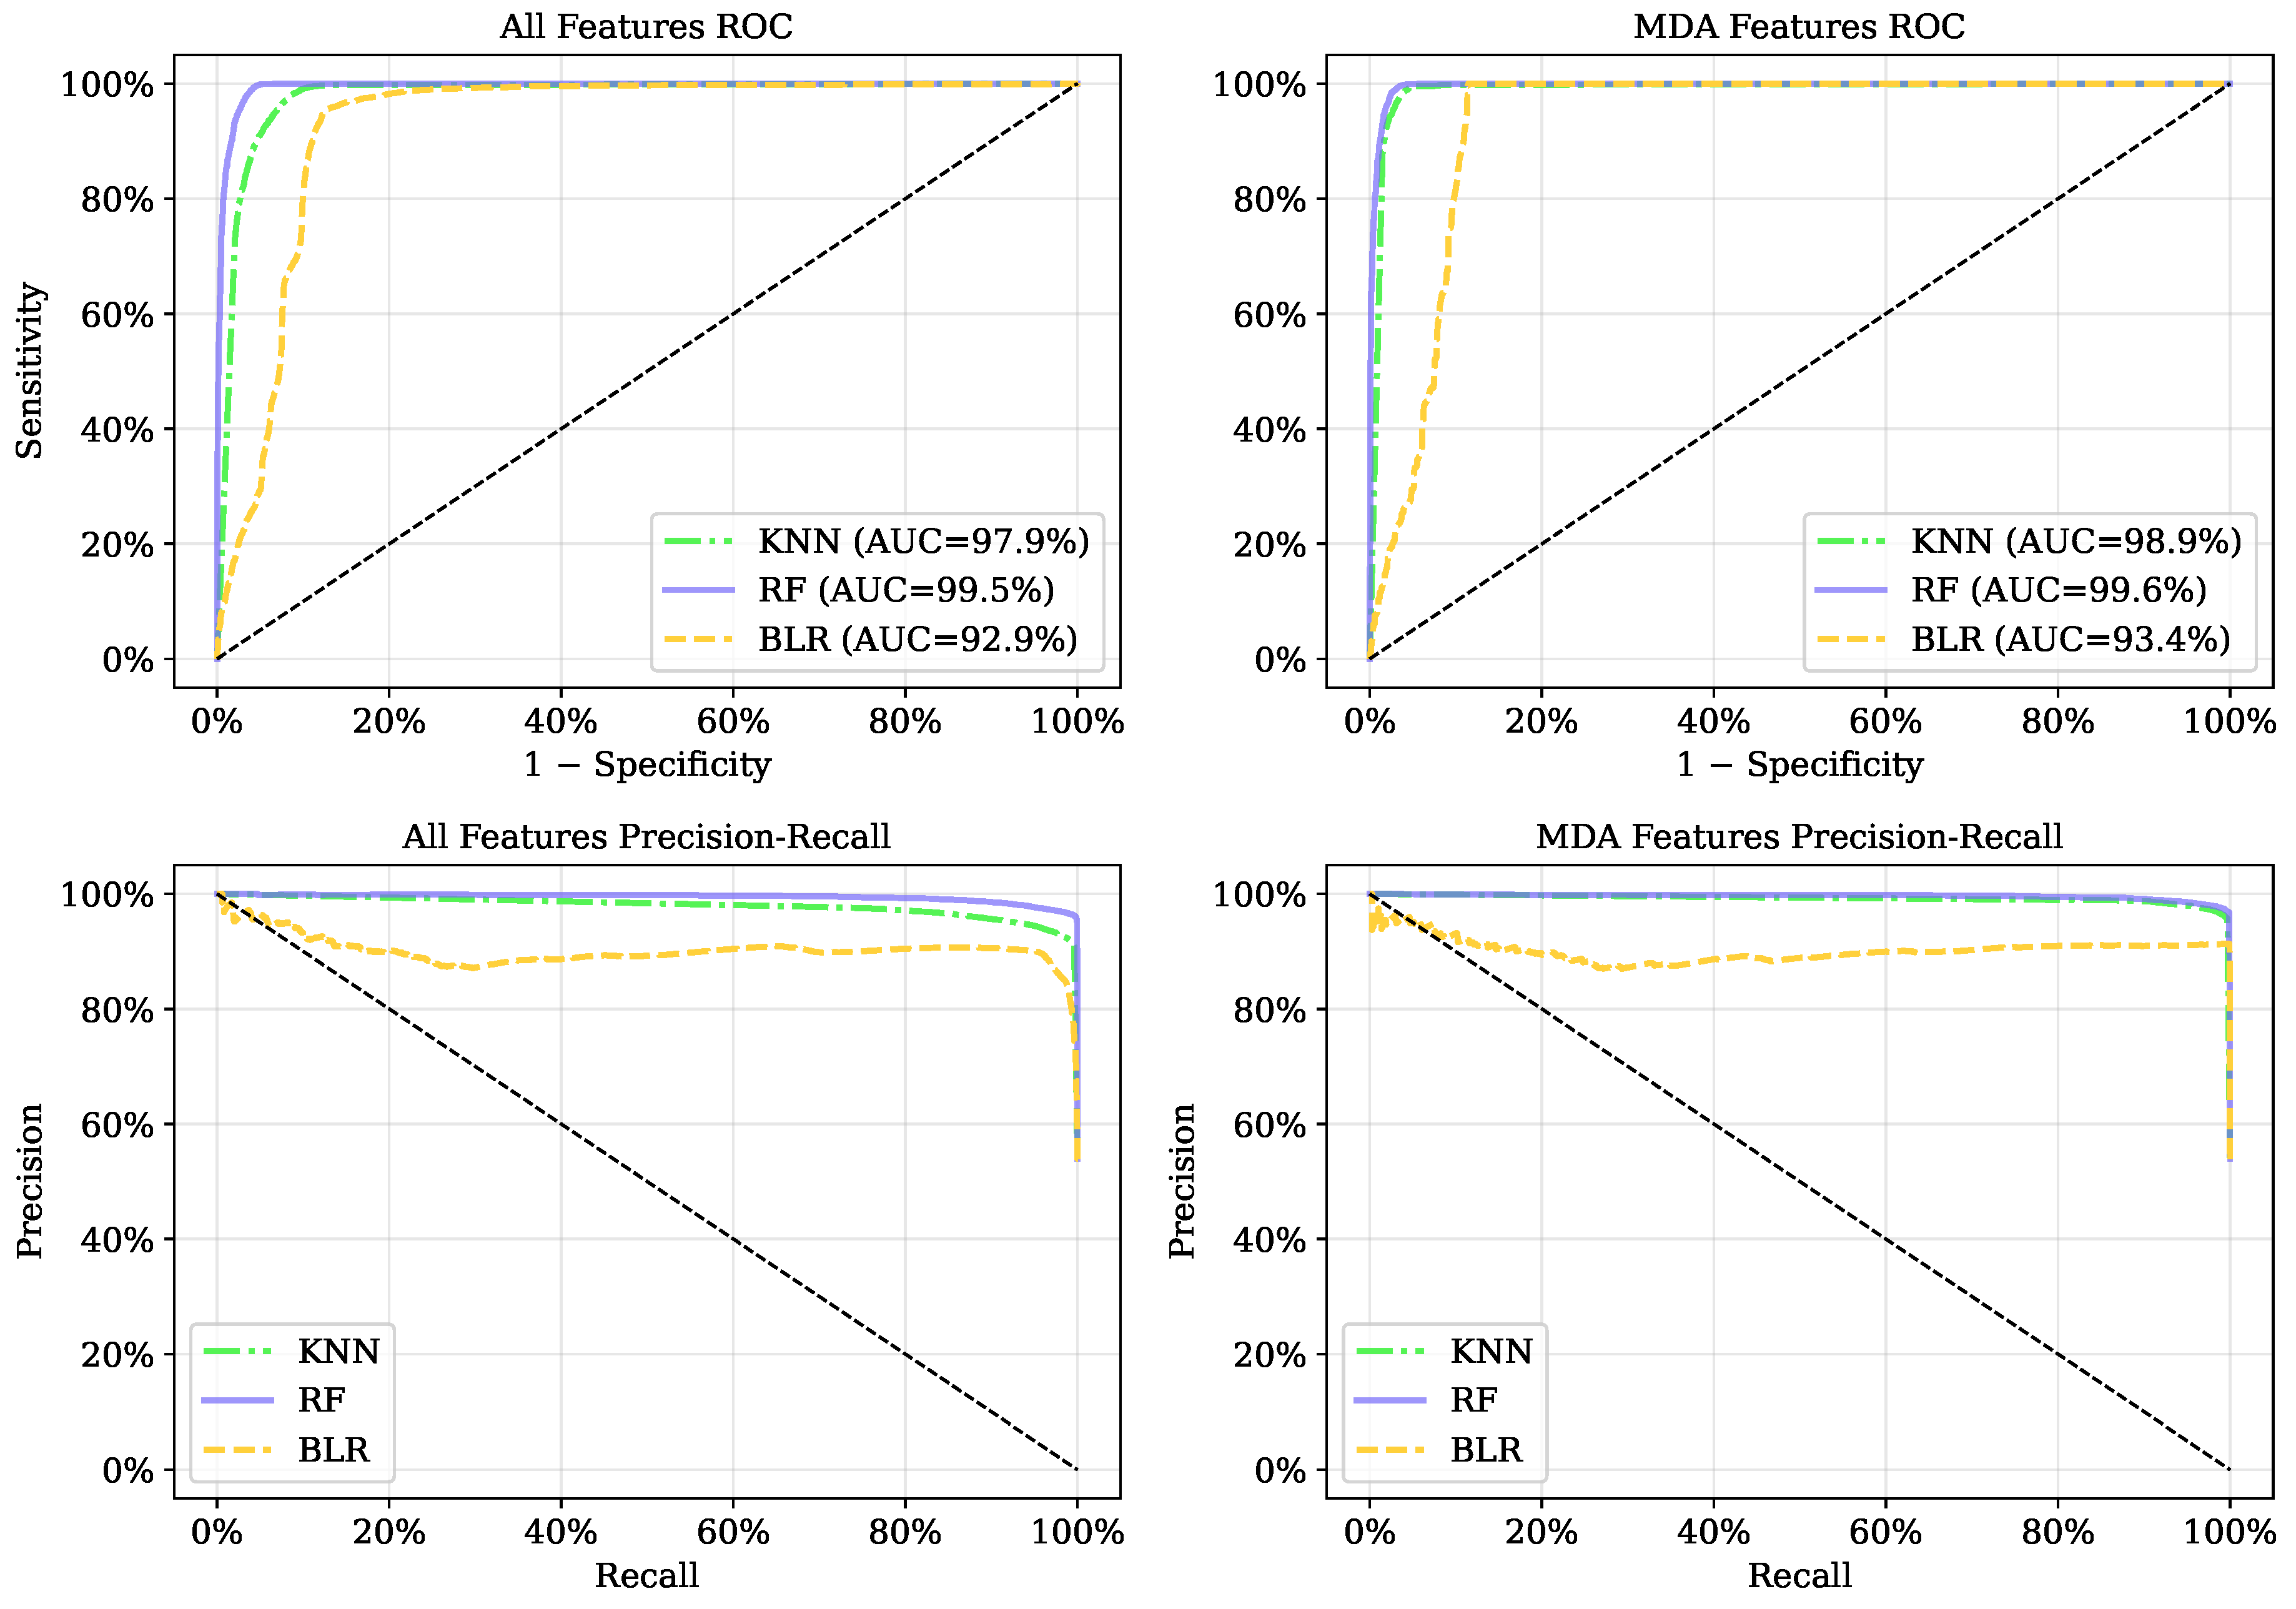
Figure 4.
SHAP summary plots of ranking factors and impacts of features: XGB (10 features) and RF (4 features).
Figure 4.
SHAP summary plots of ranking factors and impacts of features: XGB (10 features) and RF (4 features).
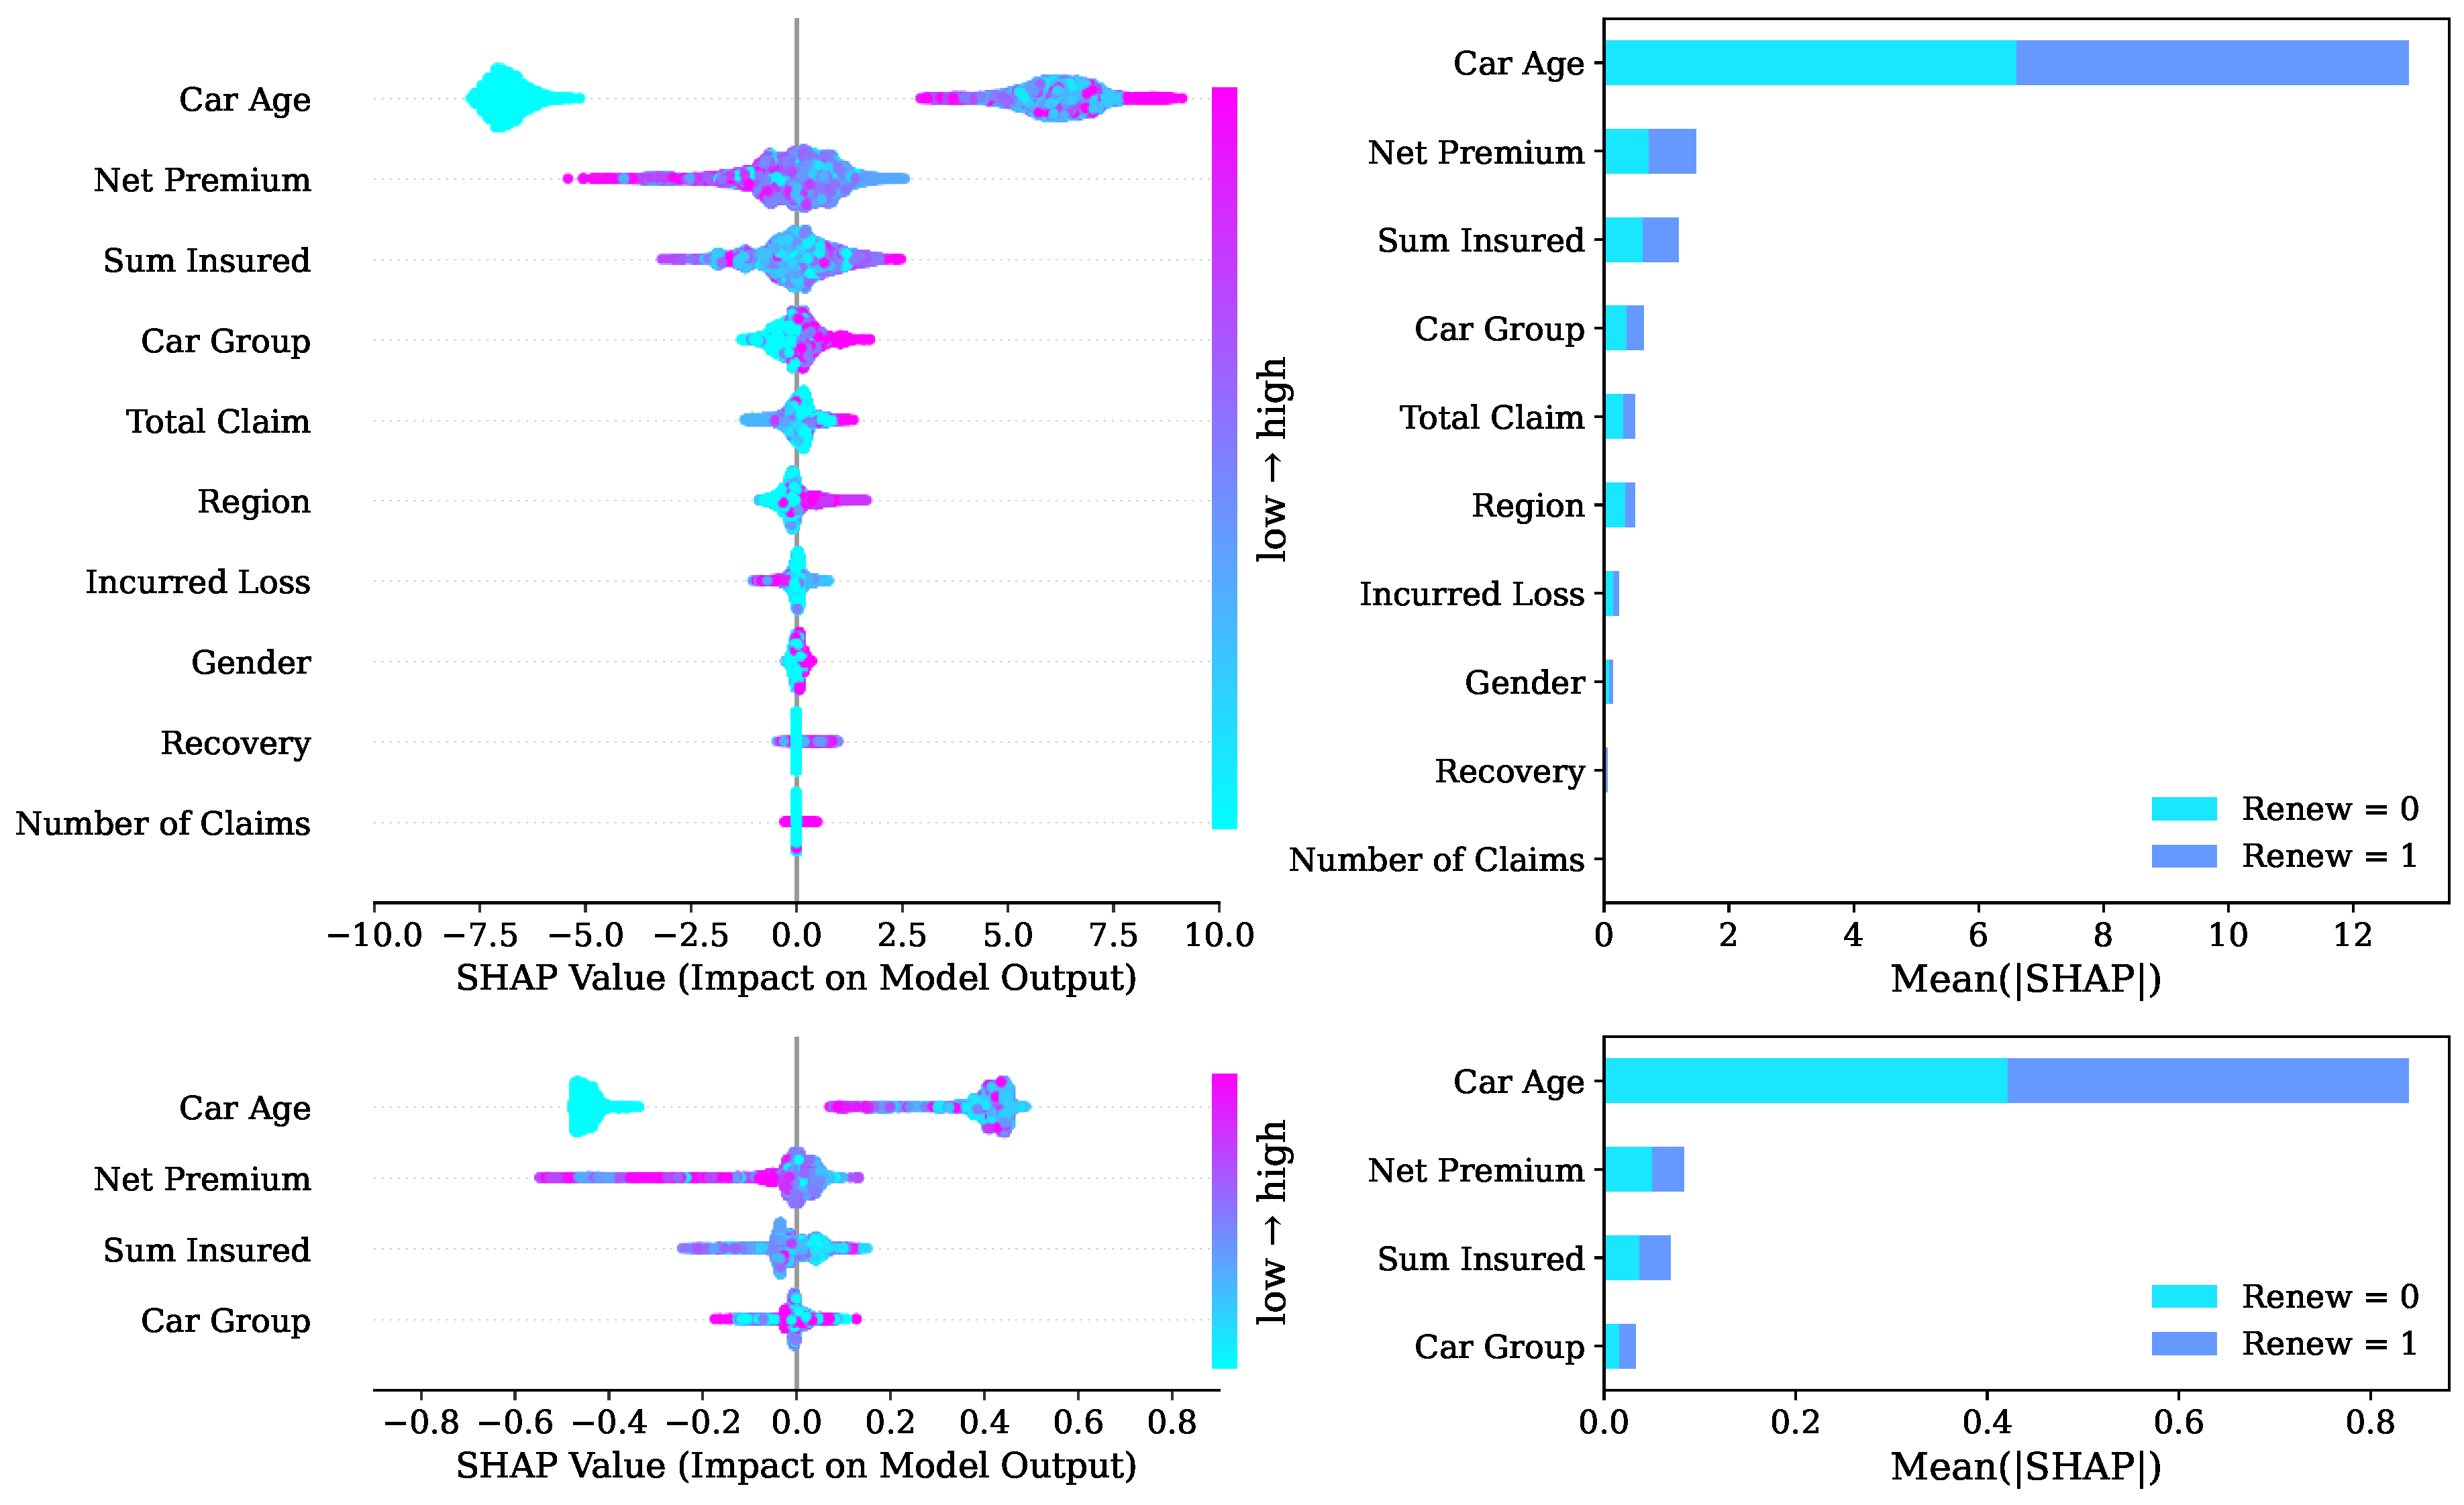
Figure 5.
Individual effect of top 4 features including car age, net premium, sum insured and car groups
Figure 5.
Individual effect of top 4 features including car age, net premium, sum insured and car groups
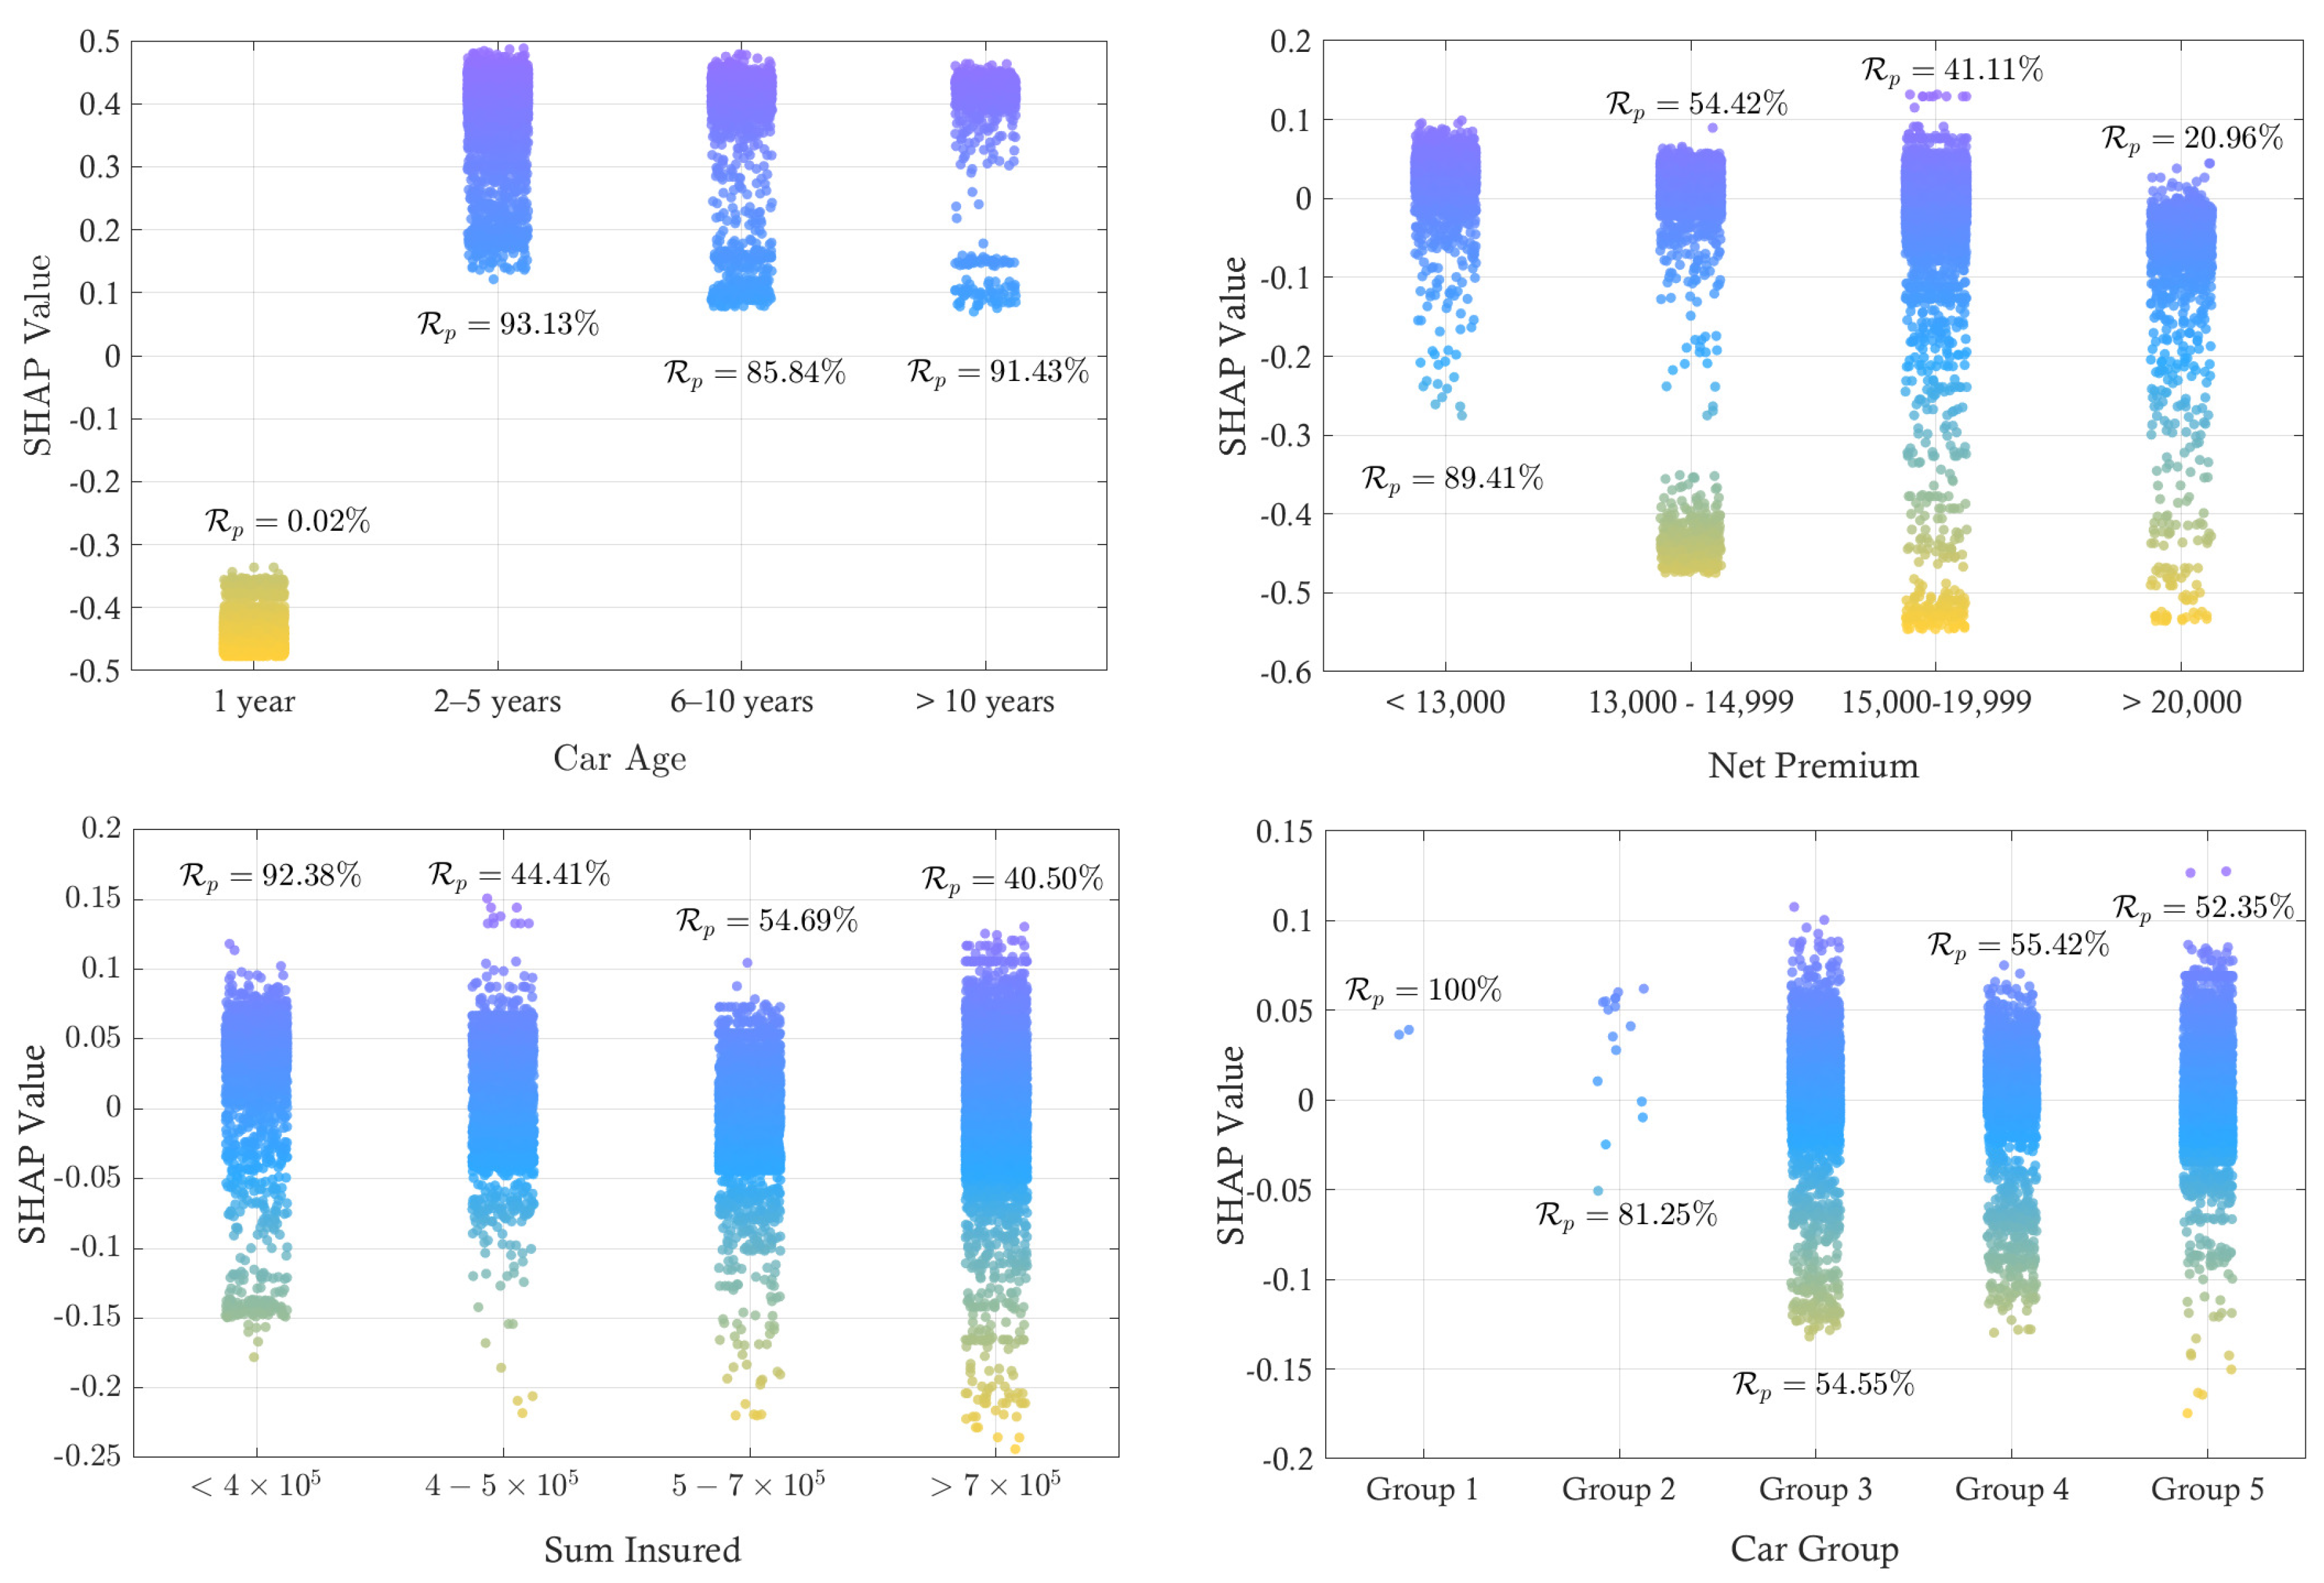

Table 1.
Comparative review of prior studies on motor-insurance analytics and risk modeling from 2018 - 2025.
Table 1.
Comparative review of prior studies on motor-insurance analytics and risk modeling from 2018 - 2025.
| Author (year) | Samples | Objectives | Response | ML Model | Feature | Interpretation |
|---|---|---|---|---|---|---|
| Spiteri & Azzopardi (2018) [24] | 72,445 | To identify risk factors associated with motor-insurance customer churn; classify churners vs non-churners; and model time-to-churn | Renew (Y/N) | DTs, Naive Bayes, BLR, SVM, RF, Cox Survival Analysis | NA | Boruta; information gain; RFE; Survival curves; Hazard ratios |
| Huang & Meng (2019) [25] | 2,065 | To build a UBI (Usage-Based Insurance) classification ratemaking framework | Accident (Y/N); Claim frequency (Count) | BLR, SVM, RF, XGB, ANN | Wrapper | Relative risk contribution |
| Abdelhadi et al. (2020) [26] | 30,240 | To build accurate ML model for auto-claim prediction properly handle missing data | Claim (Y/N) | XGBoost, J48, ANN, Naïve Bayes | NA | NA |
| Wang (2020) [27] | 65,535 | To identify key features influencing auto-insurance renewal | Renew (Y/N) | RF, GBDT, LightGBM | Domain knowledge, VIF | MDI, NCD |
| Gao et al. (2021) [28] | 973 | To integrate telematics driving-behavior data for claim frequency prediction; To evaluate whether neural-network-based feature extraction improves Poisson regression models. | Claim frequency (Count) | Poisson, DNN, CNN, CANN | AIC-based | Heatmap from CNN |
| Staudt & Wagner (2021) [30] | 81,309 | To compare prediction performance of various models for claim severity in collision car insurance; To assess the impact of log-normal transformation versus modeling severity on the natural scale. | Claim severity (Con.) | GAM, GLM, RF | BIC-based, Evolutionary trees, Fisher-Jenks | GOL statistics, Partial effect plots, Spatial effect maps |
| Poufinas et al. (2023) [34] | 48 | To forecast mean motor-insurance claim cost per insured car per quarter | Mean claim cost per car (Con.) | DTs, SVM, RF, XGB | MDI | MDI |
| Byrne (2024) [31] | 39,849 | To identify the key factors determining Irish car insurance premiums; To evaluate whether gender, ethnicity, location, and occupation introduce pricing bias. | Quoted car insurance premium (Con.) | LLR, RF | SHAP, AVTS | SHAP |
| Deng et al. (2024) [33] | 262,625 | To examine how air pollution (PM2.5) affects the probability and number of traffic accidents. | Accident (Y/N); Claim frequency (Count) | Fixed-effects regression, quantile regression | NA | Causal interpretation |
| Simmachan & Boonkrong (2024) [16] | 3,036 | To compare GLM models for predicting automobile insurance claim frequencies; To identify influential risk factors. | Claim frequency (Count) | Poisson, NB, CMP, ZIP, ZINB, ZICMP | Wald test | Odd ratios |
| Strada et al. (2025) [29] | ≈ 100,000 | To build an accident-risk prediction model for Usage-Based Insurance (UBI) using only GPS-based telematics driving data; To design innovative static/dynamic features capturing driving behavior. | Accident (Y/N) | Cost-Sensitive, Gradient Boosting, Platt Scaling | Regularization | MDI, RFE |
| Ding et al. (2025) [32] | 11,565 | To improve auto-insurance fraud detection using PSO-optimized XGBoost and provide interpretable insights | Renew (Y/N) | PSO-XGBoost, SVM, NB, LR, BP, DT, RF | NA | SHAP |
| Seyam et al. (2025) [35] | 108,699 | To predict motor insurance claim incidence | Claim frequency (Count) | Poisson, CART, GAM | NA | GLM coefficients; Tree splits; GAM smooth functions |
| Present Study | 70, 290 | To identify the most influential risk factors affecting renewal; To derive explainable renewal insights | Renew (Y/N) | BLR, KNN, SVM, RF, XGB | Wald test, VIF, MDA, MDI | SHAP, Partial effect plots |
Table 2.
Descriptive statistics of categorical features.
| Feature | Category | Renewed | Not Renewed | Total Cases | (%) |
|---|---|---|---|---|---|
| : Gender | Male | 17,467 | 14,216 | 31,683 | 55.13 |
| Female | 20,462 | 18,145 | 38,607 | 53.00 | |
| : Region | Central | 21,384 | 16,375 | 37,759 | 56.63 |
| North | 2,917 | 3,379 | 6,296 | 46.33 | |
| South | 3,850 | 3,201 | 7,051 | 54.60 | |
| East | 1,403 | 868 | 2,271 | 61.78 | |
| West | 2,019 | 1,281 | 3,300 | 61.18 | |
| Northeast | 6,356 | 7,257 | 13,613 | 46.69 | |
| : Car Group | Group 01 | 3 | 2 | 5 | 60.00 |
| Group 02 | 56 | 15 | 71 | 78.87 | |
| Group 03 | 16,772 | 14,005 | 30,777 | 54.50 | |
| Group 04 | 8,905 | 7,029 | 15,934 | 55.89 | |
| Group 05 | 12,193 | 11,310 | 23,503 | 51.88 |
Table 3.
Descriptive statistics of continuous features.
| Feature | Y | Min | Max | Mean | SD | Median | IQR |
|---|---|---|---|---|---|---|---|
| : Car Age | 1 | 1.00 | 17.00 | 4.99 | 3.30 | 2.00 | 3.00 |
| (Years) | 0 | 1.00 | 15.00 | 1.53 | 1.80 | 1.00 | 0.00 |
| : Sum Insured | 1 | 130,000.00 | 3,900,000.00 | 585,612.06 | 288,700.11 | 360,000.00 | 230,000.00 |
| (THB) | 0 | 100,000.00 | 6,000,000.00 | 750,076.60 | 303,332.45 | 490,000.00 | 190,000.00 |
| : Net Premium | 1 | 0.00 | 101,900.00 | 14,281.60 | 3,954.50 | 12,315.00 | 1,793.00 |
| (THB) | 0 | 0.00 | 107,163.00 | 16,895.73 | 3,721.89 | 14,900.00 | 2,416.00 |
| : Recovery | 1 | 0.00 | 846,000.00 | 582.50 | 7,902.65 | 0.00 | 0.00 |
| (THB) | 0 | 0.00 | 830,000.00 | 1,319.35 | 14,128.08 | 0.00 | 0.00 |
| : No. of Claims | 1 | 0.00 | 21.00 | 0.13 | 0.76 | 0.00 | 0.00 |
| (Times) | 0 | 0.00 | 22.00 | 0.26 | 0.99 | 0.00 | 0.00 |
| : Total Claim | 1 | 0.00 | 1,576,874.25 | 12,183.65 | 36,754.03 | 0.00 | 10,755.05 |
| (THB) | 0 | 0.00 | 1,470,971.00 | 23,582.26 | 54,594.44 | 2,116.50 | 13,591.35 |
| : Incurred Loss | 1 | 0.00 | 1,576,874.25 | 11,744.48 | 36,053.22 | 0.00 | 10,657.15 |
| (THB) | 0 | 0.00 | 1,470,971.00 | 23,139.78 | 54,244.72 | 2,076.25 | 13,409.35 |
Table 4.
Comparative importance of candidate predictors across six feature-selection techniques
| Features | VIF | Stepwise | MDA_RF | MDA_XGB | MDI_RF | MDI_XGB |
|---|---|---|---|---|---|---|
| : Gender | 1.0301 | -0.0216 | -0.0014 | -0.0003 | 0.0032 | 0.0049 |
| : Region | 1.0195 | -0.0881 | -0.0013 | 0.0001 | 0.0072 | 0.0078 |
| : Car Group | 1.2379 | -0.1641 | 0.0075 | 0.0083 | 0.0127 | 0.0272 |
| : Car Age | 1.5318 | 2.7831 | 0.4575 | 0.4579 | 0.6500 | 0.8704 |
| : Sum Insured | 1.9278 | 0.1431 | 0.0087 | 0.0143 | 0.0950 | 0.0132 |
| : Net Premium | 1.5793 | -0.3620 | 0.0384 | 0.0399 | 0.1392 | 0.0563 |
| : Recovery | 1.0190 | -0.0255 | -0.0001 | 0.0000 | 0.0017 | 0.0041 |
| : No. of Claims | 1.0718 | -0.0532 | -0.0002 | 0.0000 | 0.0015 | 0.0044 |
| : Total Claim | 524.2451 | 1.5929 | -0.0024 | 0.0015 | 0.0389 | 0.0063 |
| : Incurred Loss | 523.0414 | -1.6888 | -0.0022 | 0.0008 | 0.0505 | 0.0053 |
| No. of Features | 9 | 8 | 4 | 5 | 10 | 10 |
Table 5.
Model evaluation (%) across 5 different classifiers and 5 feature selection techniques (25 scenarios).
Table 5.
Model evaluation (%) across 5 different classifiers and 5 feature selection techniques (25 scenarios).
| Feature Selection | Classifier | Accuracy | Precision | Recall | F1-Score | AUC |
|---|---|---|---|---|---|---|
| All/ MDI | BLR | 85.56 | 85.69 | 85.87 | 85.55 | 92.95 |
| SVM | 91.37 | 91.39 | 91.24 | 91.31 | 93.67 | |
| KNN | 94.76 | 94.97 | 94.55 | 94.71 | 97.91 | |
| RF | 97.71 | 97.90 | 97.55 | 97.69 | 99.48 | |
| XGB | 97.73 | 97.84 | 97.61 | 97.71 | 99.48 | |
| Filter/ VIF | BLR | 85.45 | 85.55 | 85.78 | 85.43 | 92.98 |
| SVM | 91.26 | 91.30 | 91.09 | 91.18 | 93.43 | |
| KNN | 95.12 | 95.34 | 94.90 | 95.07 | 98.08 | |
| RF | 97.87 | 98.05 | 97.71 | 97.85 | 99.55 | |
| XGB | 97.69 | 97.81 | 97.56 | 97.67 | 99.56 | |
| Stepwise | BLR | 85.60 | 85.72 | 85.92 | 85.59 | 93.06 |
| SVM | 92.19 | 92.35 | 91.97 | 92.11 | 93.49 | |
| KNN | 95.48 | 95.61 | 95.32 | 95.44 | 98.43 | |
| RF | 97.64 | 97.88 | 97.45 | 97.62 | 99.44 | |
| XGB | 97.66 | 97.78 | 97.54 | 97.64 | 99.55 | |
| MDA_RF | BLR | 89.47 | 89.39 | 89.45 | 89.41 | 93.41 |
| SVM | 94.50 | 95.25 | 94.06 | 94.40 | 93.36 | |
| KNN | 97.21 | 97.23 | 97.15 | 97.19 | 98.93 | |
| RF | 98.17 | 98.29 | 98.05 | 98.15 | 99.62 | |
| XGB | 97.78 | 97.90 | 97.66 | 97.76 | 99.54 | |
| MDA_XGB | BLR | 92.34 | 92.51 | 92.13 | 92.27 | 93.72 |
| SVM | 94.69 | 95.37 | 94.31 | 94.61 | 93.66 | |
| KNN | 96.66 | 96.70 | 96.59 | 96.64 | 98.83 | |
| RF | 97.97 | 98.11 | 97.84 | 97.95 | 99.57 | |
| XGB | 97.89 | 98.01 | 97.77 | 97.87 | 99.53 |
Disclaimer/Publisher’s Note: The statements, opinions and data contained in all publications are solely those of the individual author(s) and contributor(s) and not of MDPI and/or the editor(s). MDPI and/or the editor(s) disclaim responsibility for any injury to people or property resulting from any ideas, methods, instructions or products referred to in the content. |
© 2025 by the authors. Licensee MDPI, Basel, Switzerland. This article is an open access article distributed under the terms and conditions of the Creative Commons Attribution (CC BY) license.
Copyright: This open access article is published under a Creative Commons CC BY 4.0 license, which permit the free download, distribution, and reuse, provided that the author and preprint are cited in any reuse.


