Submitted:
25 December 2025
Posted:
25 December 2025
You are already at the latest version
Abstract
Background: Age-related macular degeneration (AMD) is a major cause of vision loss, yet publicly available OCT datasets lack demographic diversity, particularly from South Asian populations. Existing datasets largely represent Western cohorts, limiting AI generalizability. Moreover, raw OCT volumes contain redundant spatial information and speckle noise, hindering efficient analysis. Methods: We introduce BanglaOCT2025, a retrospective dataset collected from the National Institute of Ophthalmology and Hospital (NIOH), Bangladesh, using Nidek RS-330 Duo 2 and RS-3000 Advance systems. We propose a novel preprocessing pipeline comprising two stages: (1) A "Constraint-Based Centroid Minimization" algorithm that autonomously identifies the foveal center to extract a 33-slice region of interest, robust against retinal tilt; and (2) A Self-Supervised Volumetric Restoration module utilizing a Flip-Flop Swin Transformer (FFSwin) backbone to mitigate speckle noise without requiring paired clean data. Results: The dataset includes 1,585 OCT scans (202,880 B-scans), with 857 expert-annotated cases (54 DryAMD, 61 WetAMD, and 742 NonAMD). The proposed restoration pipeline enhances image clarity while preserving pathological biomarkers, improving classification accuracy from 69.08% to 99.88% using the same classifier. Statistical significance was confirmed via paired McNemar testing, and denoising quality was evaluated using reference-free volumetric metrics. Conclusions: BanglaOCT2025 constitutes the first clinically validated OCT dataset representing the Bengali population and establishes a reproducible, fovea-centric preprocessing and restoration paradigm for robust AMD analysis in resource-constrained clinical settings.
Keywords:
BanglaOCT2025
; Optical Coherence Tomography
; fovea detection
; speckle noise reduction
; self-supervised learning
; Flip-Flop Swin Transformer
; AMD
1. Introduction
Optical Coherence Tomography (OCT) functions as an "optical ultrasound," utilizing low-coherence interferometry to provide non-invasive, micrometer-scale cross-sectional views of retinal microstructures [1]. In these grayscale tomograms, pixel intensity correlates with tissue backscattering properties; hyper-reflective (bright) regions indicate distinct layers such as the Retinal Nerve Fiber Layer (RNFL) and the Retinal Pigment Epithelium (RPE), while hypo-reflective (dark) regions represent the nuclear layers and vitreous humor [2]. Even minor textural or intensity deviations within these layers can signal early pathological changes associated with sight-threatening conditions.
OCT has become the clinical gold standard for diagnosing age-related macular degeneration (AMD) and other macular disorders [3]. However, the development of reliable automated diagnostic systems is constrained by two fundamental challenges: demographic dataset bias and volumetric image quality degradation.
First, majority of the publicly available OCT datasets, such as Duke SD-OCT, OCTA-500, and AROI, are based on Western (largely Caucasian) or East Asian patient cohorts [4,5,6]. Although these datasets are well curated and widely used, they provide limited representation of South Asian populations, where retinal anatomy, pigmentation, and disease characteristics may differ across ethnic groups [7]. Consequently, AI models trained on Western OCT datasets may suffer from domain shift when deployed in South Asian clinical settings, reducing diagnostic reliability. Despite the growing burden of age-related macular degeneration, population-specific OCT datasets for South Asia—particularly Bangladesh—remain scarce. Such anatomical and demographic differences can alter OCT appearance and challenge model generalization, consistent with broader findings on limited cross-population transferability in medical AI [8].
To address this gap, we introduce BanglaOCT2025, a large-scale macular OCT dataset collected at the National Institute of Ophthalmology and Hospital (NIOH), Bangladesh, using NIDEK RS-330 Duo 2 and RS-3000 Advance systems under routine clinical workflows, with clinician-verified annotations and demographic metadata [9,10].
Second, the volumetric nature of OCT introduces redundancy and speckle noise. Standard macular scans contain up to 128 B-scans covering a 6 mm × 6 mm retinal region, many of which lie outside the diagnostically relevant central macula and increase computational cost and noise sensitivity [11]. Reliable 3D analysis therefore requires accurate localization of the fovea centralis; however, existing fovea detection methods based on global thickness or intensity heuristics are often sensitive to tilt, motion artifacts, and pathological deformation [12,13,14].
To address this, we propose a constraint-based centroid minimization algorithm that robustly localizes the fovea, even in tilted scans, and extracts a standardized 33-slice sub-volume. This fovea-centric design aligns with clinical practice, where AMD-related biomarkers are concentrated in the central macula, while reducing redundant computation.
Furthermore, raw OCT images are inherently affected by speckle noise[15], it appears as a granular interference pattern that obscures fine pathological features, including drusen boundaries, subretinal fluid, and outer retinal layers. Conventional two-dimensional filtering methods often reduce this noise at the cost of blurring layer boundaries, thereby compromising diagnostic detail [16,17]. Recent machine-learning approaches, mainly based on 2D autoencoders, denoise OCT images by processing individual B-scans and typically rely on paired or reference images [18,19,20,21]. However, such methods largely ignore the intra- and inter-slice spatial relationships inherent to volumetric OCT data. Consequently, the use of collocated volumetric coherence for self-supervised OCT denoising remains underexplored.
To address this limitation, we introduce a self-supervised volumetric restoration framework based on a Flip-Flop Swin Transformer (FFSwin) backbone. By leveraging intra- and inter-slice anatomical coherence, the model suppresses speckle noise while preserving retinal structure, without requiring noise-free reference images.
In summary, this study makes four principal contributions: (i) introduction of BanglaOCT2025, the first clinically curated macular OCT dataset from the Bengali population; (ii) a constraint-based centroid minimization algorithm for tilt-robust automated fovea-centric sub-volume extraction; (iii) a self-supervised volumetric restoration framework leveraging a Flip–Flop Swin Transformer backbone; and (iv) a comprehensive evaluation showing that restoration-driven preprocessing substantially enhances downstream AMD classification performance under severe class imbalance. Here, downstream AMD classification results are reported to validate the effectiveness of the restoration process, a high-level architectural description is provided, sufficient to reproduce the restoration paradigm without exposing proprietary implementation details.
Note: This article focuses strictly on the dataset characteristics and the restoration methodology. While we report downstream classification accuracy to validate the quality of the restored images, the detailed architecture of the classification framework is outside the scope of this paper and will be reported in a separate study.
2. Materials and Methods
2.1. Dataset: BanglaOCT2025
2.1.1. Dataset Acquisition
BanglaOCT2025 was retrospectively collected (BanglaOCT2025) from the National Institute of Ophthalmology and Hospital (NIOH), Bangladesh, under routine clinical workflows. All data were de-identified in accordance with institutional data governance practices prior to analysis, with only limited demographic metadata (age and sex) retained for research purposes. No personally identifiable information was used in this study.
OCT examinations were acquired using NIDEK spectral-domain OCT systems, namely the RS-330 Duo 2 and RS-3000 Advance (NIDEK Co., Ltd., Japan), operated through the NAVIS-EX image management software. A total of 1,419 patient records were initially retrieved from the NAVIS-EX system, comprising 1,071 cases from the RS-330 Duo 2 and 348 cases from the RS-3000 Advance. After excluding incomplete, corrupted, or empty scan folders, 1,071 valid patients and 1,658 volumetric OCT scans were retained. A detailed breakdown of patient counts, scan validity, and slice statistics is summarized in Table 1.
Each macular OCT volume was acquired using a standard 6 mm × 6 mm fovea-centered protocol with 128 B-scans, following routine clinical practice including patient fixation guidance, optional pupil dilation, automated alignment, and manual confirmation of macular center to ensure consistent alignment and image quality for AMD assessment. [2,23,24,25,26]. All B-scans were stored as grayscale images, where pixel intensity represents tissue backscattering and supports layer-wise (e.g., RNFL and RPE) retinal analysis.
Following quality control, a total of 1,585 scans (202,880 B-scans) were retained for the BanglaOCT2025 dataset, as summarized in Table 2. Among these, 857 scans from 573 patients were selected for expert annotation. Diagnostic labels were assigned by experienced retina specialists into three clinical categories: DryAMD, WetAMD, and NonAMD. Each case was independently reviewed by multiple clinicians, and final labels were determined through consensus to enhance annotation reliability. This expert-driven labeling strategy is consistent with established best practices in ophthalmic imaging datasets [3,4,27]. Scans without expert labels were retained for unsupervised and restoration-only experiments.
To the best of our knowledge, BanglaOCT2025 represents the first large-scale, clinically curated OCT dataset specifically focused on the Bengali population. By providing population-specific OCT data with verified clinical labels, this dataset addresses a significant gap in existing OCT resources and supports the development and evaluation of robust ophthalmic AI systems for South Asian populations.
2.1.2. Ground Truth Labeling
To ensure clinical reliability, the dataset underwent a rigorous labeling process involving three retina specialists from Sher-e-Bangla Medical College Hospital (SBMCH), Khulna Medical College Hospital (KMCH), and NIOH. The specialists independently reviewed scans using the Nidek NAVIS-EX software (trial version).
- Initial Classification: Two specialists (from SBMCH and KMCH) independently labeled 573 patients (857 individual scans) into categories including Dry AMD, Wet AMD, and other retinal conditions.
- Conflict Resolution: While classifications were generally consistent, disagreements arose in specific early-stage cases. These contentious cases were reviewed by a third specialist from NIOH.
In BanglaOCT2025, the patients age range 10.5 to 85.5 years from 1071 patients (individual 1585 scans). Total 573 patients are (individual 857 scans) ground truth labelled (age range 48.5 year to 85.5 year). The youngest Wet AMD case was 49.5 years. Patient distribution according to age is summarizes as Table 3. In this dataset, gender wise dry AMD and wet AMD given in Table 4.
2.2. Constraint-Based Fovea-Centric Volume Extraction
Each B-scan was exported as an 8-bit grayscale bitmap image where denotes the slice index, and represent the image height and width, respectively.
Accurate localization of the fovea is a critical prerequisite for reliable macular analysis, as automated fovea detection may be unreliable in the presence of retinal pathology, fixation instability, or scan tilt. Prior studies have shown that pathological deformation and acquisition artifacts can significantly affect automated fovea localization accuracy [12,13]. Unlike prior fovea detection approaches that rely on global thickness profiles or intensity heuristics, the proposed method introduces a constraint-aware, column-wise centroid formulation that is robust to tilt and pathological deformation. Therefore, for algorithm validation and benchmarking purposes only, the foveal center was manually identified following established clinical protocols reported in the literature [12,13].
All preprocessing and downstream experiments in this study rely exclusively on the proposed fully automated constraint-based centroid minimization algorithm, without manual intervention. During validation only, manual foveal localization was performed by identifying the B-scan with the deepest foveal pit within ±5 slices of the system-reported fovea, following established clinical protocols [29]. After foveal localization, a standardized fovea-centered sub-volume of 33 consecutive B-scans (fovea ±16 slices) was extracted to ensure consistent macular coverage across all subjects [11]. To reduce computational cost, a fovea-centered sub-volume of 33 slices (±16) was used. Although the fovea is typically located near the mid-volume (around slice 64), anatomical variation and patient motion can shift its position between slices 59 and 69 [12]. To ensure robust detection under scan tilt and pathological deformation, the pipeline proceeds as follows:
- Segment retinal tissue in the central region of each slice.
- Compute a column-wise centroid (one per A-scan) to detect the shallowest point.
- Define a slice-level pit metric using the minimum centroid height.
- Apply a clinical penalty to enforce the expected anatomical slice range.
- Extract the fovea and its 16 neighboring slices on each side.
This section presents a constraint-based centroid minimization algorithm for automated foveal slice detection, which employs a tilt-robust retinal pit metric together with a penalty-constrained optimization strategy to consistently extract a standardized 33-slice macular sub-volume (Tilt Fovea Centric OCT Volume Extraction Implementation). Manual foveal confirmation was used only for validation; all preprocessing and downstream analyses rely solely on the fully automated algorithm.
2.2.1. Tilt-Robust Foveal Slice Detection and Macular Extraction Algorithm
A novel algorithm that combines column-wise centroid analysis [30] with clinical range constraints to achieve robust foveal slice detection insensitive to image rotation or tilt artifacts was employed.
Central Region Extraction: Restricting analysis to the central macular region reduces peripheral noise while preserving the foveal pit, consistent with prior macula-focused OCT analyses [11,31]. For computational efficiency and anatomical focus, a central region comprising 35% of the image width was extracted. A 35% central width was empirically selected to encompass the foveal pit and parafoveal region while excluding peripheral regions prone to shadowing and curvature artifacts.
where,
Denoising with Gaussian Filtering: Speckle noise [15] was reduced using a 2D Gaussian filter with kernel size . A mild Gaussian smoothing was applied to suppress speckle-induced high-frequency fluctuations without blurring retinal layer boundaries while preserving layer geometry, consistent with prior OCT preprocessing studies [32,33].
where, .
Adaptive Thresholding with Otsu’s Method: Retinal tissue was segmented using Otsu’s method, which automatically determines the optimal threshold by maximizing between class variance to separate retinal tissue from background.
where is computed as:
This procedure automatically finds the best intensity value to separate bright retinal tissue from darker background by maximizing the difference between the averages of the two groups of pixels.
Column-Wise (A-Scan) Centroid Analysis: The key innovation lies in computing centroids for each vertical column (A-scan) independently rather than a global centroid. This provides tilt-robustness. Unlike global centroid or thickness-based approaches, column-wise centroid estimation preserves robustness under scan tilt and local deformation [12,31]. For each segmented slice , the -th A-scan is represented by a binary depth profile capturing axial retinal tissue distribution. The zeroth moment (area) for column is , the first vertical moment is .
The column centroid (vertical position) is:
where prevents division by zero.
Foveal Pit Metric- Minimum Column Centroid: The foveal pit corresponds to the thinnest point of the retina, which manifests as the highest position in the image (minimum -coordinate). The metric for slice is:
where, is the set of all columns in the central region. This metric identifies the minimum (highest) centroid among all columns, corresponding to the foveal depression.
Efficient Vectorized Implementation: The algorithm uses NumPy vectorization for computational efficiency. Let denote the segmented central retinal region, where . The column-wise zeroth- and first-order moments are computed as , where is a vector of ones and . The column centroids are then defined as:
with to avoid division by zero. Finally,
Clinical Range Constraint with Penalty Function: To incorporate anatomical prior knowledge, slices outside the clinically expected foveal range (59–69) were penalized:
The penalty value of 200 was empirically chosen to suppress slices outside the expected foveal range while still allowing anatomically pronounced foveal pits to be selected, thereby balancing robustness and flexibility.
Foveal Slice Identification: The optimal foveal slice index is:
Macular Sub-volume Extraction: A standardized macular sub-volume centered on the detected fovea was extracted:
where, A fixed 33-slice macular sub-volume centered on the detected fovea was extracted. Boundary conditions were handled by shifting the extraction window to ensure a consistent slice count without exceeding volume limits.
Algorithm: Constraint-Based Centroid Minimization
- Parameters:
- (Adjacent slices each side)
- (Total slices per volume)
- , (preferred foveal range)
- (Penalty for out-of-range slices)
- Procedure:
For each patient folder:
- Initialize metric dictionary
-
For each sliceto
- Load image
- Extract central region (35% width):
- Apply Gaussian blur:
- Compute Otsu threshold
- Segment tissue:
- Compute column centroids
- If or :
- Else:
- Find foveal slice:
- Calculate range: ,
- If : adjust range leftward
- If : adjust range rightward
- Copy slices through to output folder
2.2.2. Design Rationale and Robustness Analysis
Tilt-Robustness Analysis: Traditional global centroid methods fail when OCT scans are tilted. Consider a tilted scan where the retinal surface forms angle with the horizontal. The true foveal pit depth is preserved in column-wise minima but lost in global averaging:
The method avoids this bias by computing , which remains invariant to tilt.
Penalty Function: The penalty value was chosen such that:
This ensures the preferred range dominates unless an out-of-range slice has an exceptionally strong foveal signal.
Computational Complexity: The algorithm operates in per slice, with vectorized operations achieving near-optimal performance. The total processing time for patients is approximately . On a standard workstation (Intel i7 CPU), fovea detection required <0.3 s per volume, enabling scalable preprocessing of large datasets.
2.2.3. Parameter Summary

Table 5.
Algorithm parameters for tilt-robust foveal detection.
| Parameters | Value and Rationale |
|---|---|
| ) | 128 (standard NIDEK protocol) |
| ) | 1.5mm |
| Search range | 5 slices) |
| ) | 200 (empirically validated on the BanglaOCT2025 dataset) |
| Central width | 35% of image (focus on anatomically relevant region) |
| Gaussian kernel | , balances noise reduction and edge preservation) |
| Threshold method | Otsu’s adaptive threshold (robust to brightness variation) |
2.2.4. Validation and Error Handling
The algorithm includes robustness measures:
- Fallback mechanism: If no valid images are found, defaults to slice 64 (midpoint of preferred range)
- Boundary checking: Ensures extracted sub-volume stays within 1–128 range
- Empty folder detection: Skips folders without valid OCT images
- Numerical stability: prevents division by zero in centroid calculations
These safeguards ensure reliable operation under real-world clinical conditions, including incomplete scans and acquisition failures
2.3. Self-Supervised Volumetric Denoising Framework Using FFSwin Backbone
OCT imaging is inherently affected by speckle noise [15], which obscures retinal microstructures such as the Inner Segment (IS)/ Outer Segment (OS) junction, Retinal Pigment Epithelium (RPE) band, and drusen morphology. Conventional 2D denoising methods neglect the critical depth-wise continuity of OCT volumes [34]. Following fovea-centric sub-volume extraction (33 slices; Section 2.2), a self-supervised volumetric denoising framework based on a Flip–Flop Swin Transformer [35,36] backbone (FFSwin1) was employed (FFSwin Restoration Implementation) to model intra- and inter-slice contextual relationships without requiring clean reference volumes [37,38].
This design choice is theoretically supported by blind-spot self-supervised learning principles, such as Noise2Self, which demonstrate that effective denoising can be achieved without clean targets by exploiting statistical independence in structured noise patterns [39].
The denoising module serves as a pretext task, providing structurally enhanced volumes that significantly benefit downstream AMD classification, where our FFSwin classifier achieves 99.88% accuracy on the BanglaOCT2025 dataset.
2.3.1. Theoretical Premise: 3D Spatio-Temporal Consistency
Our approach relies on the distinction between biological tissue and imaging artifacts in 3D space:
- Anatomical Continuity: Retinal layers (e.g., RPE, ILM) and pathologies (e.g., Drusen) are physically continuous structures. If a feature exists at coordinates in slice , it likely exists near in slice and
- Noise Independence: Speckle noise is an interference pattern that is stochastic. A noise granule at in slice has no correlation with the pixel at in slice
Therefore, a hypothesis is considered where a network forced to predict the content of co-located volumetric neighbors will naturally learn to preserve anatomy while suppressing independent noise.
2.3.2. Network Backbone: The "Flip-Flop" Abstraction
To implement this hypothesis, a custom transformer architecture “Flip-Flop Swin Transformer (FFSwin)” is utilized as backbone where 3D abstraction of 2D OCT slices volume is used. Unlike standard 3D CNNs, this backbone employs an Alternating (Flip-Flop) Attention Mechanism to capture anisotropic features:
- Intra-Slice Attention (Flop Mode): The model attends to local patches within the 2D plane (). This allows the network to learn texture and edge definitions within a single B-scan.
- Inter-Slice Attention (Flip Mode): The attention window is shifted along the -axis (Depth). This forces the model to aggregate information from co-located patches in adjacent slices ).
This mechanism acts as a volumetric filter, reinforcing features that are spatially consistent across the depth dimension.
Note: The specific architectural micro-design of this backbone is outside the scope of this paper, which focuses on the restoration application and dataset validation.
Figure 1.
Block diagram of FFSwin Denoising Model.
2.3.3. Self-Supervised Training Strategy
Since perfectly clean ground-truth OCT data cannot be obtained physically, the training as a Self-Supervised reconstruction task is formulated. The raw volume itself as the supervision signal is utilized. Let be the input sub-volume extracted from the dataset. During training, a stochastic corruption function is introduced to generate a noisy volume by injecting additive Gaussian noise .
The denoiser learns a mapping
The network maps the corrupted volume back to the original. The objective is to minimize the structural deviation between the reconstruction and the clean target :
2.3.4. Volumetric Patch Embedding and Context Modeling
The framework decomposes each OCT volume into non-overlapping 3D patches:
where is patch depth and is the spatial size. The FFSwin backbone computes height–width–depth attention across co-located patches:
where includes both intra-slice neighbors and inter-slice depth-shifted neighbors, enabling the model to exploit anatomical continuity.
To protect the proprietary nature of the architecture, only a high-level description is provided. Internally, the network alternates between flop (non-shifted) and flip (shifted) volumetric attention, allowing cross-slice aggregation without revealing block-level details. The backbone contains 4,53,367 learnable parameters, reflecting a computationally lightweight yet expressive volumetric encoder.
2.3.5. Reconstruction Loss Function
To prevent the model from learning the identity mapping, a hybrid objective function combining Mean Squared Error (MSE) and Sharpness Regularizer [40] is utilized.
where, the MSE term ensures global intensity fidelity; term is crucial for preserving sharp layer boundaries.
By optimizing this objective, the network learns the structural manifold of the retina—the features that persist despite the added noise. Consequently, during inference (where no noise is added), the network removes the intrinsic speckle noise, treating it as a deviation from the learned manifold.
2.3.6. High-Level Architecture (Decoder-Free Design)
Unlike standard autoencoders, our design does not contain a symmetric decoder. The pipeline consists of 3D Patch Embedding (Conv3D), FFSwin Backbone (encoder-only volumetric attention), Reconstruction Head (ConvTranspose3D), Sigmoid activation to restore intensities to [0, 1] as shown in Figure 2. This greatly simplifies inference and eliminates feature-level redundancy.
2.3.7. Training Protocol and Convergence Analysis
The denoising module was trained for 50 epochs using automatic mixed precision (AMP), enabling stable optimization and reduced memory usage during 3D volumetric learning. The training log demonstrates a clear and steady decline in reconstruction loss across epochs. The denoiser begins at a loss of approximately 0.00867 and converges to a final value of 0.00768, representing a consistent improvement in reconstruction quality throughout training shown in Figure 3.
The loss decreases rapidly during the first 10–15 epochs, then transitions into a slower refinement phase. Training converged smoothly by epochs 35–40, with no oscillation or divergence, indicating stable optimization and effective learning of volumetric OCT structure without overfitting [41].
The small but meaningful reduction in loss (approximately 11.4% improvement from initial to final) is consistent with denoising tasks trained under self-supervised reconstruction, where the model learns to suppress noise while preserving fine retinal structures. Although the absolute loss values are low—due to normalized intensities and the use of —the monotonic convergence confirms that the model progressively enhances reconstruction fidelity.
When deployed in the classification pipeline, the impact of denoising becomes unambiguous. The FFSwin classifier evaluated on raw noisy volumes and achieves an accuracy of 69.08% with highly imbalanced performance across classes: DryAMD (recall 0.78), WetAMD (recall 0.21), and NonAMD (recall 0.72). After denoising, the identical classifier—without retraining—achieves 99.88% accuracy, with all class-wise precision and recall values between 0.98 and 1.00. This substantial improvement indicates that the denoiser restores clinically meaningful features that lost in the noisy volumes, particularly in WetAMD cases, where subtle biomarkers are easily overwhelmed by acquisition noise.
The strong separation between noisy and clean classification performance confirms that the denoiser does not merely smooth the images, but reconstructs retinal layers in a way that enhances downstream discriminability. This validates the utility of the denoising module as a critical preprocessing stage for automated AMD diagnosis.
2.3.8. Inference Pipeline
During inference through the FFSwin backbone denoising model, slices are resized and stacked into volumes, odd-depth volumes are padded to ensure valid window partitioning, the model processes the full depth context, reconstruction is cropped back to original depth shown in Figure 4. This ensures full compatibility with irregularly sized real-world OCT datasets.
3. Results
This section presents the experimental validation of the proposed BanglaOCT2025 dataset and the associated preprocessing pipeline. The results are organized into three parts. First, the summarization of the statistical characteristics and clinical composition of the BanglaOCT2025 dataset to establish its representativeness and diagnostic relevance (Section 3.1). Second, the robustness and effectiveness of the proposed constraint-based fovea-centric volume extraction algorithm are evaluated, which serves as the foundation for all subsequent analysis (Section 3.2). Finally, the impact of the self-supervised volumetric denoising framework is analyzed through downstream diagnostic performance, statistical testing, reference-free metrics, and qualitative visual assessment (Section 3.3).
All experiments were conducted on fovea-centered 33-slice OCT sub-volumes extracted automatically from raw 128-slice macular cubes, ensuring consistent anatomical alignment across patients and diagnostic categories.
3.1. BanglaOCT2025 Characteristics and Clinical Composition
BanglaOCT2025 is a large-scale OCT dataset representing a South Asian population and addresses a major gap in existing public resources. After quality control, 1,585 OCT volumes (202,880 B-scans) from 1,071 patients were retained, including 857 expert-labeled scans for evaluation. The labeled cohort comprises 54 DryAMD, 61 WetAMD, and 742 NonAMD cases, reflecting the class imbalance typical of real-world screening. Patient ages ranged from 48.5 to 85.5 years, with WetAMD cases concentrated in older individuals, consistent with known epidemiology. All scans were acquired under routine clinical conditions using Nidek RS-330 and RS-3000 systems, capturing realistic variability in image quality. Together, these features establish BanglaOCT2025 as a clinically meaningful benchmark for OCT restoration and diagnostic research.
3.2. Evaluation of Constraint-Based Fovea-Centric Volume Extraction
Accurate fovea localization is essential for macular analysis[11], as AMD biomarkers are concentrated near the foveal pit. This subsection evaluates the proposed automated centroid-based method for foveal slice detection and standardized sub-volume extraction.
3.2.1. Robustness of Automated Foveal Slice Detection
The algorithm reliably identified the foveal slice across the dataset without manual input during deployment. By combining column-wise centroid analysis with a clinically motivated penalty constraint, it remained robust to common acquisition artifacts such as retinal tilt, uneven illumination, and pathological deformation.
Compared with global intensity- or thickness-based methods, the column-wise centroid metric consistently localized the foveal pit, even in tilted or asymmetric scans. Restricting the search to an anatomically plausible range (slices 59–69) further reduced false detections while accommodating patient-specific variability. Manual foveal confirmation was used only for validation; all reported results rely on the fully automated pipeline, with no systematic failures observed in quality-controlled volumes.
3.2.2. Standardization of Macular Sub-Volumes
After fovea detection, a fixed 33-slice sub-volume (fovea ±16 slices) was extracted for each scan, ensuring anatomically consistent macular coverage while removing peripheral redundancy. This reduced volumetric depth by ~74%, lowering computational cost without sacrificing clinically relevant structures. Visual inspection across all diagnostic groups confirmed preservation of key macular features, supporting an effective balance between anatomical focus and efficiency.
3.2.3. Role of Fovea-Centric Extraction in Downstream Analysis
All denoising, classification, and evaluation experiments (reported in Section 3.3) were conducted exclusively on these standardized 33-slice sub-volumes. This design choice isolates the impact of volumetric denoising and avoids confusing effects from irrelevant peripheral slices.
By enforcing consistent anatomical alignment across patients, the fovea-centric extraction step establishes a stable foundation for volumetric learning and contributes directly to the robustness and interpretability of downstream diagnostic results.
3.3. Self-Supervised Volumetric Restoration Framework Using FFSwin Backbone
3.3.1. Classification Performance on BanglaOCT2025 Dataset
Classification performance of the Flip-Flop Swin Transformer (FFSwin) was assessed on BanglaOCT2025 using patient-wise evaluation. The dataset included 857 patients (54 DryAMD, 61 WetAMD, and 742 NonAMD), each represented by 33 fovea-centric B-scans. To address class imbalance, minority classes were oversampled during training, while evaluation preserved the original distribution.
The same trained classifier and test set were used to compare two conditions: raw (noisy) OCT volumes and denoised volumes produced by the proposed restoration model.
Performance on Raw OCT Volumes: While the classifier's overall accuracy was 69.08% on the raw OCT scans, its performance varied widely across different conditions. It reliably confirmed healthy (NonAMD) eyes with 0.95 precision. The challenge emerged with WetAMD, where the model's recall fell to just 0.21, meaning it missed most of these cases. This sharp drop indicates the classifier has particular trouble detecting WetAMD's symptoms when the data is noisy—a key finding summarized in Table 6.
The macro-averaged F1-score was 0.45, highlighting the impact of class imbalance and the limited discriminative capability of noisy OCT inputs for minority disease classes.
Performance on Denoised OCT Volumes: In contrast, evaluation on denoised OCT volumes resulted in a dramatic performance improvement, achieving an overall accuracy of 99.88%. The classifier demonstrated near-perfect performance across all classes, with recall values of 1.00 for DryAMD, 0.98 for WetAMD, and 1.00 for NonAMD as summarizes in Table 7.
The macro-averaged F1-score increased to 0.99, indicating robust and balanced classification performance even in the presence of severe class imbalance. These results suggest that denoising substantially enhances feature quality and inter-class separability in OCT images.
3.3.2. Denoising Effectiveness via Downstream Diagnostic Task
In the absence of noise-free ground-truth OCT images, the effectiveness of the proposed denoising approach was evaluated indirectly through its impact on a downstream diagnostic task, following a task-driven evaluation paradigm commonly adopted in medical image analysis [21,39].
To ensure a fair comparison, the same FFSwin classifier, trained with identical hyperparameters and evaluated on the same patient-wise test set, was applied to both raw and denoised OCT volumes. The difference between the two evaluation settings was the input data quality as shown in Figure 5.
The results demonstrate that denoising plays a critical role in improving diagnostic reliability. While raw OCT data led to substantial misclassification of AMD subtypes, denoised OCT volumes enabled near-perfect recognition of both DryAMD and WetAMD cases. This improvement indicates that denoising reveals disease-relevant features that are obscured by noise in raw OCT images.
Clinically, the marked gain in AMD sensitivity is important, as missed cases can delay treatment. These results show that the proposed FFSwin denoiser improves both image quality and diagnostic performance.
3.3.3. Class-Imbalance–Aware Analysis
BanglaOCT2025 shows strong class imbalance, with NonAMD cases comprising about 87% of the dataset and DryAMD and WetAMD together accounting for 13%. In such settings, overall accuracy can be misleading, as it may mask poor performance on minority classes.
To provide a fair assessment, we therefore emphasized imbalance-aware metrics, including class-wise recall, macro-averaged precision and F1-score, and balanced accuracy. On raw OCT data, the classifier showed limited macro-level performance (macro F1-score = 0.45), reflecting weak recognition of AMD subtypes. In contrast, evaluation on denoised volumes yielded a macro F1-score of 0.99, indicating consistently high performance across all classes.
Notably, the recall for DryAMD and WetAMD improved from 0.78 and 0.21 (raw OCT) to 1.00 and 0.98 (denoised OCT), respectively. This demonstrates that denoising disproportionately benefits minority disease classes by enhancing subtle pathological features that are otherwise suppressed by speckle noise [15].
These results confirm that the observed performance gains are not driven by majority-class bias but reflect genuine improvements in disease-specific feature representation, validating the robustness of the proposed denoising-classification pipeline under real-world imbalanced clinical conditions.
3.3.4. McNemar’s Test for Paired Diagnostic Outcomes
A paired comparison was performed to evaluate whether the FFSwin-based denoising module significantly altered patient-level diagnostic correctness.
Correct on both noisy and clean data, a= 592 patients; incorrect on noisy and correct after denoising (improved), b= 264 patients; correct on noisy and incorrect after denoising (degraded), c= 0 patients; incorrect on both, d= 1 patient. For each patient, the classifier’s decision on noisy (raw) OCT data was compared with its decision on the corresponding denoised volume. The resulting table is given in Table 8. This probability is highly statistically significant as shown in Table 9. For a chi-square distribution with one degree of freedom, values around 10 correspond to p-values on the order of , corresponds to p-values on the order of , and yields p-values far below . The exact binomial test produced an extremely small p-value (), which is far below than conventional significance thresholds and is therefore reported as .
McNemar Test:
McNemar’s test showed strongly significant discordance between the two conditions (continuity-corrected χ² = 262.00, p < 0.000001; exact binomial p < 10⁻¹²). Because the vast majority of discordant outcomes represented improvements (264 improved vs. 0 degraded) as shown in Table 8, the test confirms that the denoising procedure yields a statistically significant enhancement in diagnostic accuracy. No evidence of performance degradation was observed for any patient.
These findings indicate that the denoising module consistently increases diagnostic correctness and does not introduce clinically harmful misclassifications. The paired statistical test provides strong evidence that the denoised reconstructions convey additional discriminative information that is beneficial for automated AMD classification.
Patient-level Diagnostic Impact of Denoising: Patient-level correctness transition heatmap comparing noisy and denoised OCT-based diagnoses.
Denoising resulted in substantial recovery of previously misclassified patients without introducing diagnostic errors as shown in Figure 6 (a). Forest plot showing proportions of improved and degraded diagnoses after denoising. All discordant cases favored improvement, with no observed degradation as shown in Figure 6 (b).
3.3.5. Performance Evaluation
Class-Imbalance Aware Diagnostic Performance: To address severe class imbalance in the BanglaOCT2025 dataset (DryAMD = 54, WetAMD = 61, NonAMD = 742), class-wise confusion matrices were aggregated using a one-vs-rest strategy. This analysis reveals that denoising substantially improves sensitivity across all disease categories while maintaining or improving specificity as shown in Table 10.
The most noticeable gain was observed for WetAMD, where sensitivity increased from 0.213 to 0.984, effectively eliminating missed diagnoses. Importantly, no increase in false positives was observed after denoising, confirming that performance gains were not achieved at the expense of diagnostic specificity.
Due to the severe class imbalance, evaluation relied primarily on class-imbalance aware metrics. When noisy OCT volumes applied on FFSwin classification model, the model achieved a balanced accuracy of 0.5715, macro F1-score of 0.4496, and Matthews correlation coefficient (MCC) of 0.2912, indicating limited robustness under noise as shown in Table 11.
After applying the proposed self-supervised denoising pipeline, performance improved dramatically. Balanced accuracy increased to 0.9945, macro F1-score to 0.9942, and MCC to 0.9952. Cohen’s kappa rose from 0.2426 to 0.9952, indicating near-perfect agreement beyond chance as shown in Table 11.
Notably, WetAMD sensitivity increased from 0.2131 to 0.9836, representing a critical clinical improvement in detecting the most vision-threatening condition as shown in Table 12. These gains confirm that denoising substantially enhances diagnostic reliability across all disease categories without bias toward the majority NonAMD class.
After applying the proposed self-supervised denoising pipeline, performance improved dramatically. Balanced accuracy increased to 0.9945, macro F1-score to 0.9942, and MCC to 0.9952. Cohen’s kappa rose from 0.2426 to 0.9952, indicating near-perfect agreement beyond chance.
Interpretation of Performance Metrics: Prior to denoising, the classifier failed to detect the majority of WetAMD cases, representing a high-risk scenario for missed progressive disease. After denoising, the model correctly identified nearly all disease cases across categories, substantially reducing missed diagnoses. This improvement is especially important for WetAMD, where timely detection directly influences treatment outcomes. Notably, the gain in sensitivity did not come at the expense of specificity; false positives were rare, indicating that denoising enhances diagnostic confidence without increasing unnecessary referrals.
Under noisy conditions, positive AMD predictions were often unreliable. Following denoising, precision exceeded 98% for all disease classes, suggesting that positive predictions can be interpreted with high clinical confidence. The marked improvement in F1-score reflects a balanced reduction in both missed cases and false alarms, confirming that performance gains are not driven by class imbalance or trivial predictions.
Improvements in balanced accuracy further demonstrate that denoising enables consistent performance across DryAMD, WetAMD, and NonAMD cases, rather than favoring the majority class. Near-perfect values of MCC and Cohen’s kappa indicate strong agreement with expert annotations and confirm that the observed accuracy is robust and unbiased. Together, these findings support the role of volumetric denoising as a key enabler of reliable OCT-based AMD diagnosis.
Overall, class-imbalance–aware metrics show that the FFSwin-based denoising approach markedly improves diagnostic performance by reducing missed AMD cases while maintaining near-perfect specificity. The close agreement with expert annotations highlights the importance of volumetric denoising for reliable OCT-based AMD diagnosis.
3.3.6. Reference-Free Evaluation of Denoising on Real OCT Volumes
As the noise-free OCT references are unavailable in clinical practice, denoising performance was evaluated using patient-wise, reference-free metrics that compare noisy and denoised volumes, following established real-world evaluation protocols [8,37,39].
Noise reduction was assessed using local variance, while structural preservation and volumetric coherence were evaluated through edge strength and inter-slice consistency. All metrics were computed on paired patient scans, with noisy volumes resized to match denoised images, ensuring fair and spatially aligned comparisons.
Evaluation Metrics: Because noise-free OCT references are not available, denoising performance was evaluated using complementary reference-free metrics, following standard practices in biomedical image analysis when clean ground truth data are unavailable [8,21,33,39]. Changes in local noise variance (ΔLNV) were used to measure residual speckle noise, with lower values indicating effective noise reduction without over-smoothing [32,33] The Edge Strength Preservation Ratio (ESPR), computed from Sobel gradients, was used to assess how well anatomically meaningful boundaries were preserved after denoising [42,43]. Volumetric coherence was evaluated using the change in inter-slice correlation (ΔISC), which measures improvements in structural consistency between adjacent B-scans along the depth axis [11]. Finally, changes in Shannon entropy (Δ Entropy) were used to assess reductions in randomness while preserving meaningful retinal structures [44,45].
All metrics were computed per patient and then aggregated class-wise for DryAMD, WetAMD, and NonAMD cohorts. Class-wise mean reference-free denoising metrics are summarized in the Table 13.
Interpretation: Across all disease categories, the denoising framework demonstrates consistent and balanced improvements:
Noise Suppression (Δ LNV): Low and tightly clustered ΔLNV values across all classes indicate effective noise reduction without excessive smoothing. The slightly lower values observed for NonAMD are consistent with its more uniform retinal structure.
Edge Preservation (ESPR): ESPR values are consistent across classes , showing that the denoising process preserves retinal layer boundaries and lesion edges. This is particularly relevant for WetAMD, where accurate delineation of fluid pockets and neovascular features is clinically important.
Volumetric Consistency (Δ ISC): Positive ΔISC values for all categories reflect improved coherence between adjacent B-scans after denoising. The higher ΔISC (0.2963) observed in WetAMD suggests that the model effectively stabilizes structurally variable pathological volumes by leveraging inter-slice context.
Structural Regularization (Δ Entropy): Marked reductions in entropy indicate suppression of stochastic noise while maintaining meaningful retinal texture. Similar entropy changes across classes suggest that the denoising behavior is consistent and not biased toward any specific disease group.
Visual Distribution Analysis: The patient-wise distributions in Figure 7 show that denoising performance is consistent across diagnostic groups despite strong class imbalance. Similar ΔISC and ESPR patterns across classes indicate stable preservation of inter-slice coherence and anatomical edges, supporting the robustness of the proposed approach under real-world clinical variability.
Clinical Relevance and Downstream Impact: The gains in volumetric coherence and edge preservation are reflected in downstream performance, where the same FFSwin classifier achieves 99.88% accuracy on BanglaOCT2025 after denoising. Reference-free analysis confirms that this improvement arises from meaningful noise suppression and structural stabilization rather than artificial smoothing. Overall, the proposed FFSwin-based denoising framework demonstrates robust behavior across resolutions and disease categories, preserves anatomical integrity, and provides a reliable preprocessing step for clinical OCT analysis.
3.3.7. Qualitative Visual Assessment of Denoising Performance
To complement quantitative analysis, representative OCT B-scans from DryAMD, WetAMD, and NonAMD cases were visually examined. Figure 8, Figure 9, Figure 10, Figure 11, Figure 12 and Figure 13 compare the noisy inputs, FFSwin-denoised outputs, absolute difference maps, and zoomed retinal regions of interest. Across all categories, denoising markedly reduces speckle noise—particularly in the vitreous and deeper retinal layers—while preserving clinically relevant retinal anatomy. Difference maps indicate that the restoration primarily targets high-frequency noise with minimal impact on underlying retinal structure.
DryAMD Cases: As shown in Figure 8, the DryAMD example exhibits clear speckle noise reduction after FFSwin-based denoising, leading to improved layer contrast. Retinal boundaries, particularly in the outer retina, appear more continuous and less fragmented. The difference map indicates that changes are mainly confined to homogeneous background regions, suggesting targeted noise suppression rather than structural modification.
Figure 9 shows a zoomed retinal ROI from the same DryAMD case, where denoising reduces local intensity fluctuations and improves intra-layer uniformity. Layer transitions appear smoother while overall retinal morphology is preserved, with no visible artificial edges or spurious structures.
NonAMD Cases:Figure 10 presents a NonAMD example. In the noisy scan, speckle noise disrupts layer uniformity, particularly in the inner retina. After denoising, retinal layers appear more homogeneous and clearly defined, reflecting effective noise suppression.
The ROI in Figure 11 shows that denoising preserves normal foveal contour and retinal thickness. The difference map indicates that changes are mainly noise-related rather than structural.
WetAMD Cases: WetAMD examples (Figure 12) represent the most challenging scenario Due to the presence of highly reflective lesions, fluid accumulations, and shadowing artifacts. Despite these complexities, the denoised image retains critical pathological features such as hyperreflective regions and subretinal fluid contours, while substantially reducing background speckle.
In the zoomed ROI (Figure 13), the denoised output exhibits improved contrast between lesion regions and surrounding tissue, which may facilitate downstream classification and clinical interpretation. The difference map again indicates that the denoising primarily targets stochastic noise rather than disease-specific signal patterns.
Across all diagnostic categories, the qualitative results show effective speckle noise reduction without over-smoothing, preservation of retinal layers and disease-related structures, absence of visible artifacts, and consistency with improvements observed in reference-free metrics and downstream classification performance.
These visual findings corroborate the quantitative improvements reported earlier and support the suitability of the proposed FFSwin-based denoising framework for real-world OCT analysis, particularly in settings where clean reference images are unavailable.
3.3.8. Why Quantitative Metrics (PSNR, SSIM, MSE) Are Not Included
The quantitative denoising metrics are intentionally omitted for the following reasons:
- No available clean ground truth for real OCT volumes: Self-supervised denoising cannot be directly benchmarked using reference-based metrics.
- The purpose of denoising is functional, not comparative: The FFSwin denoiser is used as a preprocessing backbone for AMD classification.
- Indirect validation through diagnostic accuracy: Our classifier trained on denoised volumes achieves 99.88% accuracy, which strongly indicates structural preservation and useful noise suppression.
- Novel dataset (BanglaOCT2025): No public baselines exist for fair cross-model comparison.
The goal is diagnostic enhancement, not denoising benchmarking.
Collectively, the results demonstrate that fovea-centric volumetric abstraction combined with self-supervised denoising fundamentally alters the diagnostic utility of OCT data. Across quantitative, statistical, and qualitative evaluations, the proposed pipeline consistently improves structural coherence, suppresses speckle noise without anatomical distortion, and enables near-perfect downstream AMD classification under severe class imbalance.
4. Discussion
4.1. Principal Findings
This study introduces BanglaOCT2025, the first clinically validated optical coherence tomography (OCT) dataset representing the Bengali population, together with a fovea-centric volumetric abstraction strategy and a self-supervised volumetric denoising framework based on a Flip-Flop Swin Transformer backbone. The principal findings of this work are threefold. First, fovea-centric extraction of a fixed 33-slice sub-volume substantially reduces volumetric redundancy while preserving diagnostically critical macular structures. Second, the proposed self-supervised denoising approach effectively suppresses speckle noise and enhances volumetric coherence without requiring clean reference images. Third, denoising leads to a statistically and clinically significant improvement in downstream age-related macular degeneration (AMD) classification, particularly under severe class imbalance.
Overall, these results show that anatomically guided preprocessing and volumetric denoising can substantially enhance the diagnostic value of real-world OCT data, particularly in resource-limited clinical settings where acquisition noise and variability are common.
4.2. Comparison with Existing OCT Datasets and Processing Paradigms
Most public OCT datasets (e.g., Duke OCT, OCTA-500, AROI) retain full volumes or angiography-centric scans, which include many peripheral slices with limited relevance for macular disease and increased computational burden. In contrast, BanglaOCT2025 adopts a clinically driven, fovea-centric design that reflects routine ophthalmic assessment focused on the central macula. By standardizing each volume to a 33-slice foveal stack, the dataset balances anatomical coverage with efficiency, concentrates learning on regions rich in AMD biomarkers, and improves interpretability. To our knowledge, BanglaOCT2025 is the first population-specific OCT dataset to formalize this fovea-centric volumetric paradigm.
4.3. Clinical Relevance of Self-Supervised Volumetric Denoising
Speckle noise is an inherent challenge in OCT imaging, often masking subtle retinal details and limiting both visual assessment and automated analysis. Unlike supervised denoising approaches that require synthetic noise models or clean reference images—which are unavailable in clinical settings—the proposed method performs fully self-supervised denoising using only noisy OCT volumes. Consistent improvements across reference-free metrics, together with qualitative visual evidence, indicate effective noise suppression while preserving retinal layers and pathological features, supporting the clinical usability of the restored images.
4.4. Interpretation of Diagnostic Performance Gains
The improvement in AMD classification performance observed after denoising is statistically significant and indicates enhanced diagnostic reliability. In particular, WetAMD sensitivity increased from 21.3% on noisy data to 98.4% on denoised volumes, a change that was confirmed by paired McNemar’s testing to be highly significant. This result warrants careful interpretation.
WetAMD contains subtle, spatially localized features—such as subretinal fluid and neovascular changes—that are highly sensitive to speckle noise. The denoising process restores these cues, allowing previously missed cases to be correctly identified. Paired analysis further shows that denoising primarily resolves prior errors without introducing new misclassifications, reducing the likelihood that the observed gains arise from overfitting or data leakage.
4.5. Class Imbalance and Robustness Considerations
AMD datasets are naturally imbalanced, with NonAMD cases dominating clinical data. To account for this, performance was assessed using class-aware metrics, including balanced accuracy, MCC, and Cohen’s kappa. Although overall accuracy increased after denoising, the larger gains in balanced accuracy and MCC indicate that improvement reflects genuine recovery of disease-relevant structure rather than majority-class bias. Because the same classifier and weights were used before and after denoising, these gains can be attributed directly to noise suppression.
4.6. Clinical and Practical Implications
From a practical perspective, the proposed framework offers two main benefits. Fovea-centric processing reduces storage and computational demands, supporting use in resource-limited settings, while the denoising module can be applied as a standalone preprocessing step without altering existing classifiers. This makes integration into current OCT analysis pipelines straightforward. Such characteristics are especially relevant for large-scale screening programs, where image quality and hardware capabilities may vary. The reported results should be viewed as upper-bound performance under controlled evaluation rather than a guarantee of universal diagnostic accuracy.
4.7. Limitations
This study has several limitations. First, although BanglaOCT2025 represents a significant step toward population-specific OCT resources, future extensions incorporating multi-center and multi-vendor data will further strengthen generalizability. Second, while reference-free metrics provide valuable quantitative insights, they cannot fully replace subjective assessment by retinal specialists. Third, the present work focuses exclusively on AMD; extension of the proposed framework to other retinal diseases remains to be investigated. Additionally, although classification results are near-ceiling after denoising, they should be interpreted as evidence of restored diagnostic signal rather than as a claim of universal generalization.
4.8. Future Directions
Future work will focus on multi-center data acquisition to improve generalizability, longitudinal analysis of disease progression, and extension of the fovea-centric denoising paradigm to additional retinal pathologies such as diabetic macular edema and glaucoma. Public release of BanglaOCT2025 is also planned to facilitate benchmarking and foster further research on population-aware ophthalmic AI.
5. Conclusions
This study introduces BanglaOCT2025, the first clinically validated optical coherence tomography dataset representing the Bengali population, together with a robust fovea-centric volumetric preprocessing and self-supervised denoising framework. By integrating anatomically informed slice selection with transformer-based volumetric restoration, the proposed pipeline substantially enhances OCT image quality without reliance on clean reference data. Extensive quantitative, statistical, and qualitative analyses show that the proposed denoising reliably recovers clinically relevant retinal structures and supports near-optimal AMD classification even under strong class imbalance. These results highlight the importance of volumetric denoising for real-world OCT analysis and position BanglaOCT2025 as a valuable resource for ophthalmic AI research. Beyond AMD, the proposed fovea-centric volumetric restoration paradigm may generalize to other retinal diseases in which subtle structural cues are obscured by acquisition noise.
Author Contributions
Conceptualization, C.B., G.M.A.R. and R.D.; Methodology, C.B.; Software, C.B.; Validation, C.B., G.M.A.R., S.S. and R.D.; Formal Analysis, C.B.; Investigation, C.B., M.S.I., M.E.I.A. and S.K.S.; Data Curation, C.B., M.S.I., M.E.I.A. and S.K.S.; Writing—Original Draft Preparation, C.B.; Writing—Review and Editing, C.B., G.M.A.R., R.D., S.S., M.S.I., M.E.I.A. and S.K.S.; Supervision, M.A.R. and R.D.; All authors have read and agreed to the published version of the manuscript.
Institutional Review Board Statement
This study was conducted in accordance with the Declaration of Helsinki. The OCT data were retrospectively collected from routine clinical examinations at the National Institute of Ophthalmology and Hospital (NIOH), Bangladesh, under formal institutional authorization. All data were fully anonymized prior to analysis, and only non-identifiable demographic information (age and sex) was retained. Ethical approval for this retrospective study, including a waiver of informed consent, has been submitted to the Ethical Review Committee (ERC), and is currently under review. The final approval documentation will be provided prior to publication.
Informed Consent Statement
Patient consent was waived due to the retrospective nature of the study and the use of fully de-identified data, in accordance with institutional and national ethical guidelines. Ethical approval is currently under review by the Ethical Review Committee (ERC).
Data Availability Statement
The BanglaOCT2025 dataset is publicly available at the link BanglaOCT2025. The Tilt-Robust Foveal Slice Detection and Macular Extraction is available in GitHub and link is Tilt Fovea Centric OCT Volume Extraction Implementation. The restoration module can be found at the link FFSwin Restoration Implementation.
Acknowledgments
We extend our sincere gratitude to the technicians at the National Institute of Ophthalmology and Hospital for their valuable assistance in data retrieval. We are also grateful to the ICT Division, Ministry of Posts, Telecommunications and Information Technology, Government of the People's Republic of Bangladesh, for the financial support provided through the ICT Fellowship (Code No.: 1280101-120008431-3821117). We further acknowledge with thanks the essential technical support provided by Md. Mahmudul Hasan Faisal, Anik Biswas, Surojit Biswas, Md. Shahariar Rahman, Yasin Arafat, Md. Shahidul Islam, Ramkrishna, S. M. Shakhawat Hossain, Farzana, Akhi, Md. Samsuzzaman, and Aminul Islam during the data collection, system implementation and integration phases of this work.
Conflicts of Interest
The authors declare no conflict of interest.
| 1 | FFSwin Architecture is used here as backbone. Here, a high-level architectural description is provided, sufficient to reproduce the restoration paradigm without exposing proprietary implementation details. |
References
- Huang, D.; Swanson, E.A.; Lin, C.P.; Schuman, J.S.; Stinson, W.G.; Chang, W.; Hee, M.R.; Flotte, T.; Gregory, K.; Puliafito, C.A.; et al. Optical Coherence Tomography. Science (1979) 1991, 254, 1178–1181. [Google Scholar] [CrossRef]
- Drexler, W.; Fujimoto, J.G. Optical Coherence Tomography: Technology and Applications; Springer Science & Business Media, 2008; ISBN 3540775501. [Google Scholar]
- Schmidt-Erfurth, U.; Waldstein, S.M. A Paradigm Shift in Imaging Biomarkers in Neovascular Age-Related Macular Degeneration. Prog Retin Eye Res 2016, 50, 1–24. [Google Scholar] [CrossRef] [PubMed]
- Farsiu, S.; Chiu, S.J.; O’Connell, R. V.; Folgar, F.A.; Yuan, E.; Izatt, J.A.; Toth, C.A. Quantitative Classification of Eyes with and without Intermediate Age-Related Macular Degeneration Using Optical Coherence Tomography. Ophthalmology 2014, 121, 162–172. [Google Scholar] [CrossRef]
- Li, M.; Huang, K.; Xu, Q.; Yang, J.; Zhang, Y.; Ji, Z.; Xie, K.; Yuan, S.; Liu, Q.; Chen, Q. OCTA-500: A Retinal Dataset for Optical Coherence Tomography Angiography Study. Med Image Anal 2024, 93, 103092. [Google Scholar] [CrossRef]
- Melinščak, M.; Radmilović, M.; Vatavuk, Z.; Lončarić, S. Annotated Retinal Optical Coherence Tomography Images (AROI) Database for Joint Retinal Layer and Fluid Segmentation. Automatika : časopis za automatiku, mjerenje, elektroniku, računarstvo i komunikacije 2021, 62, 375–385. [Google Scholar] [CrossRef]
- Wagner-Schuman, M.; Dubis, A.M.; Nordgren, R.N.; Lei, Y.; Odell, D.; Chiao, H.; Weh, E.; Fischer, W.; Sulai, Y.; Dubra, A.; et al. Race- and Sex-Related Differences in Retinal Thickness and Foveal Pit Morphology. Invest Ophthalmol Vis Sci 2011, 52, 625–634. [Google Scholar] [CrossRef]
- Esteva, A.; Robicquet, A.; Ramsundar, B.; Kuleshov, V.; DePristo, M.; Chou, K.; Cui, C.; Corrado, G.; Thrun, S.; Dean, J. A Guide to Deep Learning in Healthcare. Nature Medicine 2019 25:1 2019, 25, 24–29. [Google Scholar] [CrossRef] [PubMed]
- NIDEK CO.,LTD. Available online: https://www.nidek-intl.com/ (accessed on 7 November 2025).
- Logiciel NAVIS-EX - NIDEK France. Available online: https://www.nidek.fr/en/logiciel-navis-ex/logiciel-navis-ex-2/ (accessed on 16 December 2025).
- Ishikawa, H.; Stein, D.M.; Wollstein, G.; Beaton, S.; Fujimoto, J.G.; Schuman, J.S. Macular Segmentation with Optical Coherence Tomography. Invest Ophthalmol Vis Sci 2005, 46, 2012–2017. [Google Scholar] [CrossRef]
- Ahlers, C.; Golbaz, I.; Stock, G.; Fous, A.; Kolar, S.; Pruente, C.; Schmidt-Erfurth, U. Time Course of Morphologic Effects on Different Retinal Compartments after Ranibizumab Therapy in Age-Related Macular Degeneration. Ophthalmology 2008, 115, e39–e46. [Google Scholar] [CrossRef]
- Mylonas, G.; Ahlers, C.; Malamos, P.; Golbaz, I.; Deak, G.; Schütze, C.; Sacu, S.; Schmidt-Erfurth, U. Comparison of Retinal Thickness Measurements and Segmentation Performance of Four Different Spectral and Time Domain OCT Devices in Neovascular Age-Related Macular Degeneration. British Journal of Ophthalmology 2009, 93, 1453–1460. [Google Scholar] [CrossRef]
- Liu, Y.Y.; Chen, M.; Ishikawa, H.; Wollstein, G.; Schuman, J.S.; Rehg, J.M. Automated Macular Pathology Diagnosis in Retinal OCT Images Using Multi-Scale Spatial Pyramid and Local Binary Patterns in Texture and Shape Encoding. Med Image Anal 2011, 15, 748–759. [Google Scholar] [CrossRef] [PubMed]
- Goodman, J.W. Some Fundamental Properties of Speckle*. JOSA Vol. 66(Issue 11 66), pp. 1145-1150 1976 1145–1150. [CrossRef]
- Mehdizadeh, M.; MacNish, C.; Xiao, D.; Alonso-Caneiro, D.; Kugelman, J.; Bennamoun, M. Deep Feature Loss to Denoise OCT Images Using Deep Neural Networks. J Biomed Opt 2021, 26, 046003. [Google Scholar] [CrossRef]
- Li, F.; Wu, Q.; Jia, B.; Yang, Z. Speckle Noise Removal in OCT Images via Wavelet Transform and DnCNN. Applied Sciences 2025, Vol. 15 15, 6557 2025 6557. [Google Scholar] [CrossRef]
- Bepery, C.; Rahaman, G.M.A.; Debnath, R.; Saha, S. Forward Autoencoder Approach for Denoising Retinal OCT Images. 2025 International Conference on Electrical, Computer and Communication Engineering, ECCE, 2025 2025. [Google Scholar] [CrossRef]
- Ahmed, H.; Zhang, Q.; Donnan, R.; Alomainy, A. Transformer Enhanced Autoencoder Rendering Cleaning of Noisy Optical Coherence Tomography Images. Journal of Medical Imaging 2024, 11, 34008. [Google Scholar] [CrossRef]
- Özkan, A.; Stoykova, E.; Sikora, T.; Madjarova, V. Denoising OCT Images Using Steered Mixture of Experts with Multi-Model Inference. arXiv 2024, arXiv:2402.12735. [Google Scholar] [CrossRef]
- Weigert, M.; Schmidt, U.; Boothe, T.; Müller, A.; Dibrov, A.; Jain, A.; Wilhelm, B.; Schmidt, D.; Broaddus, C.; Culley, S.; et al. Content-Aware Image Restoration: Pushing the Limits of Fluorescence Microscopy. Nature Methods 2018, 15:12 15, 1090–1097. [Google Scholar] [CrossRef] [PubMed]
- Download NAVIS-EX by NIDEK CO., LTD. Available online: https://navis-ex.software.informer.com/download/ (accessed on 7 November 2025).
- RS-330 - NIDEK France. Available online: https://www.nidek.fr/en/oct-angiographie/rs-330/ (accessed on 16 December 2025).
- RS-3000 Advance 2 - NIDEK France. Available online: https://www.nidek.fr/en/oct-angiographie/rs-3000-advance-2/ (accessed on 16 December 2025).
- RS-330 Manual| ManualsLib. Available online: https://www.manualslib.com/manual/3952363/Nidek-Medical-Rs-330.html#manual (accessed on 16 December 2025).
- Hee, M.R.; Izatt, J.A.; Swanson, E.A.; Huang, D.; Schuman, J.S.; Lin, C.P.; Puliafito, C.A.; Fujimoto, J.G. Optical Coherence Tomography of the Human Retina. Archives of Ophthalmology 1995, 113, 325–332. [Google Scholar] [CrossRef]
- Ting, D.S.W.; Cheung, C.Y.L.; Lim, G.; Tan, G.S.W.; Quang, N.D.; Gan, A.; Hamzah, H.; Garcia-Franco, R.; Yeo, I.Y.S.; Lee, S.Y.; et al. Development and Validation of a Deep Learning System for Diabetic Retinopathy and Related Eye Diseases Using Retinal Images From Multiethnic Populations With Diabetes. JAMA 2017, 318, 2211–2223. [Google Scholar] [CrossRef]
- Landis, J.R.; Koch, G.G. The Measurement of Observer Agreement for Categorical Data. Biometrics 1977, 33, 159. [Google Scholar] [CrossRef] [PubMed]
- Network, D.R.C.R. Relationship between Optical Coherence Tomography–Measured Central Retinal Thickness and Visual Acuity in Diabetic Macular Edema. Ophthalmology 2007, 114, 525–536. [Google Scholar] [CrossRef]
- Chiu, S.J.; Li, X.T.; Nicholas, P.; Izatt, J.A.; Toth, C.A.; Chiu, S.J.; Farsiu, S. Automatic Segmentation of Seven Retinal Layers in SDOCT Images Congruent with Expert Manual Segmentation. Optics Express Vol. 18(Issue 18 18), pp. 19413-19428 2010 19413–19428. [CrossRef]
- Garvin, M.K.; Abràmoff, M.D.; Wu, X.; Russell, S.R.; Burns, T.L.; Sonka, M. Automated 3-D Intraretinal Layer Segmentation of Macular Spectral-Domain Optical Coherence Tomography Images. IEEE Trans Med Imaging 2009, 28, 1436–1447. [Google Scholar] [CrossRef] [PubMed]
- Goodman, J.W. Statistical Properties of Laser Speckle Patterns; 1975; pp. 9–75. [Google Scholar] [CrossRef]
- Schmitt, J.M.; Xiang, S.H.; Yung, K.M. Speckle in Optical Coherence Tomography. J Biomed Opt 1999, 4, 95–105. [Google Scholar] [CrossRef] [PubMed]
- Fang, L.; Li, S.; McNabb, R.P.; Nie, Q.; Kuo, A.N.; Toth, C.A.; Izatt, J.A.; Farsiu, S. Fast Acquisition and Reconstruction of Optical Coherence Tomography Images via Sparse Representation. IEEE Trans Med Imaging 2013, 32, 2034–2049. [Google Scholar] [CrossRef] [PubMed]
- Liu, Z.; Lin, Y.; Cao, Y.; Hu, H.; Wei, Y.; Zhang, Z.; Lin, S.; Guo, B. Swin Transformer: Hierarchical Vision Transformer Using Shifted Windows. In Proceedings of the Proceedings of the IEEE/CVF international conference on computer vision, 2021; pp. 10012–10022. [Google Scholar]
- Hatamizadeh, A.; Tang, Y.; Nath, V.; Yang, D.; Myronenko, A.; Landman, B.; Roth, H.R.; Xu, D. Unetr: Transformers for 3d Medical Image Segmentation. In Proceedings of the Proceedings of the IEEE/CVF winter conference on applications of computer vision, 2022; pp. 574–584. [Google Scholar]
- Lehtinen, J.; Munkberg, J.; Hasselgren, J.; Laine, S.; Karras, T.; Aittala, M.; Aila, T. Noise2Noise: Learning Image Restoration without Clean Data. 35th International Conference on Machine Learning, ICML 2018 2018, 7, 4620–4631. [Google Scholar]
- Krull, A.; Buchholz, T.-O.; Jug, F. Noise2Void - Learning Denoising From Single Noisy Images. 2019, 2129–2137. [Google Scholar]
- Batson, J.; Royer, L. Noise2Self: Blind Denoising by Self-Supervision 2019, 524–533.
- Zhao, H.; Gallo, O.; Frosio, I.; Kautz, J. Loss Functions for Image Restoration With Neural Networks. IEEE Trans Comput Imaging 2017, 3, 47–57. [Google Scholar] [CrossRef]
- Goodfellow, I.; Bengio, Y.; Courville, A.; Bengio, Y. Deep Learning; MIT press: Cambridge, 2016; Vol. 1. [Google Scholar]
- Perona, P.; Malik, J. Scale-Space and Edge Detection Using Anisotropic Diffusion. IEEE Trans Pattern Anal Mach Intell 1990, 12, 629–639. [Google Scholar] [CrossRef]
- Sobel, I.; Feldman, G. A 3×3 Isotropic Gradient Operator for Image Processing; Stanford Artificial Intelligence Project (SAIL): Stanford, CA, USA, 1968. [Google Scholar]
- Shannon, C.E. A Mathematical Theory of Communication. The Bell system technical journal 1948, 27, 379–423. [Google Scholar] [CrossRef]
- Wang, Z.; Bovik, A.C. Mean Squared Error: Love It or Leave It? A New Look at Signal Fidelity Measures. IEEE Signal Process Mag 2009, 26, 98–117. [Google Scholar] [CrossRef]
Figure 2.
Structure-Preserving Volumetric Restoration Network- (a) Architecture Diagram; (b) Training Workflow; (c) Inference Workflow (Volume denoising); (d) Full Pipeline; (e) Denoising and Preprocessing Diagram.
Figure 2.
Structure-Preserving Volumetric Restoration Network- (a) Architecture Diagram; (b) Training Workflow; (c) Inference Workflow (Volume denoising); (d) Full Pipeline; (e) Denoising and Preprocessing Diagram.
Figure 3.
Training convergence curve of the Self-Supervised Volumetric Restoration Network.
Figure 4.
FFSwin backbone Self-Supervised denoise autoencoder- (a) Overall Denoising Pipeline; (b) Self-Supervised Training Flowchart; (c) Encoder Architecture.
Figure 4.
FFSwin backbone Self-Supervised denoise autoencoder- (a) Overall Denoising Pipeline; (b) Self-Supervised Training Flowchart; (c) Encoder Architecture.
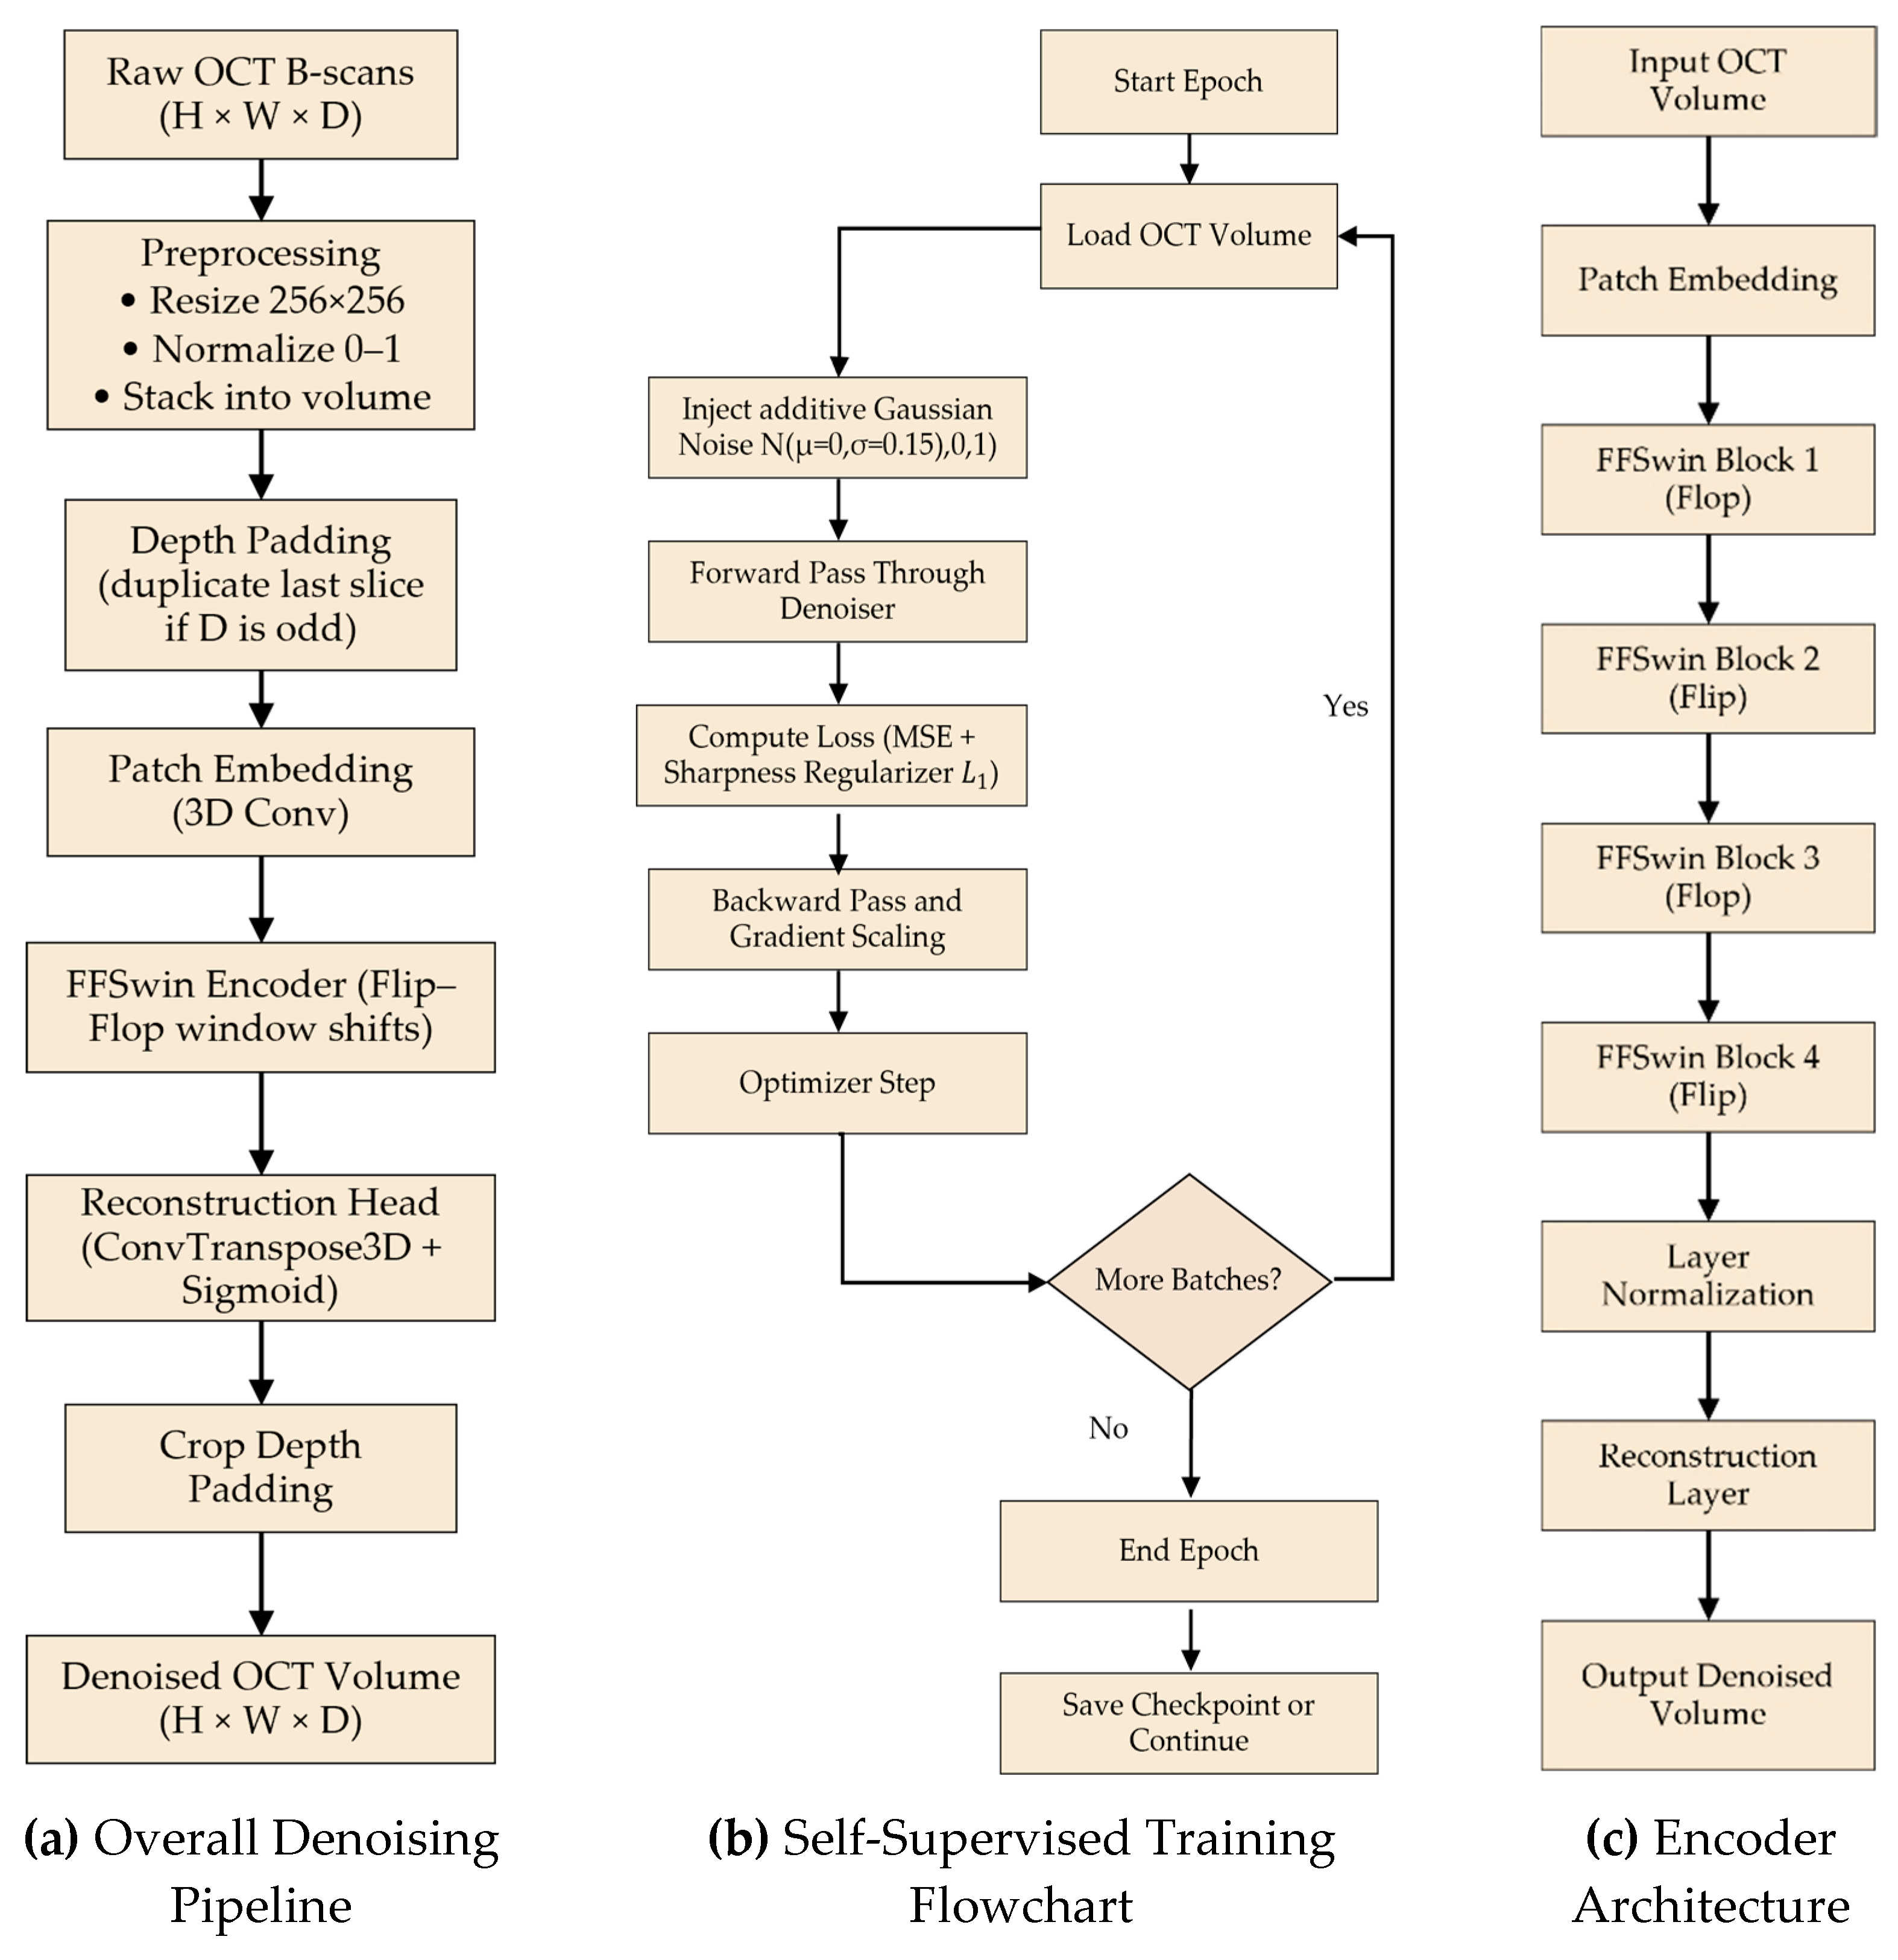
Figure 5.
Performance comparison of FFSwin denoising autoencoder- (a) Confusion matrix for denoised (clean) BanglaOCT2025; (b) Confusion matrix for raw (noisy) BanglaOCT2025.
Figure 5.
Performance comparison of FFSwin denoising autoencoder- (a) Confusion matrix for denoised (clean) BanglaOCT2025; (b) Confusion matrix for raw (noisy) BanglaOCT2025.
Figure 6.
Patient-level Diagnostic Impact of Denoising- (a) Patient-level “before → after” correctness heatmap; (b) Forest plot: Improvement vs. Degradation.
Figure 6.
Patient-level Diagnostic Impact of Denoising- (a) Patient-level “before → after” correctness heatmap; (b) Forest plot: Improvement vs. Degradation.
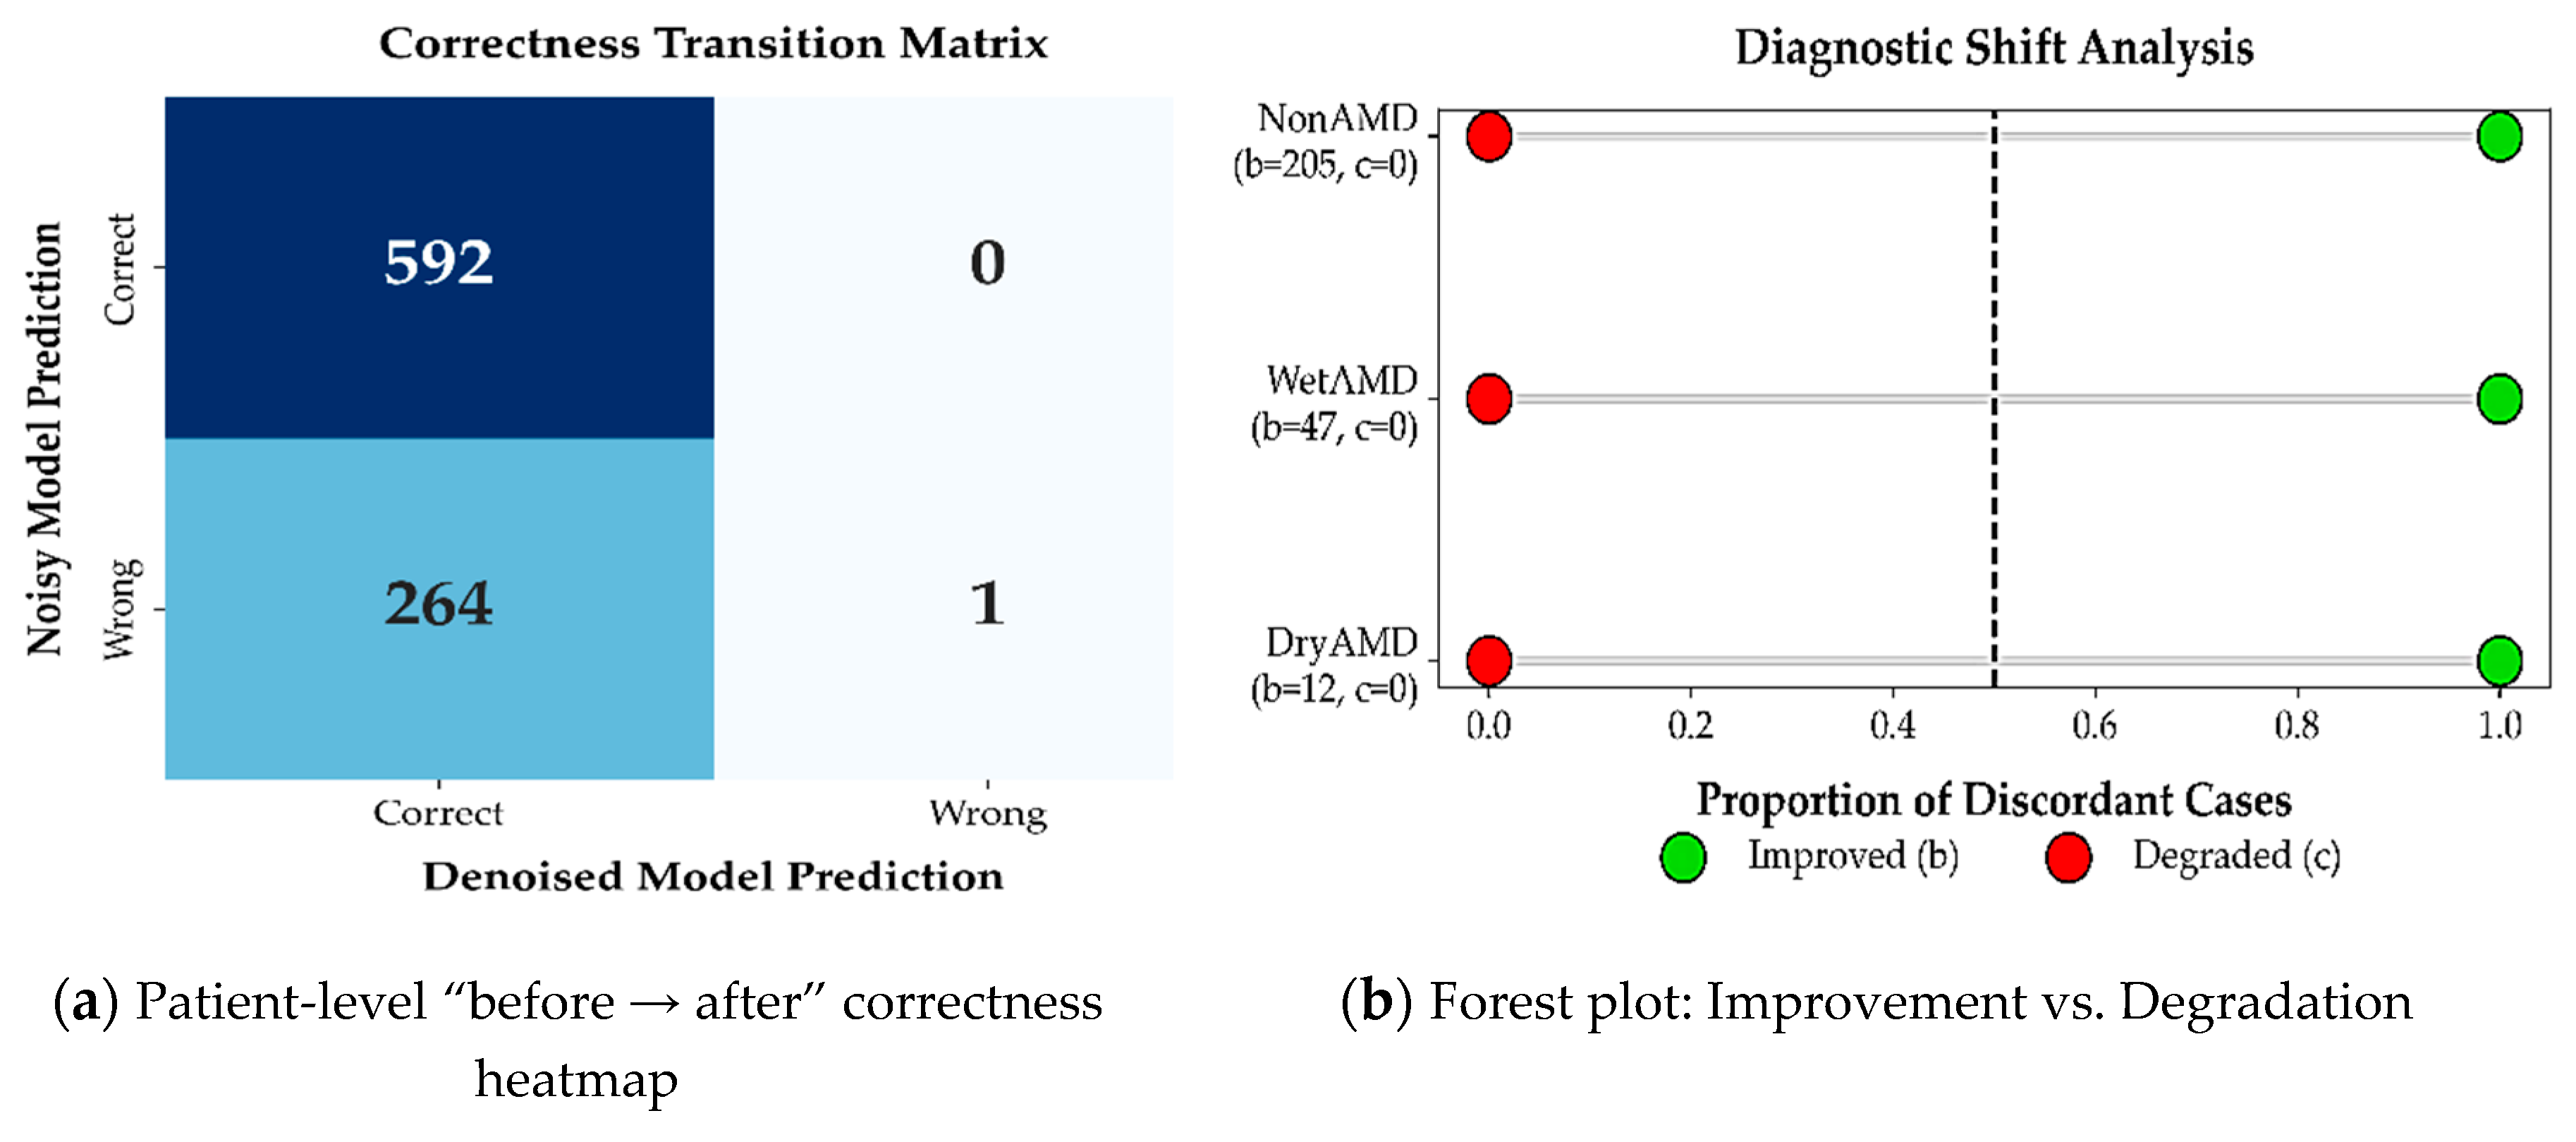
Figure 7.
Class-wise boxplots of the four reference-free metrics.
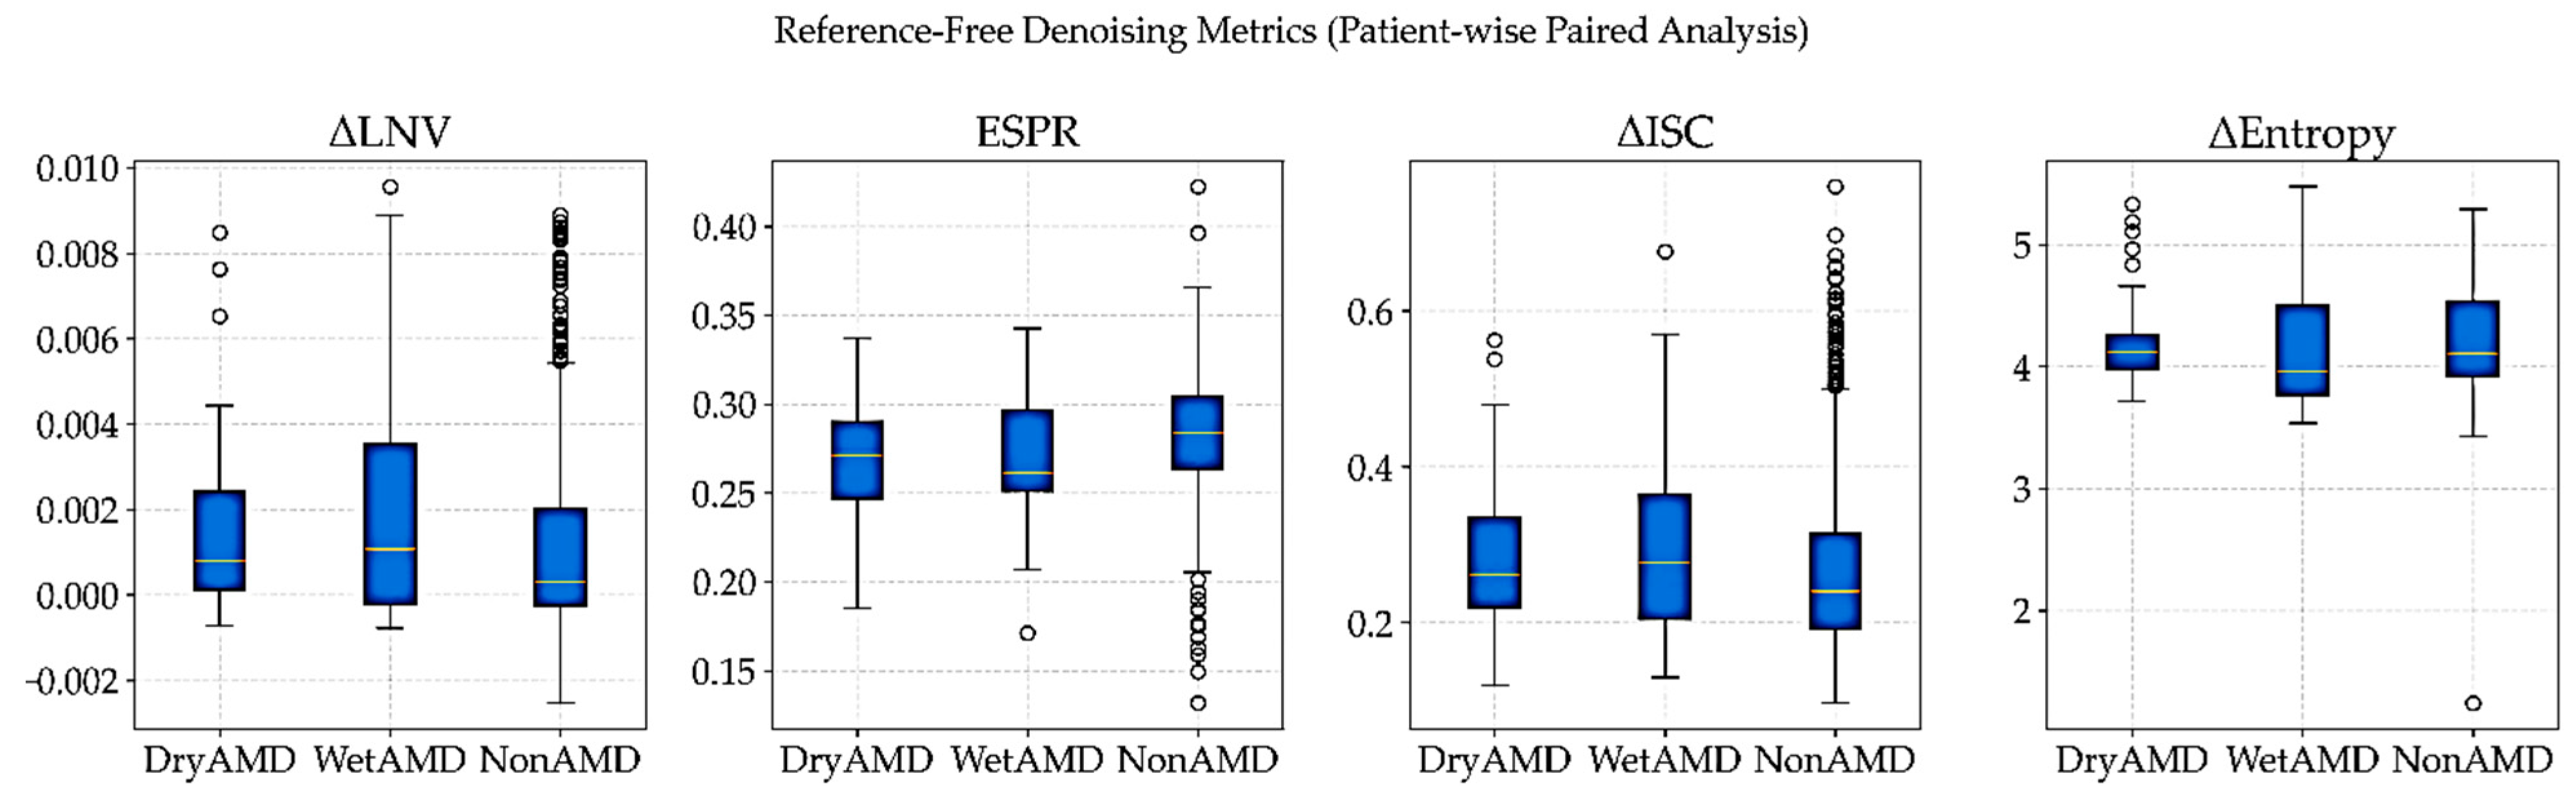
Figure 8.
Qualitative denoising results for a DryAMD case.
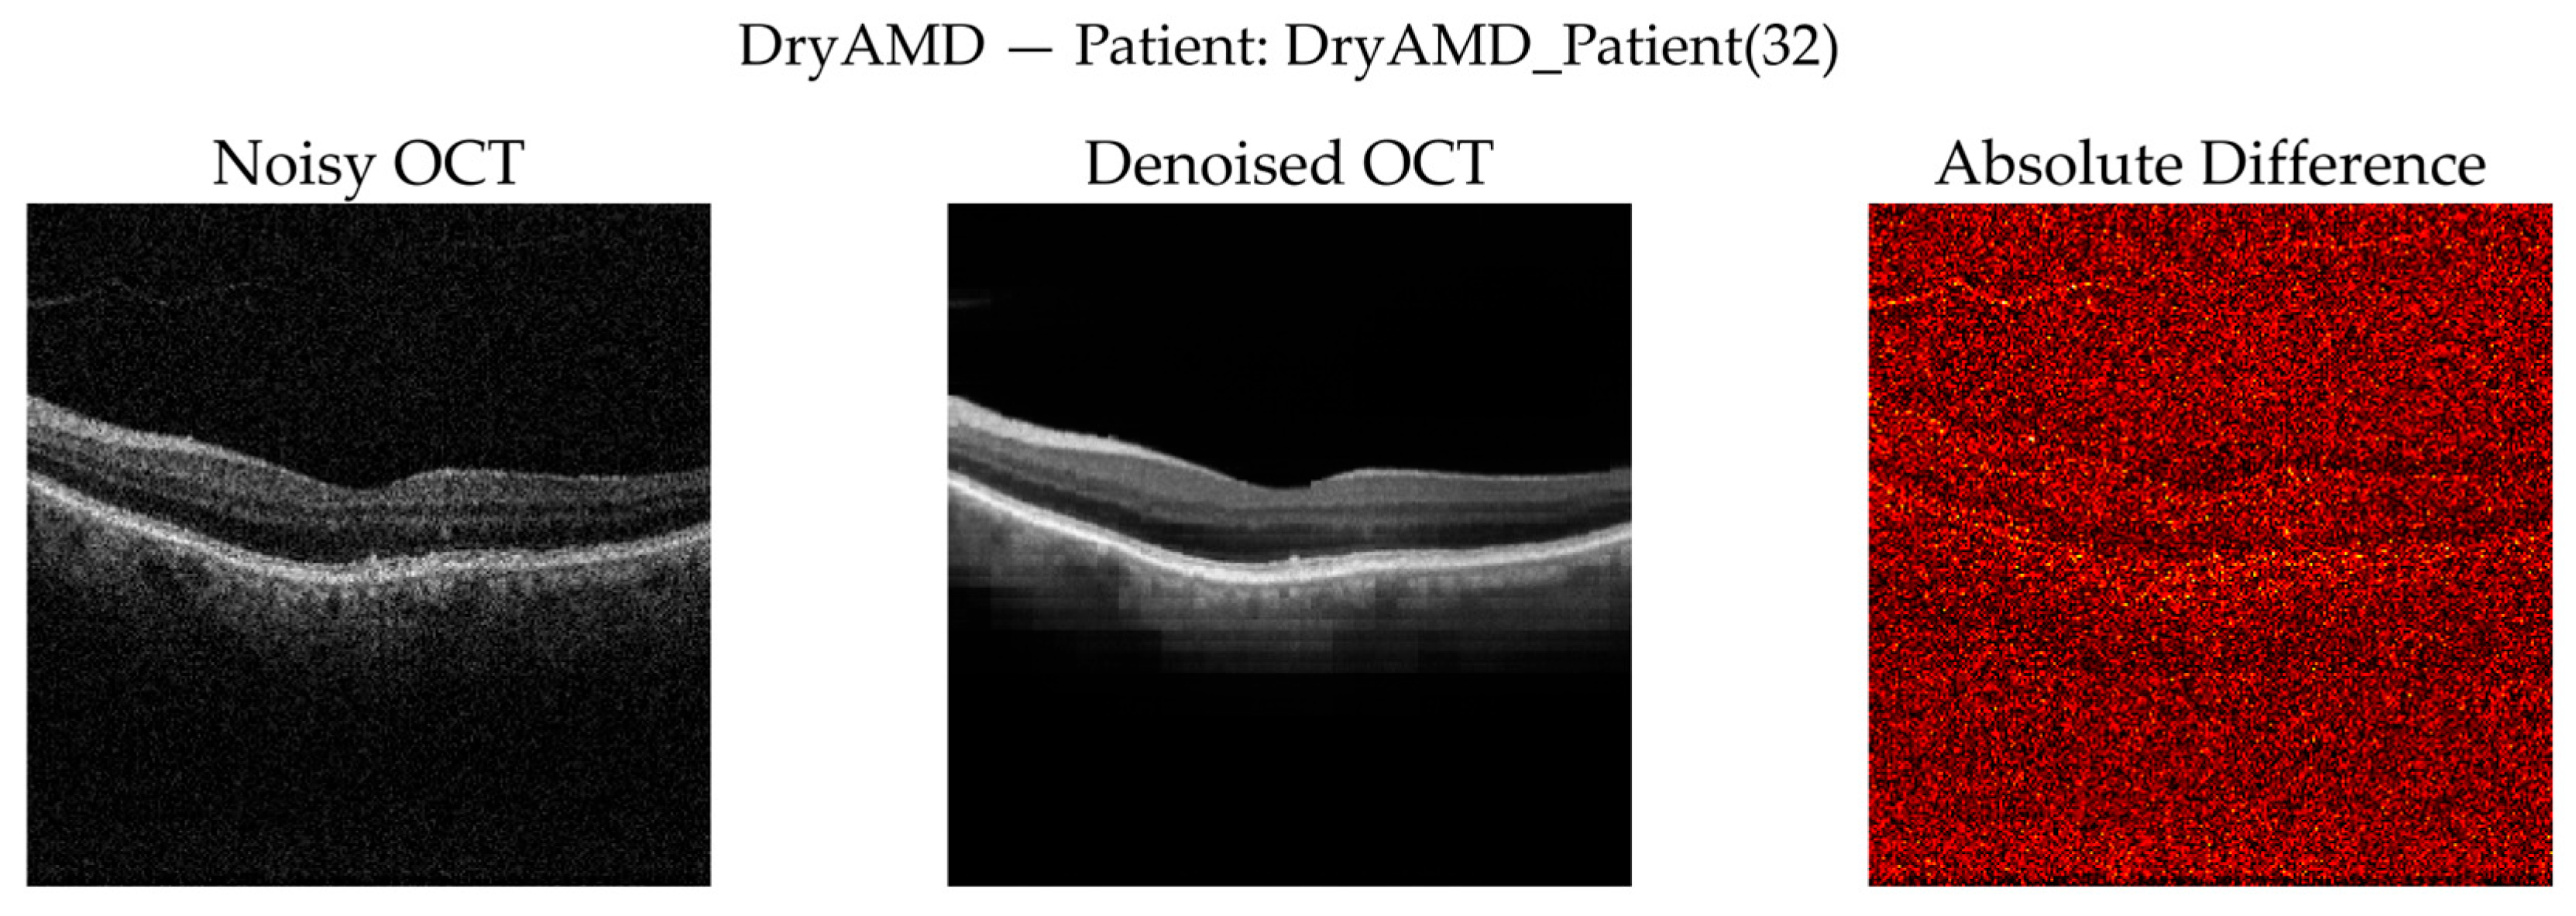
Figure 9.
Zoomed retinal region of interest (ROI) for the DryAMD case.
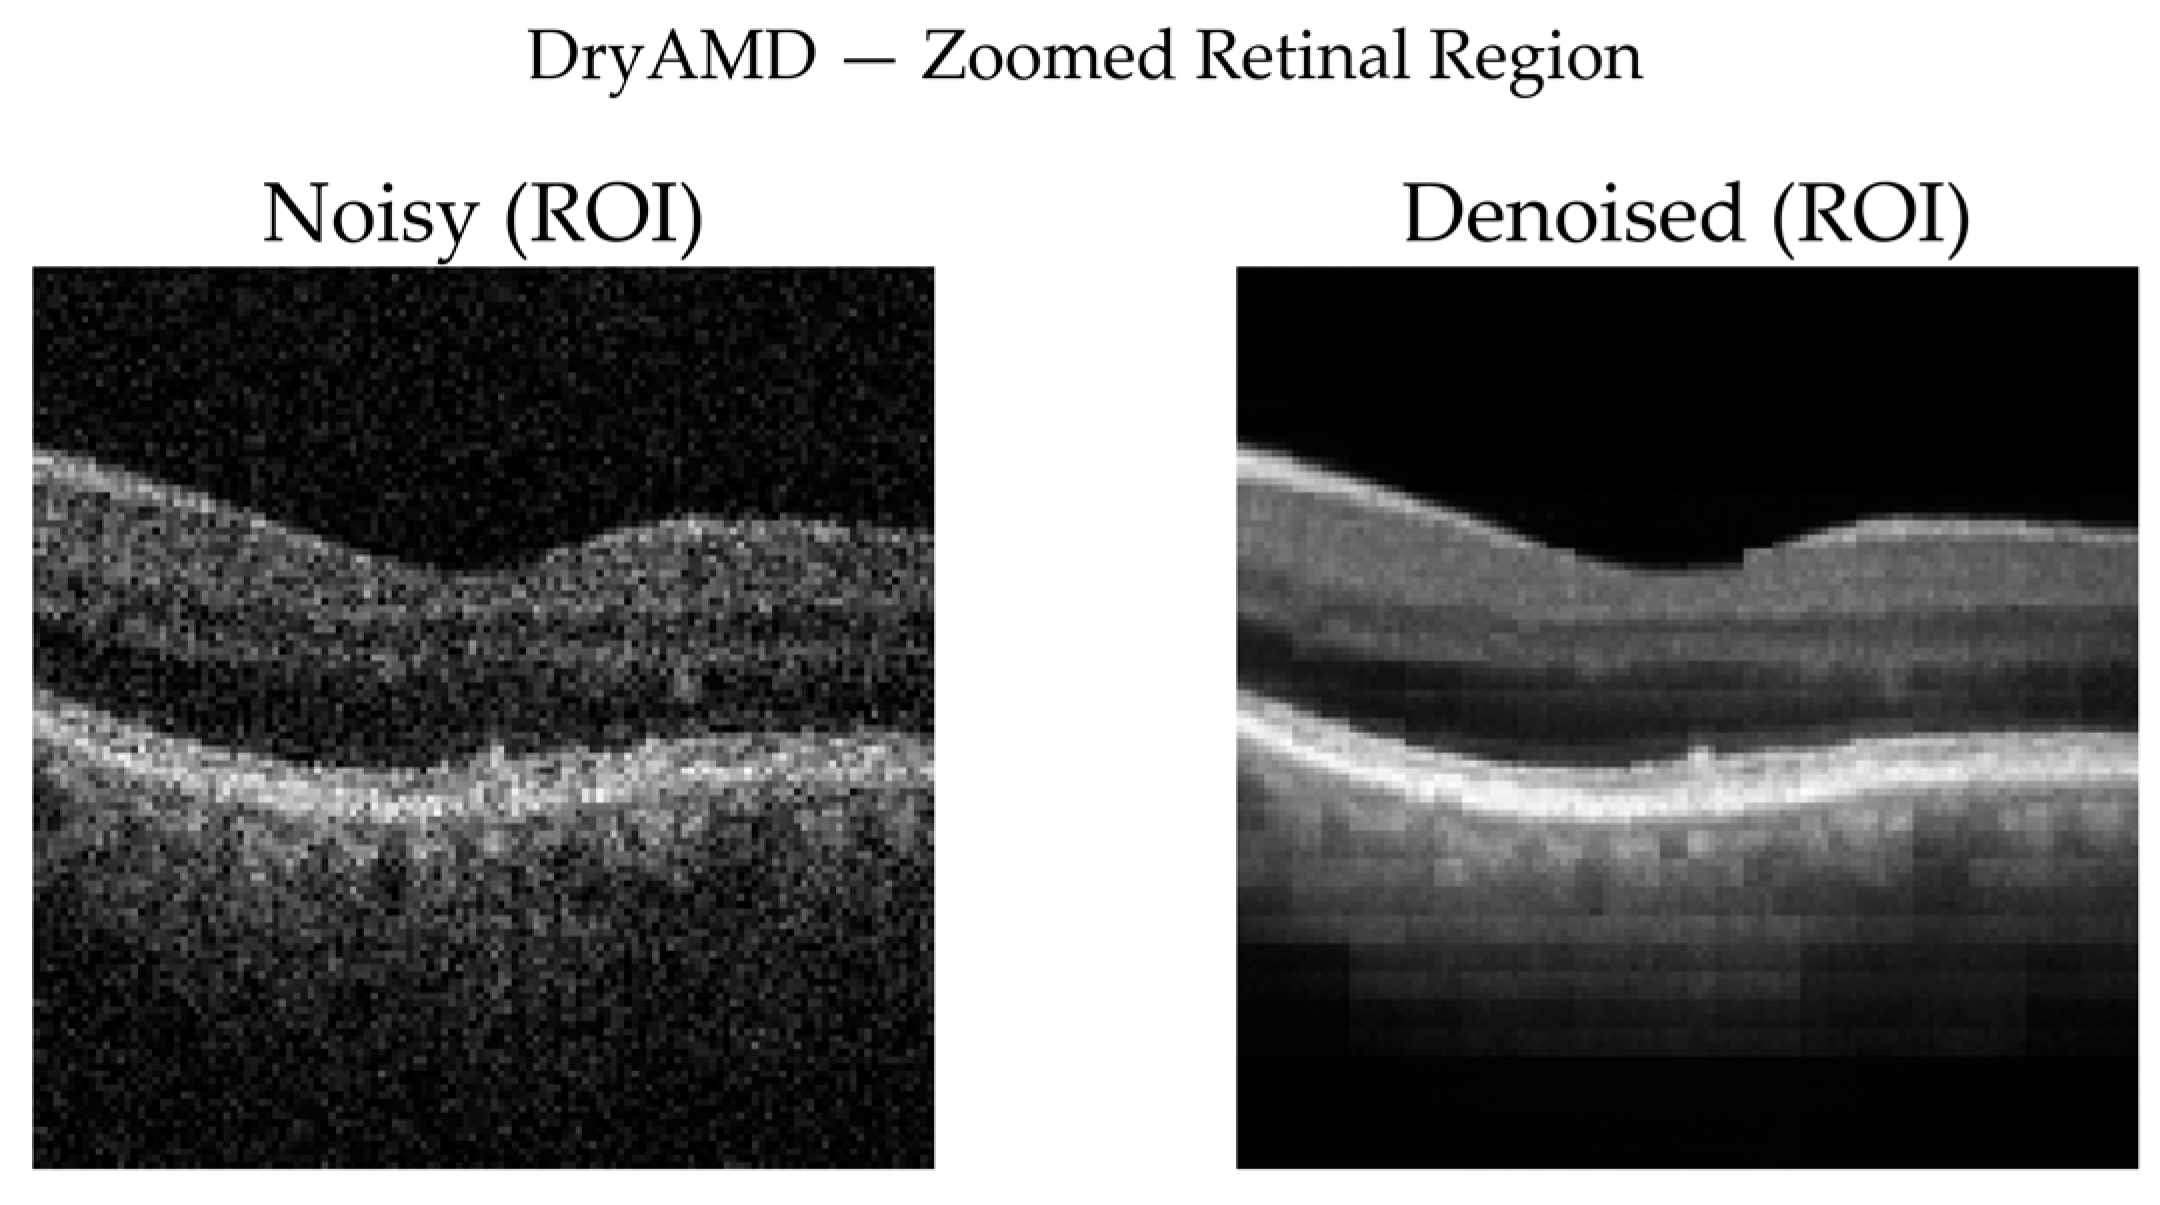
Figure 10.
Qualitative denoising results for a NonAMD case.
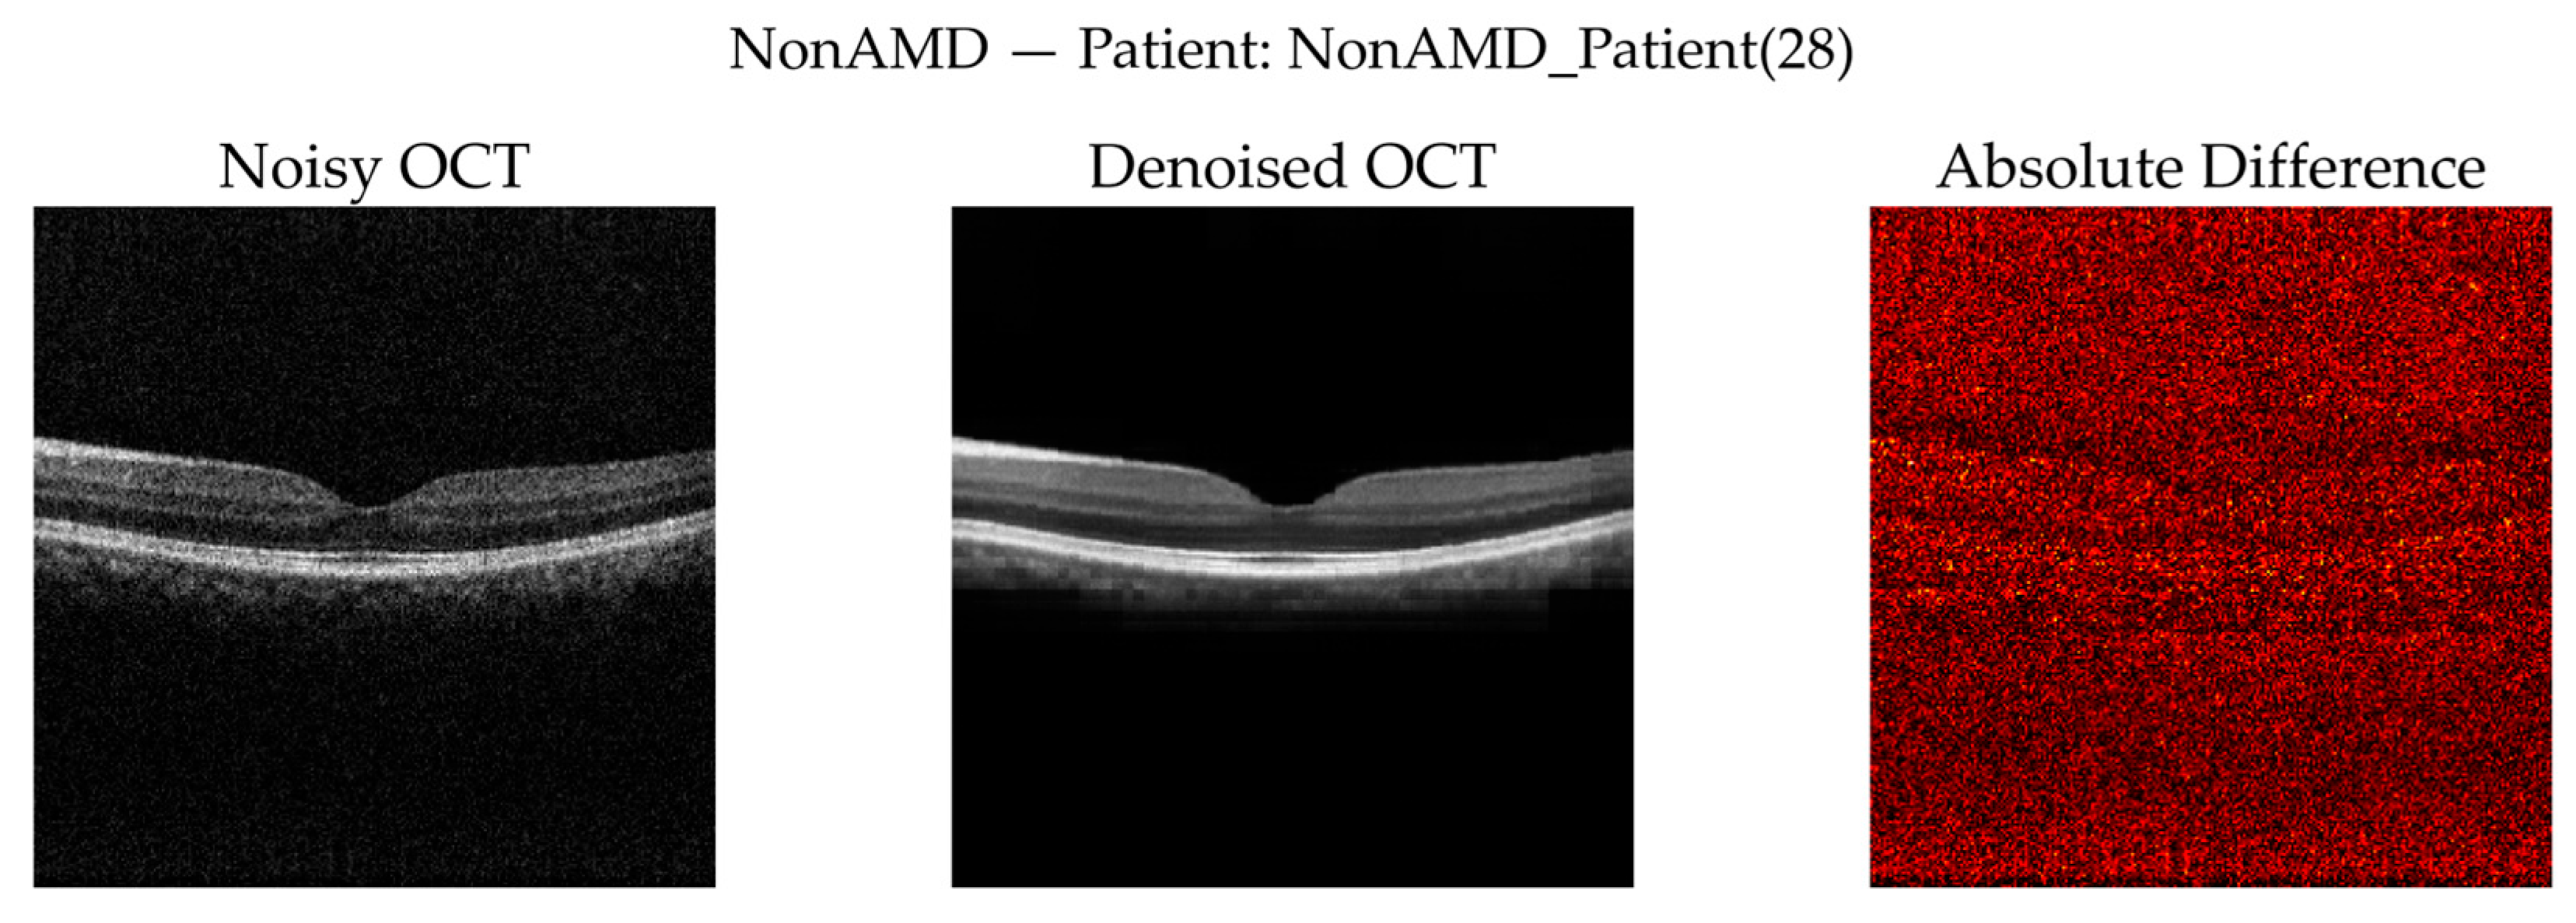
Figure 11.
Zoomed retinal region of interest (ROI) for the NonAMD case.
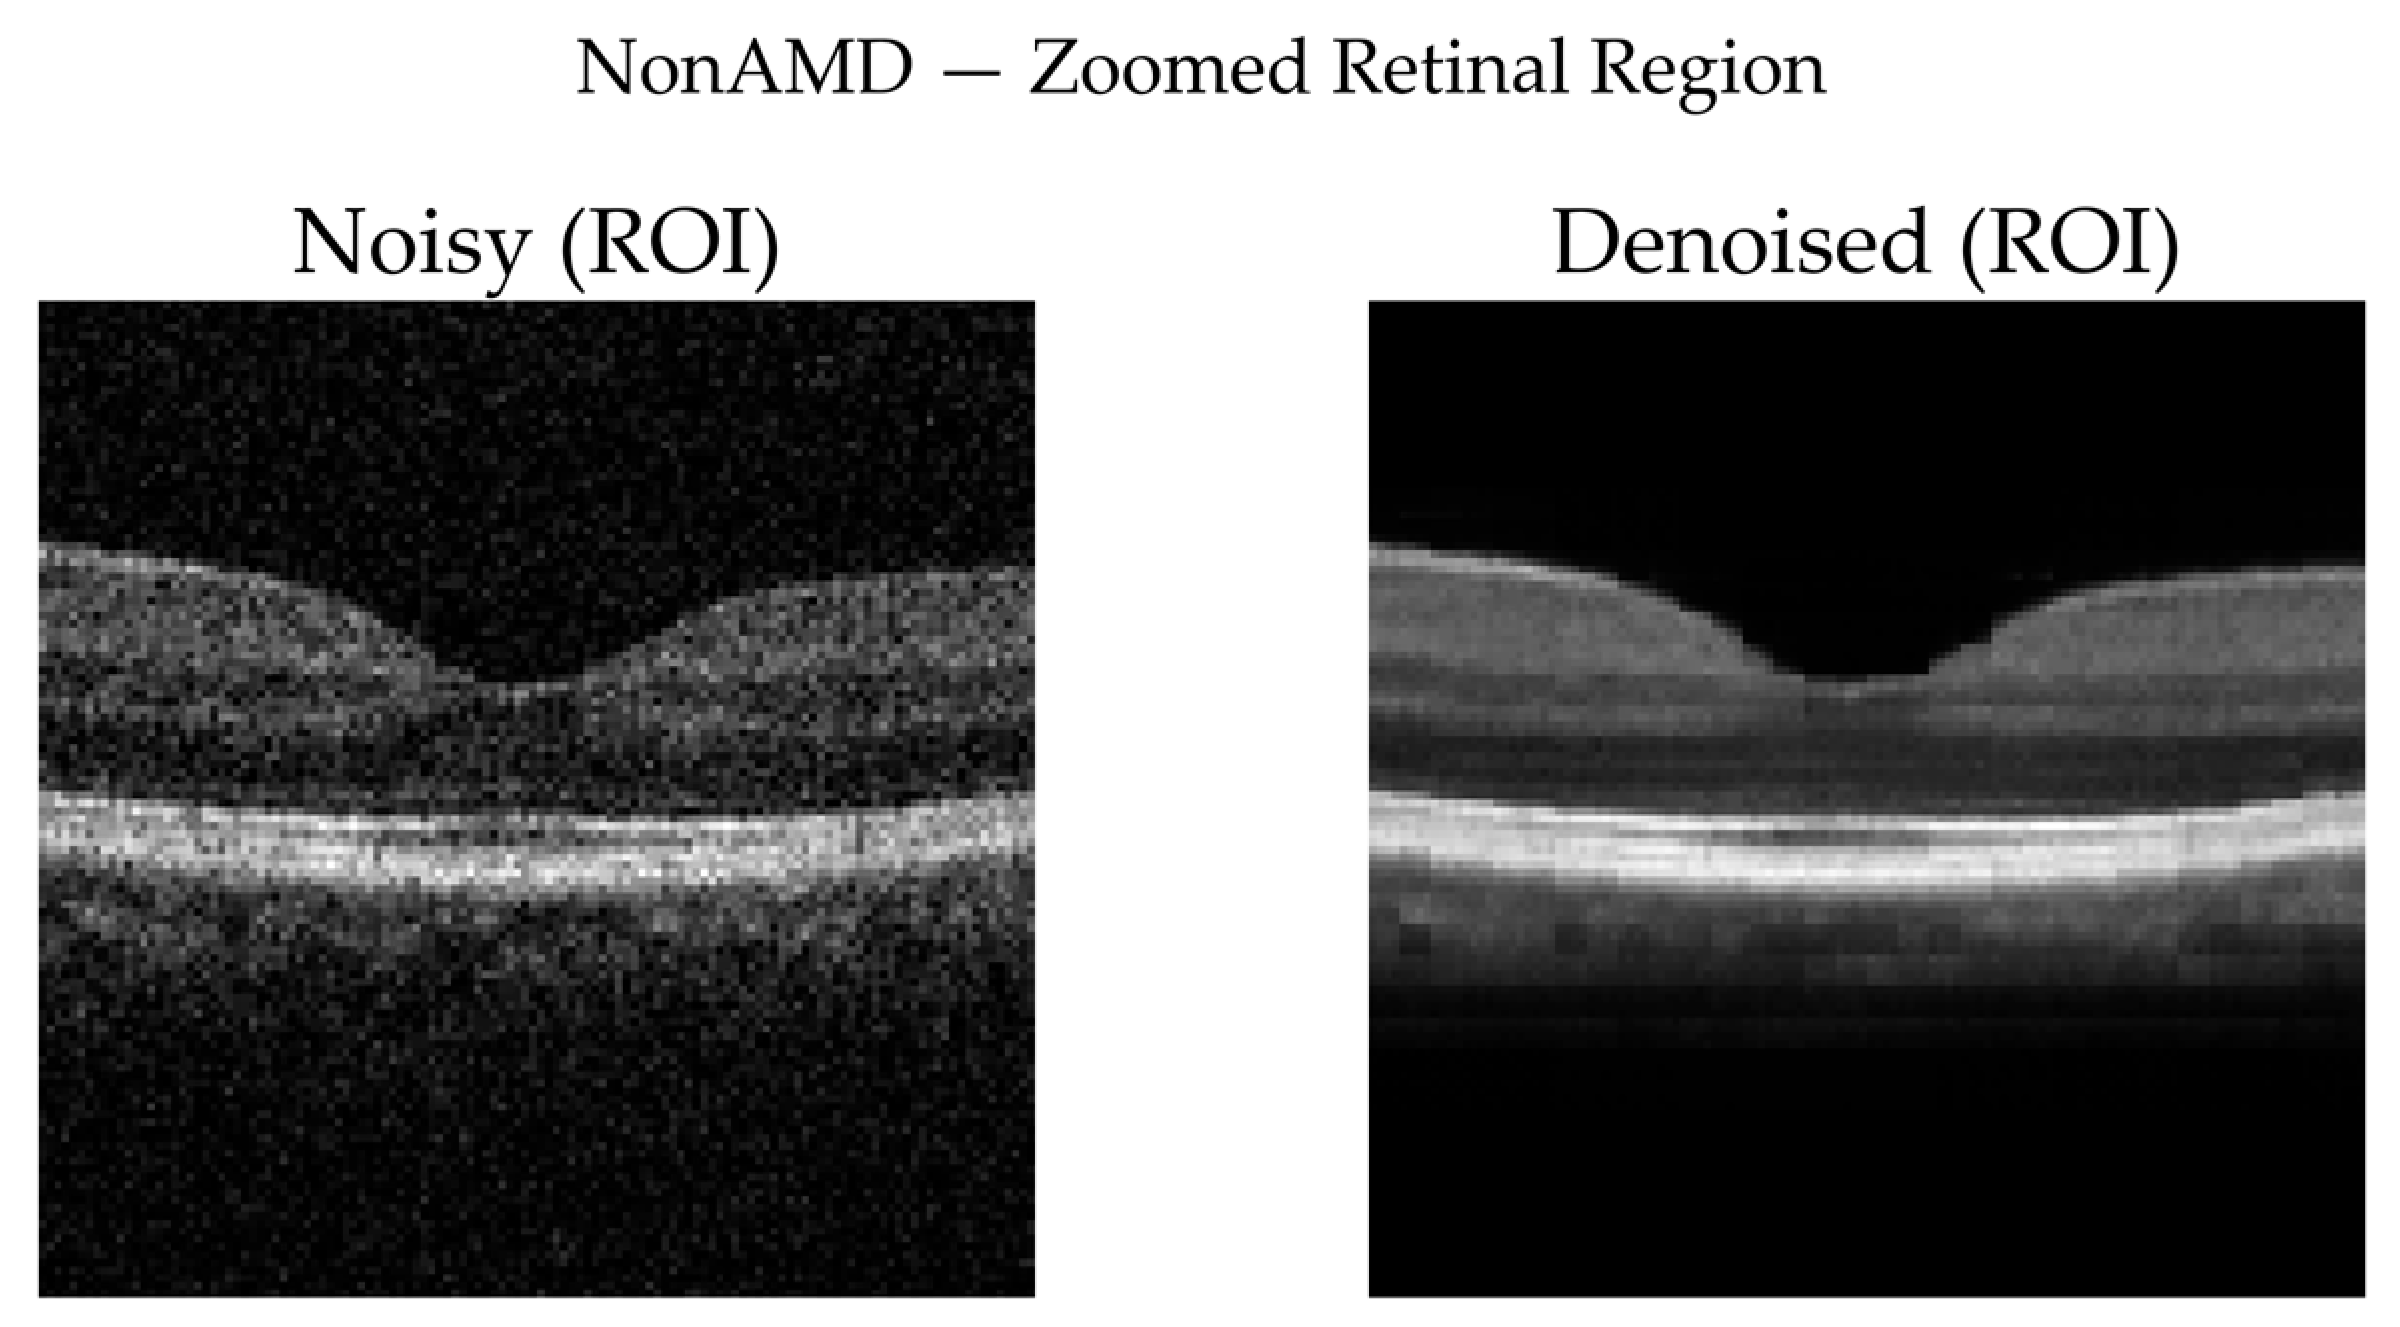
Figure 12.
Qualitative denoising results for a WetAMD case.
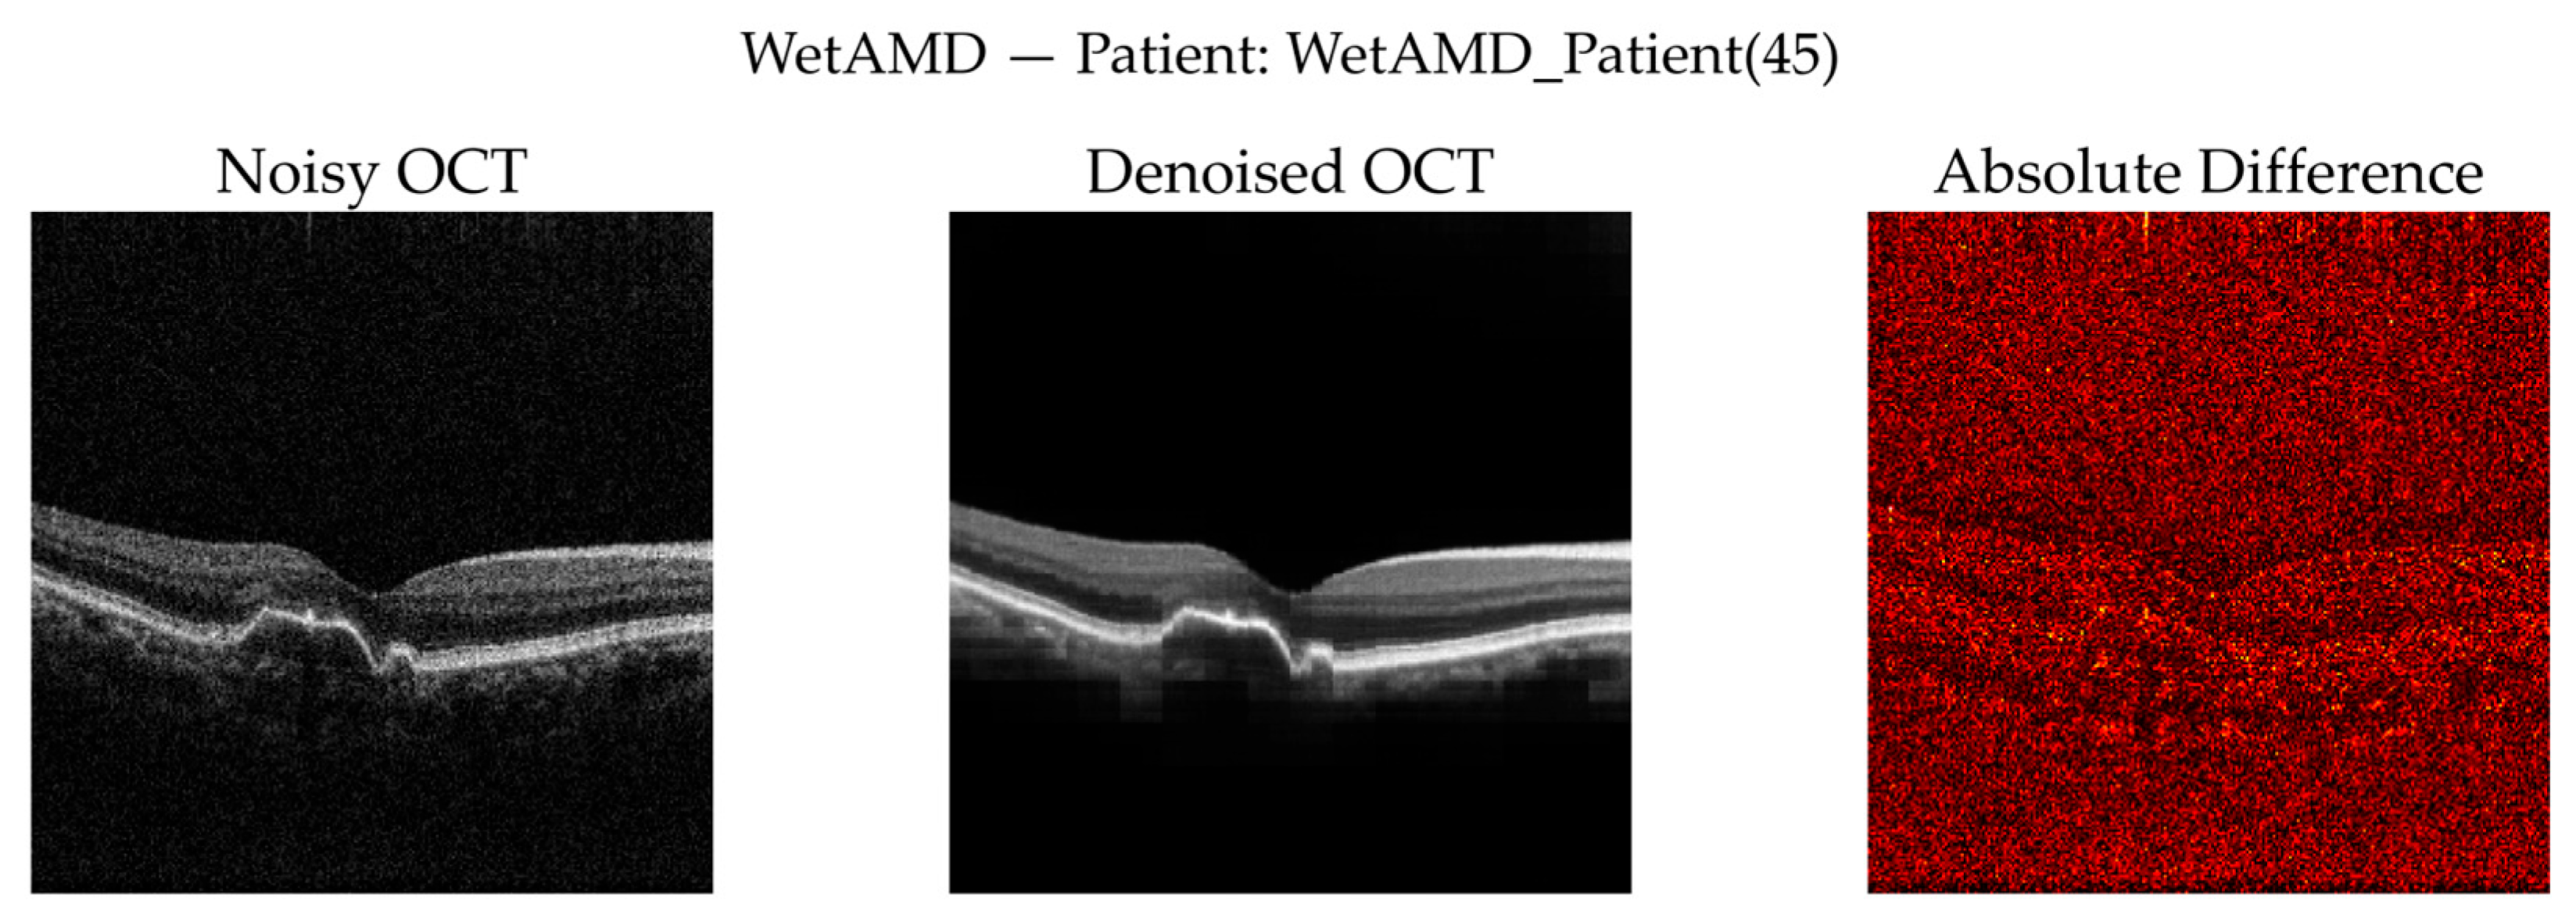
Figure 13.
Zoomed retinal region of interest (ROI) for the WetAMD case.
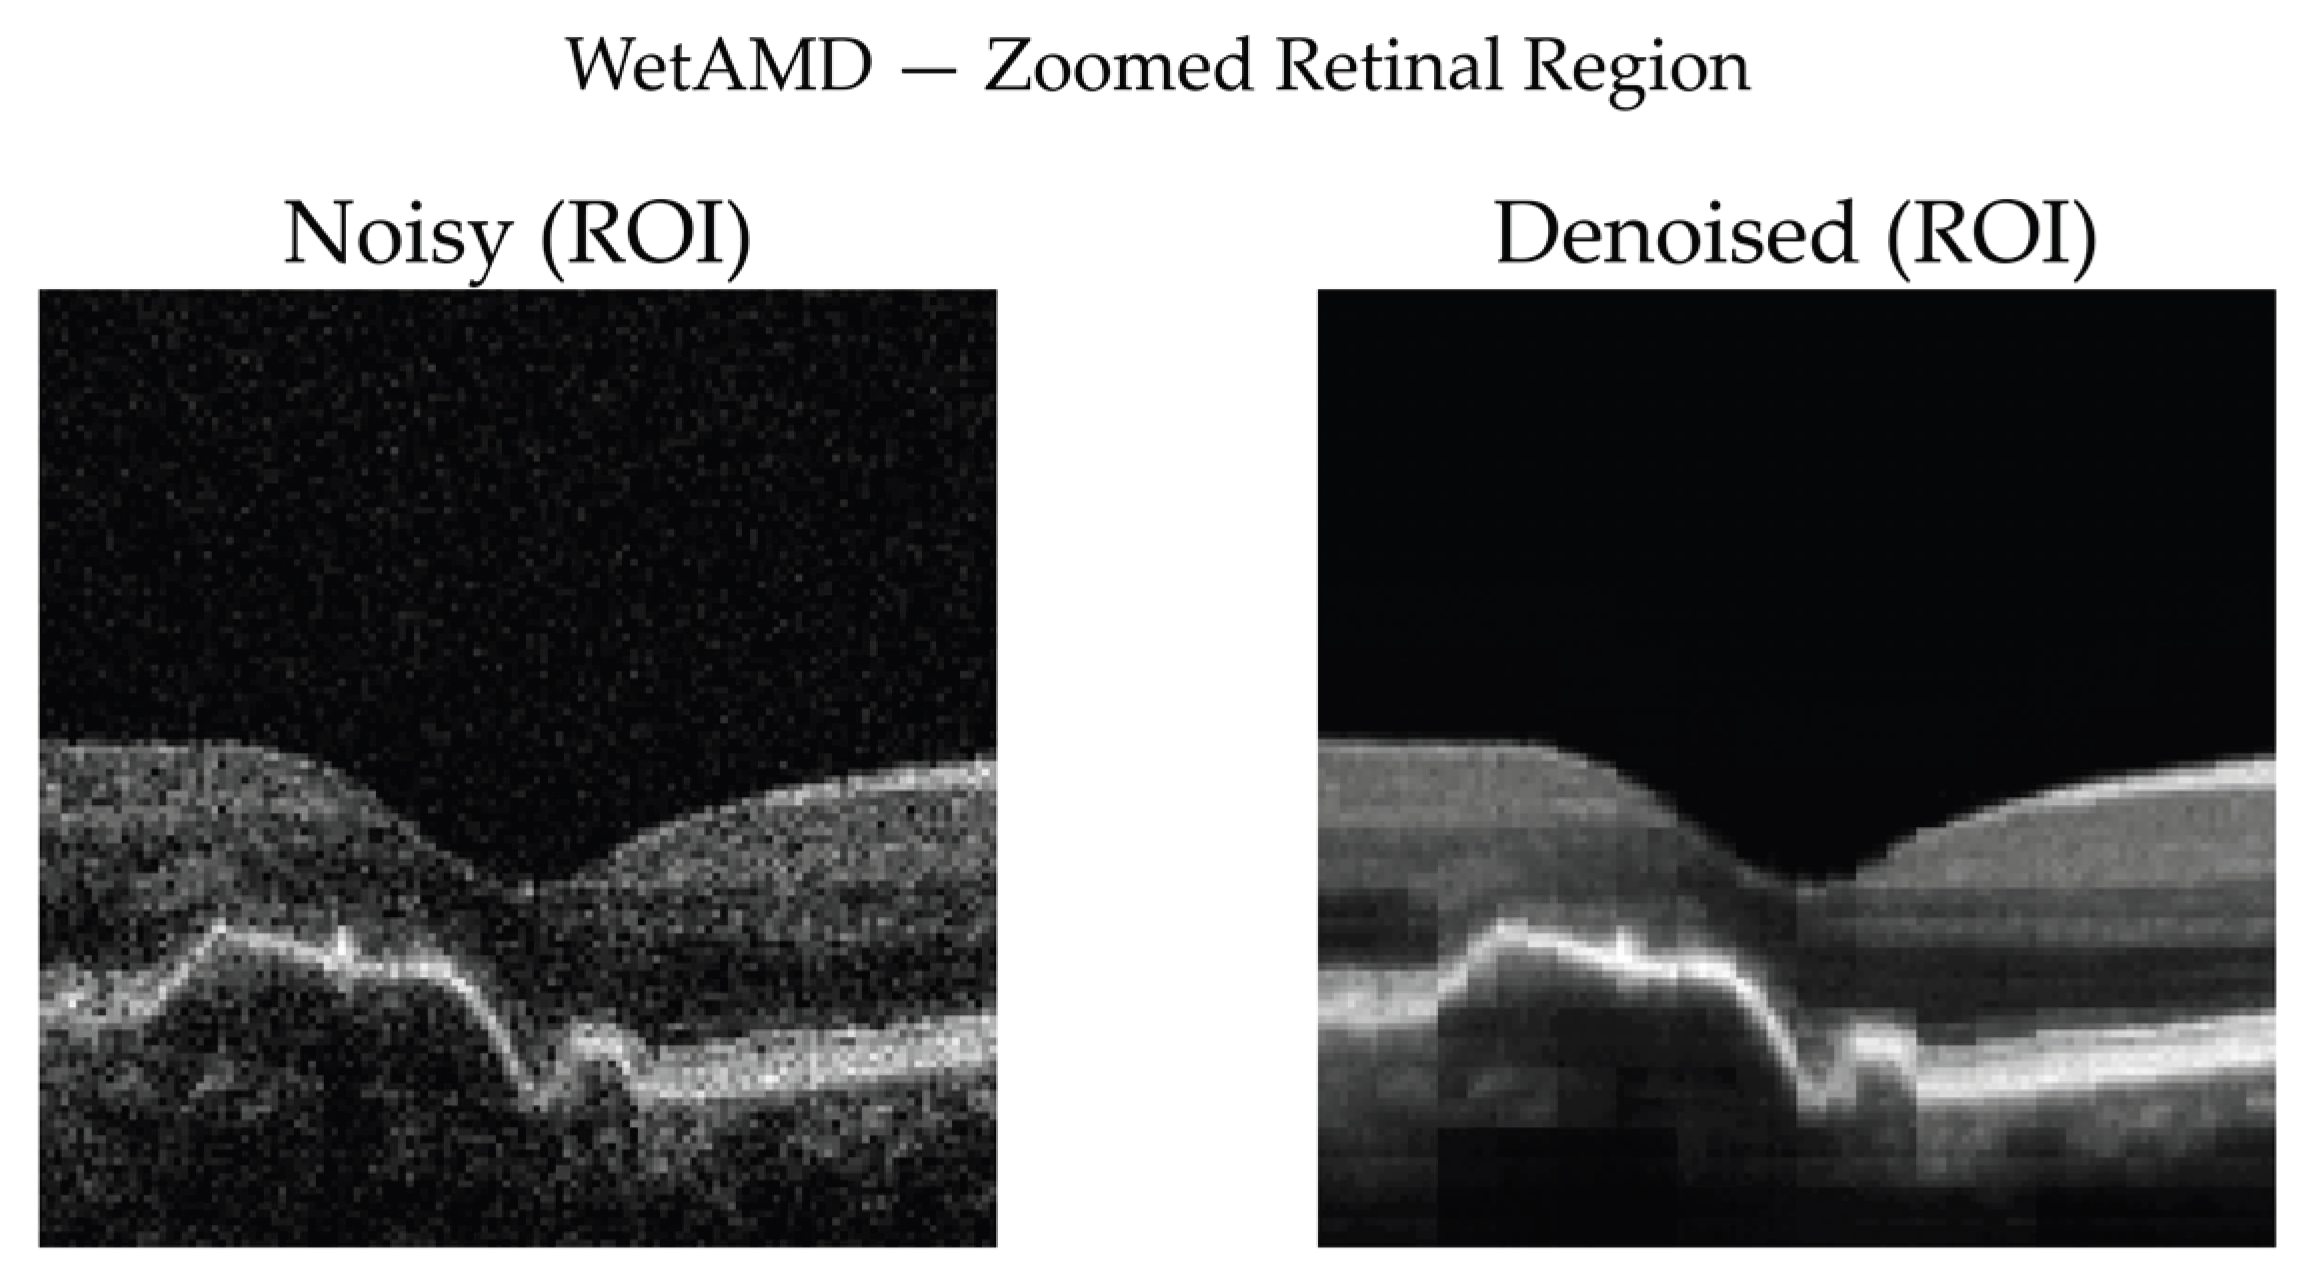
Table 1.
Collected retrospective OCT scans from NIOH.
| OCT Machine Model | Patients in NAVIS-EX* | Valid Patients | Valid Scans** | Scans for BanglaOCT2025 | Slices in BanglaOCT2025 |
|---|---|---|---|---|---|
| Nidek RS-330 Duo 2 | 1071 | 738 | 1128 | 1147 | 146816 |
| Nidek RS-3000 Advance | 348 | 333 | 530 | 438 | 56064 |
| Total | 1419 | 1071 | 1658 | 1585 | 202880 |
* For this research purpose, we have used trial version of this software (NAVIS-EX software by NIDEK CO., LTD., n.d.). Some scans corresponded to invalid or empty image folders. ** Patient may need to scan both eyes or multi scans per eye.
Table 2.
Summary of the “BanglaOCT2025”.
| Particulars | Quantity |
|---|---|
| Total patients | 1419 |
| Valid patients | 1071 |
| Scans from both eyes or multi scans from single eye | 1658 |
| Discard scans due to image acquisition issues | 73 |
| Considered scans for BanglaOCT2025 | 1585 |
| Considered 2D OCT slices for BanglaOCT2025 | 202880 |
| Patients for ground truth labelling in BanglaOCT2025 | 573 |
| Scans in BanglaOCT2025 without ground truth labelling | 728 |
| Scans for doctor labelling in BanglaOCT2025 | 857 |
| Dry AMD | 54 |
| Wet AMD | 61 |
| Non-AMD | 742 |
Table 3.
Age-wise patient distribution and ground truth labelling.
| Age Range | No. of Patients | Ground Truth Labelled 573 Patients | ||
|---|---|---|---|---|
| No. of Patients | Dry AMD | Wet AMD | ||
| 5-10.5 | 6 | 0 | 0 | 0 |
| 11-20.5 | 45 | 0 | 0 | 0 |
| 21-30.5 | 96 | 0 | 0 | 0 |
| 31-40.5 | 186 | 0 | 0 | 0 |
| 41-45.5 | 105 | 0 | 0 | 0 |
| 46-50.5 | 141 | 81 | 4 | 4 |
| 51-55.5 | 160 | 160 | 11 | 11 |
| 56-60.5 | 125 | 125 | 9 | 9 |
| 61-65.5 | 98 | 98 | 6 | 10 |
| 66-70.5 | 70 | 70 | 17 | 15 |
| 71-75.5 | 26 | 26 | 2 | 9 |
| 76-80.5 | 9 | 9 | 5 | 2 |
| 81-85.5 | 4 | 4 | 0 | 1 |
| Total | 1071 | 573 | 54 | 61 |
Table 4.
Gender-wise dry and wet AMD distribution in BanglaOCT2025.
| Gender | Total Patients | Ground Truth Labelling |
Dry AMD | Wet AMD | Total AMD |
|---|---|---|---|---|---|
| Male | 658 | 349 | 31 | 36 | 67 |
| Female | 413 | 224 | 23 | 25 | 48 |
| Total | 1071 | 573 | 54 | 61 | 115 |
Table 6.
Precision, Recall, F1-score, Support from raw (noisy) OCT volume of BanglaOCT2025.
| Precision | Recall | F1-Score | Support | |
|---|---|---|---|---|
| DryAMD | 0.17 | 0.78 | 0.28 | 54 |
| WetAMD | 0.30 | 0.21 | 0.25 | 61 |
| NonAMD | 0.95 | 0.72 | 0.82 | 742 |
Table 7.
Precision, Recall, F1-score, Support from denoised (clean) OCT volume of BanglaOCT2025.
| Precision | Recall | F1-Score | Support | |
|---|---|---|---|---|
| DryAMD | 0.98 | 1.00 | 0.99 | 54 |
| WetAMD | 1.00 | 0.98 | 0.99 | 61 |
| NonAMD | 1.00 | 1.00 | 1.00 | 742 |
Table 8.
McNemar contingency table.
| Clean Correct: Yes | Clean Correct: No | |
|---|---|---|
| Noisy Correct: YES | 592 → a | 0 → c |
| Noisy Correct: No | 264 → b | 1→ d |
Table 9.
McNemar test results.
| Measurement Parameters | Value |
|---|---|
| b (improved) | 264 |
| c (degraded) | 0 |
| 262.0038 | |
| 0.000000 | |
| 264 | |
| 0.000000 | |
| Exact binomial p-value | (Essentially 0) |
Table 10.
Class-wise aggregated confusion matrix analysis.
| Class | Condition | TP | FN | FP | TN | Sensitivity | Specificity |
|---|---|---|---|---|---|---|---|
| DryAMD | Noisy | 42 | 12 | 208 | 595 | 0.7778 | 0.7407 |
| DryAMD | Denoised | 54 | 0 | 1 | 802 | 1 | 0.9988 |
| WetAMD | Noisy | 13 | 48 | 30 | 766 | 0.2131 | 0.9623 |
| WetAMD | Denoised | 60 | 1 | 0 | 796 | 0.9836 | 1 |
| NonAMD | Noisy | 537 | 205 | 27 | 88 | 0.7237 | 0.7652 |
| NonAMD | Denoised | 742 | 0 | 0 | 115 | 1 | 1 |
Table 11.
Class-imbalance aware performance comparison before and after denoising.
| Metric | Noisy Data | Denoised Data | Δ Improvement |
|---|---|---|---|
| Overall Accuracy | 0.6908 | 0.9988 | 0.308 |
| Balanced Accuracy | 0.5715 | 0.9945 | 0.423 |
| Macro Precision | 0.4742 | 0.9939 | 0.5197 |
| Macro Recall | 0.5715 | 0.9945 | 0.423 |
| Macro F1-score | 0.4496 | 0.9942 | 0.5446 |
| Weighted F1-score | 0.7472 | 0.9988 | 0.2516 |
| MCC | 0.2912 | 0.9952 | 0.704 |
| Cohen’s Kappa | 0.2426 | 0.9952 | 0.7526 |
Table 12.
Per-class sensitivity (recall) comparison.
| Class | Noisy Recall | Denoised Recall |
|---|---|---|
| DryAMD | 0.7778 | 1 |
| WetAMD | 0.2131 | 0.9836 |
| NonAMD | 0.7237 | 1 |
Table 13.
Class-wise mean reference-free denoising metrics.
| Class | Δ LNV | ESPR | Δ ISC | Δ Entropy |
|---|---|---|---|---|
| DryAMD | 0.0015 | 0.269 | 0.2859 | 4.183 |
| WetAMD | 0.0018 | 0.2684 | 0.2963 | 4.1497 |
| NonAMD | 0.0012 | 0.2829 | 0.2695 | 4.2225 |
Disclaimer/Publisher’s Note: The statements, opinions and data contained in all publications are solely those of the individual author(s) and contributor(s) and not of MDPI and/or the editor(s). MDPI and/or the editor(s) disclaim responsibility for any injury to people or property resulting from any ideas, methods, instructions or products referred to in the content. |
© 2025 by the authors. Licensee MDPI, Basel, Switzerland. This article is an open access article distributed under the terms and conditions of the Creative Commons Attribution (CC BY) license (http://creativecommons.org/licenses/by/4.0/).
Copyright: This open access article is published under a Creative Commons CC BY 4.0 license, which permit the free download, distribution, and reuse, provided that the author and preprint are cited in any reuse.


