
Submitted:
23 December 2025
Posted:
25 December 2025
You are already at the latest version
Abstract
Yeast vitality during storage is essential for maintaining consistent fermentation per-formance. This study compares the physiological responses of top- and bottom-cropped Saccharomyces cerevisiae stored at 4°C for 20 days and evaluates Optical Nanomotion De-tection (ONMD) as a rapid, label-free vitality assessment tool. Classical assays (FUN-1, methylene blue, propidium iodide, glucose acidification power, glycogen content, and ethanol tolerance) were used to monitor metabolic activity, membrane integrity, and stress resilience. Bottom-cropped yeast retained metabolic activity, membrane stability, and energy reserves longer than top-cropped cells. ONMD revealed distinct single cell nanomotion signatures and detected mechanically active subpopulations even when traditional vitality indicators declined. Analysis of nanomotion slopes showed a pro-gressively steeper decline in top-cropped cells, indicating reduced temporal stability of nanomechanical activity during the 180-min recordings. Ethanol-challenge experiments confirmed the vitality dependence and stress-sensitivity of the ONMD signal. Together, these findings demonstrate that ONMD resolves cold-storage-induced changes in yeast nanomechanical vitality and provides complementary information beyond convention-al vitality and viability assays. ONMD offers a fast, reagent-free method for monitoring brewing yeast physiology and shows strong potential for integration into brewery quality-control workflows.
Keywords:
optical nanomotion detection
; nanomechanical vitality
; Saccharomyces cerevisiae
; brewing yeast
; cold storage
; yeast viability
; yeast vitality
; microfluidics
; stress tolerance
1. Introduction
Yeast is the central biological driver of the brewing process, converting fermentable wort sugars into ethanol, carbon dioxide, and numerous secondary metabolites that define beer flavor and aroma [1]. Effective yeast management is therefore essential to maintain the physiological integrity and consistency of Saccharomyces cerevisiae across successive fermentations. Effective yeast management is therefore essential to maintain the physiological integrity and consistency of Saccharomyces cerevisiae across successive fermentations. After each fermentation cycle, yeast is cropped from cylindroconical tanks and stored as a chilled slurry (0-4 °C) under anaerobic conditions to minimize metabolic activity and contamination risk [2]. Although short storage periods are preferred, extended storage is common in industrial practice and can compromise both viability and vitality [3,4].
Exposure to low temperature triggers a well-characterized adaptive response in S. cerevisiae. Cooling increases membrane rigidity, which impairs nutrient transport and enzyme activity. To counter this, yeast remodels its lipid composition through homeoviscous adaptation, increasing the proportion of unsaturated and shorter-chain fatty acids to restore membrane fluidity [5,6,7,8,9]. Cold exposure also induces the near-freezing response (NFR), a survival-oriented state in which cell division ceases and metabolism slows [10]. During the NFR, genes involved in trehalose synthesis are upregulated, leading to accumulation of this protective disaccharide, while heat-shock proteins (HSP12p, HSP42p, HSP104p, SSA4p) help preserve proteostasis [11,12]. These mechanisms overlap with the general stress response (GSR), driven by Msn2p/Msn4p, and with the induction of cold-responsive genes such as TIR/DAN, PAU, NSR1, OLE1, and LOT, which support membrane remodeling, translation, and oxidative stress defense [11,12]. Together, these adaptations enable yeast to withstand refrigeration but also reshape its physiological state in ways that complicate vitality assessment.
Yeast vitality is traditionally assessed either by growth-based methods, such as colony-forming units (CFU) and spotting assays [13], or by dye-based methods, including methylene blue (MB) [14], propidium iodide (PI) [15], oxonol dyes [15], and the yeast-specific stain FUN-1 [13,16]. These methods probe redox activity, membrane integrity, or vacuolar processing, but each can give misleading results in cold-stressed or partially dormant cells. For example, MB reduction requires metabolic activity, PI can transiently enter stressed but viable cells, and FUN-1 may underestimate vitality when metabolic turnover is slow [14,15,16].
Yeast viability is traditionally assessed either by growth-based methods, such as colony-forming units (CFU) and spotting assays [13], or by dye-based methods, including methylene blue (MB) [14], propidium iodide (PI) [15], oxonol dyes [15], and the yeast-specific stain FUN-1 [13,16]. These methods probe redox activity, membrane integrity, or vacuolar processing, but each can give misleading results in cold-stressed or partially dormant cells. For example, MB reduction requires metabolic activity, PI can transiently enter stressed but viable cells, and FUN-1 may underestimate vitality when metabolic turnover is slow [15,16].
To overcome these limitations, Optical Nanomotion Detection (ONMD) was recently introduced as a label-free, single-cell method that quantifies nanoscale mechanical fluctuations of living cells [17]. ONMD detects cellular nanomotion in real time using optical microscopy and correlation-based motion analysis and has been shown to correlate with cellular activity in yeast, and bacteria [18,19,20,21,22]. Because ONMD is a label-free technique and does not rely on metabolic turnover, dyes, or growth, it may remain informative under conditions where classical assays fail.
In this study, we applied ONMD to brewing S. cerevisiae to evaluate its ability to monitor yeast vitality during 25 days of cold storage at 4 °C. Two physiologically distinct fractions, i.e., top-cropped and bottom-cropped yeast, were compared. Nanomotion recordings were correlated with FUN-1 metabolic staining, MB and PI viability assays, GAP testing, glycogen content, ethanol tolerance, and slurry pH. This integrated approach provides insight into how nanomechanical activity evolves during cold storage and assesses the potential of ONMD as a rapid, reagent-free method for monitoring brewing yeast physiology.
2. Materials and Methods
2.1. Yeast Cultivation
A commercial Belgian top-fermenting S. cerevisiae strain was obtained fresh from an industrial brewery and sampled directly from an ongoing fermentation in a cylindroconical fermentation vessel (CCT). Beer was brewed to 20°P and 35 IBU, and yeast slurry was pitched at ~5 × 10⁶ cells mL⁻¹. Top-cropped yeast was collected from the foam layer on days 2-3 of fermentation, while bottom-cropped yeast was harvested from the cone of the CCT on day 7. All samples were stored at 4 °C in a dedicated stainless-steel yeast storage vessel under anaerobic and pressure-free conditions. Before sampling, the vessel was gently homogenized, and aliquots were drawn aseptically through a sterile beer tap.
For control experiments, freshly harvested top- and bottom-cropped yeast were streaked onto YPD agar plates, incubated overnight at 25 °C, and used as metabolically active controls.
2.2. Experimental Setup for Optical Nanomotion Detection (ONMD)
Yeast samples were stored at 4 °C and retrieved on the day of analysis. Samples were diluted in aerated yeast extract-peptone-dextrose (YPD) medium to an optical density (OD₆₀₀) of 0.03. The diluted suspensions were then introduced into a microfluidic chip, where individual yeast cells were trapped in microwells and monitored.
Cells were recorded every 30 minutes over a 2-hour period to capture their baseline nanomotion activity. Following this, the YPD medium in each channel was replaced with ethanol solutions of 15%, and 70% (v/v), depending on the assigned channel. Additional recordings were performed 60 minutes after ethanol exposure to observe nanomotion. Nanomotion signals of individual yeast cells were analysed using custom Optical Nanomotion Detection (ONMD) MATLAB software.
2.3. Staining Assays
Two yeast populations were prepared (top-cropped and bottom-cropped) cells stored at 4 °C in a dedicated yeast storage vessel under sterile and pressure-free conditions). Prior to the control experiments a single colony was picked form the agar plate and inoculated in liquid YPD overnight at 25 °C and shaken 200 rpm. For the rest of the experiments, cells stored at 4 °C in a dedicated yeast storage vessel under sterile and pressure-free conditions, were taken. Each population was suspended in phosphate-buffered saline (PBS; 137 mM NaCl, 2.7 mM KCl, 10 mM Na₂HPO₄, 1.8 mM KH₂PO₄, pH 7.4) at a concentration of approximately 10⁶ cells mL⁻¹. For each population, three 1 mL were subsequently prepared for FUN-1, propidium iodide (PI), and methylene blue (MB) staining. Heat-killed cells, obtained by incubating yeast at 65 °C for 30 min, were used as negative controls without causing visible cell rupture.
Staining and imaging were carried out in microfluidic chip with microwells, as previously described [18]. Cell suspensions were introduced into the channels by gentle pipetting, ensuring uniform distribution and avoiding air-bubble entrapment.
FUN-1 staining was performed by resuspending the cells in PBS supplemented with 2% (w/v) glucose (PBS-G) containing 10 µM FUN-1 (Thermo Fisher Scientific). Samples were incubated at 25 °C for 30 min in the dark and then flushed with fresh PBS-G to remove unbound dye [13]. Fluorescence imaging was conducted using FITC and TRITC filter sets, allowing visualization of diffuse green or yellow cytoplasmic fluorescence and the formation of red-fluorescent cylindrical intravacuolar structures (CIVS).
Propidium iodide staining was performed by incubating the cells in 1 µg mL⁻¹ PI (Sigma-Aldrich, Belgium) for 10 min at 25 °C [13]. After staining, the cells were washed with PBS-G and imaged immediately to assess membrane integrity.
Methylene blue (MB, Sigma-Aldrich, Overijse, Belgium) staining was carried out by mixing an equal volume of cell suspension with a MB working solution prepared by diluting a 0.1 mg mL⁻¹ stock solution in 2% (w/v) sodium citrate. The mixture was incubated for 2 min at 25 °C [13], after which cells were imaged by brightfield microscopy. In this assay, metabolically active cells reduce MB to its colourless leuco-form, whereas non-viable cells remain blue.
2.4. Imaging
All imaging was performed on an inverted Nikon Eclipse Ti2 epifluorescence microscope (Nikon, Tokyo, Japan) equipped with FITC and TRITC filter sets. Brightfield images were acquired prior to fluorescence imaging to document cell morphology and positioning within the microfluidic channels. Overlay images combining the green and red channels were generated using Fiji ImageJ to classify cells as metabolically active (CIVS-positive, PI-negative), quiescent (weak or partial CIVS, PI-negative), or dead (PI-positive or blue-stained).
2.5. Fluorescence Image Analysis
Fluorescence quantification and image overlay generation were conducted using a custom MATLAB graphical interface (Cell Stain Analysis Toolbox). The application automated the import, segmentation, and analysis of FITC/TRITC and brightfield TIFF image pairs. Background subtraction, adaptive thresholding, and watershed-based segmentation were applied to identify individual yeast cells and extract per-cell fluorescence statistics.
For the FUN-1 assay, the mean green and red fluorescence intensities, as well as the variance of the red signal within each segmented cell, were computed. Variance of red intensity () was calculated for each cell. For PI and MB assays, binary segmentation was applied to quantify the proportion of PI-positive or MB-positive (blue) cells. Overlay images (RGB composites: FITC-green, TRITC-red, MB- blue) were automatically generated and exported as JPEGs. Quantitative results and single-cell data were exported as CSV files for further analysis
2.6. Glucose Acidification Power Test
Glucose acidification power test was performed to assess the fermentative vitality of the yeast populations. Yeast samples were first counted using a hemocytometer, after which two Falcon tubes were filled with the culture and centrifuged (3000 rpm, 5 min). Pellets were washed three times with sterile filtered water to remove residual medium, and subsequently resuspended in sterile water to obtain a final concentration of 2×10⁸ cells per mL, yielding at least 10 mL of suspension for each assay. In cases requiring additional volume, more Falcon tubes were processed in parallel. A second cell count was optionally performed to confirm the final concentration. For each measurement, 30 mL of sterile filtered water was added to a 100 mL beaker containing a magnetic stir bar, and the initial pH was recorded while stirring. At time zero, 10 mL of the standardized yeast suspension was added and, after 10 min of incubation, the pH was recorded. A 10 mL aliquot of 20.2% (w/v) glucose solution was then added, and the pH after an additional 10 min was recorded. Glucose acidification power (GAP) was calculated as the change in pH following glucose addition (pH₂₀ – pH₁₀). GAP served as the primary indicator of yeast vitality. Where desired, pH was measured at 1 min intervals to obtain detailed acidification curves.
2.7. Glycogen
Glycogen levels were determined in yeast samples stored at 4 °C by enzymatic digestion followed by spectrophotometric quantification of glucose. For each storage day, an aliquot of the yeast slurry was washed twice with sterile distilled water to remove extracellular sugars and wort residues. The cell pellets were resuspended in 0.25 M Na₂CO₃ and incubated at 95 °C for 60 min to solubilize cellular glycogen and denature interfering proteins. After cooling, the samples were adjusted to pH 5.0 by adding 1 M acetic acid and subsequently digested with amyloglucosidase (Sigma-Aldrich) for 60 min at 55 °C to convert glycogen into glucose monomers.
The released glucose was quantified using the GOD-PAP reagent kit (BIOLABO SAS), following the manufacturer’s instructions. Absorbance was measured at 500 nm using a plate reader, and glucose concentrations were calculated using a calibration curve generated from standard solutions of known concentration. Glycogen content was normalized to the dry weight of the corresponding yeast samples to allow comparison between storage days and between the top- and bottom-cropped fractions.
2.8. pH
The pH of the yeast slurries was measured to monitor changes in acidity during cold storage. For each sampling day, an aliquot of the well-mixed top- or bottom-cropped yeast suspension was transferred to a sterile tube and allowed to equilibrate to room temperature. The pH was determined using a calibrated Hanna HI5521 benchtop pH meter equipped with a glass combination electrode. Calibration was performed before each measurement session using standard buffer solutions at pH 4.00 and pH 7.00. All pH values were recorded once the readings stabilized, and measurements were carried out in duplicate for each sample to ensure reproducibility.
3. Results
3.1. FUN-1 Staining Reveals Metabolic Heterogeneity During Cold Storage
FUN-1 staining provided a sensitive means of monitoring the physiological state of yeast during 20 days of cold storage at 4 °C. Four characteristic fluorescence patterns were observed at all timepoints: diffuse green fluorescence associated with metabolically inactive but structurally intact cells, diffuse yellow fluorescence reflecting intermediate or transitioning states, diffuse red fluorescence indicative of membrane-compromised cells, and green cytoplasm containing red Cylindrical Intra-Vacuolar Structures (CIVS), which denotes metabolically active cells with functional vacuoles (Figure 1A-D). Heat-killed controls exhibited uniform yellow fluorescence, confirming the absence of CIVS formation, whereas freshly grown control cells showed bright red CIVS within a green cytoplasm, validating the assay for detecting high metabolic activity (Figure 1A-D).
The fraction of CIVS-positive cells declined progressively during storage in both yeast populations, but with markedly different kinetics (Figure 1A,B). Bottom-cropped yeast initially exhibited a high proportion of CIVS-positive cells at day 5 and maintained a detectable fraction even at day 20 (Figure 1B,F), indicating prolonged retention of metabolic activity. In contrast, top-cropped yeast showed a pronounced decrease in CIVS-positive cells already by day 5, and the fraction approached zero by day 16 (Figure 1A,E). This faster transition toward diffuse yellow and red fluorescence reflects a more rapid loss of metabolic capacity and membrane integrity in the top-cropped population.
The comparison between the two yeast fractions reveals substantial metabolic heterogeneity early in storage and a consistently greater cold-storage resilience in the bottom-cropped fraction.
3.2. Quantitative Fluorescence Analysis Confirms Decline in Vitality
Quantitative image analysis supported the qualitative trends observed in the FUN-1 staining patterns. The mean intensities of the green and red fluorescence channels decreased over time in both yeast populations (Figure S1A-J), demonstrating a general reduction in metabolic activity and intracellular redox potential during cold storage. The decline was steeper in top-cropped cells (Figure 1E, Figure S1A-E), which rapidly lost both green cytoplasmic signal and red CIVS-associated fluorescence, consistent with faster metabolic inactivation.
Bottom-cropped yeast exhibited a more gradual decline in fluorescence intensity, and a measurable fraction of cells retained red-channel variance associated with CIVS structures even at later timepoints (Figure 1F, Figure S1F-J). This persistence of intracellular fluorescence heterogeneity indicates that a subset of bottom-cropped cells maintained vacuolar processing capacity and residual metabolic activity after prolonged storage.
Taken together, the FUN-1 staining profiles and quantitative fluorescence analysis reveal that bottom-cropped yeast better preserves metabolic functionality during cold storage, while top-cropped yeast undergoes a faster transition into metabolically inactive or compromised states.
3.3. Morphological Changes and Growth Characteristics During Cold Storage
Brightfield microscopy revealed characteristic morphological changes in the two yeast populations during cold storage (Figure 2 and Figure S2). On day 1, both top- and bottom-cropped yeast displayed the typical rounded morphology of healthy S. cerevisiae cells, and several cells underwent budding during the 180 min observation period. By day 20, however, clear differences between the two fractions were apparent (Figure 2 and Figure S2).
Top-cropped yeast showed pronounced size heterogeneity, and many cells appeared smaller and more irregular in shape (Figure 2A and Figure S2A). These cells did not exhibit budding during the 180 min imaging period after approximately day 13 (Figure S2A), suggesting loss of proliferative capacity. The morphology at later timepoints was consistent with cells entering a non-growing, metabolically suppressed state.
Bottom-cropped yeast maintained a more uniform, rounded morphology throughout early and mid-storage (Figure 2B Figure S2B). Occasional budding was still observed during the 180 min observation period at intermediate timepoints, indicating that a subset of cells retained residual growth activity longer than in the top-cropped fraction. Morphological deterioration became apparent only after extended storage (around day 13–20), with a gradual increase in irregularly shaped and shrunken cells.
These microscopic observations complement the FUN-1, MB/PI, and GAP results by showing that bottom-cropped yeast preserves structural integrity and limited growth competence for a longer period than top-cropped yeast. The absence of budding in top-cropped cells after mid-storage correlates with the decline in metabolic activity and supports the interpretation that these cells transition more rapidly into a non-proliferative state.
3.4. Physiological and Biochemical Markers of Cold Storage Survival
3.4.1. Staining Assays
Brightfield methylene blue (MB) staining and propidium iodide (PI) fluorescence staining were used to assess membrane integrity during cold storage. MB distinguishes metabolically active cells capable of reducing the dye to its colourless form from non-viable cells that remain blue, whereas PI stains cells with compromised membranes. Representative images for both assays are shown in Figure S3.
Both stains revealed a progressive loss of viability during storage, with notable differences between the two yeast populations (Figure 3). In top-cropped yeast, the percentage of MB-negative cells (viable) decreased sharply after only a few days (Figure 3B), and PI-positive cells accumulated rapidly (Figure 3C), indicating early membrane damage. By contrast, bottom-cropped yeast exhibited a slower increase in MB-positive (Figure 3B) and PI-positive cells (Figure 3C), reflecting extended preservation of membrane integrity.
The decline in viability detected by MB and PI occurred earlier and more abruptly than the loss of metabolic activity measured by FUN-1 staining. In top-cropped yeast, FUN-1 CIVS-positive cells were still detectable when MB already indicated near-complete metabolic inactivity (Figure 1).
Together, these observations show that membrane integrity deteriorates more rapidly in top-cropped yeast, while bottom-cropped cells maintain structural and membrane stability for a longer period, consistent with their delayed decline in FUN-1-based metabolic activity.
3.4.2. Glucose Acidification Power (GAP)
The Glucose Acidification Power (GAP) test was used to quantify the population-level metabolic vitality of the stored yeast samples by measuring their ability to acidify an unbuffered medium in the presence of glucose. The glucose-induced acidification (GAP) declined progressively during cold storage for both yeast fractions (Figure 3E). This decrease indicates a reduction in glycolytic capacity and proton-pump activity.
Top-cropped yeast displayed a rapid decline in GAP, with acidification activity dropping sharply after the first few days of storage (Figure 3E). In contrast, bottom-cropped yeast exhibited a slower decline, maintaining measurable acidification values until later time points (Figure 3E). This pattern is consistent with the earlier observations from FUN-1 and MB/PI staining, which showed that bottom-cropped yeast retained metabolic and structural integrity longer than top-cropped yeast.
Overall, GAP measurements demonstrate a substantial decrease in population-level metabolic vitality during long-term storage, with bottom-cropped yeast showing a more gradual decline than the faster-declining top-cropped fraction.
3.4.3. Glycogen Reserves
Glycogen content was quantified to assess the availability of endogenous energy reserves during cold storage. As shown in Figure S3D, freshly stored yeast contained substantial glycogen levels, consistent with their recent activity in fermentation, although top cropped yeast contained a significantly lower reserve at the beginning comparing to bottom cropped cells. In both top- and bottom-cropped fractions, glycogen content declined over time, reflecting progressive utilization of internal carbohydrate stores during the near-freezing response.
The kinetics of glycogen depletion differed markedly between the two populations. Top-cropped yeast exhibited a rapid decrease in glycogen content, with levels dropping sharply after the first days of storage and approaching minimal values by the later time points (Figure 3D). In contrast, bottom-cropped yeast retained higher glycogen levels throughout the early and mid-storage periods and showed a slower decline overall (Figure 3D). A plateau was observed around day 13, after which glycogen levels remained low and relatively stable (Figure 3D).
3.5. Optical Nanomotion Analysis
Optical Nanomotion Detection (ONMD) was used to quantify the nanomechanical activity of individual yeast cells by measuring their nanomotion over time. For each storage day, nanomotion values were extracted from all cells confined within the microwells, and the population-level distribution was visualized using violin plots (Figure 4). These plots reflect both the median nanomotion signal and the heterogeneity within the population.
Freshly stored top- and bottom-cropped yeast displayed high nanomotion values with broad distributions, indicating active nanomechanical behaviour and substantial cell-to-cell variability. During cold storage at 4 °C, the nanomotion distributions stayed constant in both yeast populations during the first 13 days of storage (Figure 3A, Figure 4).
A characteristic feature of the ONMD data was the increase in the population-level nanomotion distribution observed around day 13 (Figure 3A, Figure 4). This rise coincided with the stabilization of glycogen content at low levels and occurred at a time when classical vitality assays had largely lost sensitivity. The persistence of higher nanomotion values at these later timepoints indicates that ONMD can detect mechanically active subpopulations even when most cells exhibit minimal metabolic or membrane-based vitality signals.
The origin of the ONMD signal was validated through ethanol challenge experiments. Exposure to 70% (v/v) ethanol resulted in an immediate collapse of the nanomotion distribution, confirming that the recorded displacement fluctuations were associated with living cells. Exposure to 15% (v/v) ethanol reduced nanomotion values in freshly stored cells but had a smaller effect on long-stored yeast, consistent with the stress-response trends observed in other assays (Figure 4).
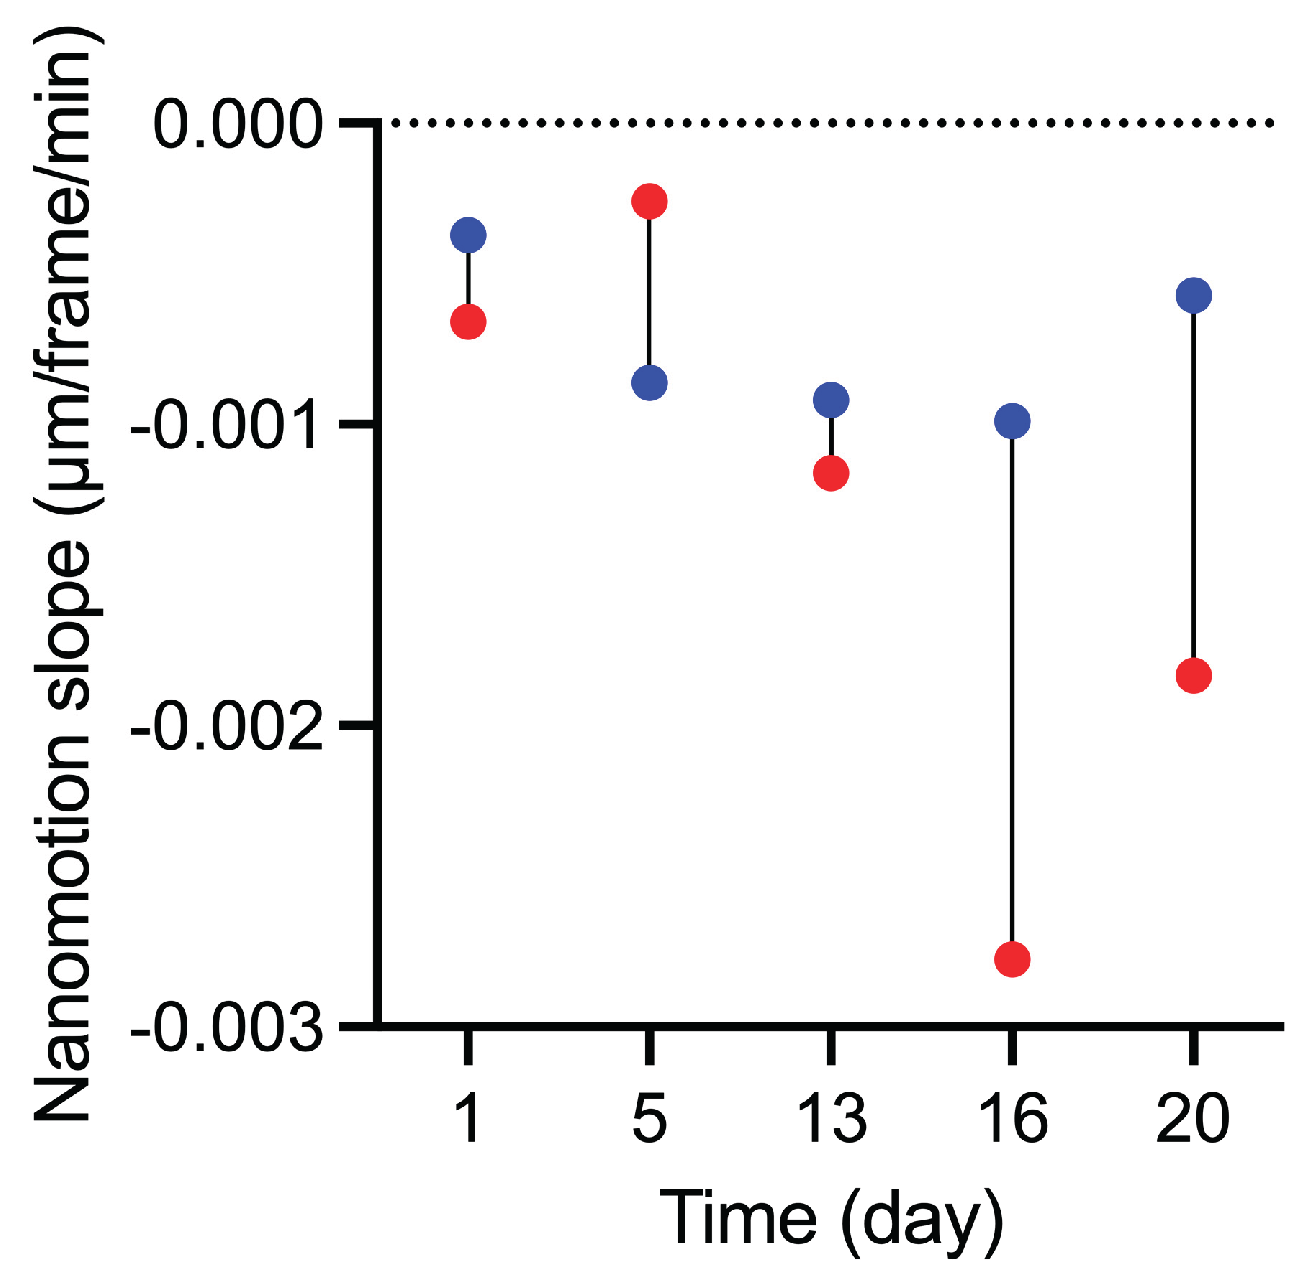
In addition to the population-wide distributions, the evolution of the mean nanomotion during the 180-min recordings provided further insight into the stability of nanomechanical activity (Figure 5, Figure S4, S5). For both yeast fractions and across all storage days, the slopes were negative, indicating a gradual decline in nanomotion over the recording period. From day 13 onward, the decline became more pronounced in top-cropped cells, which consistently exhibited more negative slopes than bottom-cropped cells (Figure 5, Table S1). This pattern shows that nanomotion decreased more rapidly over time in the top-cropped fraction, whereas bottom-cropped cells maintained higher nanomotion levels throughout the 180-min interval. (Figure 5 Figure S4,5).
Overall, ONMD provided a sensitive, label-free means of assessing nanomechanical vitality at single-cell resolution. The nanomotion distributions revealed clear physiological differences between the two yeast fractions and demonstrated that ONMD remains informative at timepoints when classical viability and vitality tests reach their detection limits.
4. Discussion
This study provides a comparative evaluation of the physiological trajectories of top- and bottom-cropped brewing yeast during extended cold storage and assesses the utility of ONMD as a label-free method for monitoring yeast vitality. The combined dataset from metabolic staining, membrane integrity assays, acidification tests, glycogen measurements, morphological observations, and ONMD reveals distinct storage responses in the two yeast fractions and highlights the sensitivity of ONMD to detect residual nanomechanical activity even at timepoints where classical vitality indicators have largely reached their detection limits.
FUN-1 staining demonstrated that bottom-cropped yeast maintained metabolically active subpopulations for a longer period than top-cropped yeast, as indicated by the persistence of red CIVS structures (Figure 1). This observation is consistent with earlier reports showing that physiological robustness differs between yeast fractions collected from different regions of a fermentation vessel [23]. The slower decline in FUN-1-stained CIVS in bottom-cropped cells (Figure 1B,D,F) indicates that these populations retained the capacity to covert FUN-1 for a longer period than top-cropped cells. Because CIVS formation depends on both vacuolar integrity and a minimal level of metabolic activity, the loss of discrete red CIVS and the appearance of diffuse yellow or red fluorescence are generally interpreted as a reduction in these functions. In our experiments, top-cropped yeast showed an earlier and more pronounced shift toward diffuse staining patterns (Figure 1A,C,E), consistent with a faster loss of FUN-1-processing capacity relative to bottom-cropped yeast.
The GAP assay further supported these physiological trends. Bottom-cropped yeast maintained their ability to acidify the medium for a longer period following glucose addition, indicating a more sustained glucose-responsive acidification capacity. The rapid loss of acidification capacity observed in top-cropped yeast is consistent with the FUN-1 and MB/PI results.
Glycogen measurements provided additional insight into the depletion of endogenous energy reserves. Glycogen is a key storage carbohydrate mobilized during cold stress and entry into the near-freezing response (NFR) [24]. The faster depletion of glycogen in top-cropped (Figure 3E) yeast mirrors their faster decline in metabolic vitality, whereas the slower decline and extended plateau observed in bottom-cropped yeast (Figure 3E) resembles previous observations of heterogeneous glycogen retention during stationary phase and cold adaptation [25]. The stabilization of glycogen at low levels around day 13 in both populations (Figure 3E) likely reflects a transition to a metabolically dormant state in which further glycogen mobilization is minimal.
Morphological observations mirrored the physiological differences between the two populations. Top-cropped cells developed shrunken and irregular morphologies earlier in storage (Figure 2A, Figure S2A) and lost budding capacity sooner, whereas bottom-cropped cells retained a rounded appearance for longer and occasionally continued budding (Figure 2B Figure S2B). To our knowledge, this contrasting response between top- and bottom-cropped brewing yeast during cold storage has not been described previously. The morphological changes that emerged over time, particularly the appearance of shrunken and dehydrated cells, resemble general cold-stress responses reported in S. cerevisiae [25].
ONMD measurements provided a complementary perspective by detecting nanoscale fluctuations in individual cells. Although the biophysical origins of the ONMD signal remain unresolved, previous studies have shown that nanomotion can remain detectable in cells that are not actively proliferating or are under stress [17] , indicating that ONMD reports aspects of cellular activity not captured by staining-based assays. In our study, ONMD continued to detect mechanically active cells at timepoints when FUN-1, MB, PI, and GAP assays showed markedly reduced responsiveness. The shift in nanomotion values observed around day 13 (Figure 3A and 4) occurred after glycogen levels had reached a low plateau (Figure 3D), but the relationship between these trends is unclear and will require additional experiments that directly assess metabolic and mechanical contributors to the signal.
Validation experiments with ethanol confirmed that ONMD signals originate from living cells, consistent with prior reports demonstrating rapid nanomotion loss in cells exposed to lethal chemical stress [18,19,20,21]. Exposure to 70% (v/v) ethanol abolished all detectable displacement (Figure 4), whereas exposure to 15% ethanol revealed differential stress tolerance depending on storage duration (Figure 4), a pattern that aligns with earlier observations of cold-induced changes in membrane fluidity and ethanol sensitivity [11,24,26].
The evolution of the nanomotion slopes provides a dynamic perspective on vitality that complements the instantaneous displacement distributions obtained by ONMD. Whereas both yeast fractions displayed negative slopes, indicating a gradual decline in nanomotion during the 180-min recording window, the magnitude of this decrease differed markedly between populations. From day 13 onward, top-cropped yeast exhibited steeply negative slopes (Figure 5, Figure S5, Table S1), reflecting an unstable and rapidly collapsing nanomechanical state upon rewarming. This behaviour parallels their earlier loss of FUN-1 CIVS activity, accelerated decline in membrane integrity, rapid depletion of glycogen reserves, and premature morphological deterioration. Bottom-cropped yeast, by contrast, consistently showed shallower slopes (Figure 5, Figure S5, Table S1), indicating that a subset of cells retained sufficient metabolic and structural robustness to sustain nanomechanical activity over time. These findings demonstrate that the slope metric is a sensitive indicator of residual vitality and further highlight the superior cold-storage resilience of the bottom-cropped fraction. They also reinforce the added value of ONMD as a dynamic vitality assay capable of resolving physiological differences that remain undetected by traditional methods.
Taken together, the results illustrate that bottom-cropped yeast displays greater resilience during cold storage, maintaining metabolic activity, membrane integrity, energy reserves, and nanomechanical vitality for longer than top-cropped yeast. The study also demonstrates that ONMD provides information beyond classical assays, particularly at late storage stages when the signal from traditional viability and vitality tests becomes less informative. Because ONMD measures nanoscale displacement without the need for dyes or growth assays, it captures aspects of cellular activity that can persist in cells that are metabolically suppressed yet structurally intact.
Future work combining ONMD with direct biophysical measurements, such as lipidomics, membrane fluidity assays, or intracellular rheology, will help clarify the mechanistic origins of the nanomotion signal during cold storage. Nonetheless, the present study demonstrates that ONMD is a promising label-free method for assessing the vitality of brewing yeast and may serve as a valuable complement to established quality-control assays in brewery operations.
5. Conclusions
This study shows that top- and bottom-cropped brewing yeast follow distinct physiological trajectories during extended cold storage and that ONMD provides a sensitive, complementary means of monitoring these changes. Classical vitality and viability assays (FUN-1, MB, PI, GAP, glycogen) revealed a faster decline in metabolic activity, membrane integrity, and energy reserves in top-cropped cells, whereas bottom-cropped yeast retained these features longer. Morphological analysis confirmed earlier structural deterioration in the top-cropped population.
ONMD detected persistent nanomechanical activity in a fraction of cells even when traditional assays had largely lost sensitivity. It distinguished clear physiological differences between the two cropped fractions and identified mechanically active subpopulations that remained responsive despite metabolic suppression. Ethanol challenge experiments further validated the vitality dependence of the ONMD signal.
Overall, bottom-cropped yeast demonstrated greater resilience during cold storage, maintaining metabolic activity, membrane stability, energy reserves, and nanomechanical vitality for longer. ONMD captured these differences with high sensitivity. Beyond population-wide displacement distributions, nanomotion slopes, and their representation in dumbbell plots, showed that bottom-cropped cells sustained nanomechanical activity throughout the 180-min recordings, whereas top-cropped cells exhibited a progressive decline, particularly after day 13. This dynamic information was inaccessible to classical assays, which showed limited sensitivity once metabolic activity became strongly suppressed.
Because ONMD quantifies nanoscale displacement without dyes or growth-dependent measurements, it identifies residual activity in subpopulations that remain structurally intact despite reduced metabolic output. The ability to resolve these mechanically active cells at late storage stages underscores the added value of ONMD as a complementary vitality assessment method. Future work combining ONMD with measurements of membrane fluidity, lipidome composition, or intracellular rheology will help clarify the biophysical origins of nanomotion during cold storage.
Taken together, the findings demonstrate that ONMD is a powerful, label-free approach for assessing the nanomechanical vitality of brewing yeast at single-cell resolution. Its capacity to detect mechanically active subpopulations during prolonged storage highlights its potential integration into brewery quality-control workflows alongside established vitality and viability assays.
Supplementary Materials
The following supporting information can be downloaded at the website of this paper posted on Preprints.org. Figure S1. Green and red fluorescent intensity of (A-E) to top- and (F-J) bottom-cropped yeast cells stained with FUN1 over a period of 20 days.; Table S1. Morphological changes and growth patterns of top cropped (A) and bottom cropped (B) cells over a period of 20 days.; Figure S2. Top cropped (A) and bottom cropped (B) cells stained with FUN1, Methylene blude and PI dyes. Figure S3 Average nanomotion slopes of cold-stored yeast cells measured over time. Slopes of average single-cell displacement slopes of top cropped yeast cells recorded over a 180 min for cells stored at 4 °C for 1 day (A), 5 days (B), 13 days (C), 16 days (D), and 20 days (E).; Figure S4 Average nanomotion slopes of cold-stored yeast cells measured over time. Slopes of average single-cell displacement slopes of bottom cropped yeast cells recorded over a 180 min for cells stored at 4 °C for 1 day (A), 5 days (B), 13 days (C), 16 days (D), and 20 days (E). Table S2. Average nanomotion slopes of brewer’s yeast cells over 20 days, calculated from linear fits of displacement across seven timepoints (0 to 180 min) for the top cropped and bottom cropped cells. Values represent the mean slope (µm per frame per min) ± standard deviation, derived from individual single cell slopes within each condition.
Author Contributions
Conceptualization, R.G.W. and S.K.; methodology, R.G.W., V.R., T.V.M., L.V.H. and S.K.; software, S.K.; validation, V.R., T.V.M. and R.G.W.; formal analysis, V.R. and T.V.M.; resources, R.G.W. and L.V.H.; data curation, V.R. and T.V.M.; writing—original draft preparation, R.G.W., V.R., T.V.M., L.V.H., and S.K.; visualization, V.R., T.V.M. and R.G.W.; supervision, R.G.W.; project administration, R.G.W. and S.K.; funding acquisition, R.G.W., S.K., T.V.M. and L.V.H.
Funding
This research was funded by the Belgian Federal Science Policy Office (Belspo) and the European Space Agency (ESA), grant number PRODEX Flumias Nanomotion; FWO, grant number I002620; FWO-SNSF, grant numbers G068121N - 310030L_197946, G0AEG26N - CR00-5L-239852; FWO-SB-FDW Ph.D. grant of VR. L. Van Hofstraeten was supported by VLAIO ((HBC.2023.0775).
Institutional Review Board Statement
Not applicable.
Informed Consent Statement
Not applicable.
Data Availability Statement
All data needed to evaluate the conclusions in the paper are present in the paper and/or the Supplementary Materials. Additional data related to this paper may be requested from the authors.
Acknowledgments
During the preparation of this manuscript, the authors used ChatGPT for the purposes of correcting English grammar and refine phrasing. The authors have reviewed and edited the output and take full responsibility for the content of this publication.
Conflicts of Interest
The authors declare no conflict of interest.
Abbreviations
The following abbreviations are used in this manuscript:
| AP | Acidification Power |
| ATPase | Adenosine Triphosphatase |
| BCECF-AM | 2′,7′-Bis-(2-Carboxyethyl)-5-(and-6)-Carboxyfluorescein Acetoxymethyl Ester |
| CCT | Cylindroconical Tank |
| CFU | Colony-Forming Units |
| CIVS | Cylindrical Intra-Vacuolar Structures |
| CO₂ | Carbon Dioxide |
| CSV | Comma-Separated Values |
| DMSO | Dimethyl Sulfoxide |
| FITC | Fluorescein Isothiocyanate |
| FUN-1 | Fluorescent Yeast Vitality Stain 1 |
| GAP | Glucose Acidification Power |
| GIPE | Glucose-Induced Proton Efflux |
| GSR | General Stress Response |
| HSP | Heat Shock Protein |
| IBU | International Bitterness Units |
| MB | Methylene Blue |
| NFR | Near-Freezing Response |
| OD₆₀₀ | Optical Density at 600 nm |
| ONMD | Optical Nanomotion Detection |
| PBS | Phosphate-Buffered Saline |
| PBS-G | Phosphate-Buffered Saline with Glucose |
| PI | Propidium Iodide |
| pHi | Intracellular pH |
| RNA | Ribonucleic Acid |
| TRITC | Tetramethylrhodamine Isothiocyanate |
| WAP | Water Acidification Power |
| YPD | Yeast Extract Peptone Dextrose Medium |
References
- E. J. Lodolo, J. L. F. Kock, B. C. Axcell, and M. Brooks, “The yeast Saccharomyces cerevisiae â the main character in beer brewing,” FEMS Yeast Res, vol. 8, no. 7, pp. 1018–1036, Nov. 2008. [CrossRef]
- A. M. Wellman and G. G. Stewart, “Storage of Brewing Yeasts by Liquid Nitrogen Refrigeration,” Appl Microbiol, vol. 26, no. 4, pp. 577–583, Oct. 1973. [CrossRef]
- G. G. Stewart, C. R. Murray, C. J. Panchal, I. Russell, and A. M. Sills, “The selection and modification of brewer’s yeast strains,” Food Microbiol, vol. 1, no. 4, pp. 289–302, Oct. 1984. [CrossRef]
- C. A. Boulton and D. E. Quain, “Brewing Yeast and Fermentation,” 2001. [Online]. Available: https://api.semanticscholar.org/CorpusID:82655978.
- N. Beales, “Adaptation of Microorganisms to Cold Temperatures, Weak Acid Preservatives, Low pH, and Osmotic Stress: A Review,” Compr Rev Food Sci Food Saf, vol. 3, no. 1, pp. 1–20, Jan. 2004. [CrossRef]
- M. Sinensky, “Homeoviscous Adaptation—A Homeostatic Process that Regulates the Viscosity of Membrane Lipids in Escherichia coli,” Proceedings of the National Academy of Sciences, vol. 71, no. 2, pp. 522–525, Feb. 1974. [CrossRef]
- A. Somani, F. Bealin-Kelly, B. Axcell, and K. A. Smart, “Impact of Storage Temperature on Lager Brewing Yeast Viability, Glycogen, Trehalose, and Fatty Acid Content,” Journal of the American Society of Brewing Chemists, vol. 70, no. 2, pp. 123–130, Apr. 2012. [CrossRef]
- C. Kelso, A. T. Maccarone, A. I. P. M. de Kroon, T. W. Mitchell, and M. F. Renne, “Temperature adaptation of yeast phospholipid molecular species at the acyl chain positional level,” FEBS Lett, vol. 599, no. 4, pp. 530–544, Feb. 2025. [CrossRef]
- S. Rodríguez-Vargas, A. Sánchez-García, J. M. Martínez-Rivas, J. A. Prieto, and F. Randez-Gil, “Fluidization of membrane lipids enhances the tolerance of Saccharomyces cerevisiae to freezing and salt stress,” Appl Environ Microbiol, vol. 73, no. 1, pp. 110–116, Jan. 2007. [CrossRef]
- L. Ballester-Tomás, R. Pérez-Torrado, S. Rodríguez-Vargas, J. A. Prieto, and F. Randez-Gil, “Near-freezing effects on the proteome of industrial yeast strains of Saccharomyces cerevisiae,” J Biotechnol, vol. 221, pp. 70–77, Mar. 2016. [CrossRef]
- Y. Murata et al., “Genome-wide expression analysis of yeast response during exposure to 4 °C,” Extremophiles, vol. 10, no. 2, pp. 117–128, Apr. 2006. [CrossRef]
- O. Kandror, N. Bretschneider, E. Kreydin, D. Cavalieri, and A. L. Goldberg, “Yeast Adapt to Near-Freezing Temperatures by STRE/Msn2,4-Dependent Induction of Trehalose Synthesis and Certain Molecular Chaperones,” Mol Cell, vol. 13, no. 6, pp. 771–781, Mar. 2004. [CrossRef]
- M. Kwolek-Mirek and R. Zadrag-Tecza, “Comparison of methods used for assessing the viability and vitality of yeast cells,” FEMS Yeast Res, p. n/a-n/a, Sep. 2014. [CrossRef]
- K. Painting and B. Kirsop, “A quick method for estimating the percentage of viable cells in a yeast population, using methylene blue staining,” World J Microbiol Biotechnol, vol. 6, no. 3, pp. 346–347, Sep. 1990. [CrossRef]
- L pez-Amor s R, Comas J, Vives-Rego J. “Flow cytometric assessment of Escherichia coli and Salmonella typhimurium starvation-survival in seawater using rhodamine 123, propidium iodide, and oxonol,” Appl Environ Microbiol, vol. 61, no. 7, pp. 2521–2526, Jul. 1995. [CrossRef]
- P. J. Millard, B. L. Roth, H. P. Thi, S. T. Yue, and R. P. Haugland, “Development of the FUN-1 family of fluorescent probes for vacuole labeling and viability testing of yeasts,” Appl Environ Microbiol, vol. 63, no. 7, pp. 2897–2905, Jul. 1997. [CrossRef]
- R. G. Willaert et al., “Single yeast cell nanomotions correlate with cellular activity,” Sci Adv, vol. 6, no. 26, Jun. 2020. [CrossRef]
- V. Radonicic, C. Yvanoff, M. I. Villalba, S. Kasas, and R. G. Willaert, “The Dynamics of Single-Cell Nanomotion Behaviour of Saccharomyces cerevisiae in a Microfluidic Chip for Rapid Antifungal Susceptibility Testing,” Fermentation 2022, Vol. 8, Page 195, vol. 8, no. 5, p. 195, Apr. 2022. [CrossRef]
- V. Radonicic, C. Yvanoff, M. I. Villalba, B. Devreese, S. Kasas, and R. G. Willaert, “Single-Cell Optical Nanomotion of Candida albicans in Microwells for Rapid Antifungal Susceptibility Testing,” Fermentation, vol. 9, no. 4, p. 365, Apr. 2023. [CrossRef]
- V. Radonicic et al., “Optical Nanomotion Detection to Rapidly Discriminate between Fungicidal and Fungistatic Effects of Antifungals on Single-Cell Candida albicans,” Antibiotics, vol. 13, no. 8, p. 712, Jul. 2024. [CrossRef]
- Villalba MI et al., “Simple optical nanomotion method for single-bacterium viability and antibiotic response testing,” PNAS, 2023.
- M. I. Villalba, V. Gligorovski, S. J. Rahi, R. G. Willaert, and S. Kasas, “A simplified version of rapid susceptibility testing of bacteria and yeasts using optical nanomotion detection,” Front Microbiol, vol. 15, 2024. [CrossRef]
- C. POWELL, D. QUAIN, and K. SMART, “The impact of brewing yeast cell age on fermentation performance, attenuation and flocculation,” FEMS Yeast Res, vol. 3, no. 2, pp. 149–157, Apr. 2003. [CrossRef]
- J. Aguilera, F. Randez-Gil, and J. A. Prieto, “Cold response in Saccharomyces cerevisiae : new functions for old mechanisms,” FEMS Microbiol Rev, vol. 31, no. 3, pp. 327–341, Apr. 2007. [CrossRef]
- B. Schade, G. Jansen, M. Whiteway, K. D. Entian, and D. Y. Thomas, “Cold Adaptation in Budding Yeast,” Mol Biol Cell, vol. 15, no. 12, pp. 5492–5502, Dec. 2004. [CrossRef]
- M. I. Villalba et al., “Nanomotion Detection Method for Testing Antibiotic Resistance and Susceptibility of Slow-Growing Bacteria,” Small, vol. 14, no. 4, Jan. 2018. [CrossRef]
- G. R. Sahana et al., “A review on ethanol tolerance mechanisms in yeast: Current knowledge in biotechnological applications and future directions,” Process Biochemistry, vol. 138, pp. 1–13, Mar. 2024. [CrossRef]
Figure 1.
Percentage of yeast cells exhibiting different FUN-1 staining patterns: diffuse green, diffuse red, diffuse yellow, and green with red Cylindrical Intra-Vacuolar Structures (CIVS), during 20 days of cold storage at 4 °C. Results are shown for (A) top-cropped and (B) bottom-cropped yeast populations. (C) Bottom cropped and (D) top cropped cells stained with FUN1 dye; white arrows show metabolically active cells that formed CIVS stained in red. Variance of the fluorescent red intensity per single cell of (E) top- and (F) bottom-cropped yeast stained with FUN1 over a period of 20 days.
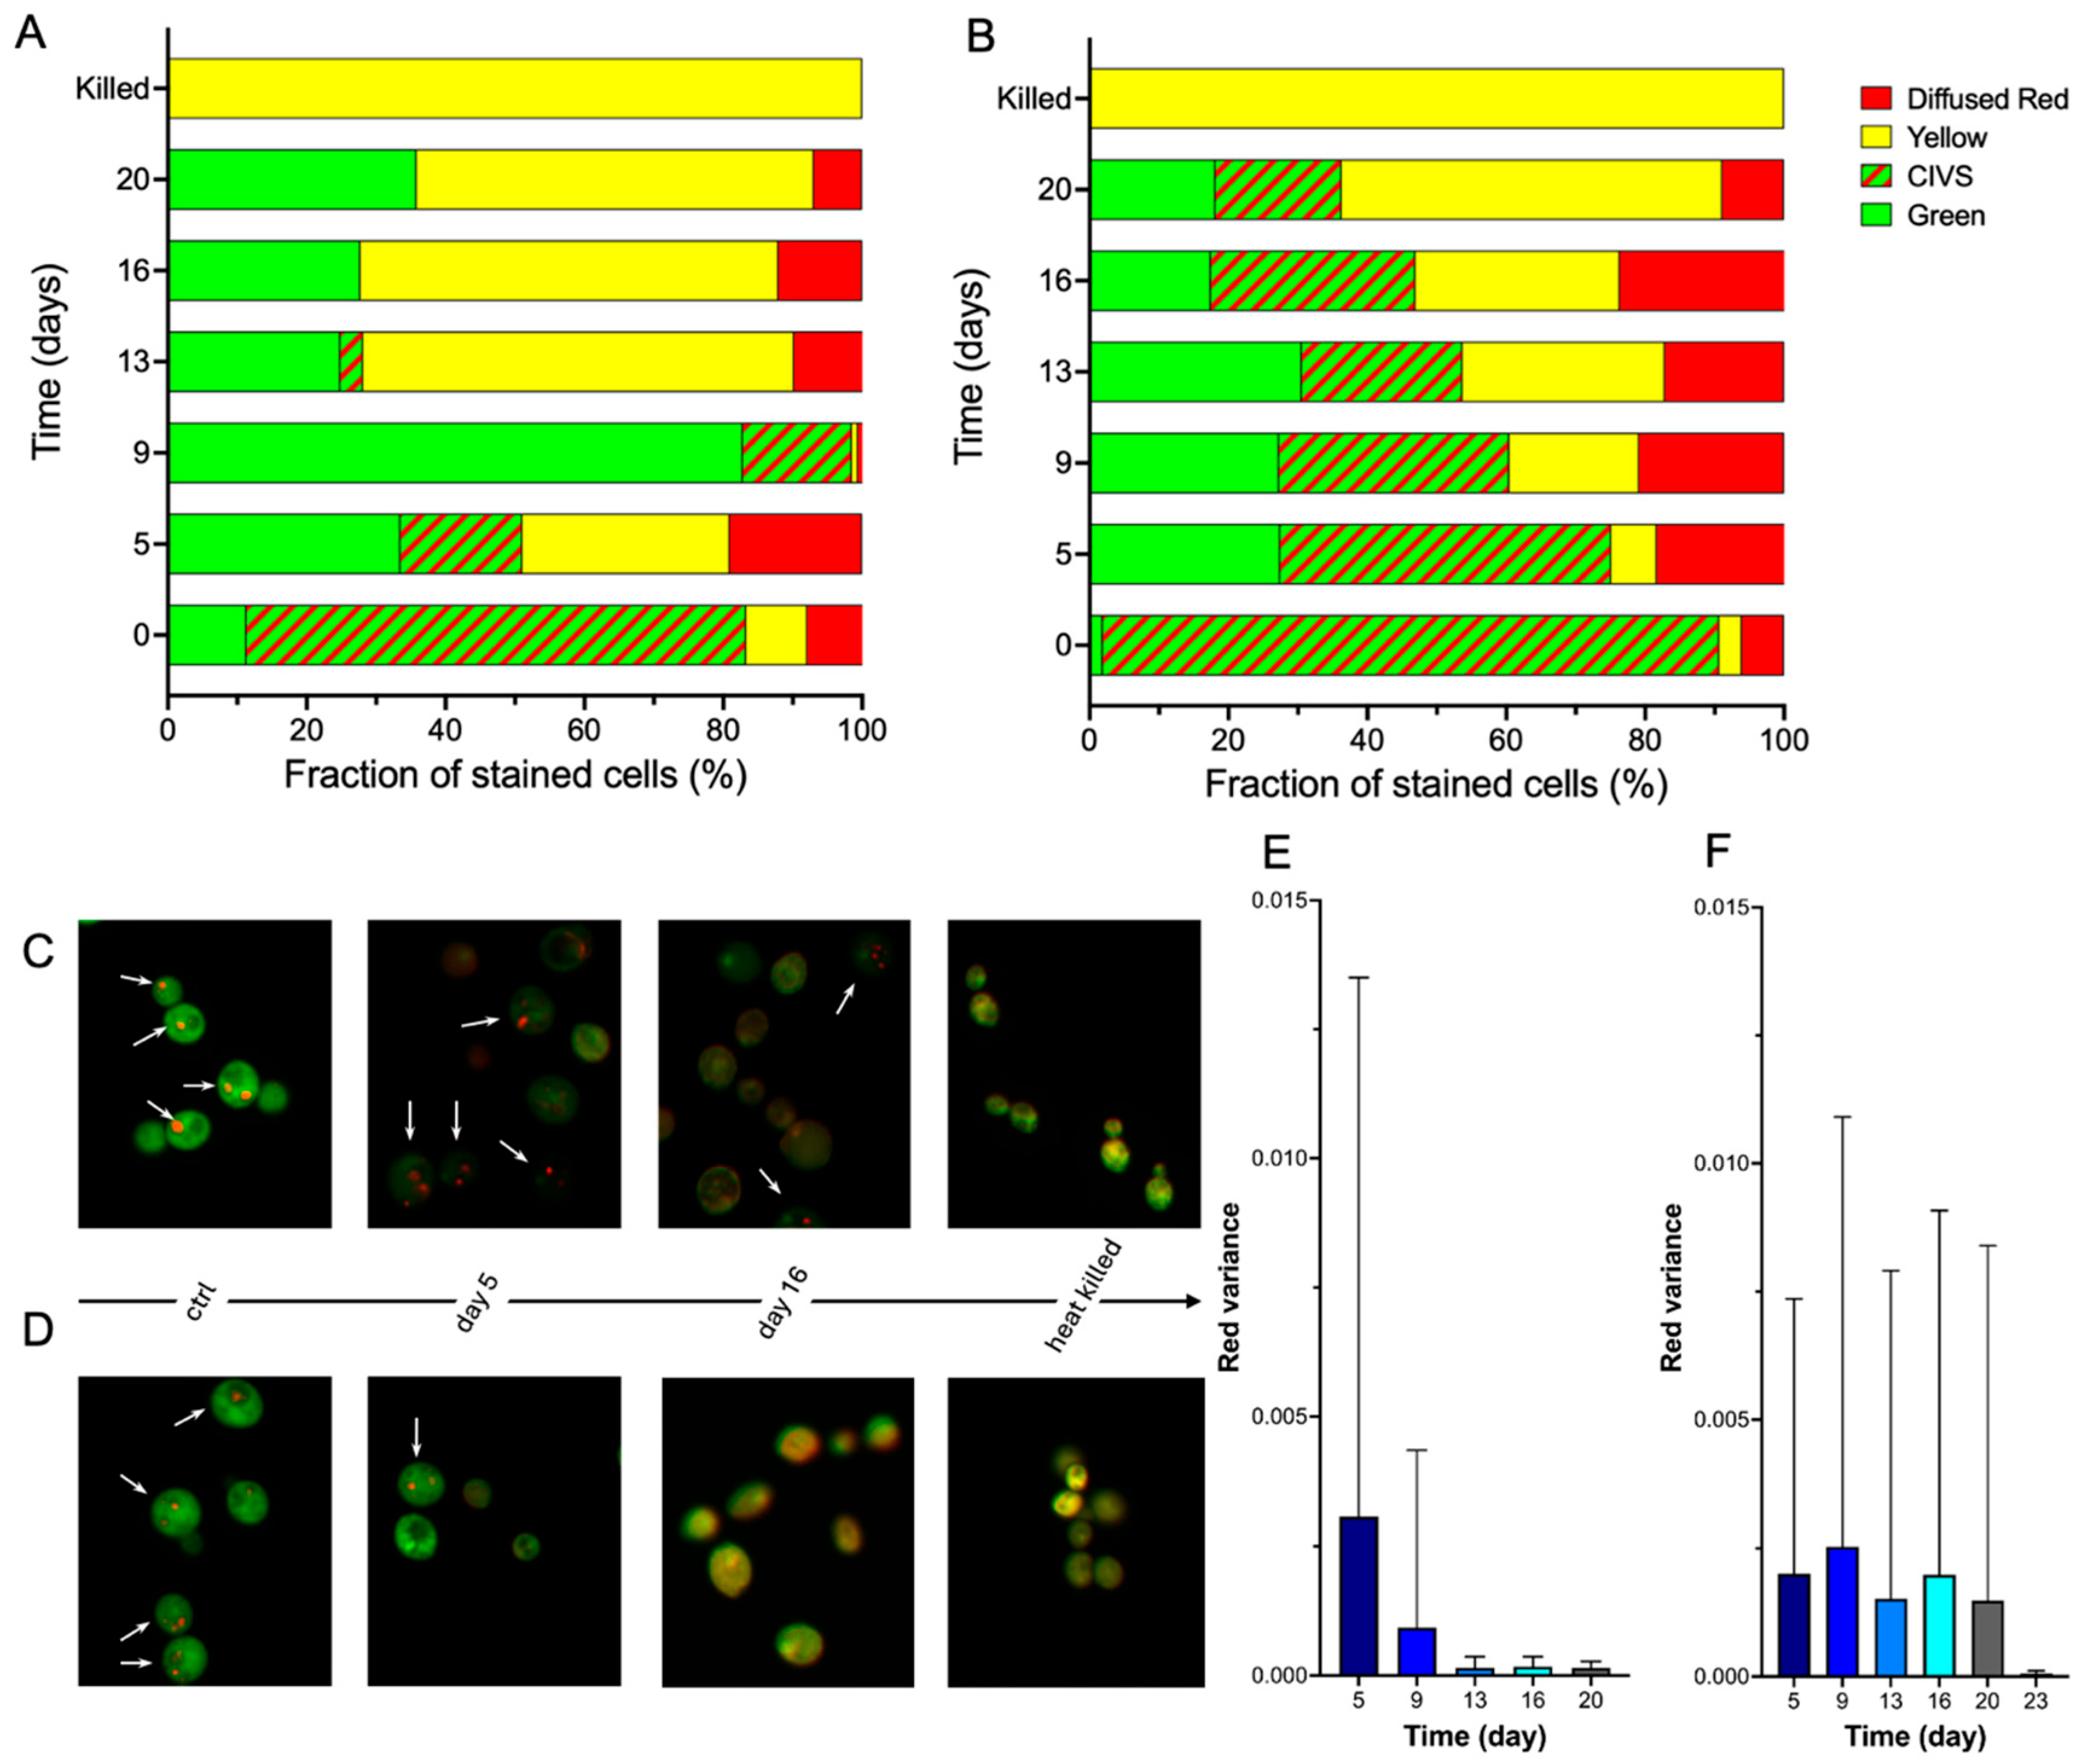
Figure 2.
Comparison of top-cropped and bottom-cropped yeast during 20 days of cold storage at 4 °C. (A) Growth and morphological changes of top cropped yeast cell. (B) Growth and morphological changes of bottom cropped yeast cell.
Figure 2.
Comparison of top-cropped and bottom-cropped yeast during 20 days of cold storage at 4 °C. (A) Growth and morphological changes of top cropped yeast cell. (B) Growth and morphological changes of bottom cropped yeast cell.
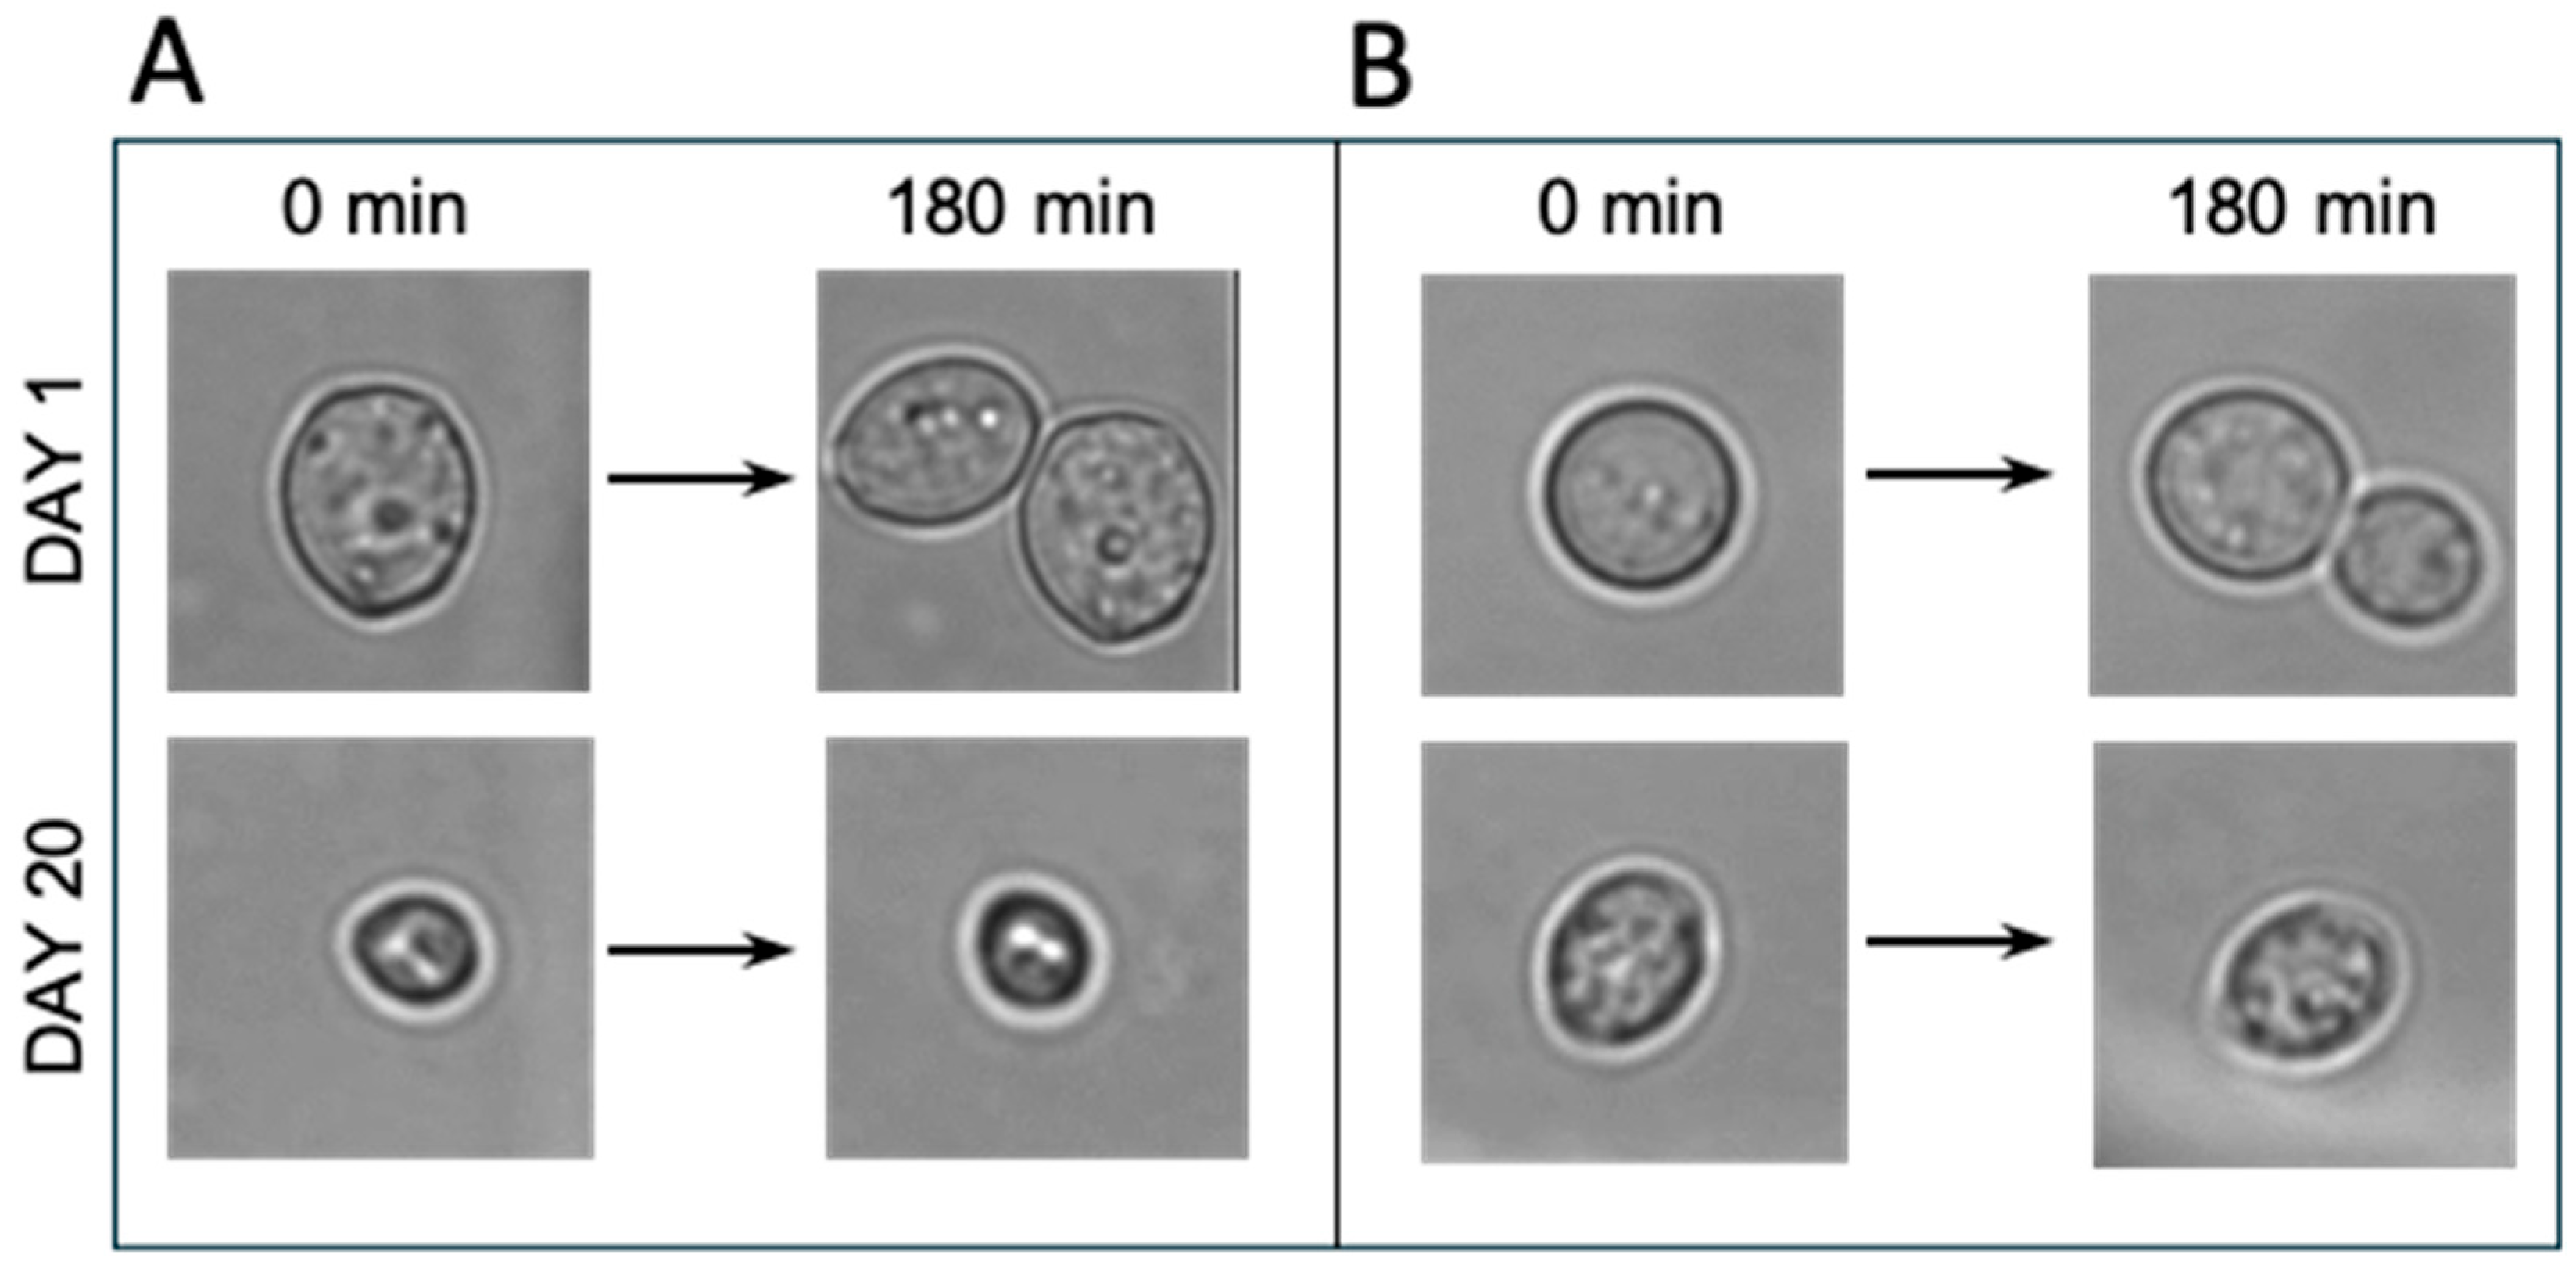
Figure 3.
Comparison of top-cropped (blue) and bottom-cropped (red) yeast during 20 days of cold storage at 4 °C. (A) Average displacement velocity. (B) Percentage of living cells stained with methylene blue. (C) Percentage of living cells stained with propidium iodide (PI) (D) Glycogen content. (E) Glucose acidification power test. (G) pH of the yeast cells slurry over 20 days of cold storage.
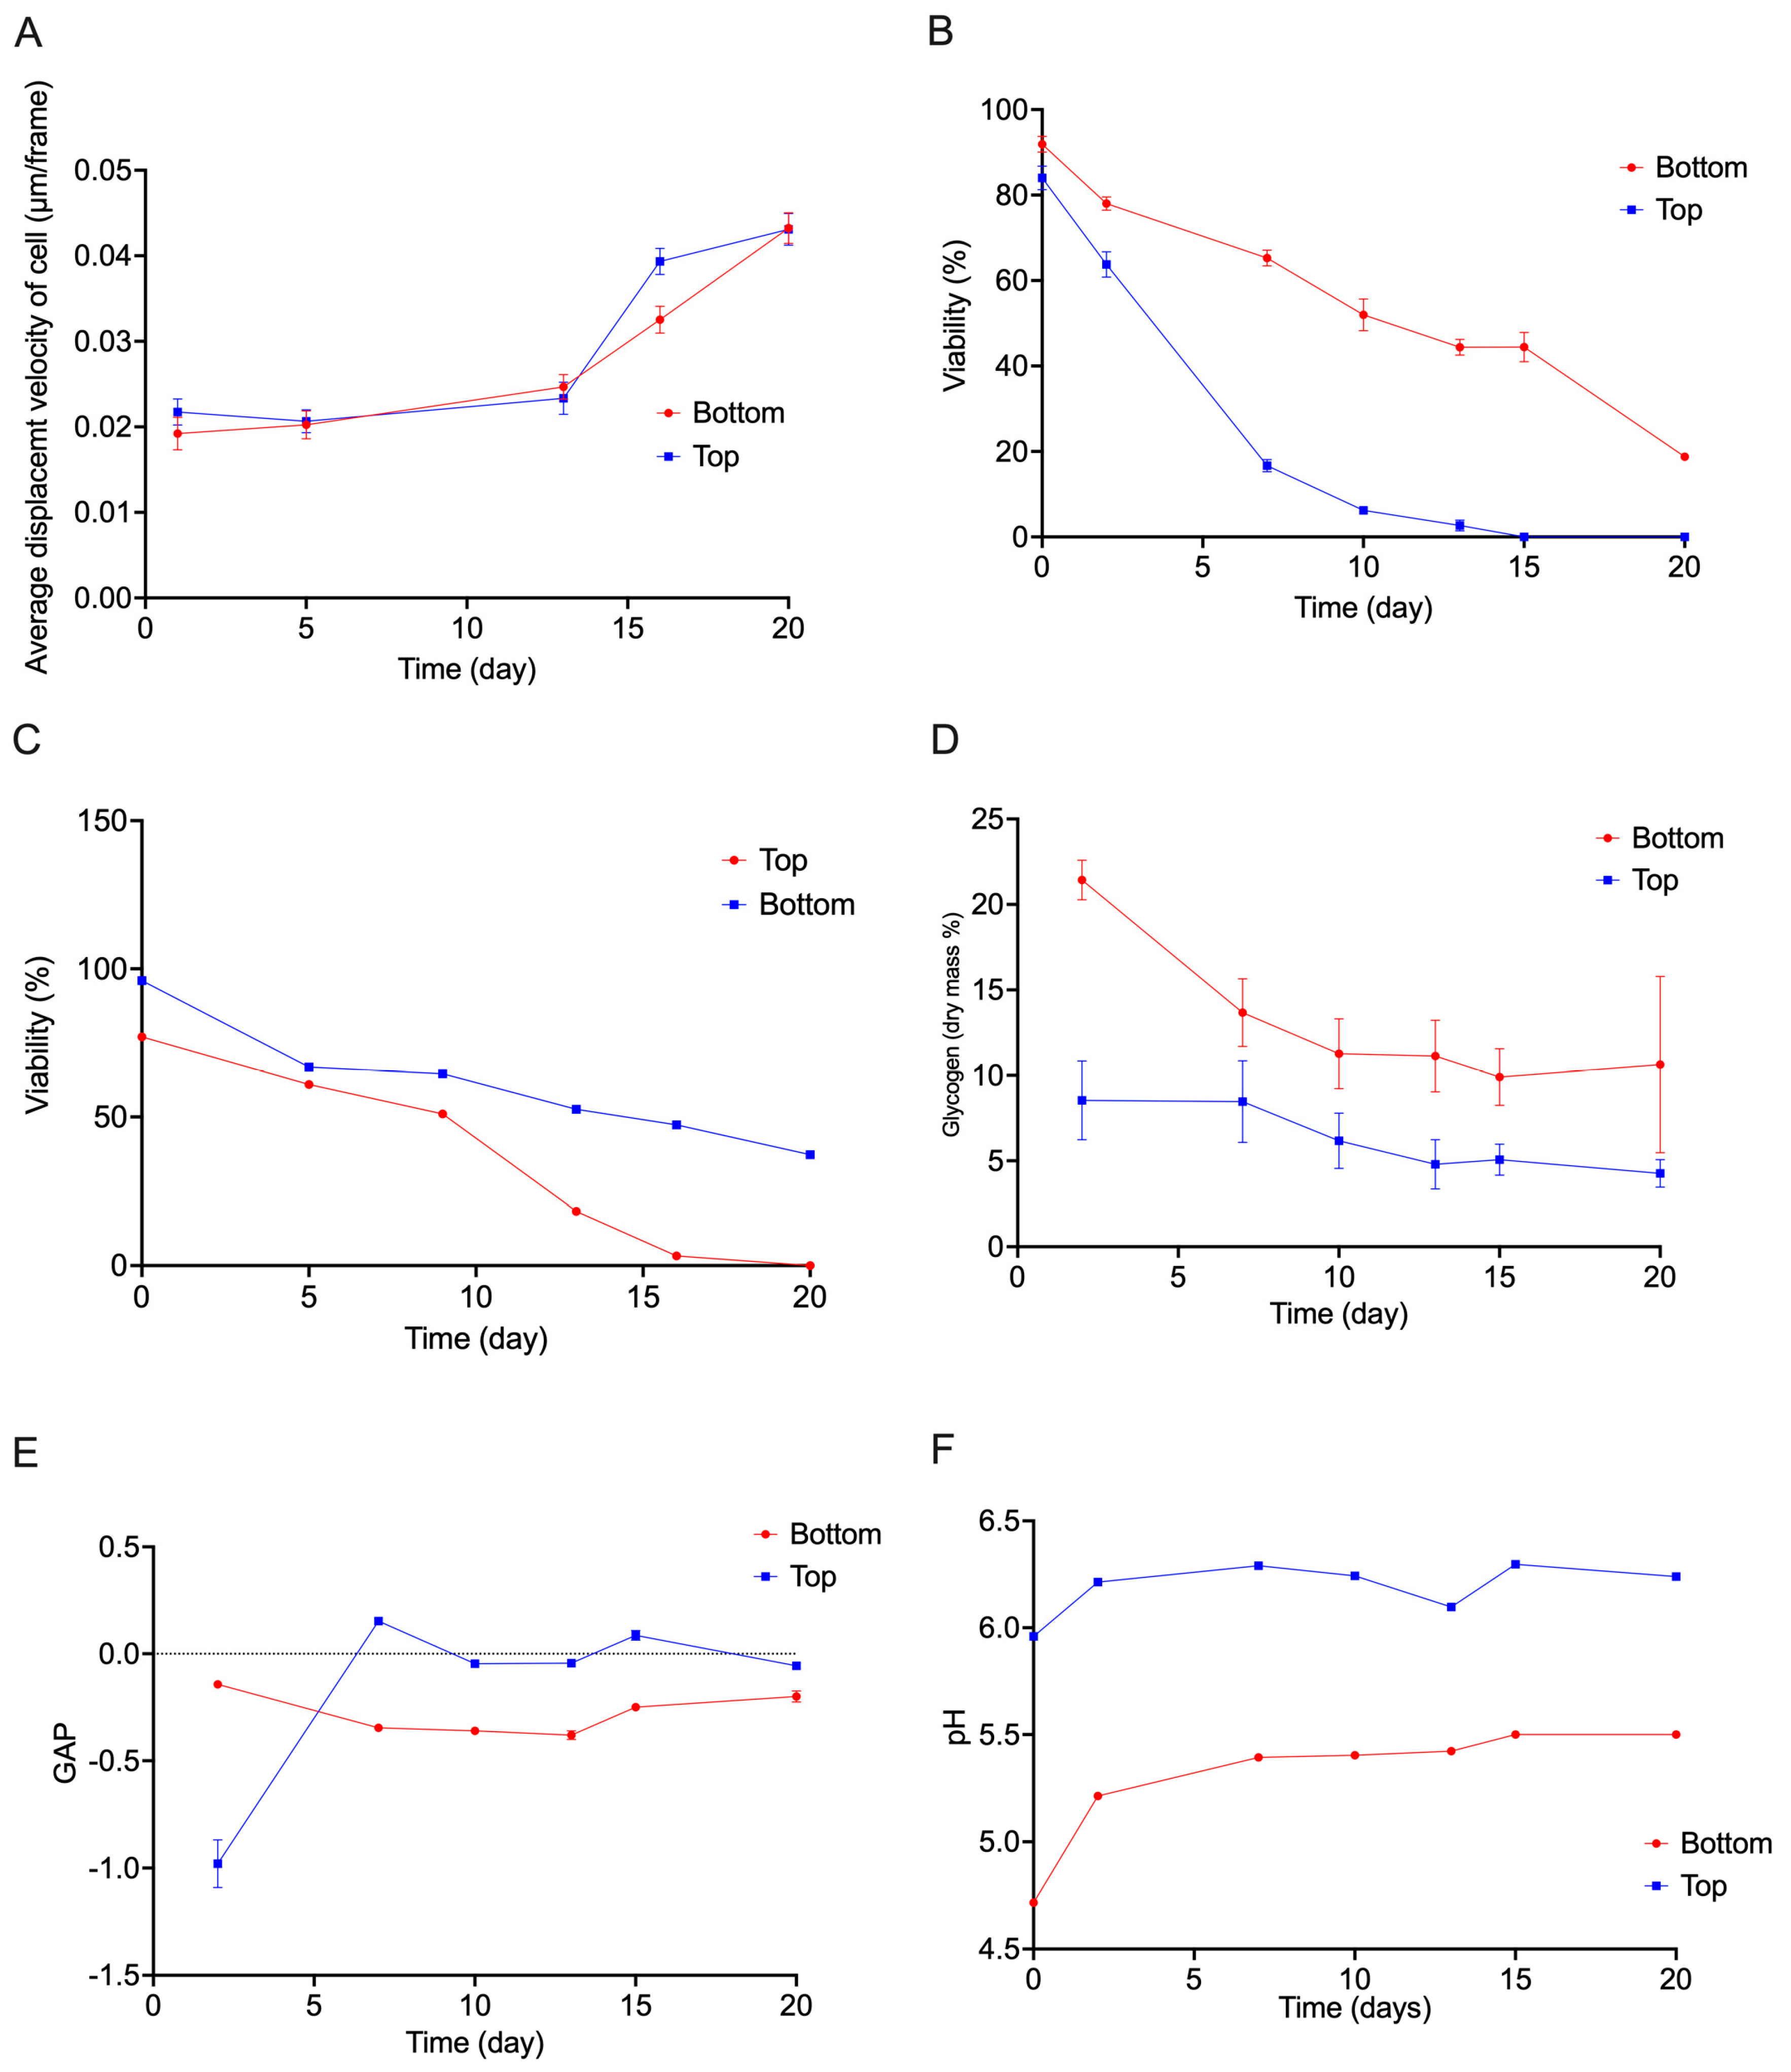
Figure 4.
Distribution of (A-E) top and (E-J) bottom-cropped single yeast cell displacement per frame for 180 min, on day 1 (A-F), 5 (B-G), 13 (C-H), 16 (D-I) and 20 (E-J) respectively of cold storage at 4 °C. .
Figure 4.
Distribution of (A-E) top and (E-J) bottom-cropped single yeast cell displacement per frame for 180 min, on day 1 (A-F), 5 (B-G), 13 (C-H), 16 (D-I) and 20 (E-J) respectively of cold storage at 4 °C. .
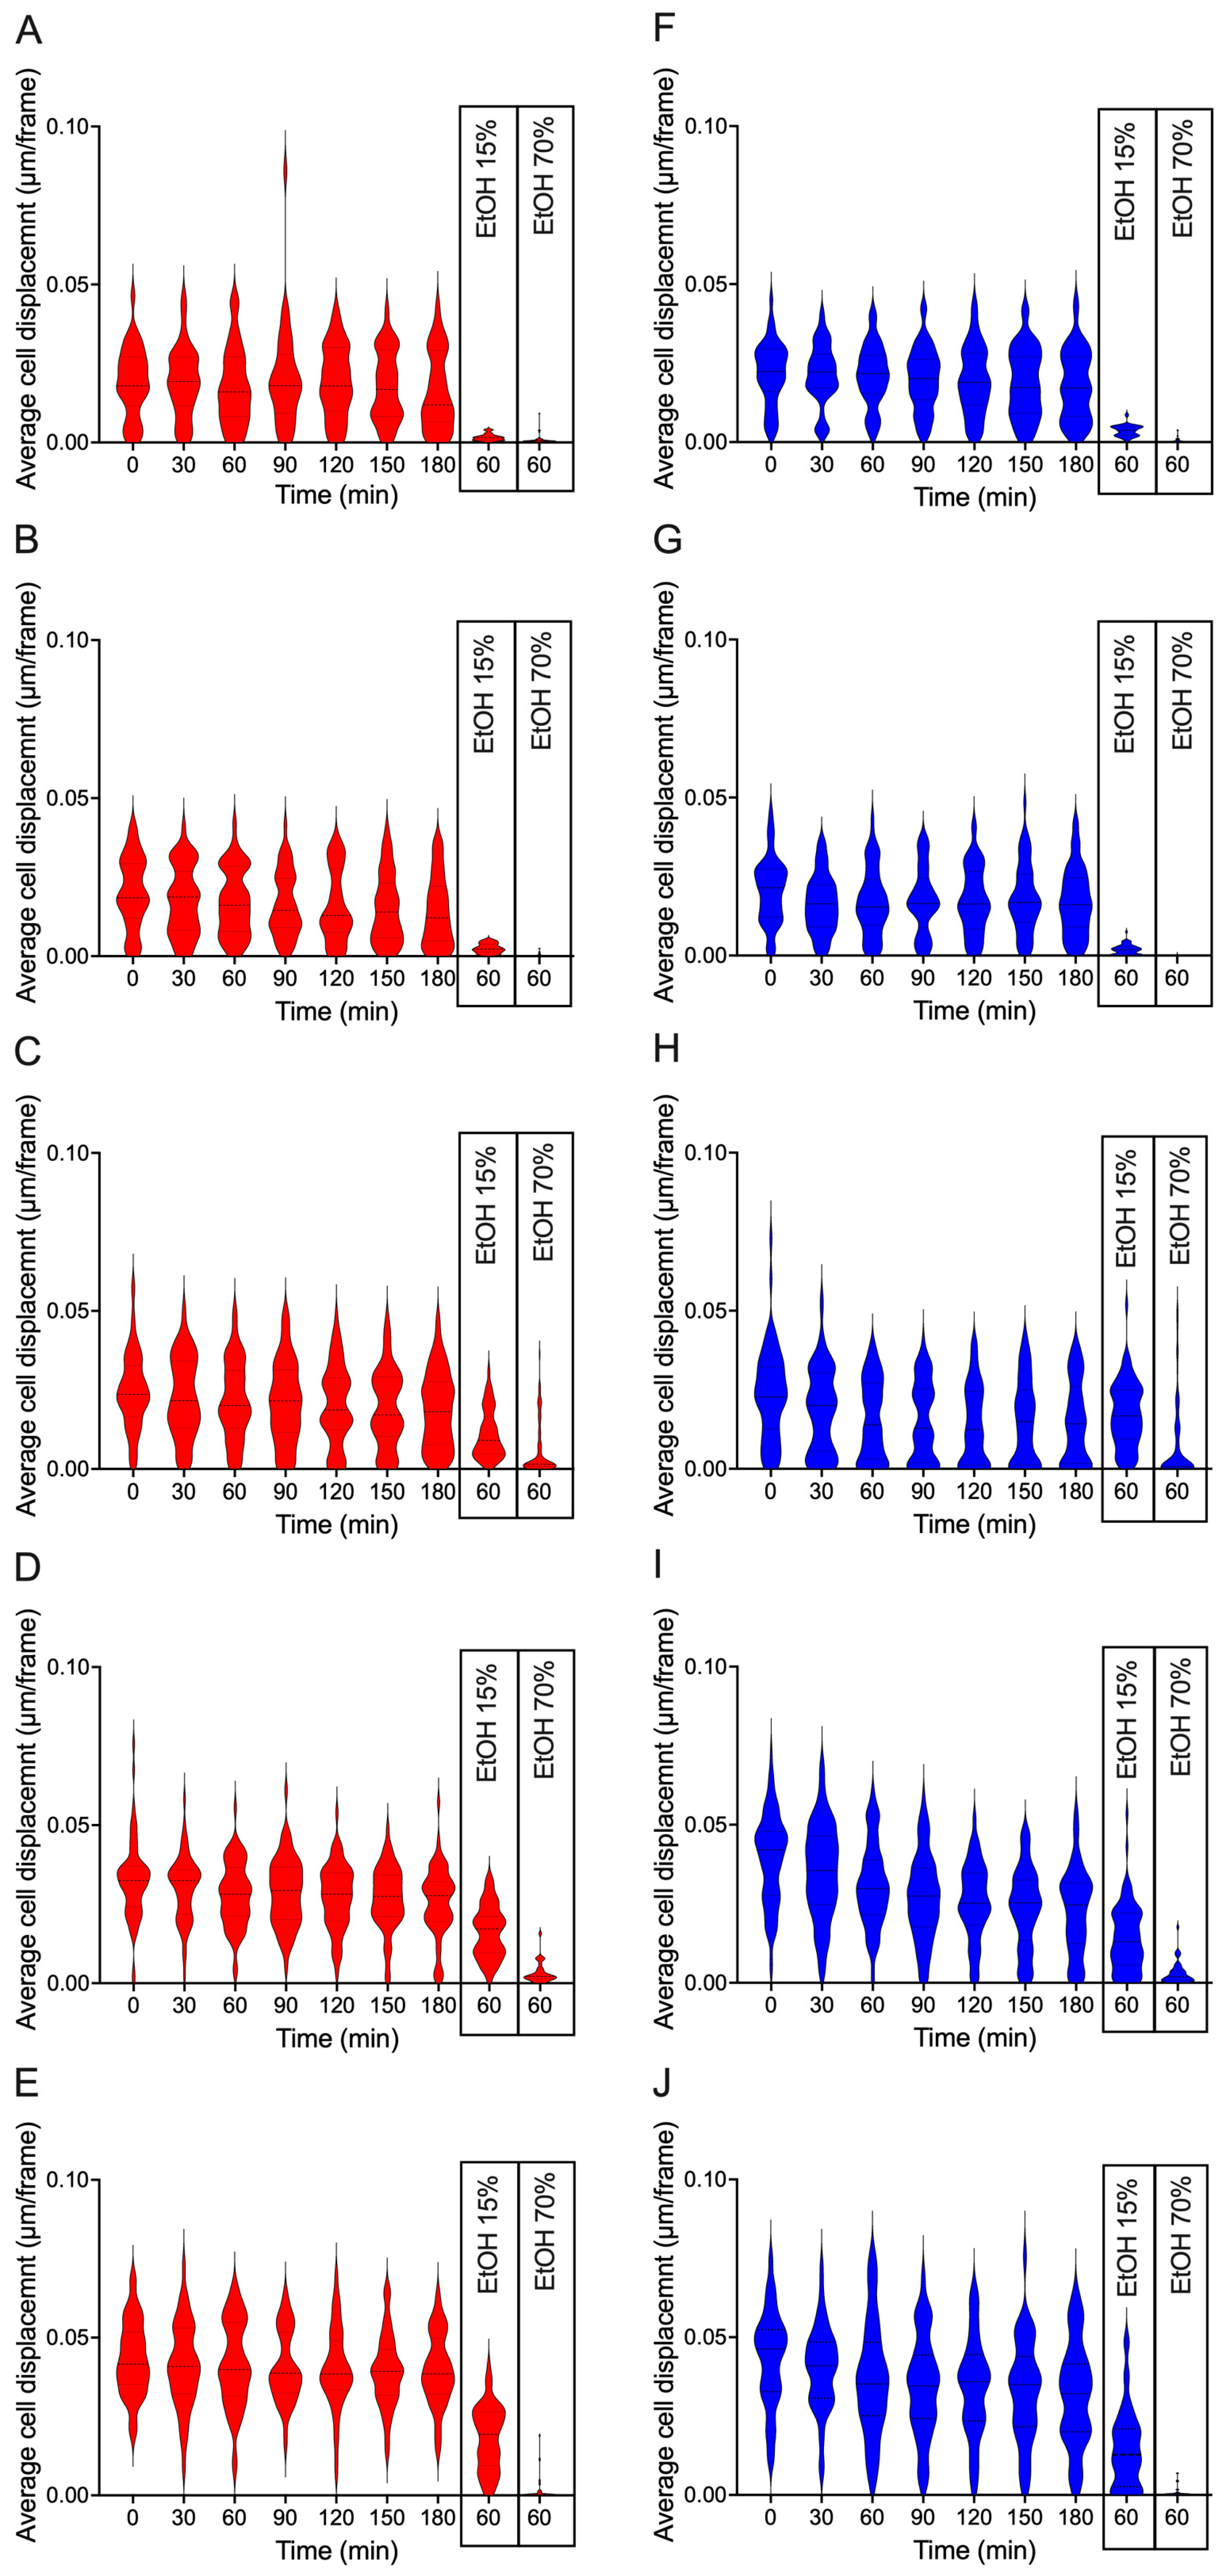
Figure 5.
Average nanomotion slopes of brewer’s yeast cells over 20 days, calculated from linear fits of displacement across seven timepoints (0 to 180 min) for the top cropped (red) and bottom cropped (blue) cells.
Figure 5.
Average nanomotion slopes of brewer’s yeast cells over 20 days, calculated from linear fits of displacement across seven timepoints (0 to 180 min) for the top cropped (red) and bottom cropped (blue) cells.
Disclaimer/Publisher’s Note: The statements, opinions and data contained in all publications are solely those of the individual author(s) and contributor(s) and not of MDPI and/or the editor(s). MDPI and/or the editor(s) disclaim responsibility for any injury to people or property resulting from any ideas, methods, instructions or products referred to in the content. |
© 2025 by the authors. Licensee MDPI, Basel, Switzerland. This article is an open access article distributed under the terms and conditions of the Creative Commons Attribution (CC BY) license (http://creativecommons.org/licenses/by/4.0/).
Copyright: This open access article is published under a Creative Commons CC BY 4.0 license, which permit the free download, distribution, and reuse, provided that the author and preprint are cited in any reuse.


