
Submitted:
24 December 2025
Posted:
25 December 2025
You are already at the latest version
Abstract
Assessing the increased impacts/risks of urban heatwaves generated by stressors such as a pan-demic period, such as the one experienced during the Covid-19 pandemic, is complicated by the lack of comprehensive information that allows for an analytical determination of the alteration produced on climate risks/impacts. Assessing the increased impacts/risks of urban heatwaves generated by stressors such as a pandemic, such as the one experienced during the COVID-19 pandemic, is complicated by the lack of comprehensive information that allows for analytical determination of the alteration in climate risks/impacts. On the other hand, it is essential for de-cision makers to understand the complex interactions between climate risks and the environ-mental and socioeconomic conditions generated by pandemics in an urban context, where specific restrictions on citizens' livability are in place to protect their health. This study aims to address this need by proposing a fuzzy multi-criteria decision-making framework in a GIS environment that intuitively allows experts to assess the increase in heatwave risk factors for the population gen-erated by pandemics. This assessment is accomplished by varying the values in the pairwise comparison matrices of the criteria that contribute to the construction of physical and socioeco-nomic vulnerability, exposure, and the hazard scenario. The framework was tested to assess heatwave impacts/risks on the population in the study area, which includes the municipalities of the metropolitan city of Naples, Italy, an urban area with high residential density where numerous summer heatwaves have been recorded over the last decade. The findings indicate a rise in im-pact/risks during pandemic times, particularly in municipalities with the greatest resident pop-ulation density, situated close to Naples.
Keywords:
fuzzy hierarchical model
; GIS-based MCDA
; heatwave
; pandemic
1. Introduction
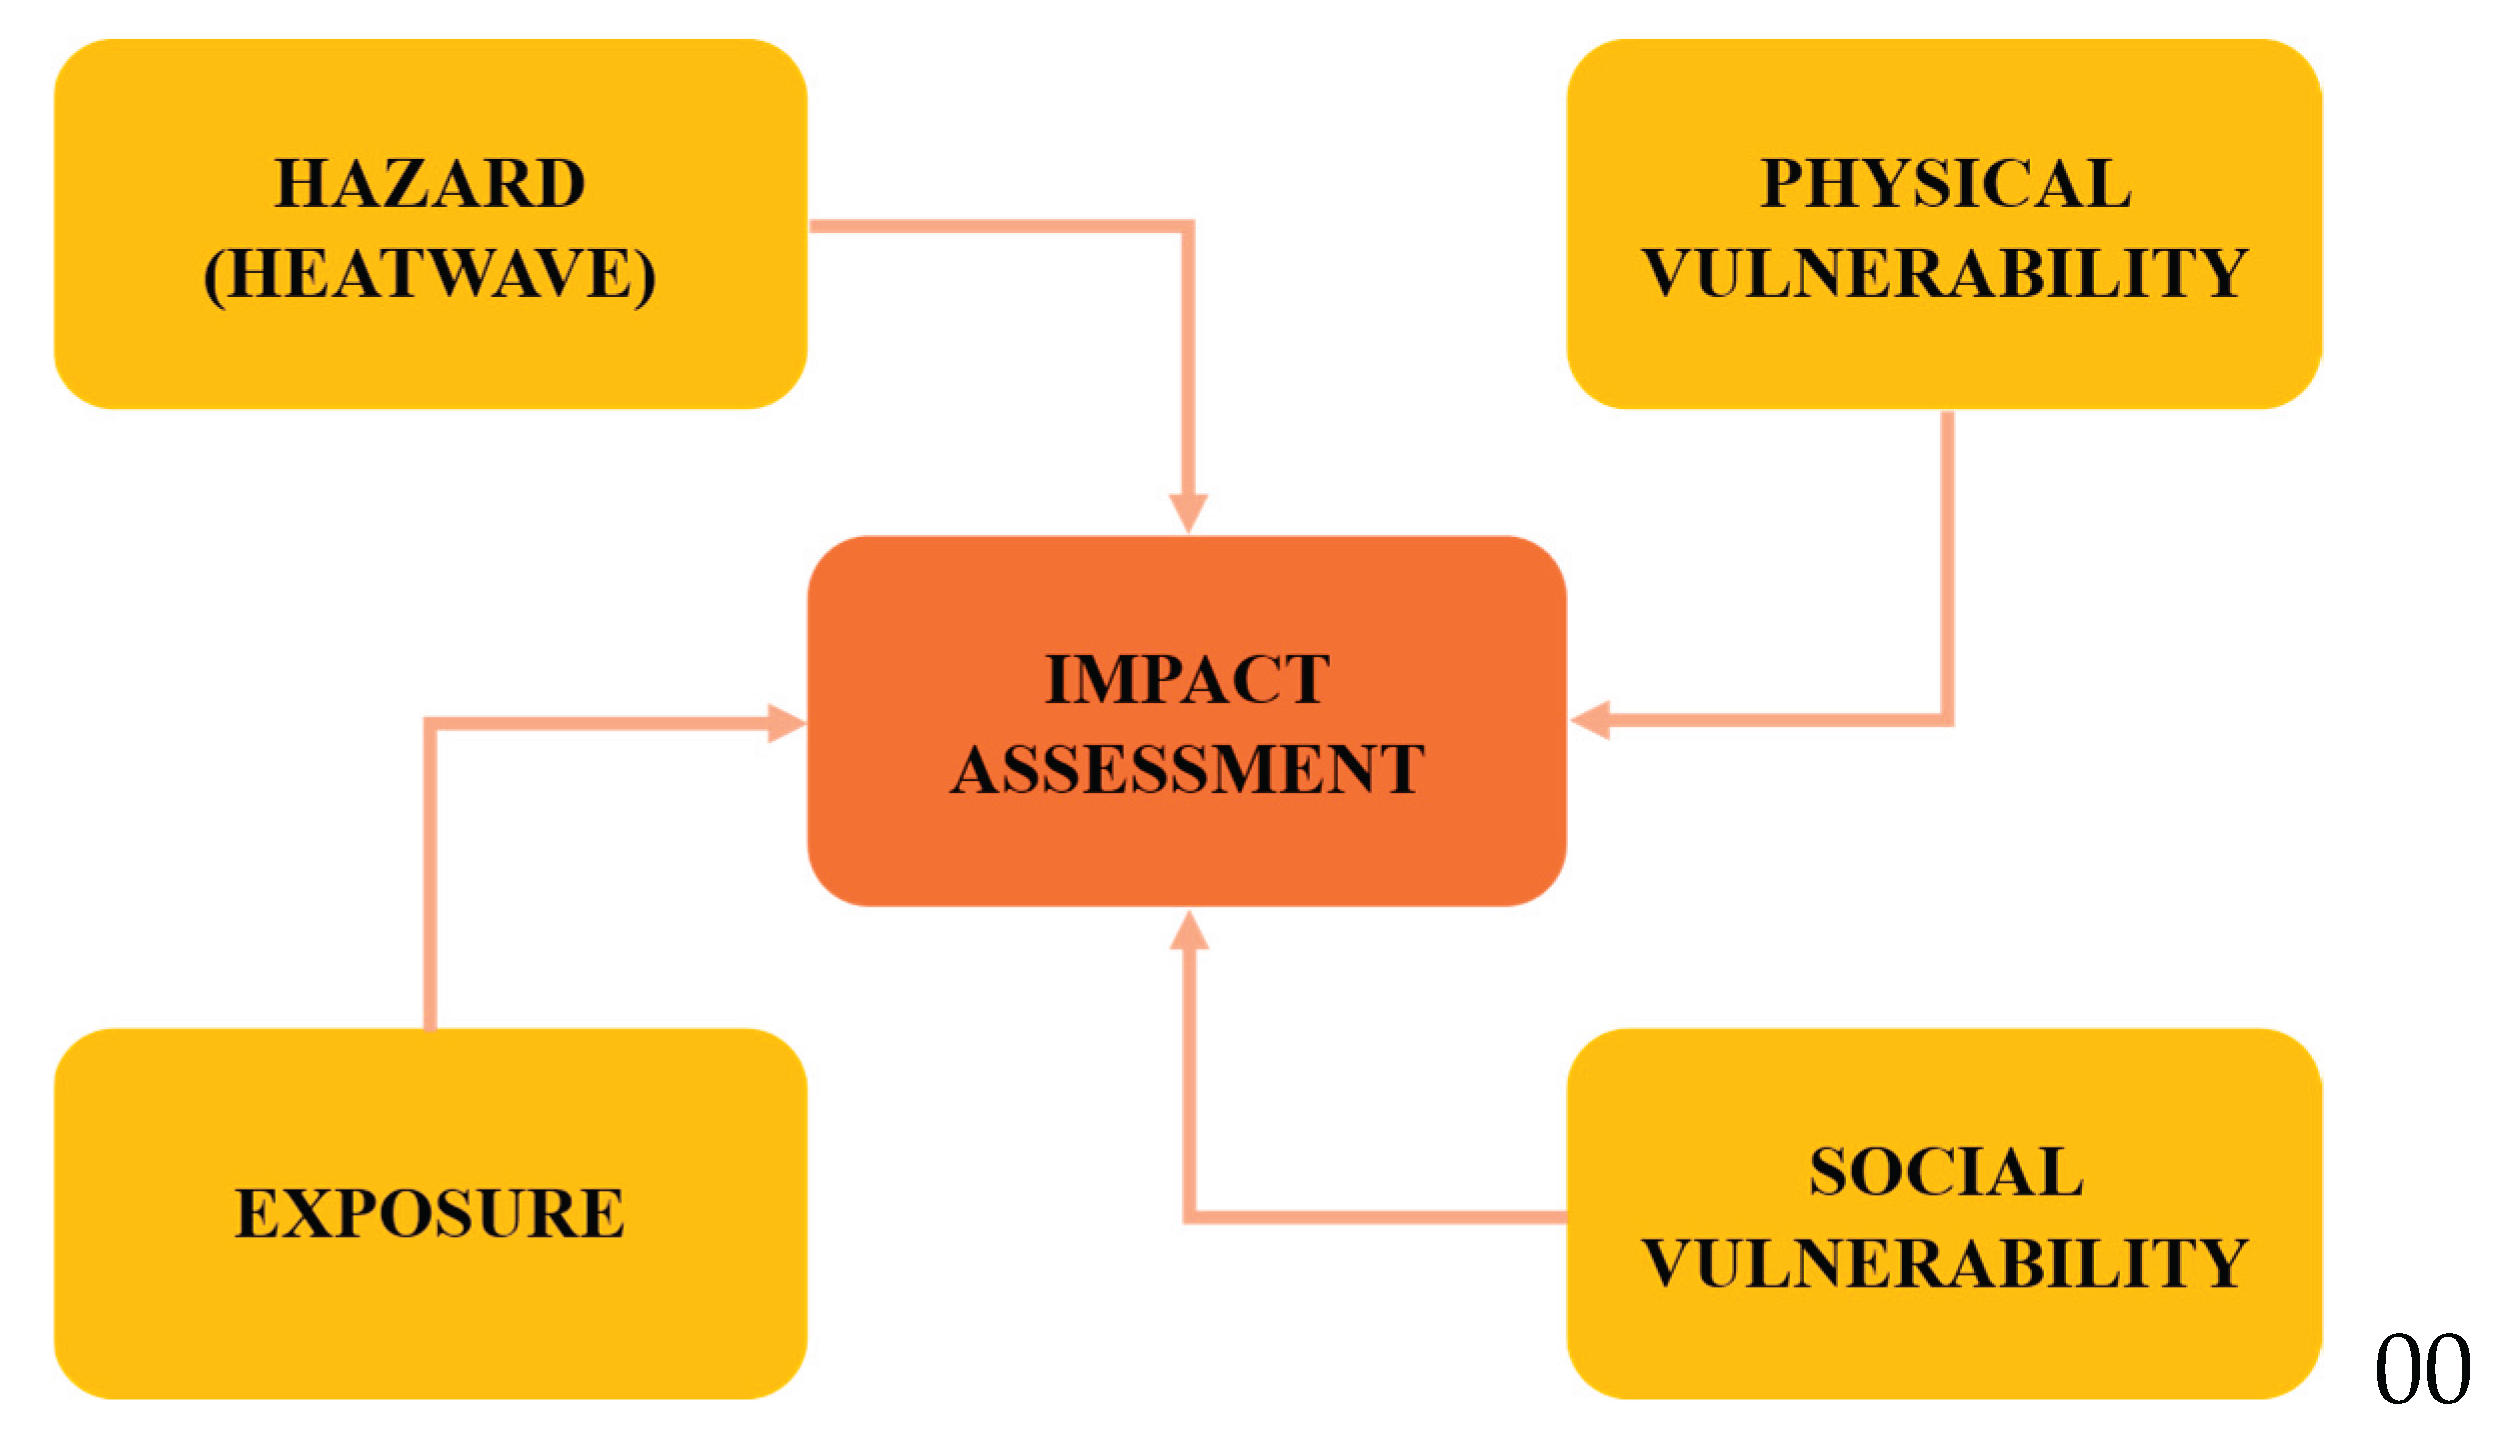
Heatwaves represent one of the most severe climate-related hazards affecting urban systems, with impacts on population that are expected to intensify due to ongoing global warming and increasing urbanization [1]. Their assessment poses a methodological challenge, since the effects of heatwaves cannot be described solely by hazard intensity but require the integration of multiple interacting components. In particular, urban impacts result from the combination of four factors: the hazard, expressed by the magnitude, duration, and spatial extent of the heatwave; exposure, which quantifies the presence of people, infrastructures, and assets potentially affected; physical vulnerability, related to the structural and morphological characteristics of the built environment; and social vulnerability, reflecting socio-demographic profiles and adaptive capacities of urban populations [2].
Figure 1.
Schema of methods for impact assessment of urban heatwaves.
Multi-criteria assessment models (MCA) provide a robust computational framework for capturing these heterogeneous factors and integrating them into a unified estimation process. By combining diverse data sources, ranging from remote sensing and climatic observations to census information and urban morphology data, MCA approaches enable the construction of composite indices that quantify impact levels across urban areas. This methodological flexibility is particularly suited to computational heatwave risk assessment applications, as it supports both deterministic and data-driven techniques. MCA-based impact estimation enhances the capacity to identify spatial heterogeneity, detect critical hotspots, and evaluate alternative adaptation strategies. Moreover, it enables the design of scalable decision-support tools that can be integrated into urban information systems and early warning platforms. In this way, the multi-criteria approach not only advances the quantitative understanding of heatwave impacts but also provides operational instruments to support urban resilience planning [3,4,5].
While the baseline multi-criteria framework integrates hazard, exposure, and vulnerability components to estimate heatwave impacts, its applicability can be further extended to account for systemic stressors that co-occur with extreme climate events. A critical example is the interaction between heatwaves and pandemics, such as the COVID-19 crisis, which revealed how simultaneous hazards can amplify urban risk and produce non-linear impact dynamics. A study conducted by [6], collecting mortality data from numerous locations in 30 European countries from 2014 to 2023, found that during exceptional heatwaves during the coronavirus pandemic, the increase in mortality was even greater, compared to that observed during heatwaves in the absence of a pandemic.
From a computational perspective, this amplification of heatwave impacts/risks generated by the presence of pandemics can be modeled introducing an additional layer of dynamic modifiers to the multi-criteria model. These modifiers capture how pandemic conditions reshape the key dimensions of impact assessment:
- Exposure is altered by changes in mobility patterns, lockdown restrictions, and the redistribution of population presence in residential vs. public spaces. During a pandemic, vulnerable populations may be more confined indoors, increasing dependence on housing quality and cooling infrastructure.
- Physical vulnerability is influenced by reduced maintenance and operational capacity of urban infrastructures, as well as shifts in energy demand peaks caused by increased stay-at-home practices.
- Social vulnerability is critically exacerbated: health system stress, economic downturn, and reduced availability of social support amplify the sensitivity of populations to heat stress. Moreover, the co-occurrence of respiratory illnesses with high temperatures increases health risks in ways not fully captured by traditional vulnerability metrics.
- Hazard perception and response capacity may also change; early-warning systems, emergency shelters, and public health interventions can become less accessible or less effective under pandemic constraints.
Methodologically, this can be operationalized by introducing a time-dependent impact change function, in which baseline heatwave impact scores are adjusted according to pandemic-related indicators (e.g., infection rates, hospital occupancy, mobility indices). Such a function allows for scenario-based simulations that reflect the compounding effects of heatwaves and pandemics, providing a more realistic representation of systemic urban risk.
However, it is very difficult to analytically determine the impact variation function over time because it depends on numerous variables, some of which, such as the growth of infections and hospital admissions, are difficult to obtain at the local scale.
The use of Multicriteria Decision-Making and Multicriteria Decision Analysis (MCDA) models [7] can represent an optimal solution for assessing heat wave risks in urban settlements in the presence of critical issues [8,9,10], due to their ease of modeling indices related to specific stressors. The use of multi-criteria fuzzy-based methods, such as Fuzzy AHP [11,12] and Fuzzy TOPSIS [13,14,15], can play a significant role in the evaluation of the criteria and stress factors produced by the concomitance of different types of hazards in urban settlements.
In [9] a MCDA model based on Fuzzy AHP is applied to assess the heat vulnerability on urban public spaces; the use of fuzzy criteria allows for a more consistent modeling of the factors that determine urban heating in public spaces, consistent with expert reasoning.
A review of fuzzy MCDA systems applied to determine heatwave risks in urban settlements and to analyze and manage urban heat islands is given in [16].
In [17] a GIS-based fuzzy MCDA framework is proposed to evaluate which urban areas were most critical in the presence of heat waves in urban settlements with high population density and built-up areas. The framework implements the fuzzy MCDA model GHF-MCDA proposed in [18] to build the hierarchy of the criteria. In this model each criterion node is associated with a fuzzy set. The expert sets the fuzzy sets in the leaf nodes and assigns the weights to each criterion, using Saaty pairwise comparison matrices [19,20]. The model determines the fuzzy sets to assign to each criterion and evaluates the criticality of each alternative, given by the membership degree to the fuzzy sets in the root node, which constitutes the alternative's suitability to meet the set of criteria.
The GHF-MCDA model is used in [21] to assess the most vulnerable urban areas in a multi-hazard climate scenario of heatwave and pluvial flooding. The urban study area is partitioned into subzones, which represent the alternatives whose criticality is assessed during the multi-hazard scenario. The degree of criticality is determined by the suitability of the alternative to meet the set of criteria, called the criticality of the subzone.
In this work a GHF-MCDA-based framework is proposed to assess the growth of heatwave impacts on residents' health during pandemic periods. This amplification of the impact/risks is determined by appropriately varying the pairwise comparison scores of the sub-criteria at the leaf nodes of the hierarchical model to increase the relevance of the most critical criteria during pandemic events. The expert assesses the impact of the pandemic's presence on a criterion related to vulnerability, exposure, or hazard indices by varying the scores of the elements of the pairwise matrix. The increase in impact/risk in a subzone is assessed by comparing the criticality obtained during a heatwave scenario in the presence of the pandemic with that obtained in its absence.
The primary objective of the proposed framework is to provide an assessment of the amplification effect of heatwave impacts/risks generated by the presence of pandemic scenarios without the need for analytical knowledge of the impact/risk stressor function generated by the pandemic scenario.
The use of a fuzzy-based GHF-MCDA model allows the expert user to construct the criteria hierarchy and to model the complexity of the entities of an urban settlement in its intrinsic and social characteristics in a simple way and close to its reasoning, in order to evaluate, based on its knowledge, the changes in the relevance of the criteria during a pandemic scenario by altering the pairwise comparison matrices between them.
The proposed framework also has the advantage of being encapsulated in a GIS-based framework, allowing for the assessment of the spatial distribution of impacts/risks during heatwaves both in the absence and presence of pandemic scenarios and to analyze where the presence of the pandemic has generated a significant increase in risks for the exposed population.
In the following section the GHF-MCDA model is discussed, and the proposed framework is presented. The results of the experimental tests carried out in the municipalities of the metropolitan city of Naples, in Italy, are shown and discussed in section 3. A brief concluding discussion on the benefits of the framework and future research perspectives is included in section 4.
2. Materials and Methods
This section outlines the approach taken to evaluate the increased impacts/risks of heatwave scenarios during pandemics. The next section describes the GHF-MCDA model. The following paragraph outlines the GHF-MCDA model. Section 2.2 outlines the suggested framework; Section 2.3 details the framework's application used to assess how pandemic-related challenges impact heatwave risks in urban areas.
2.1. Preliminaries: The GHF-MCDA Model
The GHF-MCDA model ([17,21]) is a hierarchical fuzzy-based MCDA model aimed at assigning to each subzone into which an urban area is divided a score related to the degree to which it meets a set of criteria.
Let A = {a1, a2,…,am} be the set of alternatives given by the urban m subzones. Let r1, r2,…,rn be a set of n criteria, where the criterion rk is expressed as a linguistic label of the fuzzy set:
and denotes the membership degree assigned to the ith alternative in meeting the kth criterion.
To the kth criterion is assigned a weight αk called Coefficient of Relative Significance (for short, CRS) [22]; it denotes the relevance of the kth criterion in selecting the best alternative. The value of αk ranges in [0,1], and the following constraint holds:
To determine αk the Saaty’s AHP pairwise comparison matrix is used. Let B be the pairwise comparison nxn matrix where bkj, gives the relevance of the criterion rk with respect to the criterion rj. The values that can be assigned to bkj are shown in Table 1. The conjugate elements bjk are set to 1/ bkj and the diagonal elements bkk are set to 1.
The CRS value αk of the kth criterion is given by:
where is the kth component of the normalized eigenvector w corresponds to the greatest eigenvalue solution of the characteristic equation:
The fuzzy set R is assigned to criterion r, placed at the root of the criteria hierarchy, where:
The membership degree of the ith alternative to the fuzzy set R is given by:
It constitutes the score assigned to the ith alternative.
In GHF-MCDA, each criterion is decomposed into a hierarchy of sub-criteria. Let be the kth criterion at the level h and let be its nk sub-criteria at the level h+1. The fuzzy set assigned to is given by:
and the membership degree of the ith alternative to Rk(h) is given by
To a criterion in ta leaf node the expert assigns a fuzzy set given by a triangular fuzzy number (TFN) [23] built on the numerical domain of a numerical index used to evaluate how much the subzone meets the criterion; a TFN is easily created by setting three domain values (α, β, γ), with α ≤ β ≤ γ, which allows to construct a triangular membership function of the form
Two other types of TFN’s used in [17] in describing the fuzzy sets of the sub-criteria at the nodes are the semi-trapezoidal fuzzy sets Right function (R-function) and Left function (L-function).
A R-function is defined by two numbers α and β, with α ≤ β. It is generally used to create the first fuzzy set in the fuzzy partition of a numerical domain and is given by:
A L-function is defined by two numbers α and β, with α ≤ β. It is generally used to create the last fuzzy set in the fuzzy partition of a numerical domain and is given by:
To illustrate the process, a simple model is considered in which a root criterion is broken down into 3 leaf sub-criteria. Let’s define the root criterion r called Good livability. It is hierarchically broken down into three leaf sub-criteria r1, r2 and r3, called, respectively: High employment rate, Low crime rate and Medium per capita income.
The fuzzy set R1 High employment rate is created on the domain of an index that measures the percentage of employed people in relation to all employable residents in the subzone, ranging from 0 to 100. It is given by the following L-function TFN:
The fuzzy set R2 Low crime rate is created on the measure of the number of crime events detected in the last year, ranging from 0 to 2000. It is given by the following R-function TFN:
The fuzzy set of Medium per capita income is created on the measure of the annual average of the per capita income of the citizens, ranging from 0 to 100,000 €. It is given by the following TFN:
The three fuzzy sets, created as triangular numbers, are shown in Figure 2.
Let the values of the three indices measured for the ith subzone be: employment rate = 58%, crime rate = 301 and per capita income = 35,000 €. Then, the values of the membership degree of the three fuzzy sets are: , , .
Suppose we consider the first two sub-criteria equally important and the third slightly more important than the other two. Saaty's pairwise comparison matrix is given by:

Table 2.
Saaty’s pairwise comparison matrix for the criterion Good livability in the example.
| 1 | 1 | ½ |
| 1 | 1 | ½ |
| 2 | 2 | 1 |
The greatest eigenvalue is given by = λ = 3 and the corresponding eigenvector is v = (½, ½, 1). Its normalized value is: (0.25,0.25,0.50).
The CRS’s of the three sub-criteria are, respectively, , and Then, the membership degree to the fuzzy set R, assigned to the criterion r is:
. It is the score assigned to the ith alternative in satisfying the criterion.
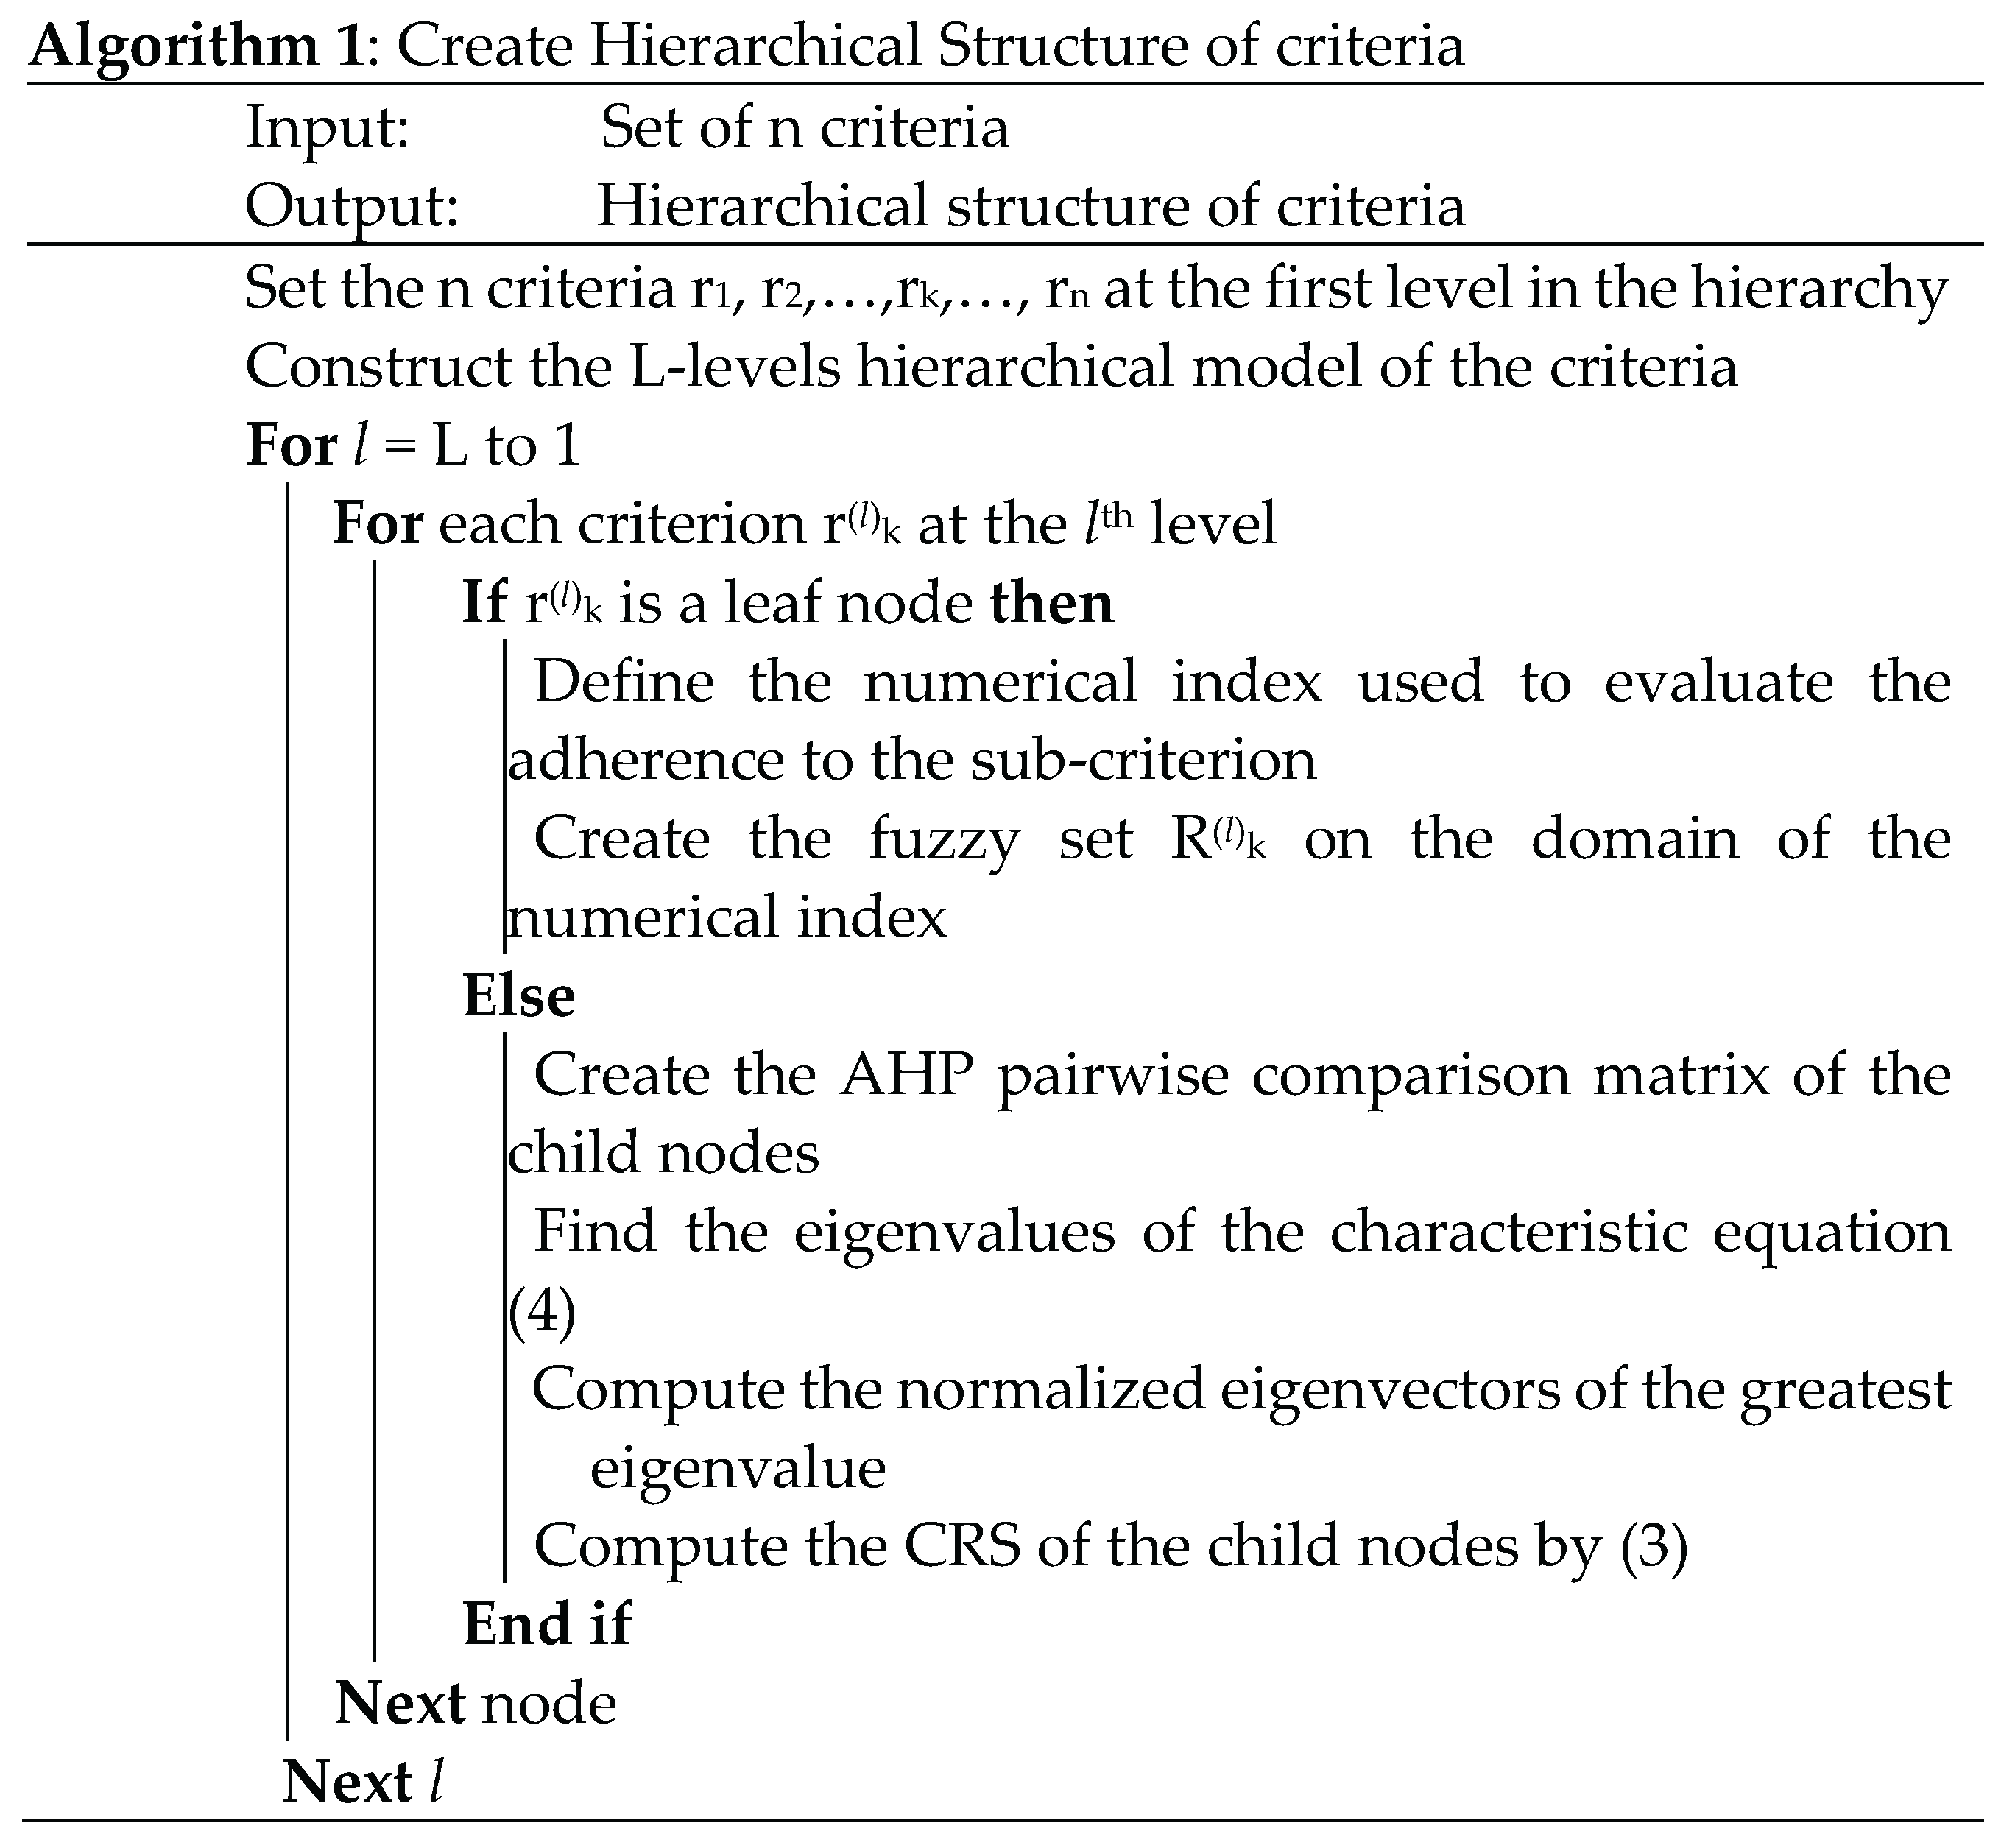
The GHF-MCDA method is implemented in two phases. In the first phase the domain expert creates the hierarchical structure of criteria assigning the fuzzy sets to each leaf sub-criterion. In Algorithm 1 is structured in pseudocode this phase. For each leaf sub-criterion the expert defines the numerical index used to evaluate the adherence to the sub-criterion and create as a fuzzy number the corresponding fuzzy set. For each other criterion the eigenvalues solutions of the characteristic equation (4) are found, and the eigenvectors of the greatest eigenvalue are determined; then the CRS assigned to the child nodes are calculated by (3).
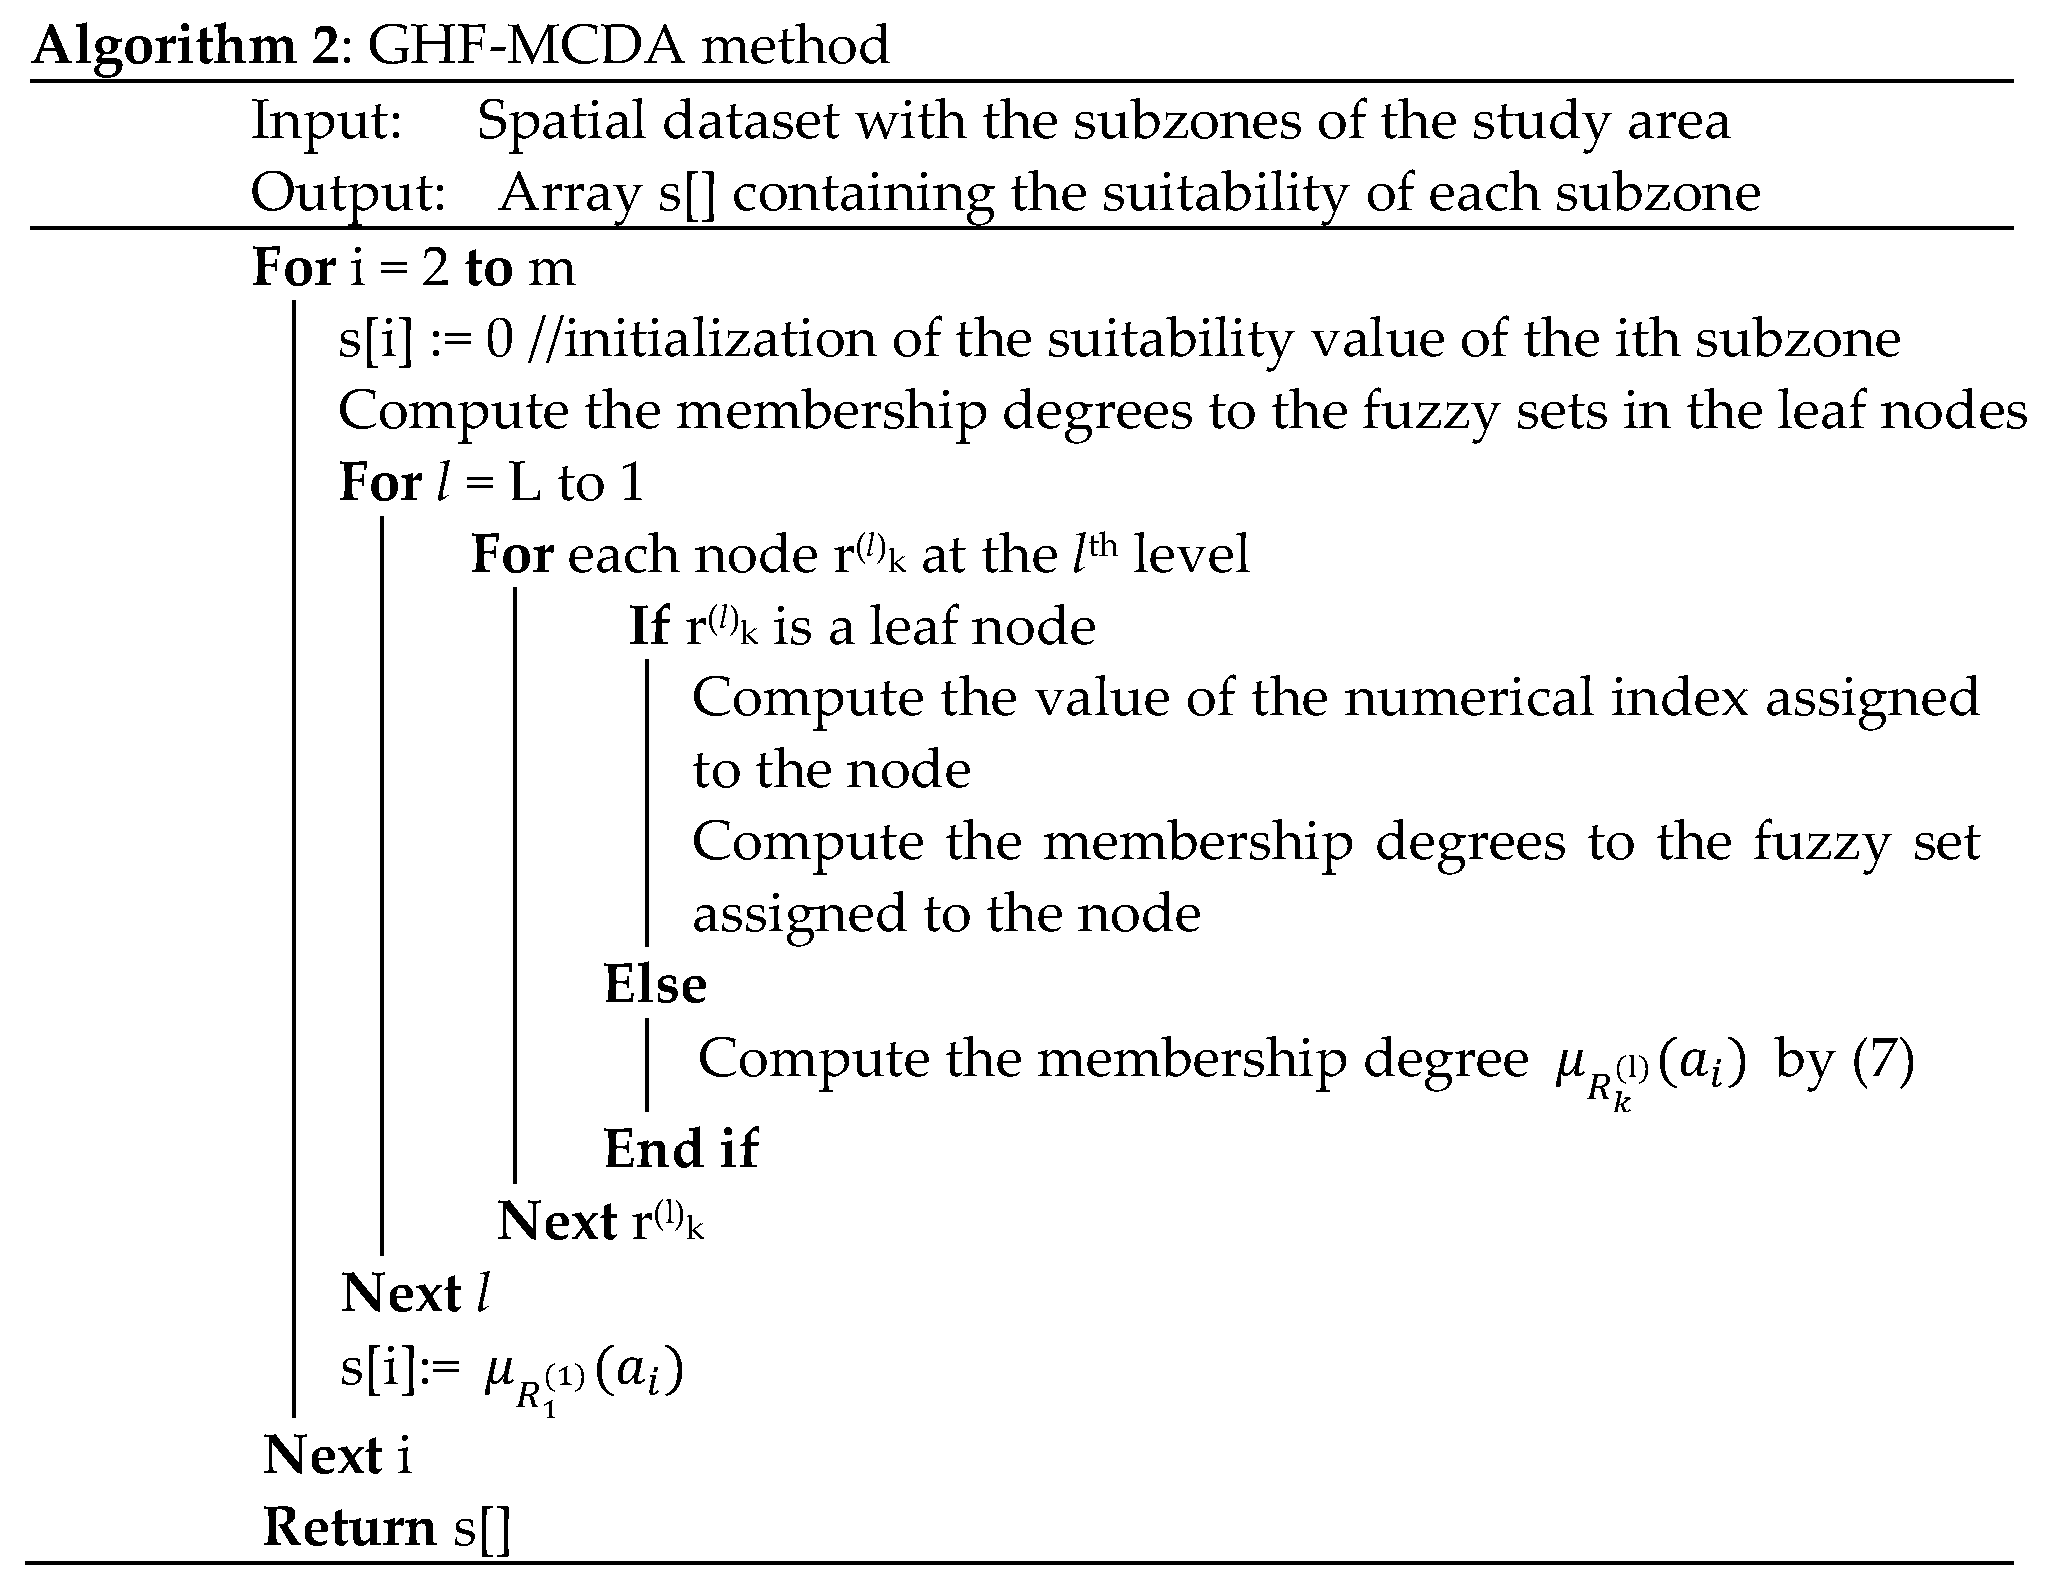
In the next phase, after partitioning the study area into subzones, the values of the indices associated with each leaf node are calculated for each subzone. Subsequently, for each subzone, the GHF-MCDA method, starting from the leaf nodes, determines the membership degrees to the fuzzy sets in each node based on the membership degrees to the fuzzy sets in its sub nodes, using formula (5). The suitability of the ith subzone is given by the membership degree of the subzone to the fuzzy set assigned to the radix criterion .
The algorithm will end when the membership degree to the fuzzy set of the root node, which constitutes the suitability level of the subzone, has been determined for all the subzones. The GHF-MCDA method is schematized in pseudocode in Algorithm 2.
2.2. The Proposed Framework and Its Application to Assess the Impacts of Heatwave During Pademics
The proposed framework aims to estimate the worsening of impacts/risks generated by heatwaves, in the presence of pandemic scenarios. The GHF-MCDA model is applied to evaluate the impacts generated by heatwave phenomena both during normal times (normal scenario) and during a pandemic emergency (pandemic scenario).
To simulate the effect of the pandemic, variations are made to the values of the pairwise comparisons between the criteria, which will generate variations in the CRSs assigned to the criteria.
The flow diagram in Figure 2 schematizes the framework.
In the preprocessing phase is created the MCDA hierarchical structure to assess the impact/risk of a heatwave phenomenon in the normal and pandemic scenario; . In this phase the indices assigned to the leaf nodes and the fuzzy sets are defined.
During the data acquisition phase the data extracted from the census and remote sensed datasets are imported; then, the study area is partitioned in subzones and the values of the indices are calculated by subzone.
In the next phase, for each of the two scenarios, normal and pandemic, the pairwise comparison matrices between criteria are defined and the GHF-MCDA method is executed, where the suitability assigned to each subzone represents the criticality of the subzone in the presence of the hazard scenario. Finally, the resultant criticality maps are compared, and the criticality increase map is created, showing in which subzones the criticality assessed in the normal scenario is significantly increased in the pandemic scenario.
The criticality increase map allows to analyze in which subzones the risks/impacts have significantly worsened due to the presence of the pandemic. If CNi is the criticality of the ith subzone assigned in the normal scenario and CPi is the criticality of the ith subzone assigned in the pandemic scenario, then the criticality increase in the ith sunzone is given by the formula:
It expresses as a percentage the increase in the criticality of the sub-zone in the new pandemic scenario.
The framework in Figure 3 is applied to assess the impact/risks of urban subzones during heat waves.
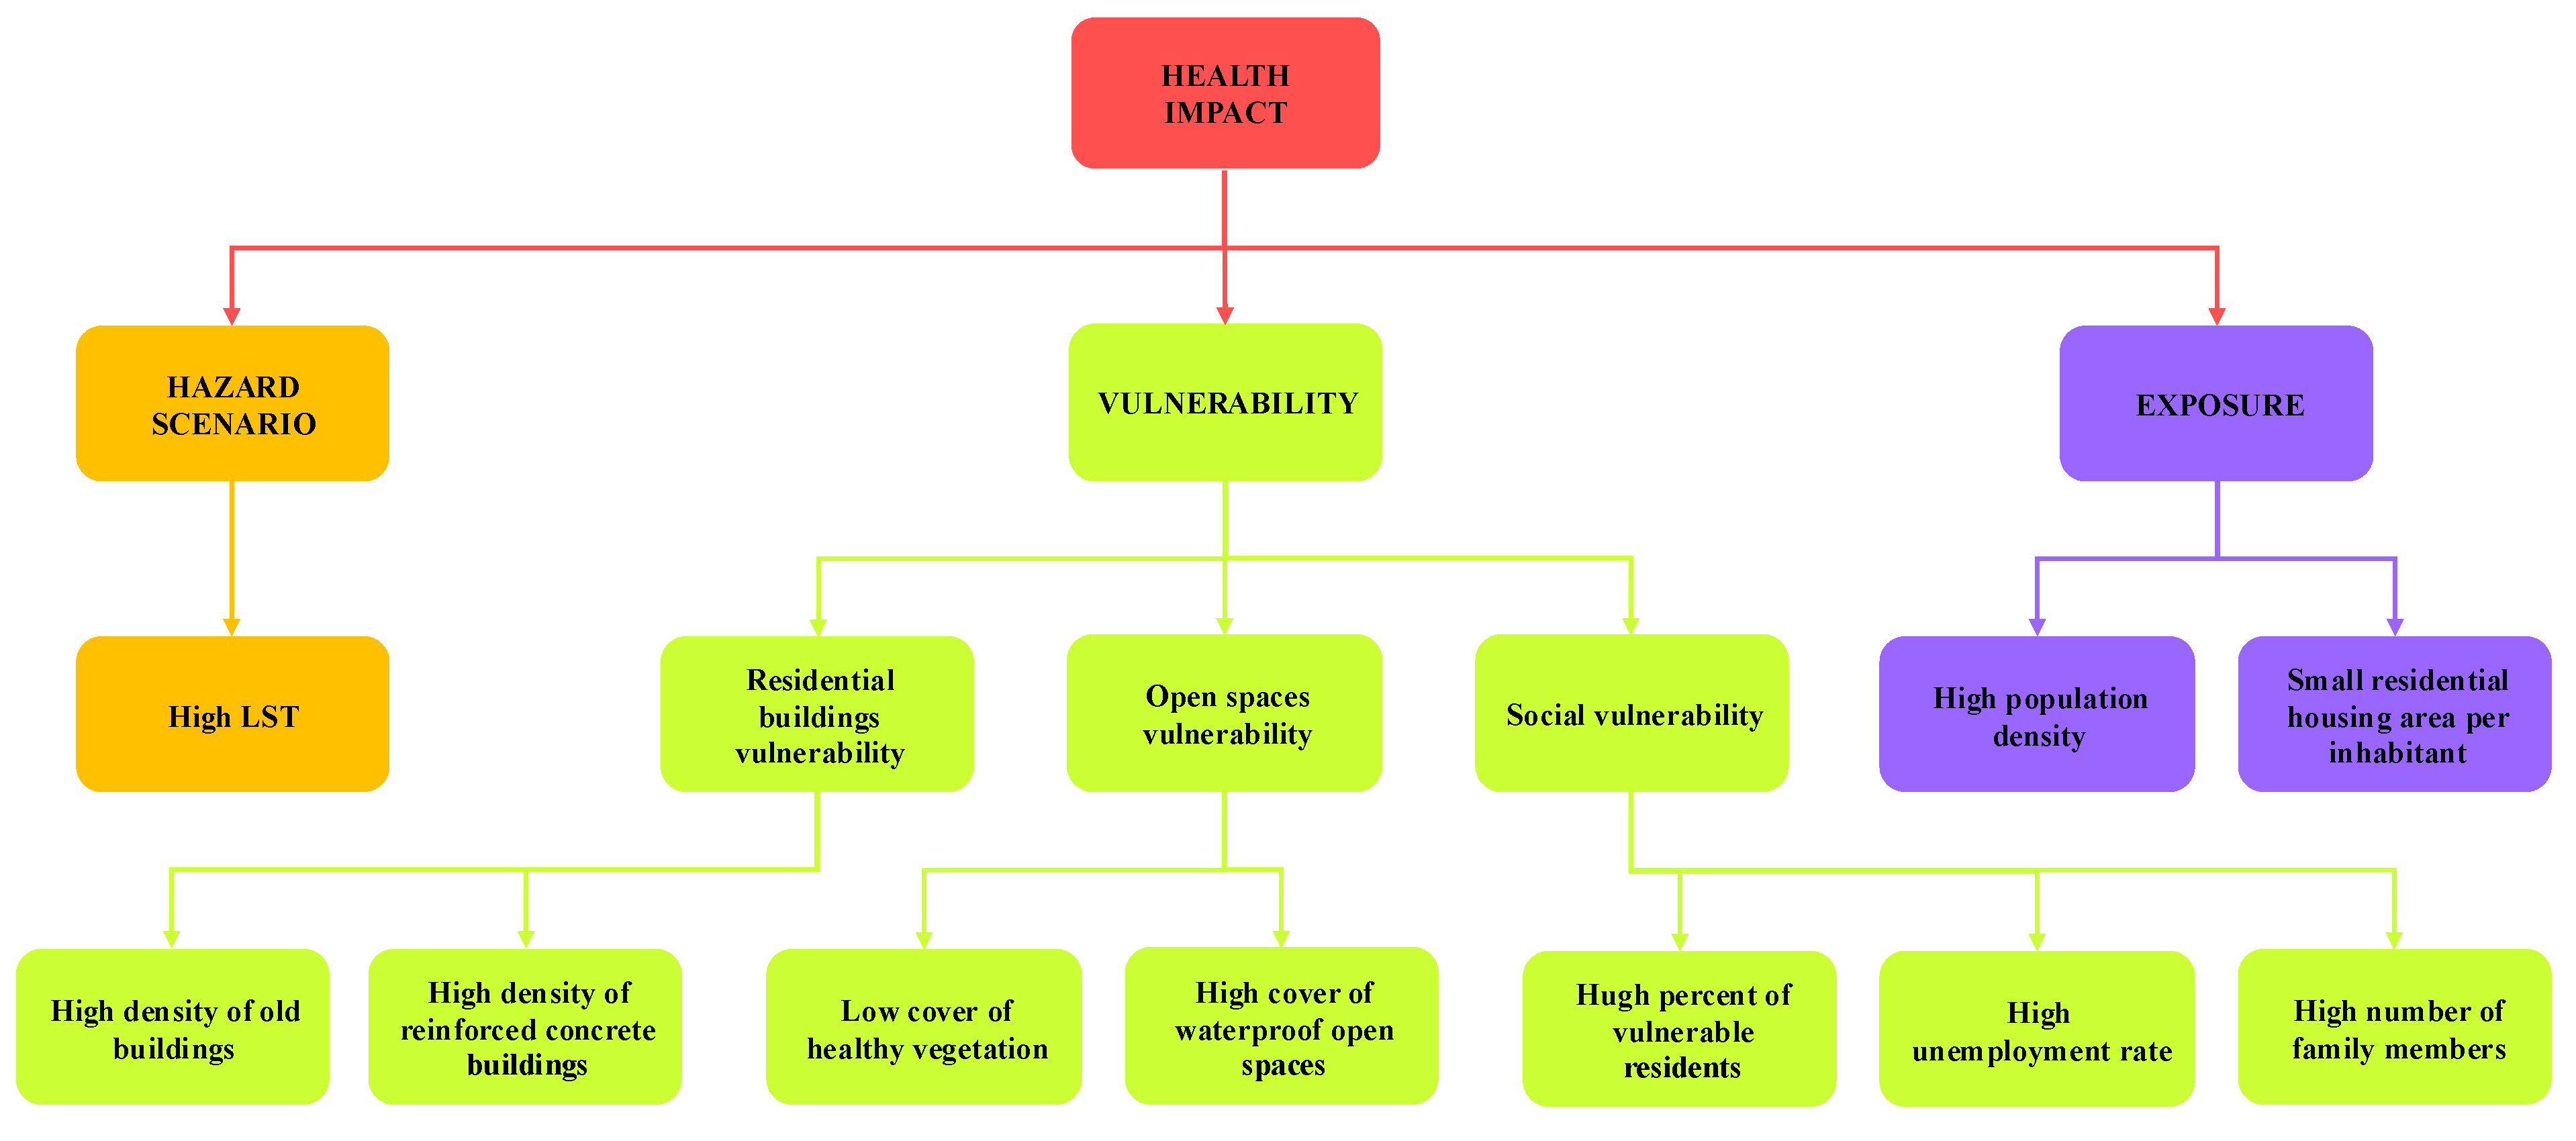
Figure 4 shows the hierarchical structure of the criteria. The radix node is the health impact generated by a heatwave hazard scenario. The criticality values CNi and CPi provides the impact on the health of the residents in the ith subzone, respectively, in the presence of the normal and the pandemic scenario.
The hazard scenario is evaluated by measuring the Land Temperature Surface (LST), a satellite measure of the soil temperature, and calculating the mean LST in the subzone.
The exposure is evaluated by measuring both the population living in the subzone and the population density.
The vulnerability is partitioned in the vulnerability of the physical element’s residential buildings and open spaces and in the social vulnerability. The residential buildings’ vulnerability is evaluated by considering the density of old buildings and the density of reinforced concrete buildings. Open space vulnerability is evaluated by considering the coverage of healthy vegetation and of waterproof soil; these two measures are obtained by the satellite Normalized Difference Vegetation Index (NDVI). Social vulnerability is evaluated by measuring the percentage of vulnerable residents, and the unemployment and homeless rates.
Figure 4.
Hierarchical structure of the criteria.
In Table 1, for each leaf sub-criterion is described the index related to the criterion and the source used to calculate the index.
Table 1.
Description of the indices related to the leaf subcriteria.
| Parent criterion | Leaf subcriterion | Index | Source |
| Hazard scenario | High LST | Mean Land Surface Temperature in the subzone | Multispectral satellite imaging |
| Exposure | High population density | Number of residents by kmq | Population and building census |
| Small residential housing area per inhabitant | Average residential housing area per inhabitant, in square meters | Population and building census | |
| Residential building vulnerability | High density of old buildings | Number of old buildings by kmq | Population and building census |
| High reinforced concrete buildings | Number of reinforced concrete buildings by kmq | Population and building census | |
| Open spaces vulnerability | Low cover of healthy vegetation | Surface covered by healthy vegetation whit respect to the surface of the subzone | Multispectral satellite imaging |
| High cover of waterproof open spaces | Surface covered by waterproof open spaces whit respect to the surface of the subzone | Multispectral satellite imaging | |
| Social vulnerability | High percent of vulnerable residents | Percentage of vulnerable residents (sum of the number of children under 5 years old and the number of elderly people aged 65 and over) with respect to the number of inhabitants | Population and building census |
| High unemployment rate | Percent of unemployment residents | Population and building census | |
| High number of family members | Mean number of members per family | Population and building census |
The pairwise comparison matrices between sub criteria refer to a normal scenario are reported in Table 2, Table 3, Table 4, Table 5, Table 6 and Table 7. The pairwise comparisons were constructed based on the assessments performed by an expert in climate risk issues in urban settlements.
Table 2.
Pairwise comparison matrix of the radix criterion Health impact in a normal scenario.
| Hazard scenario | Exposure | Vulnerability | |
| Hazard Scenario | 1 | 1 | 1 |
| Exposure | 1 | 1 | 1 |
| Vulnerability | 1 | 1 | 1 |
Table 3.
Pairwise comparison matrix of the radix criterion Exposure in a normal scenario.
| High population density | Small residential housing area per inhabitant | |
| High population density | 1 | 1 |
| Small residential housing area per inhabitant | 1 | 1 |
Table 4.
Pairwise comparison matrix of the radix criterion Vulnerability in a normal scenario.
| Residential building vulnerability | Open space vulnerability | Social vulnerability | |
| Residential building vulnerability | 1 | 2 | 1 |
| Open spaces vulnerability | 1/2 | 1 | 1/2 |
| Social vulnerability | 1 | 2 | 1 |
Table 5.
Pairwise comparison matrix of the radix criterion Residential building vulnerability in a normal scenario.
Table 5.
Pairwise comparison matrix of the radix criterion Residential building vulnerability in a normal scenario.
| High density of old buildings | High density of reinforced concrete buildings | |
| High density of old buildings | 1 | 2 |
| High density of reinforced concrete buildings | 1/2 | 1 |
Table 6.
Pairwise comparison matrix of the radix criterion Open spaces vulnerability in a normal scenario.
Table 6.
Pairwise comparison matrix of the radix criterion Open spaces vulnerability in a normal scenario.
| Low cover of healthy vegetation | High cover of waterproof open spaces | |
| Low cover of healthy vegetation | 1 | 3 |
| High cover of waterproof open spaces | 1/3 | 1 |
Table 7.
Pairwise comparison matrix of the radix criterion Social vulnerability in a normal scenario.
Table 7.
Pairwise comparison matrix of the radix criterion Social vulnerability in a normal scenario.
| High percent of vulnerable residents | High unemployment rate | High number of family members | |
| High percent of vulnerable residents | 1 | 1 | 1 |
| High unemployment rate | 1 | 1 | 1 |
| High number of family members | 1 | 1 | 1 |
The expert was asked to review the pairwise comparison matrices to see what changes to make in a heatwave pandemic scenario.
The following tables show the revised pairwise comparison matrices in a pandemic scenario.
The pairwise comparison matrix of the radix criterion Health impact has not undergone any changes. Instead, the pairwise comparison matrix of the criterion Exposure is changed (Table 8). The expert believed that in a pandemic scenario, residential housing area per inhabitant is a slightly more significant indicator than the population density. In bold are shown the modified scores.
In the pairwise comparison matrix of the criterion Vulnerability the expert believed that in a pandemic scenario, the social vulnerability is of equal or slightly more significant than the building vulnerability and is slightly more important than the open space vulnerability (Table 9).
The pairwise comparison matrices of the criteria Residential building vulnerability and Open space vulnerability have not undergone any changes. Instead, the pairwise comparison matrix of the criterion Social vulnerability is changed (Table 10). The expert believed that in a pandemic scenario, the percentage of vulnerable residents is more significant than the unemployment rate and the homeless rate (Table 10). This assessment is motivated by the fact that, in times of pandemic emergency, young children and the elderly are particularly vulnerable compared to other segments of the resident population.
The GHF-MCDA algorithm is run twice, once for the normal scenario and once for the pandemic scenario. Result of the GHF-MCDA algorithm is a criticality thematic map showing the spatial distribution by subzone of the criticality in the range [0,1]. The criticality increase map is obtained comparing the criticality values obtained for the two scenarios
3. Results and Discussion
The framework was tested on a study area comprising all 92 municipalities of the metropolitan city of Naples, Italy (Figure 5). The 92 municipalities constitute the subzones whose health impacts are assessed during normal and pandemic scenarios.
In the study area, several summer heat waves have been recorded in recent years, which can generate health alarms, due to the high average density of the resident population.
Figure 5.
The municipalities in the metropolitan city of Naples (Italy).
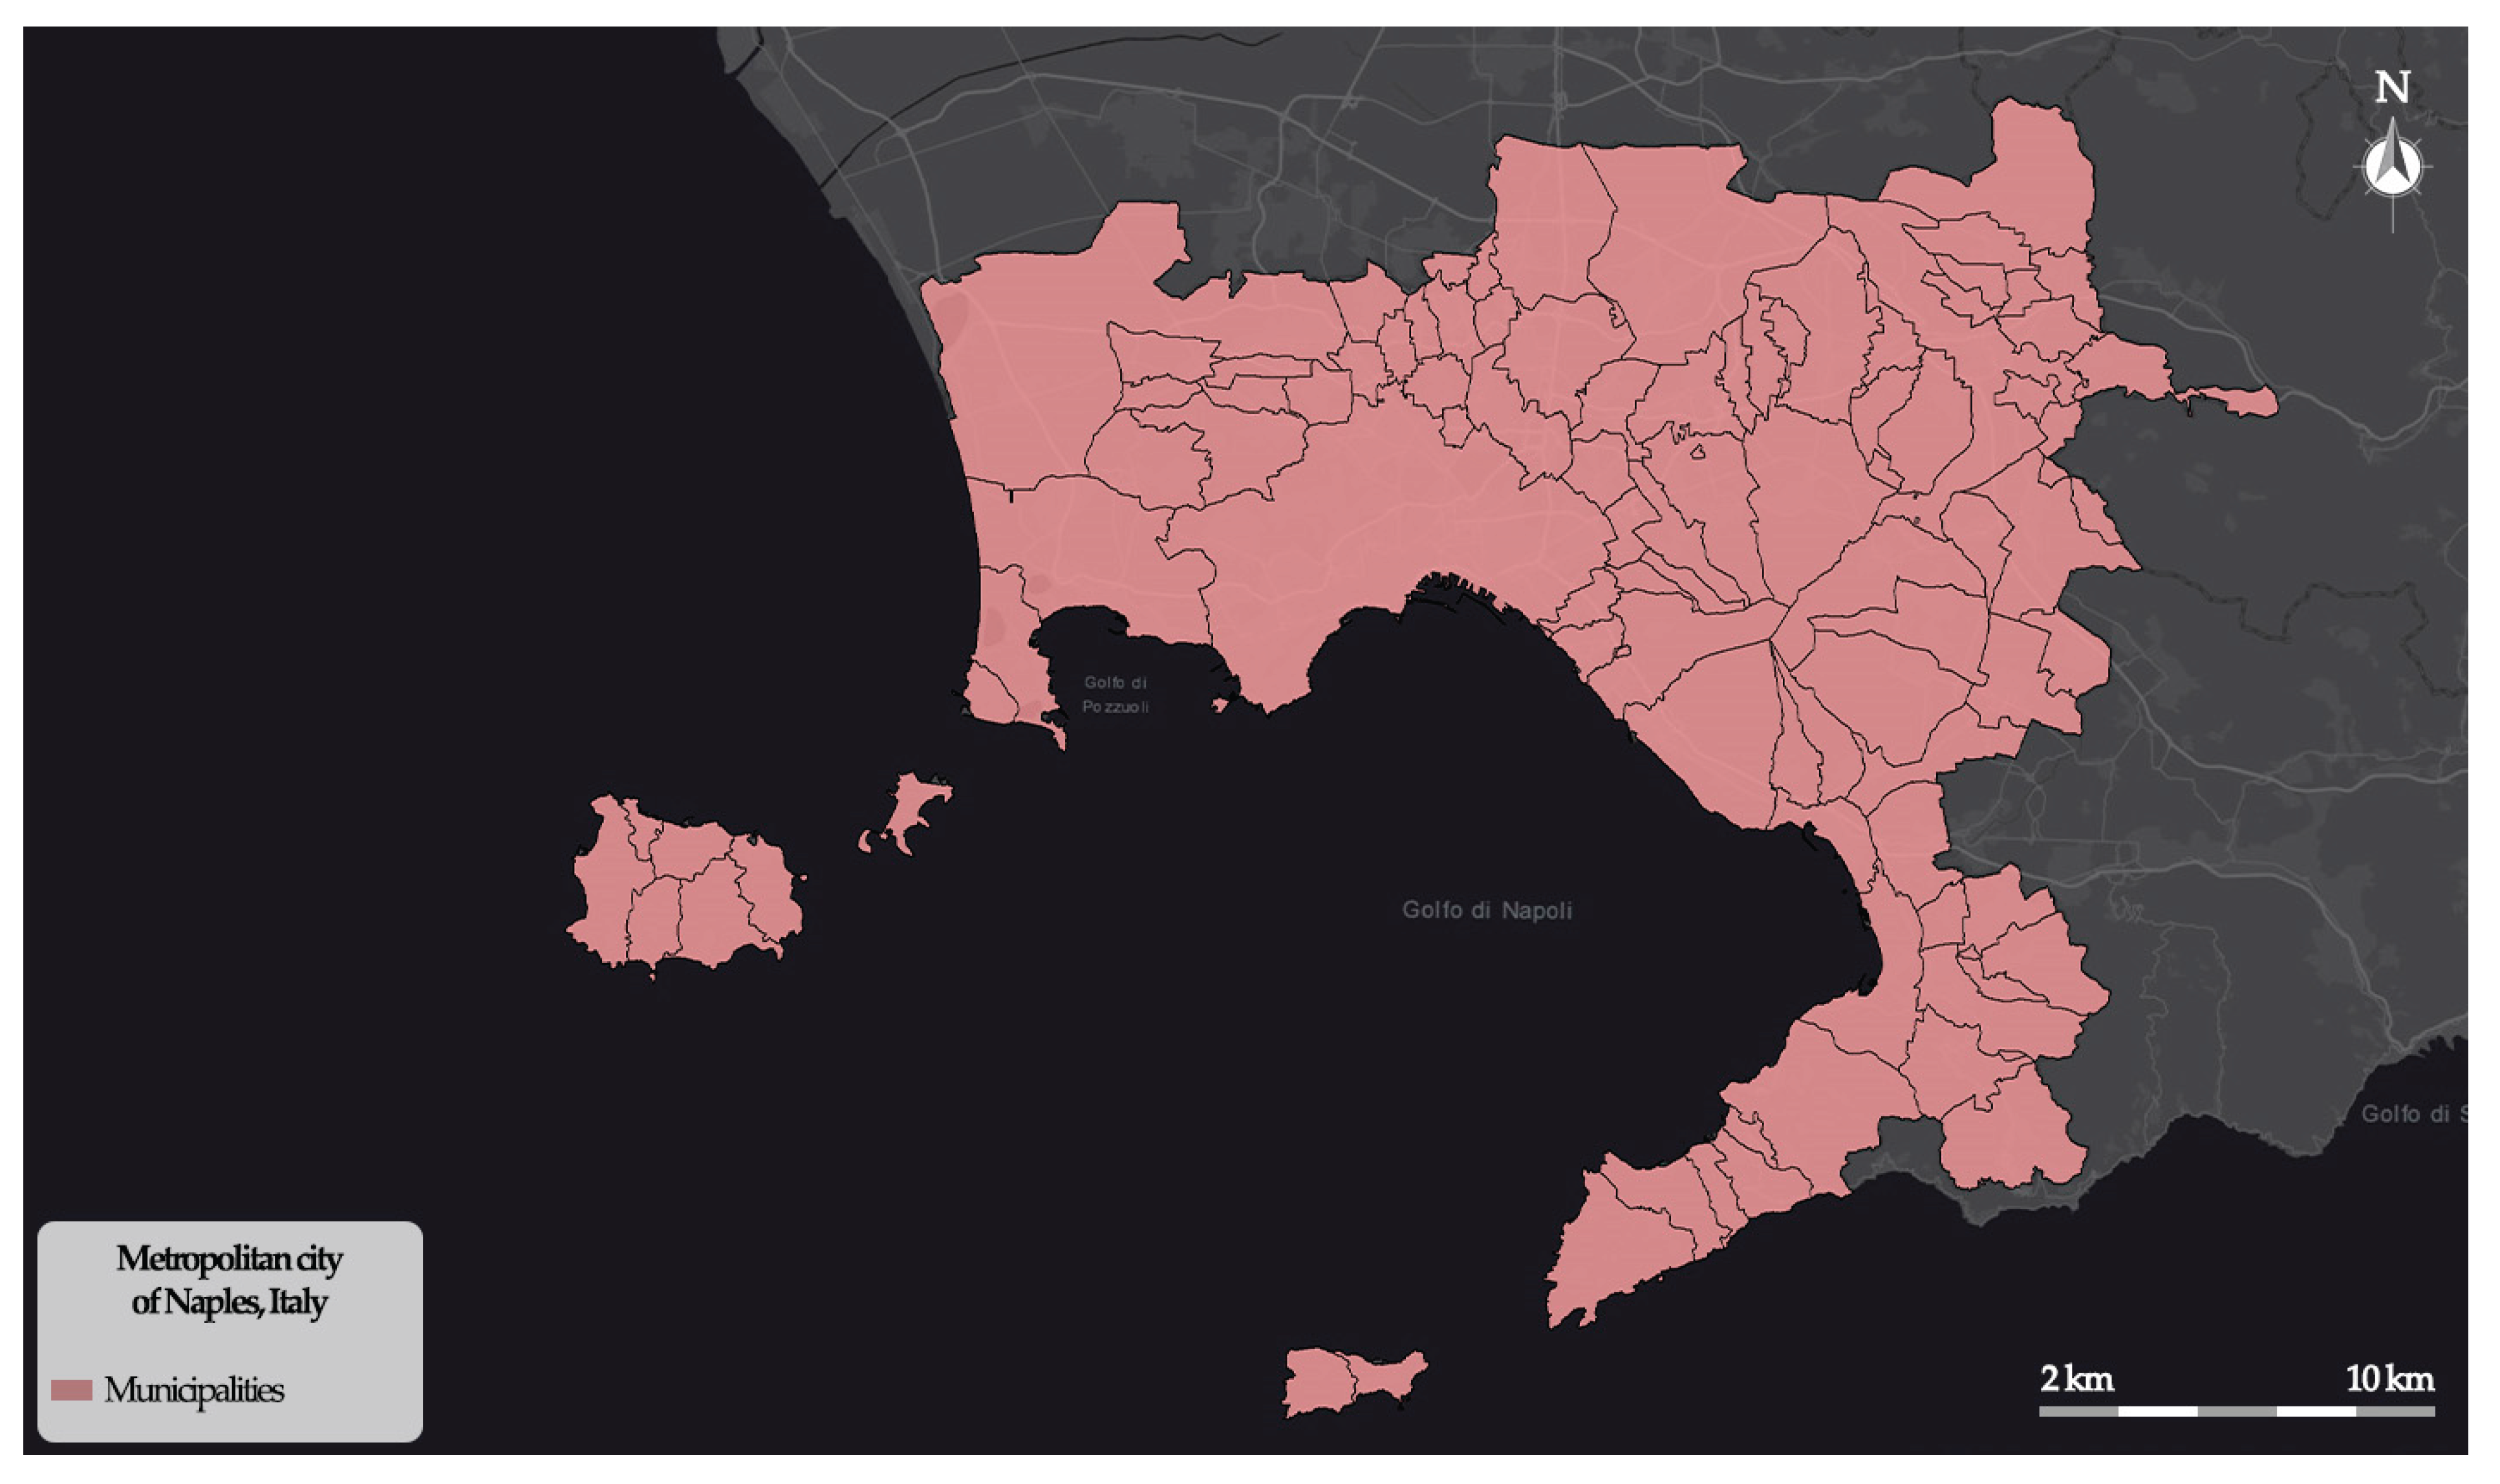
The subzones of the study area are represented by municipalities with different urban and socio-demographic characteristics. The municipalities located in the vicinity north and east of the city of Naples are more densely populated and have a higher density of built-up areas than the island municipalities and coastal municipalities further from the city.
The data used in the experimental tests, aggregated by municipality, include:
- census data provided by the Italian Institute of Statistics (ISTAT), aggregated by census zone and municipality;
- remote-sensed LST dataset with a resolution of 30 x 30 m, obtained by Landsat multispectral imaging on a heatwave scenario of 12 days occurred between 31/07/2022 and 11/08/2022;
- remote-sensed NDVI dataset with a resolution of 10 x 10 m, obtained by Landsat multispectral imaging on a heatwave scenario of 12 days occurred between 31/07/2022 and 11/08/2022.
All data were aggregated by municipality to determine the index values at the leaf nodes for each subzone.
The framework was implemented in the suite ESRI ArcGIS Pro 3.5 using the ESRI ArcPy Python 2.4 libraries.
The fuzzy numbers assigned to the leaf nodes by the expert consist of L-functions and R-functions. Table 11 specifies the fuzzy numbers defined for each leaf node.
In Figure 6 the thematic map of the impact during the heatwave scenario is shown.
The map shows the distribution of heatwave impacts, classifying them into three levels: High, Medium, and Low. Areas with a High impact level are concentrated around the municipality of Naples, especially in the northern part. Further high levels of impact are found in the southern area around the municipalities of Castellammare di Stabia and Torre Annunziata, two large, densely populated cities with a compact building fabric and a scarcity of green areas. The northeastern municipalities respond better thanks to the high quantity of green areas and low building and population density.
In Figure 7 the thematic map of the impact during the pandemic scenario is shown.
The map shows the distribution of pandemic impacts, classifying them into three levels: High, Medium, and Low. Compared to the heatwave scenario, the pandemic one highlights a general increase in heatwave impacts. This increase mainly affects municipalities located in the northern part of the Naples metropolitan area, within the denser urban continuum surrounding the city, as well as other compact urban centers in the southern part of the study area. These municipalities are characterized by high population density and high building density, conditions that tend to exacerbate heat-related impacts.
Municipalities with lower population density and a greater presence of vegetated or permeable areas show more stable impact levels in the two scenarios, indicating a greater ability to mitigate the effects of heatwaves even under pandemic conditions.
Table 12 lists the municipalities most affected by both phenomena.
As can be seen from the results, the 10 municipalities with the highest heatwave impact values all have pandemic impact values above 0.40. In these municipalities, which were already the most critical in a normal scenario, the intensification of critical factors in the pandemic scenario produces a further increase in the impacts on residents' health.
Figure 8 shows the criticality increase map, obtained by the criticality comparison process.
As for the previous outputs, the results are classified into three levels: High, Medium, and Low increase. Municipalities that already had high values during the heatwave scenario show a limited relative increase under pandemic conditions. In these areas, exposure and vulnerability levels are already high, and the pandemic scenario causes a marginal amplification of pre-existing critical conditions. Conversely, the highest increases in criticality are observed in municipalities that had medium or low impact levels in the normal heatwave scenario. With the pandemic, they appear to be affected by a significant reconfiguration of the conditions of exposure and vulnerability. Although their absolute criticality values remain lower than those of the most affected municipalities, the relative increase is significant and demonstrates how sensitive these municipalities are to the effects of the pandemic.
4. Conclusions and Future Works
The proposed framework has demonstrated its effectiveness in assessing and spatially representing the health impacts of heatwaves in complex urban contexts, both under ordinary conditions and in pandemic emergency scenarios. Its application to the metropolitan area of Naples, characterized by pronounced urban and socio-demographic heterogeneity, made it possible to identify clear territorial patterns that are consistent with the physical and settlement characteristics of individual municipalities.
The results show that the highest heatwave impacts are strongly correlated with high population density, compact urban fabric, and limited availability of vegetated surfaces. Municipalities belonging to the central and peri-urban continuum of Naples systematically exhibit higher criticality, confirming the role of intense urbanization as an amplifying factor of vulnerability to extreme heat. Conversely, municipalities with a greater presence of green areas and lower building density display a higher capacity to mitigate impacts, even under extreme climatic conditions.
The analysis of criticality increase provides further interpretative insights. In municipalities that were already highly critical under the baseline heatwave scenario, the pandemic results in a limited relative increase, as risk conditions are structurally elevated. In contrast, the largest relative increases are observed in municipalities that, under normal conditions, exhibited medium or low impact levels. This finding highlights how the pandemic can significantly alter the balance of exposure and vulnerability factors, abruptly increasing the fragility of territories that appear less critical under ordinary circumstances.
Overall, the framework is confirmed as a flexible and robust tool to support spatial planning and public health prevention policies, enabling the identification of both structurally vulnerable areas and those that are particularly sensitive to concurrent crisis scenarios.
Future developments may include the integration of dynamic data, such as mobility flows, time-dependent health data (e.g., hospital admissions and mortality), and updated socio-economic indicators, in order to enhance the framework’s sensitivity to temporal variability and rapidly evolving emergency conditions.
Finally, the results suggest the need to strengthen nature-based adaptation policies, such as increasing green infrastructure and permeable surfaces, particularly in municipalities that exhibited marked increases in criticality under the pandemic scenario. In this perspective, the framework could evolve into a decision-support tool for the ex-ante evaluation of the effects of urban planning interventions and climate mitigation strategies on public health.
A further line of research concerns the extension of the model to other combined risk scenarios, such as the co-occurrence of heatwaves with air pollution events or energy blackouts, which are increasingly frequent in the context of climate change. Moreover, applying the framework to other metropolitan areas would allow its transferability to be assessed and enable comparisons among different patterns of urbanization and territorial resilience.
Author Contributions
Conceptualization, R.C., B.C., F.D.M., C.M. and V.M.; methodology, R.C., B.C., F.D.M., C.M. and V.M.; software, R.C., B.C., F.D.M., C.M. and V.M.; validation, R.C., B.C., F.D.M., C.M. and V.M.; formal analysis, R.C., B.C., F.D.M., C.M. and V.M.; investigation, R.C., B.C., F.D.M., C.M. and V.M.; resources, R.C., B.C., F.D.M., C.M. and V.M.; data curation, R.C., B.C., F.D.M., C.M. and V.M.; writing—original draft preparation, R.C., B.C., F.D.M., C.M. and V.M.; writing—review and editing, R.C., B.C., F.D.M., C.M. and V.M.; visualization, R.C., B.C., F.D.M., C.M. and V.M.; supervision, B.C., F.D.M. and V.M. All authors have read and agreed to the published version of the manuscript.
Funding
This research received no external funding.
Institutional Review Board Statement
Not applicable.
Informed Consent Statement
Not applicable.
Data Availability Statement
Data sharing not applicable.
Conflicts of Interest
The authors declare no conflict of interest.
References
- Huang, H.; Lu, Z.; Fan, X.; Zhai, W.; Zhang, L.; Xu, D.; Liu, Z.; Li, Y.; Ye, X.; Qin, H.; Lanza, K.; Han, Y. Urban heatwave, green spaces, and mental health: A review based on environmental health risk assessment framework. Science of The Total Environment 2024, 948, 174816. [CrossRef]
- Xu, C.; Wei, R.; Tong, H. A Systematic Review of Methodological Advances in Urban Heatwave Risk Assessment: Integrating Multi-Source Data and Hybrid Weighting Methods. Sustainability 2025, 17, 3747. [CrossRef]
- Serkendiz, H. Mapping Heatwave Vulnerability: Multidimensional Assessment of Heatwave Vulnerability from an Environmental and Socioeconomic Perspective. Natural Hazard Reviews 2024, 27, 1, 05025016. [CrossRef]
- Amaripadath, D.; Levinson R.; Rawal, R.; Attia S. Multi-criteria decision support framework for climate change-sensitive thermal comfort evaluation in European buildings. Energy and Buildings 2024, 303, 113804. [CrossRef]
- Sow, M.; Gaye, D. Categorization and multi-criteria analysis of heat wave vulnerability in Senegal. Journal of Water and Climate Change 2024, 15 (11): 5382–5396. [CrossRef]
- Li, Z.; Fa, Y.; Xu, Z.; Ho, H., C., Tong, S.; Huang, C.; Bai, Z.; Gay, Y.; Cheng, W.; et al. Exceptional heatwaves and mortality in Europe: Greater impacts since the coronavirus disease 2019 outbreak. Environmental Pollution 2024, 363 (Part. 1), 125058. [CrossRef]
- Taherdoost, H. & Madanchian, M. Multi-criteria decision making (MCDM) methods and concepts. Encyclopedia 2023, 3(1), 77-87. [CrossRef]
- Khan, AI; Ghamdi, AL; Alsolami, ASAM; Abushark, FJ; Almalawi, YB; Ali, A et al. Integrating blockchain technology into health care through an intelligent computing technique. CMC-Comput Mater Contin 2022, 70:2835–2860.
- Kumar, R.; Mishra, S.K. Assessing the impact of heat vulnerability on urban public spaces using a fuzzy-based unified computational technique. AI & Society, 2025, 40, 787-804. [CrossRef]
- Cheng, Y; Liu, X; Zeng, Z; Liu, S; Wang, Z; Tang, X; He, BJ, Impacts of water bodies on microclimates and outdoor thermal comfort: implications for sustainable rural revitalization. Meta-Scenario Comput Soc-Geogr Sustain, 2023, 16648714:204.
- Ahmed, F.; Kilic, K. Fuzzy Analytic Hierarchy Process: A performance analysis of various algorithms. Fuzzy Sets and Systems 2019, 362, 110-128. [CrossRef]
- Chang, D.Y. Applications of the extent analysis method on fuzzy AHP Eur. J. Oper. Res. 1996, 95 (3) 649-655. [CrossRef]
- Nădăban, S.; Dzitac, S.; Dzitac, I. Fuzzy TOPSIS: A General View. Procedia Computer Science 2016, 91, 823-831. [CrossRef]
- Jong, F. C.; Ahmed, M. M. Novel GIS-based fuzzy TOPSIS and filtration algorithms for extra-large scale optimal solar energy sites identification Solar Energy 2024, 268, 112274 . [CrossRef]
- Bae, H.-J.; Kang, J.E.; Lim, Y.-R. Assessing the Health Vulnerability Caused by Climate and Air Pollution in Korea Using the Fuzzy TOPSIS. Sustainability 2019, 11, 2894. [CrossRef]
- Ćesić, M.; Rogulj, K.; Kilić Pamuković, J.; Krtalić, A. A Systematic Review on Fuzzy Decision Support Systems and Multi-Criteria Analysis in Urban Heat Island Management. Energies 2024, 17, 2013. [CrossRef]
- Cardone, B., Di Martino, F.; Miragia V. GIS-based hierarchical fuzzy MCDA framework for detecting critical urban areas in climate scenarios. Computational Science and Its Applications – ICCSA 2023 Workshops, Lecture Notes in Computer Science, Springer Nature, Switzerland, vol. 14108, pp. 345-358. [CrossRef]
- Cardone, B.; Di Martino, F. GIS-based hierarchical fuzzy multicriteria decision-making method for urban planning. Journal of Ambient Intelligence and Humanizing Computing 2021, 12, 601–615. [CrossRef]
- Saaty, T. L.; Kearns, K.P. Analytical Planning: the Organization of System, Pergamon Press, Oxford (UK), International series in modern applied mathematics and computer sciences 2014, vol. 7, 205 pp. [CrossRef]
- Kuo, T.; Chen, M-H. On using pairwise comparison in the analytic hierarchy process: Validity is goal while consistency is means. Information Sciences 2023, 648, 119630. [CrossRef]
- Cardone, B.; D’Ambrosio, V.; Di Martino, F.; Miraglia, V. Hierarchical Fuzzy MCDA Multi-Risk Model for Detecting Critical Urban Areas in Climate Scenarios. Appl. Sci. 2024, 14, 3066. [CrossRef]
- Arefiev, N.; Terleev, V.; Badenko, V. GIS-based Fuzzy Method for Urban Planning. Procedia Engineering 2015, 117,39–44. [CrossRef]
- Dubois, D.; Prade, H. Fuzzy Numbers, An overview. Readings in Fuzzy Sets for Intelligent Systems 1993, 112-148. [CrossRef]
Figure 2.
Fuzzy sets assigned to the leaf sub-criteria High employment rate (a), Low crime rate (b) and Medium per capita income (c).
Figure 2.
Fuzzy sets assigned to the leaf sub-criteria High employment rate (a), Low crime rate (b) and Medium per capita income (c).
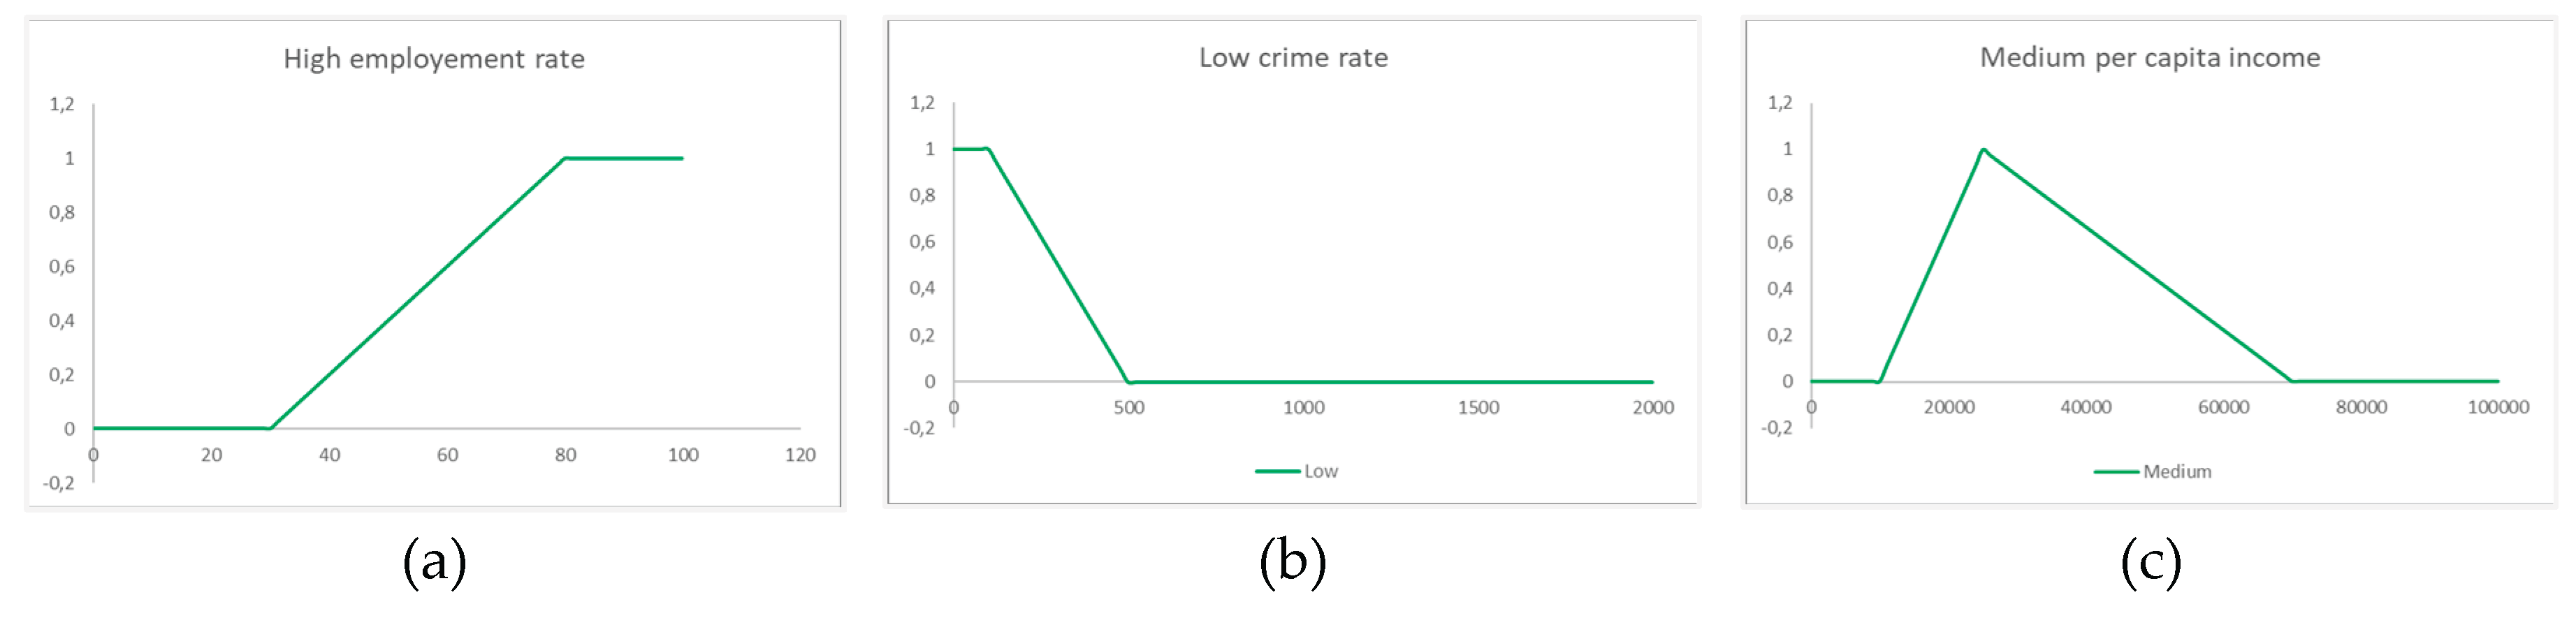
Figure 3.
Flow diagram of the proposed framework.
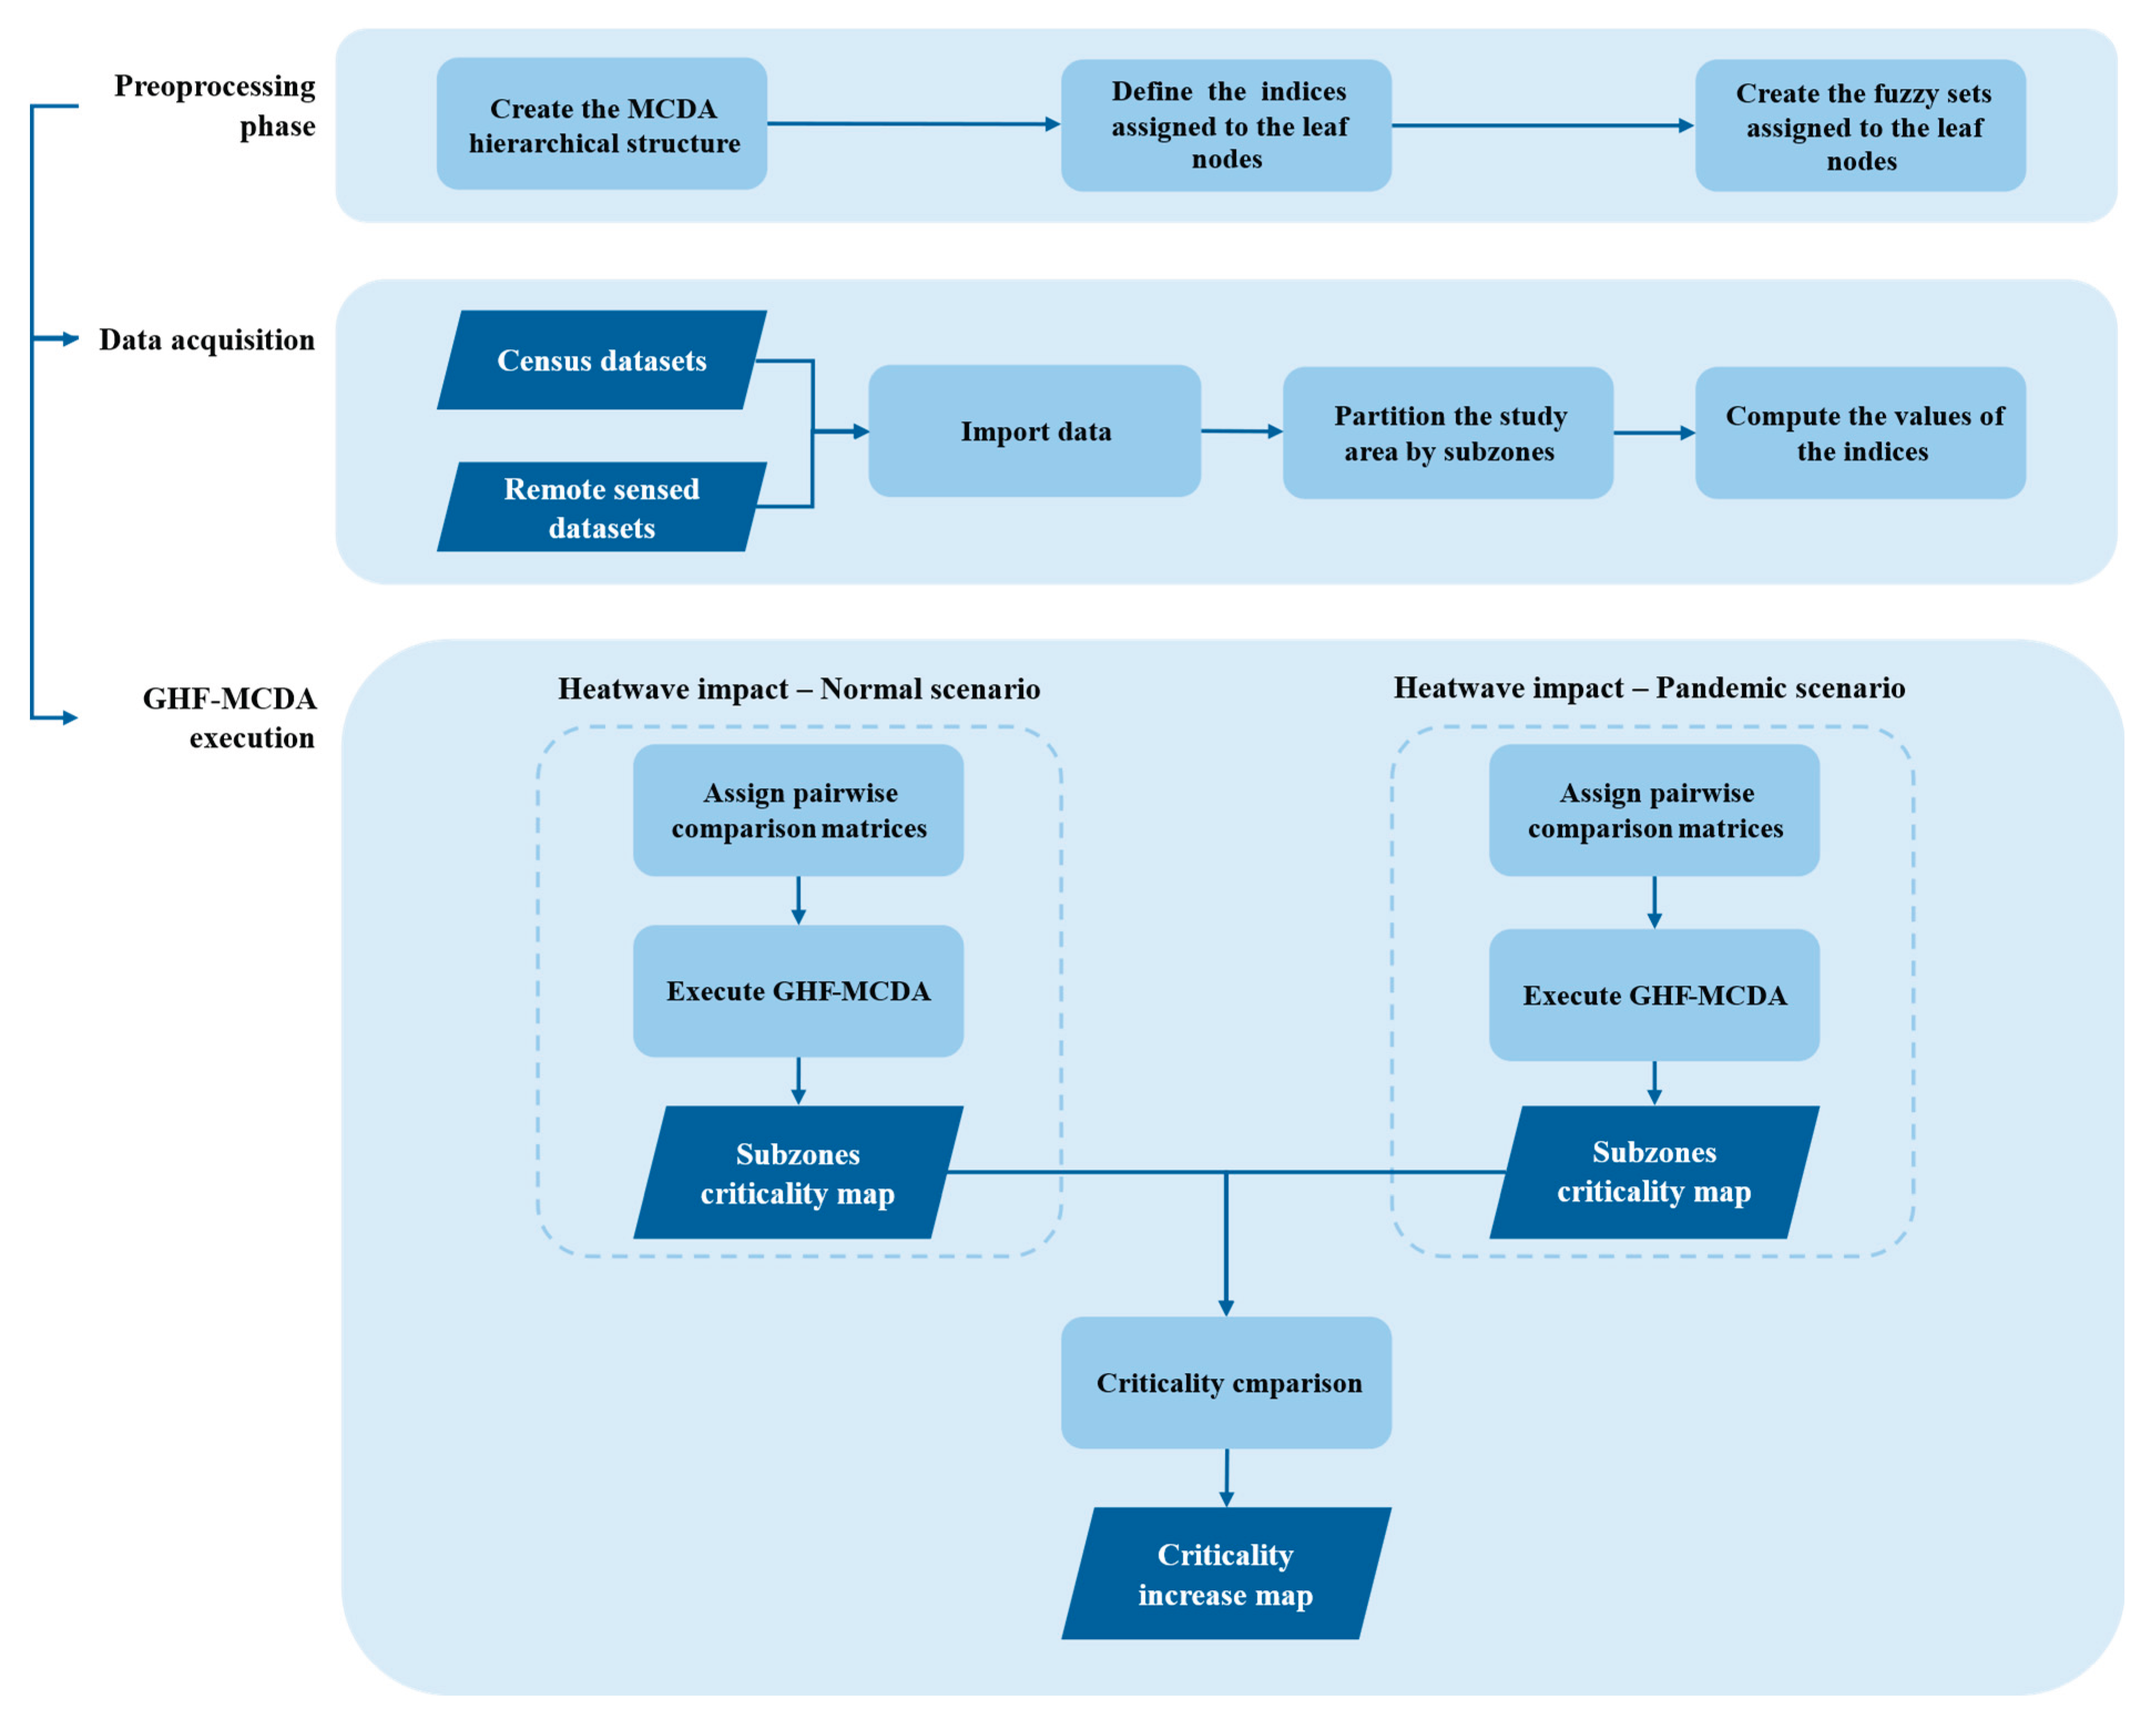
Figure 6.
Thematic map of heatwave normal impact scenario.
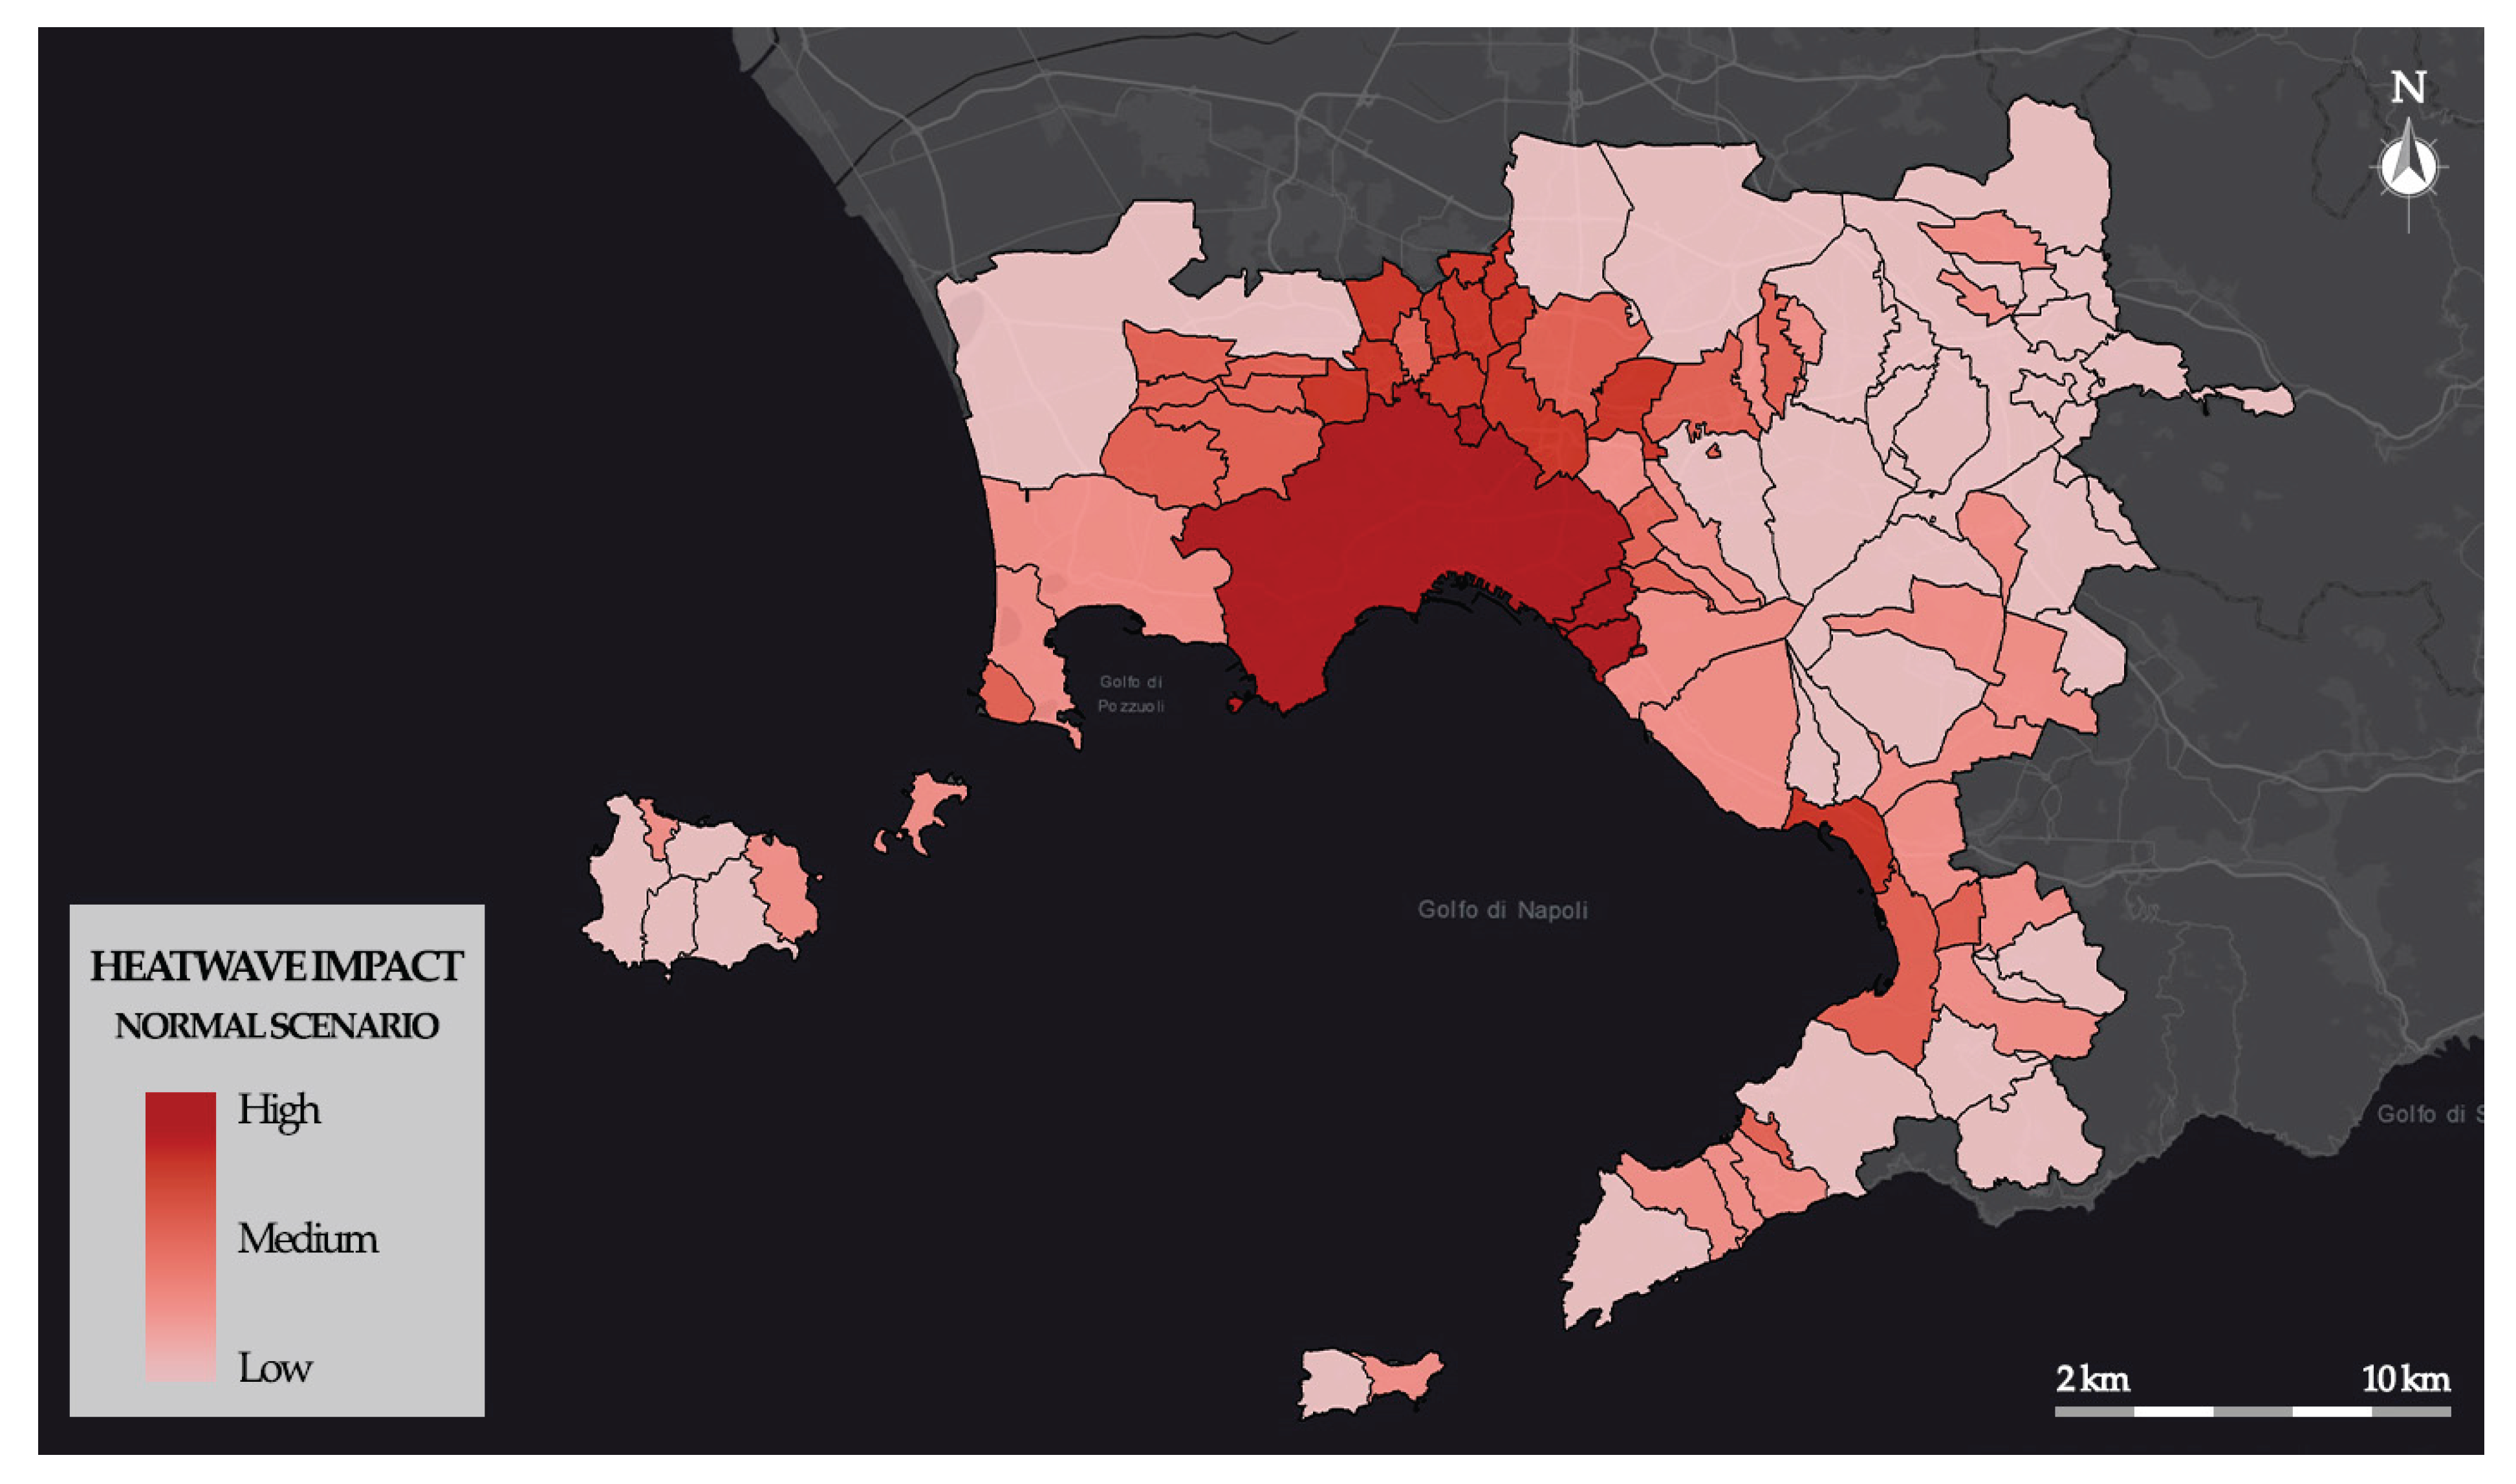
Figure 7.
Thematic map of heatwave pandemic impact scenario.
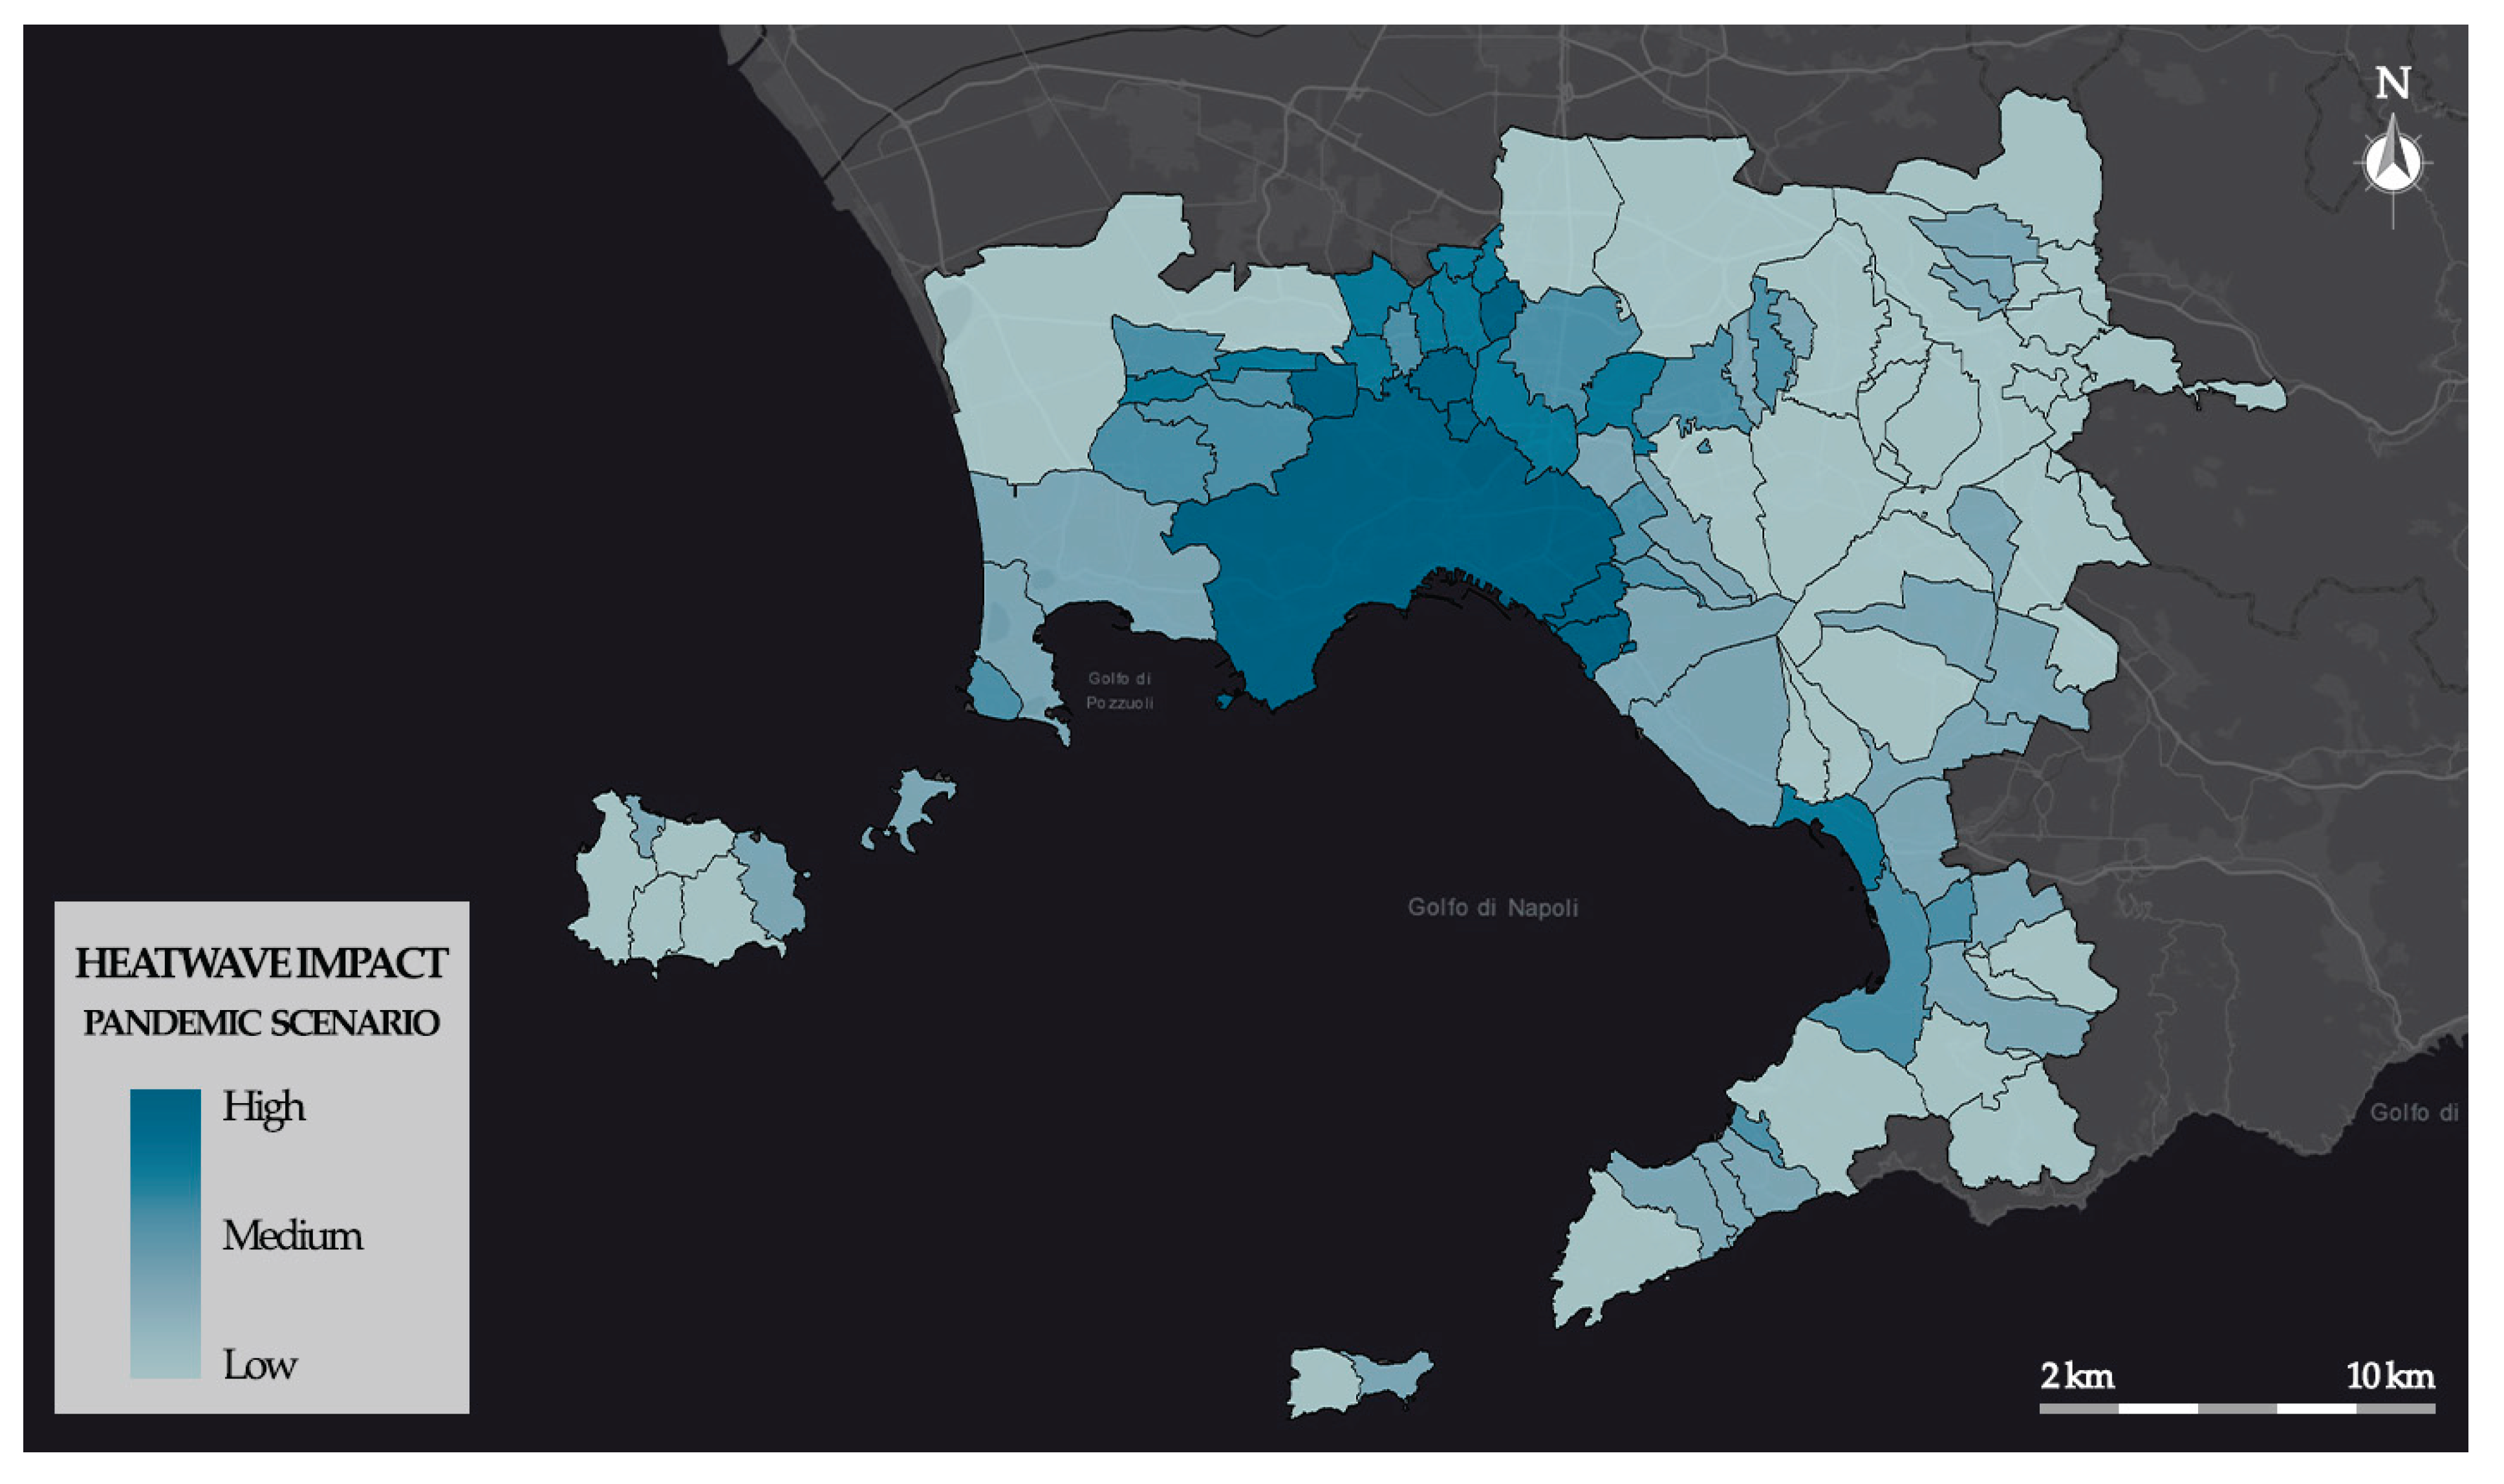
Figure 8.
Thematic map of criticality increase.
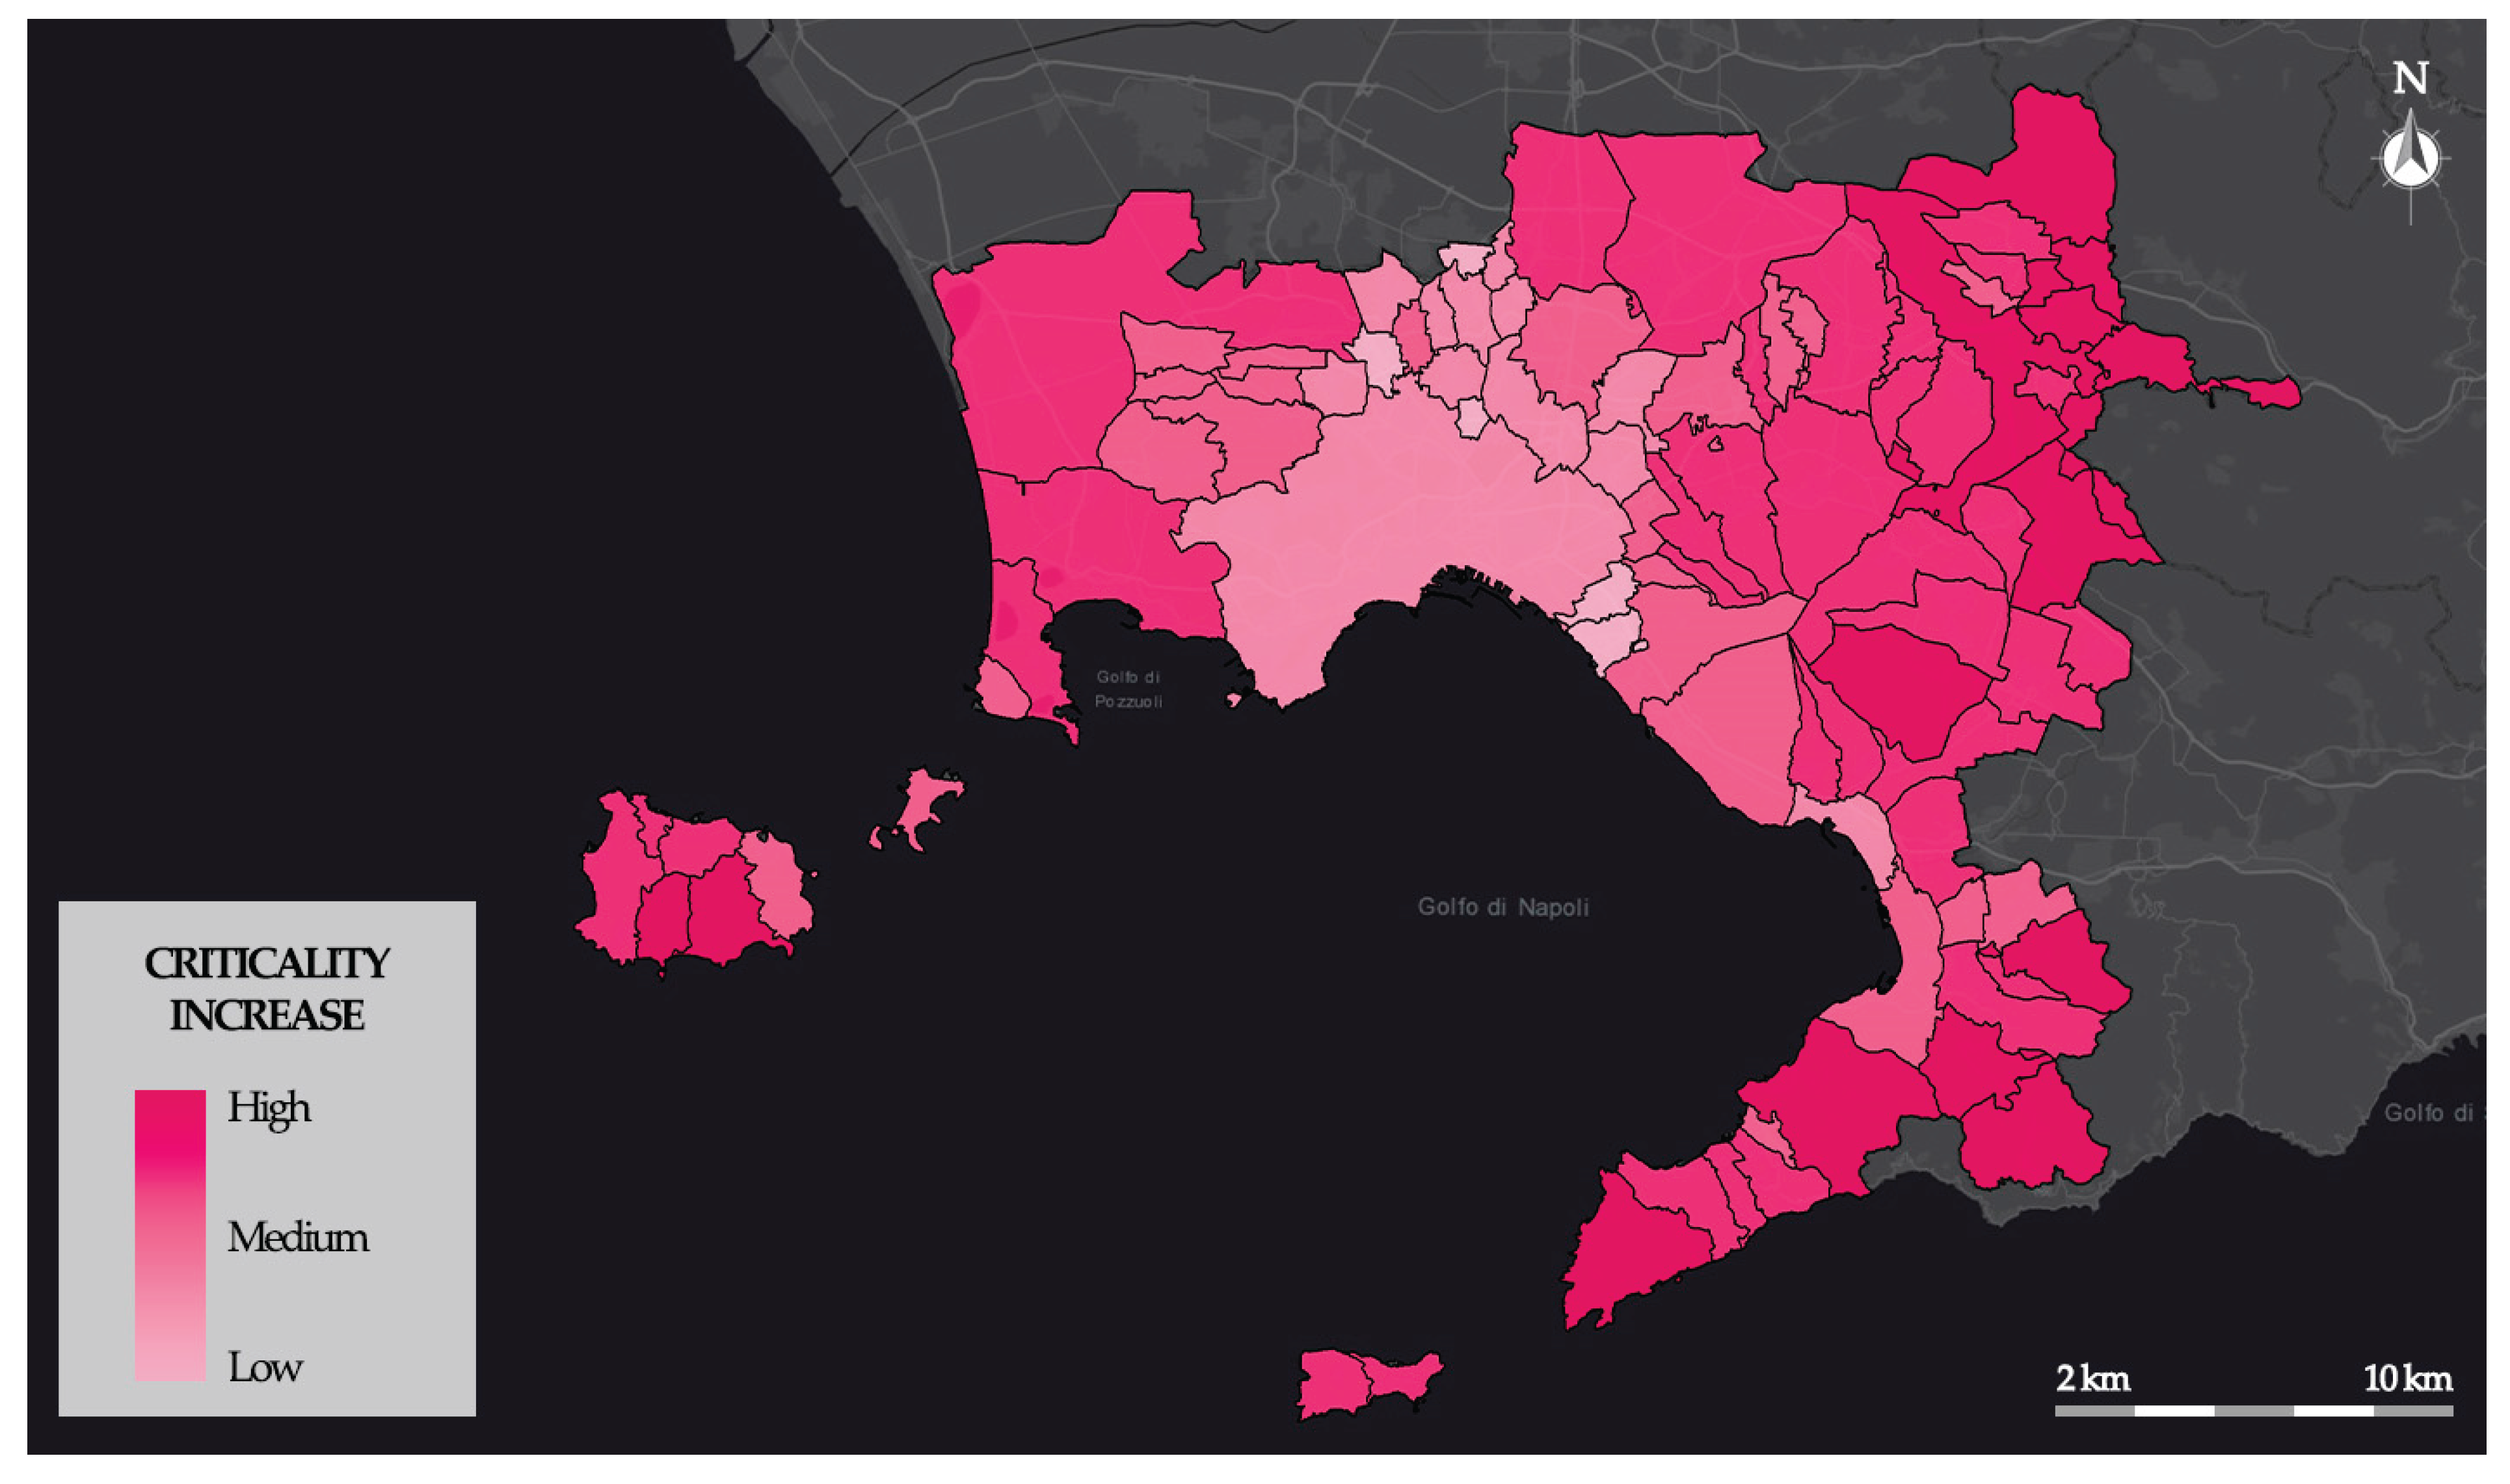
Table 1.
Values of the Saaty’s pairwise comparison matrix.
| Relevance of rk on rj | bkj | Relevance of rk on rj | bkj |
| Equally important | 1 | Equally important | 1 |
| Equally or slightly more important | 2 | Equally or slightly less important | ½ |
| Slightly more important | 3 | Slightly less important | 1/3 |
| Slightly to much more important | 4 | Slightly to way less important | ¼ |
| Much more important | 5 | Way less important | 1/5 |
| Much to far more important | 6 | Way to far less important | 1/6 |
| Far more important | 7 | Far less important | 1/7 |
| Far more important to extremely more important | 8 | Far less important to extremely less important | 1/8 |
| Extremely more important | 9 | Extremely less important | 1/9 |
Table 8.
Pairwise comparison matrix of the radix criterion Exposure in a pandemic scenario.
| High population number | Small residential housing area per inhabitant | |
| High population density | 1 | 1/2 |
| Small residential housing area per inhabitant | 2 | 1 |
Table 9.
Pairwise comparison matrix of the radix criterion Vulnerability in a pandemic scenario.
| Residential building vulnerability | Open space vulnerability | Social vulnerability | |
| Residential building vulnerability | 1 | 2 | 1/2 |
| Open spaces vulnerability | 1/2 | 1 | 1/3 |
| Social vulnerability | 1 | 3 | 2 |
Table 10.
Pairwise comparison matrix of the radix criterion Social vulnerability in a pandemic scenario.
Table 10.
Pairwise comparison matrix of the radix criterion Social vulnerability in a pandemic scenario.
| High percent of vulnerable residents | High unemployment rate | High number of family members | |
| High percent of vulnerable residents | 1 | 4 | 4 |
| High unemployment rate | 1/4 | 1 | 1 |
| High number of family members | 1/4 | 1/4 | 1 |
Table 11.
Fuzzy numbers assigned at the leaf nodes.
| Fuzzy set | Type | α | β | |
| High percent of vulnerable residents | L-function | 0,1 | 0,3 | |
| High unemployment rate | L-function | 0,04 | 0,2 | |
| High number of family members | L-function | 2 | 3 | |
| Low cover of healthy vegetation | R-function | 0,1 | 1 | |
| High cover of waterproof open spaces | L-function | 0,01 | 0,5 | |
| High density of old buildings | L-function | 10 | 200 | |
| High density of reinforced concrete buildings | L-function | 10 | 200 | |
| Small residential housing area per inhabitant | R-function | 1 | 130 | |
| High population density | L-function | 100 | 15000 | |
| High LST coverage | L-function | 30 | 50 |
Table 12.
The most impacted municipalities.
| Municipality | HeatwaveImpact – normal scenario | Pandemic Impact– pandemic scenario |
| San Giorgio a Cremano | 0.637 | 0.733 |
| Casavatore | 0.578 | 0.595 |
| Portici | 0.454 | 0.529 |
| Napoli | 0.443 | 0.549 |
| Cardito | 0.378 | 0.480 |
| Arzano | 0.378 | 0.480 |
| Mugnano di Napoli | 0.375 | 0.477 |
| Melito di Napoli | 0.357 | 0.445 |
| Casalnuovo di Napoli | 0.328 | 0.424 |
| Grumo Nevano | 0.327 | 0.424 |
Disclaimer/Publisher’s Note: The statements, opinions and data contained in all publications are solely those of the individual author(s) and contributor(s) and not of MDPI and/or the editor(s). MDPI and/or the editor(s) disclaim responsibility for any injury to people or property resulting from any ideas, methods, instructions or products referred to in the content. |
© 2025 by the authors. Licensee MDPI, Basel, Switzerland. This article is an open access article distributed under the terms and conditions of the Creative Commons Attribution (CC BY) license (http://creativecommons.org/licenses/by/4.0/).
Copyright: This open access article is published under a Creative Commons CC BY 4.0 license, which permit the free download, distribution, and reuse, provided that the author and preprint are cited in any reuse.


